Effects of light and temperature on Mg uptake, growth, and calcification in the proxy climate archive Clathromorphum compactum - Biogeosciences

Page created by Megan Manning
 
CONTINUE READING
Effects of light and temperature on Mg uptake, growth, and calcification in the proxy climate archive Clathromorphum compactum - Biogeosciences
Biogeosciences, 15, 5745–5759, 2018
https://doi.org/10.5194/bg-15-5745-2018
© Author(s) 2018. This work is distributed under
the Creative Commons Attribution 4.0 License.

Effects of light and temperature on Mg uptake, growth,
and calcification in the proxy climate archive
Clathromorphum compactum
Siobhan Williams1 , Walter Adey2 , Jochen Halfar1 , Andreas Kronz3 , Patrick Gagnon4 , David Bélanger4 , and
Merinda Nash2
1 Department of Chemical and Physical Sciences, University of Toronto at Mississauga, Mississauga, L5L 1C6, Canada
2 Department of Botany, National Museum of Natural History, Smithsonian Institution, Washington, DC 20560, USA
3 Geowissenschaftliches Zentrum, Universität Göttingen, 37077 Göttingen, Germany
4 Ocean Sciences Centre, Memorial University of Newfoundland, St. John’s, A1C 5S7, Canada

Correspondence: Siobhan Williams (siobhan.williams@mail.utoronto.ca)

Received: 14 March 2018 – Discussion started: 24 May 2018
Revised: 14 August 2018 – Accepted: 27 August 2018 – Published: 1 October 2018

Abstract. The shallow-marine benthic coralline alga                crease from low-light (mean = 17 lx) to high-light conditions
Clathromorphum compactum is an important annual- to                (mean = 450 lx). At higher (10 ◦ C) temperature there was a
sub-annual-resolution archive of Arctic and subarctic envi-        1.8 mol % MgCO3 increase from low to high light. It is there-
ronmental conditions, allowing reconstructions going back          fore concluded that site- and possibly specimen-specific tem-
> 600 years. Both Mg content, in the high-Mg calcitic cell         perature calibrations must be applied, to account for effects
walls, and annual algal growth increments have been used           of light when generating Clathromorphum-derived tempera-
as a proxy for past temperatures and sea ice conditions.           ture calibrations.
The process of calcification in coralline algae has been de-
bated widely, with no definitive conclusion about the role of
light and photosynthesis in growth and calcification. Light
received by algal specimens can vary with latitude, water          1   Introduction
depth, sea ice conditions, water turbidity, and shading. Fur-
thermore, field calibration studies of Clathromorphum sp.          The coralline alga Clathromorphum compactum exhibits
have yielded geographically disparate correlations between         well-defined annual growth increments and often produces
MgCO3 and sea surface temperature. The influence of other          seasonal conceptacles (seasonal autumn/winter reproductive
environmental controls, such as light, on Mg uptake and            structures) within those increments (Adey and Hayek, 2011;
calcification has received little attention. We present results    Halfar et al., 2008). The ovoid conceptacles are embed-
from an 11-month mesocosm experiment in which 123 wild-            ded within a considerably larger vegetative matrix consist-
collected C. compactum specimens were grown in conditions          ing of a plethora of tissues (Adey, 1965; Adey et al., 2013)
simulating their natural habitat. Specimens grown for periods      within calcified cell walls. The calcified cell walls addition-
of 1 and 2 months in complete darkness show that the typi-         ally show a variety of well-defined micro-structures in their
cal complex of anatomy and cell wall calcification develops        high-magnesium calcitic skeleton (Adey et al., 2005; Nash
in new tissue without the presence of light, demonstrating         and Adey, 2017, 2018). Owing to C. compactum longevity,
that calcification is metabolically driven and not a side effect   multicentennial chronologies that have the potential to pro-
of photosynthesis. Also, we show that both light and tem-          vide data necessary for accurately calibrating climate mod-
perature significantly affect MgCO3 in C. compactum cell           els have been constructed (Adey, 1965; Adey et al., 2015a,
walls. For specimens grown at low temperature (2 ◦ C), the         b; Halfar et al., 2013). C. compactum grows in subarctic to
effects of light are smaller, with a 1.4 mol % MgCO3 in-           high-Arctic oceans in the benthic mid photic zone, and its

Published by Copernicus Publications on behalf of the European Geosciences Union.
Effects of light and temperature on Mg uptake, growth, and calcification in the proxy climate archive Clathromorphum compactum - Biogeosciences
5746                                       S. Williams et al.: Effects of light and temperature on Mg uptake, growth, and calcification

            Epithallium                                                                   Skeletal elemental composition (Mg / Ca) of Clathromor-
 a                                              b                        Epithallium
                                                                                       phum sp. has been shown to correspond to temperature con-
                                                                                       trols (Gamboa et al., 2010; Halfar et al., 2008; Hetzinger et
                                   Meristem
                      Empty                                                            al., 2018; Williams et al., 2018) and displays seasonal cyclic-
                      conceptacle
                      s
                                                                   Meristem            ity (Adey et al., 2013). However, there is evidence that light is
 Tissue                          Perithallium                                          also influencing Mg incorporation (Moberly, 1968). For ex-
                                                    Perithallium
 refilling old
 conceptacle 600 µm           1 mm                                       150 µm        ample, in the Newfoundland shallow benthos, C. compactum
 s                                                                                     Mg / Ca ratios begin to increase in the spring before temper-
                                                                                       atures increased from the winter lows (Gamboa et al., 2010).
Figure 1. (a) Cross section of C. compactum mound indicating ma-
jor skeletal features. (b) Close-up of meristem, epithallium, and
                                                                                       In addition, several studies have noted inter-sample variabil-
perithallium cells.                                                                    ity in Mg / Ca (e.g. Chan et al., 2011) and published Clathro-
                                                                                       morphum sp. Mg / Ca – temperature calibrations have been
                                                                                       site specific (Hetzinger et al., 2009, 2018; Williams et al.,
distribution becomes severely limited at temperatures above                            2014). It has been hypothesized that, because algae collected
11–13 ◦ C (Adey, 1965).                                                                at the same site are experiencing similar temperatures, inter-
   The precise mode of calcification in coralline algae has                            sample variability may be caused by differences in shading or
been long debated (Adey, 1998; Nash et al., 2018), and the                             orientation relative to the sea surface (Williams et al., 2014).
role of photosynthesis in influencing calcification has not yet                        Differences among calibrations might also result from col-
been fully established. The shape of Mg content curves from                            lections at different depths or different water clarity between
subarctic/Arctic Clathromorphum sp. suggests that they con-                            sites of similar depths.
tinue to grow and calcify for at least part of the winter in                              There is also evidence for the influence of light and tem-
darkness at −1.8 ◦ C (Halfar et al., 2013). A recent model                             perature on growth rates of coralline algae. Adey (1970)
of coralline calcification (Nash and Adey, 2017) shows fi-                             demonstrated that growth of many Boreal–subarctic coralline
brous cellulosic extrusions from the cell membranes into the                           algal genera exhibited a strong relationship with light at high
cell wall environment that provide molecular initiation cen-                           temperatures and a weak relationship with light at low tem-
tres for calcium and magnesium, but it does not demonstrate                            peratures. These patterns suggest growth is limited by photo-
a process for cellular injection of Ca and Mg. Their model                             synthesis in water temperatures above 4–5 ◦ C, while respira-
indicates Mg control by temperature in a complex subset of                             tion and other growth processes likely limit growth at lower
calcification modes but does not include a light component                             temperatures (Adey, 1970). Similarly, Halfar et al. (2011a)
(other than as a basic photosynthetic requirement).                                    found a positive correlation between water temperature and
   Production of C. compactum’s high-magnesium calcite                                 Clathromorphum sp. growth increment width in the North
skeleton occurs in an intercalary meristem (as in the cam-                             Atlantic where winter sea surface temperatures (SSTs) are
bium of higher plants) and is concurrent with cellular and                             below 0 ◦ C, whereas Clathromorphum sp. growth in the
tissue growth (Fig. 1). The intercalary meristem, in addi-                             Bering Sea (winter SST > 3 ◦ C) was unrelated to temperature
tion to producing perithallium, the primary body of the cal-                           yet was positively correlated with light (Halfar et al., 2011b).
cified crust, also generates the thin upper layer of the ep-                           This supports Adey’s (1970) finding that growth is limited
ithallium, the primary photosynthetic tissue of these plants                           by photosynthetic production in warmer water, whereas it
(Adey, 1965). The perithallial tissue below the meristem pre-                          is temperature-controlled in colder water. Adey et al. (2013)
serves the annual growth increments and the remains of the                             modelled the relative control of temperature and light in al-
yearly conceptacles, which are ovoid conceptacle cavities                              gal systems, showing that, over a broad range of tempera-
(Fig. 1). The primary hypothallium is a multicellular tissue                           tures and light, temperature had a somewhat larger effect on
forming the base of each individual and provides attachment                            productivity than light. Since both temperature and light are
to the substratum (Adey, 1965). Since it shows a modified                              limiting factors, the most limiting will be controlling produc-
form of calcification with higher Mg levels than the perithal-                         tivity. However, in winter subarctic conditions, both factors
lium (Nash and Adey, 2018), it is not utilized in climate                              are at or near limiting conditions. Similarly, cloud cover, an-
archiving. Wound tissue and secondary hypothallia develop                              other light proxy, has been linked to the summer calcifica-
to repair physical damage, inflicted by wave tools or graz-                            tion of the rhodolith-forming coralline alga Lithothamnion
ers to the algal thallus (Fig. 1). While occasionally grazing                          glaciale (Burdett et al., 2011). In that study, lower light lev-
can damage the meristem and perithallus, most grazing is re-                           els caused by winter cloud cover reduced summer carbon-
stricted to the epithallus. A “symbiotic” association between                          ate density (Burdett et al., 2011). Additionally, Teichert and
chiton and limpet grazing and Clathromorphum sp. has been                              Freiwald (2014) found light to be the most important, and
demonstrated, and moderate grazing of surficial epithallium                            mean annual temperature to be the second-most-important,
is required to keep the meristem active (Adey, 1973; Steneck,                          physical parameter limiting calcium carbonate production of
1982).                                                                                 coralline algae on the Svalbard shelf. Furthermore, Halfar et
                                                                                       al. (2013) used the influence of light on both growth rates

Biogeosciences, 15, 5745–5759, 2018                                                                         www.biogeosciences.net/15/5745/2018/
S. Williams et al.: Effects of light and temperature on Mg uptake, growth, and calcification                                                     5747

                                                                                            150
                                                                                                                                            December
                                                                                                           Mean                             2011
                                                                                            100            Maxima

                                                                                             50

                                                                    Incident light [lux]
                                                                                              00
                                                                                           1500
                                                                                                   500       900        1300        1700 June 2100
                                                                                                                     Time [hours]        2011
                                                                                           1000

                                                                                            500
Figure 2. Clathromorphum compactum mounds (dark red) up to
3 cm thick in a typical coralline community at 13 m depth off
Quirpon Island in northernmost Newfoundland. Photo by Nick                                    0
                                                                                                   05:00     09:00      13:00       17:00        21:00
Caloyianus.
                                                                                                                     Time [hours]

                                                                    Figure 3. Summer (June) and Winter (December) daily means
and Mg / Ca to reconstruct sea ice cover in the Arctic. Sea         (dashed curve) and maxima (black curve) of half-hour-resolution
                                                                    light data from HOBO loggers at the Bay Bulls collection site.
ice cover constrains growth by limiting photosynthates that
                                                                    HOBO light sensors were oriented vertically for maximum light re-
the algae produce (Halfar et al., 2013). Also, bottom temper-       ceipt.
atures remain relatively constant below sea ice and more ice-
free days allow for higher temperatures, which are recorded
in the Mg / Ca of the algae (Halfar et al., 2013). In sum-          range of light, temperature, and time treatments in a suite
mary, both light and temperature have demonstrated effects          of tanks having the same open-coast-source water supply.
on coralline algal calcification and Mg / Ca.                       Post-experiment, multiple samples were analysed for their
   Contrary to the majority of photosynthetic calcifiers, C.        anatomical and cellular changes, growth, and MgCO3 com-
compactum can thrive in the absence of light for over half          position relative to the various treatments.
of the year. For example, C. compactum is found in abun-
dance in Arctic Bay, Nunavut, Canada, at 73◦ N, where sea
ice cover causes near darkness at the sea floor for up to           2                      Materials and methods
9 months of the year (Halfar et al., 2013). Regardless of ice,
C. compactum has been found in Novaya Zemlya (Adey et               2.1                      Test subjects
al., 2015b), an archipelago in the Russian Arctic where there
is less than 1 h of sunlight per day for 4 months of the year.      One hundred and twenty-three living specimens of Clathro-
These relationships prevail in other distantly related coralline    morphum compactum were chipped off rocky surfaces
genera from high-latitude warmer (Boreal) waters as shown           by divers in August 2012 at 10–12 m depths in Bread
by the ability of Phymatolithon borealis, P. investiens, P.         and Cheese Cove, Bay Bulls, Newfoundland (47◦ 18.570 N;
tenue, and L. glaciale to develop extensive crusts and mo-          52◦ 46.980 W). The C. compactum specimens were dome-
bile rhodoliths in the far north of Norway, where long winter       shaped, 3–6 cm in diameter, and 1–3 cm thick, a com-
darkness also occurs (Adey et al., 2018; Teichert et al., 2013).    mon size in Newfoundland and Southern Labrador (Fig. 2).
Even though growth rate is controlled by light and tempera-         Clathromorphum species are highly distinctive and easily
ture, the chemistry of the associated calcification does not        separated from other coralline species in the region by
rely directly on photosynthesis but rather on total quantity of     their surface features and deep intercalary meristem (Adey,
photosynthates.                                                     1965; Adey et al., 2015b). C. circumscriptum, the only other
   It is clear that a better understanding of the effects of tem-   species of the genus in the northwestern Atlantic, occurs
perature and light (or lack thereof) on C. compactum growth,        primarily in shallow water, rarely reaching to the depth of
calcification, and elemental composition is necessary to fully      specimen collection in this study, and at maturity is morpho-
understand C. compactum biology and ecology, and the use            logically quite distinctive (Adey, 1965; Adey et al., 2013).
of this species as a climate archive. In this study, we ex-         As each collected specimen was delivered by divers to the
amine multiple specimens of C. compactum, monitored at a            dive boat for selection and initial scarring, it was identified

www.biogeosciences.net/15/5745/2018/                                                                           Biogeosciences, 15, 5745–5759, 2018
5748                                               S. Williams et al.: Effects of light and temperature on Mg uptake, growth, and calcification

                   16
                   14
                   12
Temperature [°C]

                   10
                   8
                   6
                   4
                   2
                   0
                        Jan   28 Mar
                                  56   84   May
                                             112 140 Jul168   196Sep224   252Nov280308 336
                                                      Date

 Figure 4. Five-day average temperatures through 2011 at Bay Bulls,
 Bread and Cheese Cove, at 10 m, taken with HOBO data loggers.

 aboard by co-author WHA. During the experiment, each in-
 dividual specimen, as selected for analysis, was tagged with                                Figure 5. Experimental tank layout at the Ocean Sciences Centre
 a number, after removal from the tanks, for tracking through                                at Logy Bay, NF. High-light right end of each tank is adjacent to
 analysis; the specimens are stored in the Smithsonian Insti-                                large port-like window and has fluorescent lights overlying. Oppo-
 tution National Museum of Natural History (NMNH) with                                       site, low-light ends of tanks shielded with opaque plastic sheet. Note
 those identification tags for future reference.                                             cooling probes, coated with ice, placed in 2 and 4 ◦ C tanks on left.
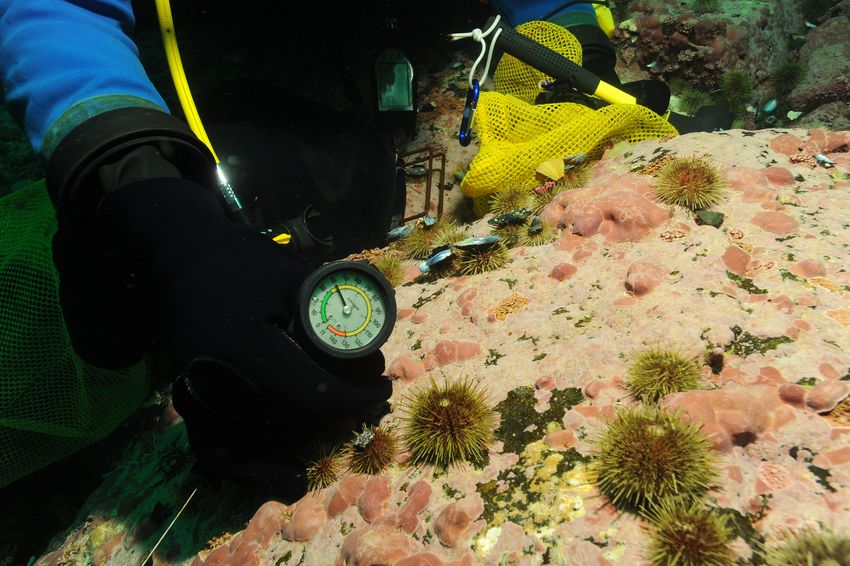
    Year-long temperature and light data (lux) were measured                                 Three light segments (left to right: low light, ll; mid-light. ml; high
                                                                                             light, hl) with their emplaced specimens can be seen in right tank.
 with in situ HOBO loggers (HOBO Pendant; Onset Com-
 puter Corporation) at a depth of 12 m at Bread and Cheese
 Cove (Figs. 3 and 4). The calibration of the HOBO light
 loggers used in the experiment was confirmed against the                                    sponses would have been an essential component requiring
 earlier field data by installing the same sensors at the field                              individual chambers for each specimen, would have signif-
 site for a single day. This provided values similar to the                                  icantly increased the difficulty and cost of carrying out the
 previous time series. In addition, temperature–depth profiles                               experiment.
 were obtained from Adey (1966) for four exposed stations
 on the east and northeast coast of Newfoundland, along with                                 2.2   Experimental setup
 a relative abundance–depth profile of C. compactum at those
 sites (Supplement Fig. S1). Both sources of instrumental data                               The experiment was carried out at the Ocean Sciences Cen-
 were used to establish the temperature and light parameters                                 tre (OSC) of Memorial University of Newfoundland from
 of the mesocosm complex.                                                                    September 2012 to July 2013. Sea water, pumped in from a
    There were several reasons for not measuring photosyn-                                   depth of 5 m in the adjacent embayment, Logy Bay, was pro-
 thetically active radiation (PAR) in this study. (1) Consid-                                vided through a constant-flow system at 1 L min−1 to each
 erable pre-existing field evidence suggested that calcifica-                                tank. Four 180 L glass tanks were placed so that natural
 tion in Clathromorphum (and other corallines) is not di-                                    light from large rounded windows was provided at one end
 rectly related to photosynthesis (Nash and Adey, 2018), but                                 of each pair of tanks, with the opposite ends of the tanks
 rather only to the availability of stored photosynthate en-                                 shaded with black plastic sheets (Fig. 5). Sixty-centimetre-
 ergy. (2) Being red algae, and having the accessory pigments                                long, 20 W Hagen Marine-GLO T8 fluorescent tubes were
 phycocyanin and phycoerythrin that supplement chlorophyll,                                  positioned over the window-lighted end of each tank so as to
 corallines have quite different action spectra from green al-                               provide a significant light gradient (Fig. 6). The light covered
 gae or higher plants. Also, since these algae reach a peak of                               one half of each tank (the high-light section). The immediate
 cover at about 20 m, we were working with available light                                   darker quarter of each tank was the mid-light section, and the
 spectra that would be very different from those at the wa-                                  darkest quarter the low-light section. The fluorescent tubes
 ter surface. Using PAR sensors would have raised as many                                    were automatically switched on at 10:00 and off at 15:00.
 questions as it solved. (3) Since C. compactum occurs over                                  Day length and morning and evening light intensity were
 a wide depth range (5–30 m), the level of photosynthesis                                    supplied by natural sunlight from the north-facing windows.
 varies widely, and previous studies have not indicated ma-                                  Experimental temperatures were 2, 4, 7, and 10 ◦ C. All tanks
 jor changes in growth and calcification over that range. Thus                               were supplied with 4 ◦ C seawater from a master chiller at a
 we would not have expected a strong relationship between                                    constant flow rate of 1 L min−1 . Temperatures in the 7 and
 our parameters of interest and light spectra. (4) Adding PAR,                               10 ◦ C tanks were obtained with immersion heaters (Hagen,
 with or instead of lux, especially since action spectra re-                                 Fluval M300). Temperatures in the 2 ◦ C tank were obtained

 Biogeosciences, 15, 5745–5759, 2018                                                                                www.biogeosciences.net/15/5745/2018/
S. Williams et al.: Effects of light and temperature on Mg uptake, growth, and calcification                                                                                             5749

                    800
                                  Day 1              Day 2               Day 3               Day 4      Day 5                  Table 1. Average tank temperatures, November 2012–June 2013.

                    600                                                                                         High light
                                                                                                                                                Tank section   10 ◦ C   7 ◦C   4 ◦C   2 ◦C
                                                                                                                Medium light
                    400                                                                                         Low light            Nov 2012   High light      10.2     6.9    3.7     2.4
                                                                                                                                                Low light       10.4       7    3.8       2
                    200                                                                                                                         Average         10.3    6.95   3.75     2.2
Light [lux]

                    0                                                                                                                Dec 2012   High light      10.1     7.1    4.4     2.2
                          11:00

                                     23:00

                                             11:00

                                                        23:00

                                                                 11:00

                                                                            23:00

                                                                                     11:00

                                                                                                23:00

                                                                                                        11:00
                                                                                                                                                Low light       10.2     7.1    4.5     1.8
                                                                 Time                                                                           Average        10.15     7.1   4.45       2

Figure 6. Five-day plot of light levels taken from HOBO loggers                                                                      Jan 2013   High light       9.3      7       4    2.3
in October 2012 in 10 ◦ C tank. Pink is high light, blue is medium                                                                              Low light                 7     4.4    1.8
light, and green is low light.                                                                                                                  Average          9.3      7     4.2   2.05
                                                                                                                                     Feb 2013   High light     10.39    6.95   3.53   2.03
                                                                                                                                                Low light      10.47    6.98   3.65   1.52
                        12                                                                                                                      Average        10.43    6.97   3.59   1.78
                        10                                                                                           (a)
 Temperature [°C]

                                                                                                                                     Mar 2013   High light     10.37    7.63   4.12   2.24
                          8
                                                                                                                                                Low light      10.48    7.66   4.24   1.67
                          6
                                                                                                                                                Average        10.43    7.65   4.18   1.96
                          4
                          2                                                                                                          Apr 2013   High light     10.05    7.43   4.22   2.13
                    1000                                                                                                                        Low light      10.17    7.45   4.37    1.5
                                                                                                                     (b)                        Average        10.11    7.44    4.3   1.82
                    750
                                                                                                                                     May 2012   High light     10.91    7.39   4.24   2.31
  Light [lux]

                    500                                                                                                                         Low light      10.95    7.46   4.38   1.74
                                                                                                                                                Average        10.93    7.43   4.31   2.03
                    250
                                                                                                                                     Jun 2013   High light     10.73    7.09   4.31   2.55
                          0       June 1                        June 10                         June 20             June 30                     Low light      10.85    7.19   4.42   1.82
                                                                                    Date
                                                                                                                                                Average        10.79    7.14   4.37   2.19
Figure 7. (a) Temperature (◦ C) and (b) light (lux) during June in                                                                              Mean           10.35    7.21   4.14      2
high-light portion of 7 ◦ C tank.

                                                                                                                               2.3    Placement and harvest of C. compactum specimens
with two immersion probe coolers (Polyscience, IP 35RCC).                                                                             in mesocosm
September was a month of gradual temperature change in
each tank from roughly 12 ◦ C incoming sea water to each                                                                       To mark the beginning of the experiment (September 2012),
experimental value.                                                                                                            the specimens of C. compactum were placed in a tank con-
   HOBO data loggers were placed in each tank at high-                                                                         taining approximately 85 mg alizarin red dye per liter of sea-
and low-light positions to quantify light and temperature at                                                                   water for 48 h. Alizarin red is incorporated into the living al-
5 min intervals throughout the experiment (Figs. 6–8). A pre-                                                                  gal tissue, and it leaves a permanent red stain line (Kamenos
experimental trial with data loggers in all three sections pro-                                                                et al., 2008). However, the stain was not incorporated in the
duced a light value as a proportion of that in the high-light                                                                  tissues, likely because the test subjects did not grow suffi-
tank for the remainder of the experiment (Fig. 6). Mean                                                                        ciently during the staining process, so staining information
light levels in October were as follows: high light = 450 lx,                                                                  was not part of this study.
medium light = 142 lx, and low light = 17 lx (Fig. 6). The                                                                        Each specimen was also laterally scarred (incised) with
monthly mean temperatures at each light level in each tank                                                                     a fine metal file to a depth of 200–400 µm aboard the dive
are shown in Table 1. Occasional changes in flow rates of the                                                                  skiff immediately following collection (Fig. 2). The inci-
sea water supply as well as heater function required manual                                                                    sions, when sectioned by vertical fracturing, allowed for a
system adjustments to bring temperature to desired values.                                                                     scanning electron microscope (SEM)-based estimate of rate
Due to the limitations of the laboratory and available equip-                                                                  of wound tissue growth during the experiment, as well as
ment, the −1.5 to 1 ◦ C temperature levels representing win-                                                                   study of the process of wound repair. Electron microprobe
ter temperatures in coastal Newfoundland were not achieved,                                                                    examination was separately applied to sections of normal
with 2 ◦ C being the lowest temperature attained for the long-                                                                 (unscarred) perithallial tissue and used to estimate the begin-
term experiment.                                                                                                               ning of the experiment (shown by the cessation of seasonal

www.biogeosciences.net/15/5745/2018/                                                                                                                   Biogeosciences, 15, 5745–5759, 2018
5750                                       S. Williams et al.: Effects of light and temperature on Mg uptake, growth, and calcification

                    12
                                                                     (a)
Temperature [°C ]

                    10
                     8
                     6
                                                                             Table 2. C. compactum growth experiment (ClEx) at Logy Bay,
                     4
                                                                             Newfoundland. Specimens collected in mid-August 2012 and
                     2
                                                                             brought to experimental temperature through September 2012. High
                    450
                                                                     (b)     light (hl) was < 400 lx, medium light (ml) was < 160 lx, and low
                                                                             light (ll) was < 17 lx.
   Light [lux]

                    30

                    15
                                                                                        Sample date    Temp.    Light    Number
                     0
                                                                                                        [◦ C]   level   harvested
                          Dec 1   Dec 10          Dec 20         Dec 30
                                  Date                                                  1 Oct 2012        10    hl              1
                                                                                                          10    ml              1
Figure 8. (a) Temperature (◦ C) and (b) light (lux) during December                                        7    hl              1
in high-light portion of 7 ◦ C tank.                                                                       7    ml              1
                                                                                                           4    hl              1
                                                                                                           4    ml              1
                                                                                                           2    hl              1
Mg fluctuation). The annual maximum Mg / Ca was used to                                                    2    ml              1
denote the beginning of the experiment for electron micro-
probe data, since this represents highest temperatures annu-                            1 Nov 2012        10    hl              1
ally at the collection site, which occur in August, at the time                                           10    ll              1
                                                                                                           7    hl              1
of collection.
                                                                                                           7    ll              1
   The 123 Clathromorphum compactum specimens from
                                                                                                           4    hl              1
Bread and Cheese Cove were distributed evenly within each                                                  4    ll              1
of the four experimental tanks, with ∼ 10 specimens in each                                                2    hl              1
light zone (for a total of 30 subjects in each tank). On the first                                         2    ll              1
of each month, beginning with 1 October, individual spec-
                                                                                        1 Dec 2012        10    hl              1
imens were haphazardly collected from each light zone of
                                                                                                          10    ml              1
each tank with the intention of leaving the remaining spec-
                                                                                                          10    ll              1
imens evenly distributed over the zone space so as not to                                                  7    hl              1
bias in-zone distribution with time. After collection, speci-                                              7    ml              1
mens were oven-dried for 48 h at 40 ◦ C and shipped to the                                                 7    ll              1
NMNH for sectioning and anatomical analysis with SEM                                                       4    hl              1
(Table 2). Using SEM, the progress of regrowth of the scarred                                              4    ml              1
tissue, as well as the status of the meristem and epithallial                                              4    ll              1
and hypothallial tissues, was determined. Of the 123 sub-                                                  2    hl              1
jects, 3 were lost to “white-patch disease”, which is occa-                                                2    ml              1
sionally seen in the wild (Adey et al, 2013), and 85 were                                                  2    ll              1
vertically fractured in an attempt both to cut across the scars                         4 Jan 2013        10    hl              1
made immediately after collection and to section the peak of                                              10    ml              1
the mound. The remaining 35 specimens, mostly collected                                                   10    ll              1
on 1 July 2013, at the close of the experiment, were also sent                                             7    hl              1
to the NMNH coralline herbarium, as the ClEx Collection,                                                   7    ml              1
for examination and voucher storage.                                                                       7    ll              1
                                                                                                           4    hl              1
   Anatomy, growth, and calcification in the dark (Adey et
                                                                                                           4    ml              1
al., 2013, 2015) were also monitored and measured, since C.
                                                                                                           4    ll              1
compactum is primarily an Arctic species and is seasonally                                                 2    hl              1
exposed to periods of up to 9 months without sunlight. On                                                  2    ml              1
1 February 2013, and repeated on 1 May 2013, 16 specimens                                                  2    ll              1
from the low-light areas of each of the experimental meso-
                                                                                        24 Jan 2013       10    ml              1
cosms were re-scarred (position of scar several millimetres
                                                                                                          10    ll              1
removed from the original scar) and placed in in situ dark
chambers. These specimens were subsequently collected at
1–2-month intervals (Table 2) and examined in SEM to de-
termine the extent of wound recovery in the dark (Fig. 9a).

Biogeosciences, 15, 5745–5759, 2018                                                               www.biogeosciences.net/15/5745/2018/
S. Williams et al.: Effects of light and temperature on Mg uptake, growth, and calcification                           5751

Table 2. Continued.                                           Table 3. Number of transects analysed with electron microprobe
                                                              from each temperature and light level. Number of samples from
       Sample date    Temp.    Light            Number        each level in brackets.
                       [◦ C]   level           harvested
       1 Feb 2013        10    hl                     1                  Temperature     High    Medium      Low
                         10    ml                     1                  (◦ C)           light     light     light
                          7    hl                     1                  10             10 (4)       3 (1)   3 (1)
                          7    ml                     1                  7              10 (4)       1 (1)   7 (3)
                          4    hl                     1                  4              10 (4)       6 (2)   7 (3)
                          4    ml                     1
                                                                         2              10 (4)       6 (2)   7 (3)
                          2    hl                     1
                          2    ml                     1
       1 March 2013      10    dark 1 month           1
                         10    hl                     1          Each experimental mesocosm had chitons (Tonicella spp.),
                          7    dark 1 month           1       collected at Bay Bulls, added in roughly equal numbers to
                          7    hl                     1       the number of C. compactum mounds present in each tank.
                          4    dark 1 month           1       The chitons, normally having home sites on or near C. com-
                          4    hl                     1       pactum in the wild, established home sites beneath the exper-
                          2    dark 1 month           1
                          2    hl                     1
                                                              imental specimens; because the chitons might not travel over
                                                              glass from specimen to specimen, we provided one to each
       1 Apr 2013        10    hl                     1       C. compactum mound. The reason for including chitons in
                         10    dark 1 month           1
                                                              the experiment is the above-described symbiotic relationship
                          7    hl                     1
                          7    dark 1 month           1
                                                              between grazing and Clathromorphum sp.
                          4    hl                     1
                          4    dark 1 month           1       2.4   Sample analyses
                          2    hl                     1
                          2    dark 1 month           1       All specimens were examined at the NMNH Imaging Lab-
       1 May 2013        10    hl                     1       oratory at a range of magnifications from 50× to 5000×
                         10    ml                     1       on a Leica Stereoscan 440 SEM operated at 10 kV, a 13–
                          7    hl                     1       15 mm working distance, and a sample current of 101 pA.
                          7    ml                     1       Specimens harvested in July, at the end of the experiment,
                          4    hl                     1       were sectioned vertically and polished using diamond sus-
                          4    ml                     1       pension to a grit size of 1 µm. The software geo.TS (Olympus
                          2    hl                     1
                                                              Soft Imaging Systems) was utilized with an automated sam-
                          2    ml                     1
                                                              pling stage on a reflected-light microscope to produce two-
       2 Jun 013         10    hl                     1       dimensional maps of the experimental subjects’ polished sur-
                         10    dark 1 month           1       faces. These high-resolution composite images were used to
                          7    hl                     1
                          7    dark 1 month           1
                                                              identify the first annual growth increment and to select linear
                          4    hl                     1       transects for geochemical analysis across the annual growth
                          4    dark 1 month           1       increment, encompassing the length of the experiment and
                          2    hl                     1       avoiding the wound area of the samples (for details see Het-
                          2    dark 1 month           1       zinger et al., 2009). One to three parallel electron micro-
       1 Jul 2013        10    hl                     4       probe line transects were analysed for algal MgCO3 compo-
                         10    ml                     1       sition on each subject (Table 3) from the meristem to the first
                         10    ll                     2       growth line at the University of Göttingen, Germany, using
                         10    dark 2 months          1       a JEOL JXA 8900 RL electron microprobe. An acceleration
                          7    hl                     4       voltage of 10 kV, a spot diameter of 7 µm, and a beam current
                          7    ml                     2
                                                              of 12 nA were used. Along transects samples were obtained
                          7    ll                     3
                          7    dark 2 months          1       at intervals of 10 µm; to avoid unsuitable areas such as un-
                          4    hl                     4       calcified cell interiors, the location of analyses were manu-
                          4    ml                     2       ally chosen no more than 20 µm laterally from the transect
                          4    ll                     3       line. Further details of the method are described in Halfar et
                          4    dark 2 months          1       al. (2013).
                          2    hl                     4          Using R version 3.3.2 (R Core Team, 2016) one-way
                          2    ml                     2
                                                              and two-way analysis of variance (ANOVA) tests were per-
                          2    ll                     3
                          2    dark 2 months          1       formed to determine the variance between light and tempera-

www.biogeosciences.net/15/5745/2018/                                                 Biogeosciences, 15, 5745–5759, 2018
5752                               S. Williams et al.: Effects of light and temperature on Mg uptake, growth, and calcification

                          (a)                                             (b)
                                                                                           Epithallium

                                                                            Secondary                    Meristem
                                                                            hypothallium
                                                                                      Primordial cells

                                        Scar edge    Primordial cell
                                                                           Pre-
                                                                           collection
                                                                           perithallium

                          (c)                                             (d)

                                                                                          Epithallium
                                                                                                    Meristem

                                                                                Wound tissue
                                                                                                                Perithallium
                                                                                                Secondary
                            Primordial cells                                                    hypothallium

Figure 9. Example of wound recovery of C. compactum. (a) Section of C. compactum mound through the scar groove, collected from low-
light, 2 ◦ C tank on 1 December 2012 after 2.5 months of recovery. Wound regrowth was initiated with one or more large primordial cells
that gradually transition into normal perithallial cells. Following the production of three to four typical perithallial cells, meristem cells have
developed and are beginning to produce epithallial cells (ClEx 121 211). (b) Scar groove section of C. compactum mound from the high-
light, 2 ◦ C tank after 6 months of recovery. Groove has nearly grown in with normal meristem cells and perithallial and epithallial tissue. See
blow-up of large primordial cells in (c). (c) Primordial cells in lower left of section of (b). These large ovoid to box-shaped cells typically
have massive cell walls that appear to be a combination of inner cell wall and interfilament, crystals (ClEx 41 2hl). (d) Partially regrown
scar (∼ 400 µm at the deepest part) in C. compactum retrieved from 10 ◦ C high-light tank on 1 November 2012. Left side and shallower
back portion of scar have formed new perithallium directly from old, pre-scar tissue. However, deeper bottom of scar is being filled by new
hypothallium being topped with new perithallium. Allowing for late August and September recovery without growth, new wound tissue
represents 1–2 months’ growth. Scale bars: 100 µm (a, b, d) and 10 µm (c).

ture conditions. Assumptions for ANOVA were met, and nor-                   in all stages of the experiment including in samples grown in
mality was verified using the Shapiro–Wilks test, and equal                 the dark. Occasionally when the scars were deeper, lateral
variance was verified with the Bartlett test. Linear regres-                secondary hypothallial growth developed to partially refill
sions were used to determine temperature–MgCO3 relation-                    the base of the wound (Fig. 9d). Direct perithallial regrowth
ships. There was only data for three temperature treatments                 of scar tissue in almost all cases, both marginally and ver-
for the medium-light conditions, instead of the four temper-                tically, was typically initiated by one or several very large
ature treatments for high- and low-light conditions. This was               primordial cells, with massive calcified cell walls (Figs. 10f,
addressed through the degrees of freedom associated with                    9a–c).
specific ANOVA tests used to determine each p value.                           Until the meristem and sufficient photosynthetic epithallial
                                                                            tissue is formed, development and growth must be sustained
                                                                            by transfer of photosynthate from elsewhere in the crust, ei-
3     Results                                                               ther as storage food from old perithallial tissue lying below or
                                                                            as newly produced photosynthate from undamaged epithal-
3.1     Sample growth during experiment                                     lial tissues beyond the wound. Therefore growth and calcifi-
                                                                            cation in these newly formed tissues must be metabolically
3.1.1    Wound recovery from scars as indicator for algal
                                                                            driven. The mean growth of scar tissue during the course of
         growth characteristics/cellular structure
                                                                            this experiment from subjects in all temperature and all light
Development of characteristic wound tissue from sub-scar                    conditions combined was 42 µm month−1 (Table 4). Speci-
pre-existing perithallial tissue occurred to a depth of ap-                 mens lacking apparent recovery (zeros) were not included in
proximately 400 µm (Fig. 9d). After the formation of sev-                   the summation, since the possibility of grazing, as a factor
eral primordial wound repair cells, a new intercalary meris-                external to growth, cannot be excluded. This compares with
tem forms, gradually returning the wound tissues to normal                  the expected mean monthly growth rate of specimens at the
perithallial tissue, and starch grains as stored food are present           Bay Bulls site of approximately 24 µm month−1 (Halfar et

Biogeosciences, 15, 5745–5759, 2018                                                                      www.biogeosciences.net/15/5745/2018/
S. Williams et al.: Effects of light and temperature on Mg uptake, growth, and calcification                                                5753

                          (a)                                               (b)
                                              Epithallial cell
                                                                              Epithallial   Meristem
                                                                              cells
                           Meristem                    Perithallial cell

                                                                                                    Primordial cells

                                                                                   Perithallial cells
                                             Primordial cell

                          (c)                                               (d)
                                   Epithallial cell
                                                                                                          Epithallial cell

                                          Meristem                                  Meristem

                          (e)                                               (f)
                                          Interfilament crystals

                                                                                            Primordial cells

                                         Innerwall crystals

Figure 10. Examples of wound recovery during dark calcification. (a) Wound tissue recovery after 2 months in dark conditions. Primordial
cells, perithallial cells, meristem cells and two to three epithallial cells appear similar to those shown in Fig. 9a–c for lighted wound recovery
tissues (ClEx 71 4dk). (b) Similar wound recovery after 1 month of growth in the dark. There are fewer cells, with only few meristem cells
apparent as compared to (a); rectangle indicates area magnified in (c) (ClEx 31 4dk). (c) Magnification section of (b) showing three meristem
and two new epithallial cells being initiated (ClEx 31 4dk). (d) Section of 1-month dark groove developing new tissues. Meristem cells are
in process of developing along with one or two epithallial cells. Note clear development of interfilament, even at this early stage, along
with standard radial inner-wall crystals (ClEx 41 4dk). (e) Normal upper perithallial tissue from 4 ◦ C tank after 2 months of dark growth
(meristem cell in upper left) showing extensive, normal diagonal interfilament crystals developed in the dark (ClEx 71 4dk). (f) Surface view
of part of scar made on 1 May 2013, when specimen was placed in dark chamber of 4 ◦ C tank. Collected on 1 July 2013, large cells visible
on mid-slope lateral surfaces of scar are recovering primordial cells. Lateral to groove, on normal tissue, right and left, overlying epithallial
tissue can be seen to be heavily grazed by chitons in form of en-echelon, fine grooves (ClEx 71 4dk). Scale bars: 2 µm (e), 10 µm (a, c, d),
and 100 µm (b, f).

al., 2011b). Total normal perithallial growth during the ex-               curred within the experimental system. Mature and maturing
periment of the subjects harvested in July ranged from 58 to               conceptacles were widely spread over the temperature and
182 µm (Fig. 11).                                                          light range employed, and were commonly found in these
   In addition to artificial scarring, chiton-inflicted grazing            experimental specimens (Fig. S2a and b), as well as signs
deeper than epithallium and apparently also into the recov-                of grazing, through the epithallium and overlying concep-
ering wound tissue and developing conceptacles was en-                     tacle roof tissue, into the conceptacle cavities (Fig. S2c).
countered during the experiment (Table 4). Generally, chi-                 Two-thirds of the noted significant grazing, including both
tons took up daytime residence beneath each subject and                    wound tissue and conceptacles, occurred in the 10 ◦ C tank
came out to graze the surface at night. The graze marks of                 (Table 4), suggesting that at higher temperatures, out of phase
these animals are seen in appropriately oriented specimens                 with conceptacle development (normally autumn and win-
(Fig. 10f). The development of asexual conceptacles in the                 ter), chiton grazing could significantly affect reproduction.
experiment – beginning in the autumn and reaching matu-                    The high dominance of observed chiton grazing occurring
rity by mid-winter, just as in the wild (Adey, 1965) – oc-                 in the 10 ◦ C tank suggests that temperature control of chiton

www.biogeosciences.net/15/5745/2018/                                                                    Biogeosciences, 15, 5745–5759, 2018
5754                                                                        S. Williams et al.: Effects of light and temperature on Mg uptake, growth, and calcification

                                                                                                                                                                      +. Specimens lacking apparent recovery (zeros) were not included in the summation, since the possibility of grazing, as a factor external to growth, cannot be excluded.
                                                                                                                                                                      Table 4. ClEx wound (scar) regrowth (thickness of new growth µm month−1 for growth (month)). Extensive chiton grazing of groove marked with ∗ ; conceptacles present marked with
                                                                                                                                                                                                                                                                                                                                                                       200
  # specs with
  or grazed
  Concs present

                       Chiton grazing
                       (without 0s)
                       Mean each tank
                       Mean (without 0s)

                                                              1 Jul (9.5 mos)
                                                              1 May (7.5 mos)
                                                              1 Apr (6.5 mos)
                                                              1 Mar (5.5 mos)
                                                              1 Feb (4.5 mos)
                                                              4 Jan (3.5 mos)
                                                              1 Dece (2.5 mos)
                                                              1 Nov (1.5 mos)
                                                                                                                                   Harvest date (# mos)
                                                                                                                                                                                                                                                                                                                                                                       150

                                                                                                                                                                                                                                                                                                                                                         Growth [μm]
                                                                                                                                                                                                                                                                                                                                                                       100                                              High light

                                                                                                                                                                                                                                                                                                                                                                                                                        Medium light

                                                                        380/69∗∗
                                                                                                                                                                                                                                                                                                                                                                       50                                               Low light
                                158/43
                                149/43

                                                                                                                     100/40
                                                                          ∗∗ ++

                                                                                                                      80/53
                                                                                                   37/8
                                                                             ∗∗∗

                                                                                                                                   hl
  4

            1

                       4

                                                                                                               ∗
                                                                                                                                                                                                                                                                                                                                                                        0

                                                                                                   150/60+∗
                                                                                                                                                                                                                                                                                                                                                                             0       2     4      6       8   10   12
                                    150/45

                                                                                                      150/33
                                                                                                      150/43
                                                                        ∗∗ ++

                                                                                                                                                          10 ◦ C
                                                                                                                                                                                                                                                                                                                                                                                           Temperature [°C]

                                                                                                                                   ml
  3

            2

                       2

                                                                                                                                                                                                                                                                                                                                                         Figure 11. Total perithallial growth during experiment of samples
                                    175/40

                                                                                          200/36

                                                                                                            150/43

                                                                                                                                                                                                                                                                                                                                                         harvested at end of experiment; multiple transects from individuals
                                                                                    ∗∗∗

                                                                                                               ∗0

                                                                                                                                   ll

                                                                                                                                                                                                                                                                                                                                                         were averaged.
  2

            0

                       2

                                                                                                                     120/48+
                                                                        250/45∗
                                194/41
                                255/47

                                                                         300/40
                                                                         350/54

                                                                                                                                   hl
  4

            1

                       1

                                                                              0

                                                                                                                                                                                                                                                                                                                                                         activity is important. However, with no predators (especially
                                                                                                                                                                                                                                                                                                                                                         small starfish) in the experimental system, chitons may well
                                    195/38

                                                                        300/40

                                                                                                                     90/36

                                                                                                                                                          7 ◦C

                                                                                                                                                                                                                                                                                                                                                         have been more active than in the wild.
                                                                                                                                   ml
  2

            0

                       0

                                    131/37

                                                                                 250/38
                                                                                 110/20

                                                                                                            125/36

                                                                                                                                                                                                                                                                                                                                                         3.1.2                   Dark growth and calcification
                                                                                                             80/32
                                                                                                             90/60
                                                                                                                                   ll
  5

            0

                       0

                                                                                                                                                                                                                                                                                                                                                         Four specimens from each of the experimental tanks, all from
                                                                                 175/70+
                                213/51
                                268/62

                                                                                   300/46
                                                                                   370/67

                                                                                   225/64

                                                                                                                                                                                                                                                                                                                                                         the low-light sections of the tanks, were re-scarred, near the
                                                                                                                                                                                                                                                                                                                                                         earlier collection scar and placed in dark chambers at the
                                                                                                                                   hl
  4

            1

                       0

                                                                                        0

                                                                                        0

                                                                                                                                                                                                                                                                                                                                                         opaque back of each tank on 1 February and 1 May 2013.
                                    135/47

                                                                                                            120/34
                                                                                                            150/60

                                                                                                                                                                                                                                                                                                                                                         Of the 16 subjects placed in the dark, after collection nine
                                                                                                                                                          4 ◦C
                                                                                                                                   ml
  2

            0

                       0

                                                                                                                                                                                                                                                                                                                                                         were sectioned and examined in SEM for new growth in the
                                                                                                                                                                                                                                                                                                                                                         dark. Of those SEM samples, three were covered with de-
                                    235/44

                                                              375/39

                                                                                 300/46
                                                                                 320/58

                                                                                                                     150/60
                                                                                                            ∗∗∗ +

                                                                                                                      29/19

                                                                                                                                                                                                                                                                                                                                                         tritus in the crucial scar section, and SEM observations of
                                                                                                                                   ll
  5

            1

                       1

                                                                                                                                                                                                                                                                                                                                                         potential new growth could not be carried out; three showed
                                165/34
                                230/45

                                                                                 220/34
                                                                                 320/58

                                                                                                            150/43

                                                                                                                                                                                                                                                                                                                                                         no apparent regrowth (although chiton grazing might have
                                                                                                                                   hl

                                                                                                                                                                                                                                                                                                                                                         removed such growth); and three presented a good section
  3

            0

                       0

                                                                                                                               0

                                                                                                                                                                                                                                                                                                                                                         and images in SEM and were capable of reliably providing
                                    152/33

                                                                        230/31

                                                                                                   125/28

                                                                                                                     100/40

                                                                                                                                                                                                                                                                                                                                                         a recording of dark growth. Specimens from the 4 ◦ C tank
                                                                                                                                                          2 ◦C
                                                                                                                                   ml
  3

            0

                       0

                                                                                                                                                                                                                                                                                                                                                         placed in the dark and collected after 1 month were sectioned
                                                              150/16*

                                                                                                                                                                                                                                                                                                                                                         and examined with SEM. Two of these specimens presented
                                    113/25

                                                                                 100/15

                                                                                                   100/29
                                                                                                   100/40

                                                                                                                                                                                                                                                                                                                                                         the distinctive scar (wound) regrowth (Fig. 10a–c). An addi-
                                                                                             ∗∗∗

                                                                                                                                   ll
  4

            0

                       2

                                                                                                        0

                                                                                                                                                                                                                                                                                                                                                         tional specimen – taken from the low light level of the 4 ◦ C
                                                                                                                                   Total

                                                                                                                                                                                                                                                                                                                                                         tank, placed in a dark chamber for 2 months, and manipu-
                                                              263
                                                              277
                                                              253
                                                              279
                                                              104
                                                              146
                                                              122
                                                               66

                                                                                                                                                          Mean (µm)

                                                                                                                                                                                                                                                                                                                                                         lated similarly to the samples left in the dark for 1 month –
  significant chiton grazing
   developing conceptacle
   41 specs with regrowth

     12 specimens with

                                                                                                                                                                                                                                                                                                                                                         also showed distinctive scar regrowth (Figs. 9c, 10d).
      6 specimens with

                                                                                                                                   Monthly
                                    42/39

                                                                                                                                                                                                                                                                                                                                                            Wound recovery, both in the light and dark, was initiated
                                                              28
                                                              37
                                                              39
                                                              50
                                                              23
                                                              42
                                                              49
                                                              44

                                                                                                                                                                                                                                                                                                                                                         with large primordial cells and several typical wound repair
                                                                                                                                                                                                                                                                                                                                                         cells, followed by the development of typical anatomical tis-
                                             65 specs total

                                                                                                                                   Examined

                                                                                                                                                                                                                                                                                                                                                         sue with the formation of perithallium, meristem, and ep-
                                                                                                                                                          # specs

                                                                                                                                                                                                                                                                                                                                                         ithallium cells (Fig. 9). Calcification in the newly formed
                                                              10
                                                              12

                                                                                                                                                                                                                                                                                                                                                         tissues, with both radial inner-wall calcite and large diago-
                                                               3
                                                               8
                                                               8
                                                               8
                                                               8

                                                               8

                                                                                                                                                                                                                                                                                                                                                         nal interfilament crystals, is quite similar to that in lighted,
                                                                                                                                                                                                                                                                                                                                                         wound regrowth tissue and in normal tissue (Fig. 10b, c, e).
                                                                                                                                                                                                                                                                                                                                                         The full thickness of interfilament calcite that is often viewed
                                                                                                                                                                                                                                                                                                                                                         in mature summer growth of normal vegetative tissues of C.
                                                                                                                                                                                                                                                                                                                                                         compactum, and seen in lighted scar regrowth (Fig. 10e),

Biogeosciences, 15, 5745–5759, 2018                                                                                                                                                                                                                                                                                                                                                         www.biogeosciences.net/15/5745/2018/
S. Williams et al.: Effects of light and temperature on Mg uptake, growth, and calcification                                                        5755

has not developed in these dark specimens (Fig. S2a). All                            12
                                                                                     18

three specimens that showed regrowth in the dark came from                                                                                          (a)
the 4 ◦ C experimental tank. The average rate of wound re-                           16
growth measured in these dark specimens, at 30 µm month−1 ,
is considerably less than the 51 µm month−1 mean found in                            14
                                                                                                                              y = 0.23x + 13.89
                                                                                                                                   R² = 0.72
all lighted wound regrowth in the 4 ◦ C tank (Table 4). In ad-

                                                                   MgCO3 [ mol%]
dition, it is unlikely that the experimental scarring affected
later growth because the typical specimen used in the study                         1012
                                                                                      18 0      2      4          6            8            10      (b)12
was about 4 cm in diameter, while the scars were about 1 mm                                                Temperature[   °C] R² = 0.81
wide and 4 mm long. The entire photosynthetic surface of the                                                                  R² = 0.55
                                                                                     16
typical specimen was about 1200 mm2 , and the scar less than
                                                                                                                              R² = 0.63
4 mm2 , about 1/400th of the surface. Since lateral transloca-
tion in the shallow coralline crust is widespread (Adey et al.,                      14                                            High light

2018), it seems further unlikely that the scar would have af-                                                                      Medium light

fected growth following wound repair growth. In addition,                            12
                                                                                                                                   Low light

the second scarring, typically placed about 1 cm from the                                 0     2      4         6             8               10     12
initial scar, took place 6–9 months after the first, making it                                             Temperature [°C]

unlikely that the first scarring affected growth in the second,
                                                                   Figure 12. (a) Electron-microprobe-derived MgCO3 concentra-
dark experiment. In short, while dark wound regrowth occurs
                                                                   tions (± standard error) of each temperature treatment group after
and appears to have all the anatomical and calcified cell wall     averaging all light levels. (b) Electron-microprobe-derived MgCO3
features of normal wound repair tissues, growth rates, at the      concentrations (± standard error) of each temperature/light treat-
same temperature, appear to be slower.                             ment group.

3.2     Effects of temperature and light on algal MgCO3
                                                                   The regressions were as follows.
The MgCO3 of samples from high-light treatments had
                                                                   High light
the most significant correlation with temperature (ANOVA:
variation within the samples; F(1,38) = 13.75, p
5756                                        S. Williams et al.: Effects of light and temperature on Mg uptake, growth, and calcification

                20                                                                                0.2

                                                                                 MgCO3 [mol %]
                18                                                                                                                                         Mean
                                                                                                                                                           summer
                                                                                                 0.16
MgCO3 [mol %]

                16
                                                                                                 0.12

                14                                                                                                                                         Mean
                                                                                                                                                           winter

                                                                                                 0.08
                12                                                                                      1.5             2                            2.5     3
                                                                                                                            Depth in specimen [mm]

                10                                                               Figure 14. Annual cycles of MgCO3 content of C. compactum
                     0.5   High light   1.5 Medium light 2.5   Low light   3.5   mound from 15 to 20 m in the Kingitok Islands in north-central
                                                                                 Labrador. Cycles show V-shaped pattern, indicating growth halt
 Figure 13. MgCO3 concentrations at each experimental light level                during winter. Water temperature at Kingitok is below 0 ◦ C for over
 (all temperatures combined).                                                    200 days per year, and sea surface is typically frozen from early
                                                                                 December to late June (Adey et al., 2015).

                                                                                 controlled by light and temperature and abundantly provided
 light level) for an approximate period of 8 months (allowing                    in the literature (Adey et al., 2015).
 1.5 months for specimen acclimatization), or approximately
 120–400 µm per year. Thus, the growth rate values found in                      4.2                    Dark growth and calcification
 this study are well within the expected range in the wild.
 Beginning 6 months into the experiment, fully grown-in                          This experiment has demonstrated a strong connection be-
 grooves began to be seen. This suggests an even greater dif-                    tween light and MgCO3 , while Nash and Adey (2017) have
 ferential between wound recovery rate and expected whole-                       shown Mg control only by temperature. However, in the
 crust growth rate. Unfortunately, in this experiment, it was                    latter study, light was not a control, other than as a basic
 not possible to consistently achieve a tank temperature be-                     metabolic requirement. Our experiment demonstrated that
 low 2 ◦ C. Most C. compactum populations are in locali-                         growth, with the full complex of cell wall calcification, can
 ties that reach 0 ◦ C or below during the winter. Thus, tank                    occur without simultaneous light, presumably as long as
 growth could not be precisely compared with wild growth.                        stored photosynthate is available.
 Clearly, the relatively rapid rate of wound recovery is nec-                       Calcification in the dark indicates that photosynthesis is
 essary if an even surface on C. compactum mounds is to be                       not the direct driver of calcification by altering local chem-
 maintained and detritus accumulation avoided. Such recov-                       istry. The availability of stored food previously formed by
 ery from wounding and conceptacle breakout is frequently                        photosyntheses, growth, and calcification is driven metabol-
 seen in wild-collected specimens (Adey et al., 2013). Chiton                    ically. The initiation of the calcite crystal formation cannot
 grazing is likely a factor in the delay or absence of scar tissue               be dependent on photosynthetically elevated pH, as has been
 in some plants. However, rapid wound recovery demonstrates                      proposed in various studies. C. compactum specimens grown
 that temperature and light do not provide short-term controls                   in the wild under Arctic conditions of 6 months of darkness
 on growth and calcification rates.                                              consistently show a sharp downward spike in Mg content at
    Growth and calcification are clearly metabolically driven;                   the equivalent of 0 to −1.8 ◦ C water temperature (Fig. 14).
 when a wounded crust can draw upon photosynthates, stored                       Full darkness, often under ice cover, occurs before the tem-
 or in photosynthetic production, from other parts of the crust,                 perature reaches its lower limits on the bottom where the
 higher rates than normal vegetative growth under given tem-                     plants are growing. To produce carbonate with MgCO3 ra-
 perature/light conditions are achievable. Arctic/subarctic C.                   tios equivalent to a water temperature of −1 ◦ C, growth has
 compactum crusts must store photosynthate for an extended                       to have occurred in dark conditions for some period of time.
 dark season. The growth rate that can be accomplished in the                    As we see from this experiment, growth could proceed for at
 short term, to repair damage using stored energy, is clearly                    least 2 months before likely ceasing when sufficient stored
 not an option for normal vegetative crust growth. Normal                        photosynthate is exhausted.
 crust vegetative growth, with energy supplied from epithal-
 lial photosynthesis, must provide not only for local growth
 but also for annual reproduction, lateral growth, and wound
 repair. Thus, the wound repair rates seen here are higher than
 the month-to-month growth potential of C. compactum as

 Biogeosciences, 15, 5745–5759, 2018                                                                                 www.biogeosciences.net/15/5745/2018/
S. Williams et al.: Effects of light and temperature on Mg uptake, growth, and calcification                                  5757

4.3   Light and temperature                                         because it is the only high-resolution shallow-marine archive
                                                                    found in seasonally ice-covered regions of the Arctic, includ-
Results show that both light and temperature significantly af-      ing the Greenland coast (Jørgensbye and Halfar, 2016), the
fect magnesium in C. compactum crusts. At lower temper-             Canadian Arctic Archipelago, northern Labrador (Halfar et
atures (2 ◦ C) the effects of light are relatively small, relat-    al., 2013), Novaya Zemlya (Adey et al., 2015b), and Sval-
ing to a 1.4 mol % MgCO3 (corresponding to 8.75 ◦ C on the          bard (Wisshak et al., 2016).
low-light curve and 5.4 ◦ C on the high-light curve) increase          While the findings of this experiment should inform the
from low to high light. Differences become larger at higher         use of replication and calibration of individual samples to
temperatures (10 ◦ C), where MgCO3 increases by 1.8 mol %           improve the use of C. compactum as a climate proxy, they
(corresponding to 11.25 ◦ C on the low-light curve and 6.9 ◦ C      do not discount the results of past environmental reconstruc-
on the high-light curve) from low to high light levels. Also,       tions using this species. For example, Williams et al. (2014)
at higher light levels R 2 values indicate a stronger correlation   used Clathromorphum sp. to reconstruct past temperature
between MgCO3 and temperature (Fig. 12b). These observa-            and tested the calibration between Mg / Ca and instrumen-
tions suggest that light and temperature both result in an in-      tal temperature of each sampling location. Also, Halfar et
crease in MgCO3 and growth, with the effects of light being         al. (2013) combined annual growth and Mg / Ca concentra-
more significant at higher temperatures as shown previously         tions from C. compactum to reconstruct sea ice conditions,
for other coralline species (Adey, 1970).                           based on the assumption that these records respond to both
                                                                    light and temperature. While the influence of both light and
4.4   Implications for proxy                                        temperature on growth rates of several species of corallines
                                                                    has already been demonstrated (Adey, 1970), their influences
Results show that, although temperature is a major factor           on Mg have now also been confirmed. Based on our find-
contributing to C. compactum MgCO3 incorporation, light             ings, the results of past studies would only be untrustworthy
must be considered when using C. compactum as a proxy.              if a calibration from another study or location was used to
Our findings suggest that a global MgCO3 –temperature cali-         convert Mg / Ca to temperature without confirming this rela-
bration cannot be produced for C. compactum, because light          tionship.
levels and shading contribute to differences in MgCO3 within
individuals or a large sample. The highest correlation be-
tween temperature and MgCO3 was found when all experi-              5   Conclusions
mental samples were combined regardless of light level, sug-
gesting that due to inter- and intra-sample variability repli-      C. compactum produces its normal range of tissues with sim-
cation is very important when generating temperature recon-         ilarly complex high-magnesium calcitic wall structures both
structions, rather than attempting to collect all samples from      in the light and in the dark. Growth and calcification occur for
similar light conditions. The need for replication caused by        at least 2 months in the dark, presumably following the ex-
inter-specimen differences has also been highlighted in sev-        haustion of stored photosynthate. Following the formation of
eral studies of Clathromorphum sp. (Hetzinger et al., 2018;         a few distinctive initial primordial and transition cells, wound
Williams et al., 2014, 2018).                                       repair (scar) tissue is similar to normal perithallial tissue,
   The effects of light on MgCO3 may explain differences in         although wound repair tissue grows at significantly greater
Mg / Ca of samples collected from the same site and water           rates than normal tissue. Since the autumn/winter forma-
depth found in several C. compactum climate reconstruction          tion of reproductive structures (conceptacles) requires veg-
studies (Chan et al., 2011; Williams et al., 2014). Differen-       etative tissue growth and calcification of surrounding veg-
tial shading can be due to temporary macroalgal overgrowth          etative tissues, calcification in the dark allows for the sur-
or the position of the coralline algae, such as under a ledge       vival of C. compactum under sea ice cover and in Arctic win-
or orientation with respect to the surface. In these cases, dif-    ter darkness. Both light and temperature significantly affect
fering light levels would necessitate sample-specific calibra-      the incorporation of MgCO3 in C. compactum calcitic cell
tions. This would imply calibrating Mg / Ca for each indi-          wall structures. At lower temperatures the effects of light
vidual sample with known in situ temperature before aver-           are slightly smaller than at higher temperatures. Also, the
aging all samples to create a record. Applying this method          correlation between MgCO3 and temperature is stronger at
could prevent outlier samples that may have experienced sig-        higher light levels than at low light. When generating proxy
nificantly different light levels from having an effect on the      temperature reconstructions using Clathromorphum species,
proxy reconstruction.                                               site- and possibly specimen-specific temperature calibrations
   Experiment results also support the use of C. compactum          need to be applied in order to take into account the effects of
as a sea ice proxy, because Mg / Ca is driven by both light         light. Corallines, including Clathromorphum species, can be
and temperature. Changes in light duration on the Arctic            successfully grown in the laboratory and used for critical ex-
seafloor are related to sea ice and thus to coralline algal         perimentation. However, they are complex organisms with
Mg / Ca. C. compactum is especially suited as a sea ice proxy       equally complex ecological relationships, and mesocosms,

www.biogeosciences.net/15/5745/2018/                                                       Biogeosciences, 15, 5745–5759, 2018
5758                              S. Williams et al.: Effects of light and temperature on Mg uptake, growth, and calcification

rather than simple aquaria, are required to produce reliable               //www.sciencedirect.com/science/book/9780123706416 (last ac-
experimental results (Adey and Loveland, 2007; Small and                   cess: 20 January 2018), 2007.
Adey, 2001).                                                             Adey, W. H., Chamberlain, Y. M., and Irvine, L. M.: An SEM-
                                                                           based analysis of the morphology, anatomy, and reproduc-
                                                                           tion of Lithothamnion tophiforme (Esper) unger (Corallinales,
Data availability. Underlying research data can be accessed at http:       Rhodophyta), with a comparative study of associated North
//doi.org/10.5281/zenodo.1419109 (Williams et al., 2018 ).                 Atlantic arctic/subarctic melobesioideae, J. Phycol., 41, 1010–
                                                                           1024, https://doi.org/10.1111/j.1529-8817.2005.00123.x, 2005.
                                                                         Adey, W. H., Halfar, J., and Williams, B.: The coralline genus
                                                                           Clathromorphum Foslie emend. Adey, Smithson. Contrib. Mar.
The Supplement related to this article is available online                 Sci., 40, 1–41, 2013.
at https://doi.org/10.5194/bg-15-5745-2018-supplement.                   Adey, W., Halfar, J., Humphreys, A., Suskiewicz, T., Be-
                                                                           langer, D., Gagnon, P., and Fox, M.: Subarctic rhodolith
                                                                           beds promote longevity of crustose coralline algal buildups
                                                                           and their climate archiving potential, Palaios, 30, 281–293,
                                                                           https://doi.org/10.2110/palo.2014.075, 2015a.
Author contributions. WA, PG, and DB planned this study; WA,             Adey, W. H., Hernandez-Kantun, J. J., Johnson, G., and Gabrielson,
PG, and DB set up the experiment; and PG and DB ran the experi-            P. W.: DNA sequencing, anatomy, and calcification patterns sup-
ment. SW, WA, AK, and MN analysed the samples, and SW and WA               port a monophyletic, subarctic, carbonate reef-forming Clathro-
processed the data. SW and WA led the writing of the manuscript,           morphum (Hapalidiaceae, Corallinales, Rhodophyta), J. Phycol.,
and all authors contributed to discussions in writing this manuscript.     51, 189–203, https://doi.org/10.1111/jpy.12266, 2015b.
                                                                         Adey, W. H., Hernandez-Kantun, J. J., Gabrielson, P. W., Nash,
                                                                           M. C., and Hayek, L. C.: Phymatolithon (Melobesioideae, Ha-
Competing interests. The authors declare that they have no conflict        palidiales) in the Boreal-Subarctic transition zone of the North
of interest.                                                               Atlantic: a correlation of plastid DNA markers with morpho-
                                                                           anatomy, ecology and biogeography, Smithson. Contrib. Mar.
                                                                           Sci., April, The journal name is: Smithsonian Contributions to
Acknowledgements. This work was funded by the Centre for                   the Marine Sciences, 41, 2018.
Global Change Science, the Geological Society of America, a              Burdett, H., Kamenos, N. A., and Law, A.: Using coralline algae to
Natural Sciences and Engineering Research Council of Canada                understand historic marine cloud cover, Palaeogeogr. Palaeocl.,
Discovery Grant to Jochen Halfar, and the Smithsonian Institution          302, 65–70, https://doi.org/10.1016/j.palaeo.2010.07.027, 2011.
and Ecological Systems Technology.                                       Chan, P., Halfar, J., Williams, B., Hetzinger, S., Steneck, R. S.,
                                                                           Zack, T., and Jacob, D. E.: Freshening of the Alaska Coastal Cur-
Edited by: Hiroshi Kitazato                                                rent recorded by coralline algal Ba / Ca ratios, J. Geophys. Res.,
Reviewed by: two anonymous referees                                        116, G01032, https://doi.org/10.1029/2010JG001548, 2011.
                                                                         Gamboa, G., Halfar, J., Hetzinger, S., Adey, W. H., Zack, T.,
                                                                           Kunz, B. E., and Jacob, D. E.: Mg / Ca ratios in coralline algae
                                                                           record northwest Atlantic temperature variations and North At-
References                                                                 lantic Oscillation relationships, J. Geophys. Res., 115, C12044,
                                                                           https://doi.org/10.1029/2010JC006262, 2010.
Adey, W. H.: The genus Clathromorphum (Corallinaceae) in the             Halfar, J., Steneck, R. S., Joachimski, M., Kronz, A., and Wana-
  Gulf of Maine, Hydrobiologia, 539–573, available from: http:             maker, A. D.: Coralline red algae as high-resolution climate
  //link.springer.com/article/10.1007/BF00045545 (last access: 15          recorders, Geology, 36, 463–466, 2008.
  May 2014), 1965.                                                       Halfar, J., Williams, B., Hetzinger, S., Steneck, R. S., Lebednik, P.
Adey, W. H.: The effects of light and temperature on growth rates          A., Winsborough, C., Omar, A., Chan, P., and Wanamaker, A.
  in Boreal-Subarctic crustose corallines, J. Phycol., 9, 269–276,         D.: 225 years of Bering Sea climate and ecosystem dynamics
  1970.                                                                    revealed by coralline algal growth-increment widths, Geology,
Adey, W. H.: Temperature control of reproduction and productivity          39, 579–582, https://doi.org/10.1130/G31996.1, 2011a.
  in a subarctic coralline alga, Phycologia, 12, 111–118, 1973.          Halfar, J., Hetzinger, S., Adey, W. H., Zack, T., Gam-
Adey, W. H.: Review Coral Reefs: Algal Structured and                      boa, G., Kunz, B. E., Williams, B., and Jacob, D. E.:
  Mediated Ecosystems in Shallow, Turbulent, Alkaline Wa-                  Coralline algal growth-increment widths archive North At-
  ters, J. Phycol., 406, 393–406, https://doi.org/10.1046/j.1529-          lantic climate variability, Palaeogeogr. Palaeocl., 302, 71–80,
  8817.1998.340393.x, 1998.                                                https://doi.org/10.1016/j.palaeo.2010.04.009, 2011b.
Adey, W. H. and Hayek, L.-A. C.: Elucidating marine biogeogra-           Halfar, J., Adey, W. H., Kronz, A., Hetzinger, S., Edinger, E.,
  phy with macrophytes: quantitative analysis of the North Atlantic        and Fitzhugh, W. W.: Arctic sea-ice decline archived by mul-
  supports the thermogeographic model and demonstrates a dis-              ticentury annual-resolution record from crustose coralline al-
  tinct subarctic region in the Northwestern Atlantic, Northeast.          gal proxy, P. Natl. Acad. Sci. USA, 110, 1973736–1973741,
  Nat., 18, 1–128, https://doi.org/10.1656/045.018.m801, 2011.             https://doi.org/10.1073/pnas.1313775110, 2013.
Adey, W. H. and Loveland, K.: Dynamic aquaria?: building and
  restoring living ecosystems, Academic, available from: https:

Biogeosciences, 15, 5745–5759, 2018                                                            www.biogeosciences.net/15/5745/2018/
You can also read