Novel diagnostic and therapeutic techniques reveal changed metabolic profiles in recurrent focal segmental glomerulosclerosis
←
→
Page content transcription
If your browser does not render page correctly, please read the page content below
www.nature.com/scientificreports
OPEN Novel diagnostic and therapeutic
techniques reveal changed
metabolic profiles in recurrent focal
segmental glomerulosclerosis
Janina Müller‑Deile1,12*, George Sarau2,3,4,12, Ahmed M. Kotb1,5, Christian Jaremenko4,6,
Ulrike E. Rolle‑Kampczyk7, Christoph Daniel8, Stefan Kalkhof9,10, Silke H. Christiansen2,3,4,11 &
Mario Schiffer1
Idiopathic forms of Focal Segmental Glomerulosclerosis (FSGS) are caused by circulating permeability
factors, which can lead to early recurrence of FSGS and kidney failure after kidney transplantation.
In the past three decades, many research endeavors were undertaken to identify these unknown
factors. Even though some potential candidates have been recently discussed in the literature, “the”
actual factor remains elusive. Therefore, there is an increased demand in FSGS research for the use
of novel technologies that allow us to study FSGS from a yet unexplored angle. Here, we report
the successful treatment of recurrent FSGS in a patient after living-related kidney transplantation
by removal of circulating factors with CytoSorb apheresis. Interestingly, the classical published
circulating factors were all in normal range in this patient but early disease recurrence in the transplant
kidney and immediate response to CytoSorb apheresis were still suggestive for pathogenic circulating
factors. To proof the functional effects of the patient’s serum on podocytes and the glomerular
filtration barrier we used a podocyte cell culture model and a proteinuria model in zebrafish to detect
pathogenic effects on the podocytes actin cytoskeleton inducing a functional phenotype and podocyte
effacement. We then performed Raman spectroscopy in the < 50 kDa serum fraction, on cultured
podocytes treated with the FSGS serum and in kidney biopsies of the same patient at the time of
transplantation and at the time of disease recurrence. The analysis revealed changes in podocyte
metabolome induced by the FSGS serum as well as in focal glomerular and parietal epithelial cell
regions in the FSGS biopsy. Several altered Raman spectra were identified in the fractionated serum
and metabolome analysis by mass spectrometry detected lipid profiles in the FSGS serum, which were
supported by disturbances in the Raman spectra. Our novel innovative analysis reveals changed lipid
metabolome profiles associated with idiopathic FSGS that might reflect a new subtype of the disease.
Primary focal segmental glomerulosclerosis (FSGS) is a rare disease with an estimated incidence of about 7 per
1 million1. However, it is still one of the most prevalent nephropathies causing end-stage renal d
isease2,3. FSGS
is a morphologic pattern of glomerular injury defined by the presence of sclerosis in parts (segmental) of some
(focal) glomeruli and global podocyte foot process effacement in all glomeruli. Subclasses of FSGS include pri-
mary (idiopathic), genetic and secondary forms. Despite sharing certain clinical and histologic features, these
1
Department of Nephrology and Hypertension, Friedrich-Alexander-University (FAU) Erlangen-Nuremberg,
Erlangen, Germany. 2Fraunhofer Institute for Ceramic Technologies and Systems IKTS, Dresden, Germany. 3Leuchs
Emeritus Group, Max Planck Institute for the Science of Light, Erlangen, Germany. 4Institute for Nanotechnology
and Correlative Microscopy eV INAM, Forchheim, Germany. 5Department of Anatomy and Histology, Faculty
of Veterinary Medicine, Assiut University, Asyût, Egypt. 6Institute of Optics, Information and Photonics,
Friedrich-Alexander-University (FAU) Erlangen-Nuremberg, Erlangen, Germany. 7Department Molecular Systems
Biology, Helmholtz Centre for Environmental Research, Leipzig, Germany. 8Department of Nephropathology,
Friedrich-Alexander-University (FAU) Erlangen-Nuremberg, Erlangen, Germany. 9Institute for Bioanalysis,
University of Applied Sciences Coburg, Coburg, Germany. 10Department of Molecular Systems Biology,
Helmholtz-Centre for Environmental Research-UFZ, Leipzig, Germany. 11Physics Department, Freie Universität
Berlin, Berlin, Germany. 12These authors contributed equally: Janina Müller-Deile and George Sarau. *email:
janina.mueller-deile@uk-erlanngen.de
Scientific Reports | (2021) 11:4577 | https://doi.org/10.1038/s41598-021-83883-w 1
Vol.:(0123456789)
www.nature.com/scientificreports/
subclasses differ in management and prognosis4. Distinguishing between different forms of FSGS is important to
avoid unnecessary immunosuppressive treatments in case of secondary forms and most genetic forms5. Second-
ary FSGS is the consequence of other underlying chronic diseases such as diabetes, obesity, HIV, hypertension
and other glomerular diseases. Genetic FSGS results from defects in podocyte genes and is often steroid resistant.
Mutations in more than 30 recessive or dominant genes were identified for monogenic forms of steroid resist-
ant nephrotic syndrome. Recessive mutations in nephrin (NPHS1), podocin (NPHS2), CD2 associated protein
(CD2AP), laminin β2 (LAMB2), integrin, phospholipase C epsilon 1 (PLCE1), protein tyrosine phosphatase
receptor type O (PTPRO) and alpha 3 (ITGA3) are only some examples. Dominant mutations include actin alpha
4 (ACTN4), inverted formin 2 (INF2), anillin (ANLN), transient receptor potential cation channel (TRPC6)
and Wilms tumor 1 (WT1)6.
In contrast, idiopathic FSGS-forms are most likely caused by circulating permeability factors. Soluble uroki-
nase plasminogen activator receptor (suPAR), cardiotrophin-like cytokine factor-1 (CLCF1) and sCD25 have
been postulated as such permeability factors in F SGS7–10. However, it remains to be determined whether these
factors are truly pathogenic, specific, sensitive and reproducible in all patients and just like the genetic forms it is
likely that this disease category represents only a subgroup of diseases and that not only one but several different
or a combination of circulatory factors exist.
The incidence of FSGS is increasing across the entire age spectrum w orldwide11. Rapid onset of heavy pro-
teinuria in a nephrotic range, hypoalbuminemia and edema are typical symptoms and sings of primary FSGS.
FSGS non-responsive to steroid treatment has a high risk to progress to end stage kidney disease and second
line treatment is often not effective or disrupted due to side effects. Moreover, patients who progress to end stage
kidney disease and receive a kidney transplant have a 20 to 30% risk of FSGS recurrence in their kidney g raft11,12.
There is an unmet clinical need for early and specific biomarkers to detect FSGS and to predict its prognosis
and response to therapy. So far, diagnostic and therapeutic decisions are based on unspecific markers as pro-
teinuria, serum creatinine as well as renal histology. However, even by histology the actual disease of the patients
might be misinterpreted, as FSGS is a focal disease vulnerable to sampling errors in the biopsy13.
Here we report CytoSorb apheresis as a novel therapeutic approach to bring recurrent FSGS in remission in
a patient that was nonresponsive to immunosuppressive therapy and plasmapheresis. We report an innovative
zebrafish model to detect the presence of circulating permeability factors causing FSGS that might be used as
non-invasive diagnostic test in the future. In order to characterize idiopathic FSGS on cell, serum and tissue level,
we performed Raman spectroscopy in podocytes treated with the patient’s serum and control serum, in < 50 kDa
serum fractions for FSGS patient and four control patients and on renal biopsies of a patient at the time of kidney
transplantation, at the time of FSGS recurrence and in a biopsy with minimal change disease. Vertical differences
in Raman intensities represent changes in component concentrations. Horizontal shifts in Raman signals are
due to slight differences in molecular vibrations caused by modifications in the molecule composition. Both,
Raman signals corresponding to changes in lipid concentrations as well as lipid composition were found in FSGS
patient samples at the time of disease recurrence. Assignment of Raman bands in the FSGS biopsy to published
metabolites corresponded to mass spectrometry findings. Serum metabolome analysis was able to detect meta-
bolic changes in the patient’s serum during the active phase of the disease. Previously described circulating factor
were detectable in the normal range. Therefore, we hypothesize that these metabolomic signatures indirectly
reflects the effects of the unknown circulating factors in the kidney or that these metabolome changes might
even represent the pathogenic components themselves.
Results
CytoSorb apheresis to treat for treatment resistant and recurrent FSGS. Treatment options for
FSGS caused by circulating factors are limited and often unsuccessful. We report a 24-year-old woman with
nephrotic syndrome and biopsy proven FSGS in her native kidneys (Fig. 1Aa,b). Clinical history for secondary
FSGS was negative and genetic testing did not reveal reported mutations in podocyte genes. Different treatment
regimens including steroids, cyclosporine A, mycophenolate mofetil, rituximab and even plasmapheresis were
unsuccessful and within 12 months after initial diagnosis, the patient developed end stage renal disease and
was started on hemodialysis. Two years later, the patient received a living-related donor kidney transplantation
from her mother. Primary renal transplant function was very good. Serum creatinine decreased to 1.14 mg/dl
10 days after transplantation and no significant proteinuria was detectable. However, 1 month after transplanta-
tion, the patient developed proteinuria with a urine-creatinine-protein-ratio (UPC-ratio) of 3 g/mg creatinine.
Transplant kidney biopsy showed podocytopathy with podocyte effacement, which confirmed recurrent dis-
ease (Fig. 1Ac,d). The patient received intravenous corticoid treatment and two doses of rituximab (1 g) within
2 weeks. Despite of this therapy proteinuria did not respond. Given the early recurrence of significant proteinu-
ria shortly after transplantation, we hypothesized the presence of a circulating permeability factor causing the
disease. Due to the severity and rapid progression of the primary disease, the early recurrence after transplanta-
tion and the past medical history where the disease in the native kidneys was refractory to established treatment
regimens, we decided to treat the patient with CytoSorb apheresis as a compassionate use approach. Initially,
CytoSorb apheresis was performed daily for 4 days. Proteinuria immediately decreased to 327 mg/g creatinine
and CytoSorb apheresis treatment schedule was reduced to once a week (Fig. 1B). However, proteinuria rapidly
relapsed to 4235 mg/g creatinine so that CytoSorb treatment frequency was increased again until the patient
developed clinical remission. However, a week later proteinuria again relapsed (3686 mg/g creatinine) (Fig. 1B).
A third time CytoSorb apheresis was performed daily and brought the patient back into remission. After addi-
tional therapy with rituximab, CytoSorb treatment was tapered to once a week. Since then, the patient was in
remission with proteinuria around 0.5 mg/g creatinine and serum creatinine around 1.5 mg/dl under CytoSorb
treatment every second week. We follow this patient now for more than 2 years with an excellent transplant
Scientific Reports | (2021) 11:4577 | https://doi.org/10.1038/s41598-021-83883-w 2
Vol:.(1234567890)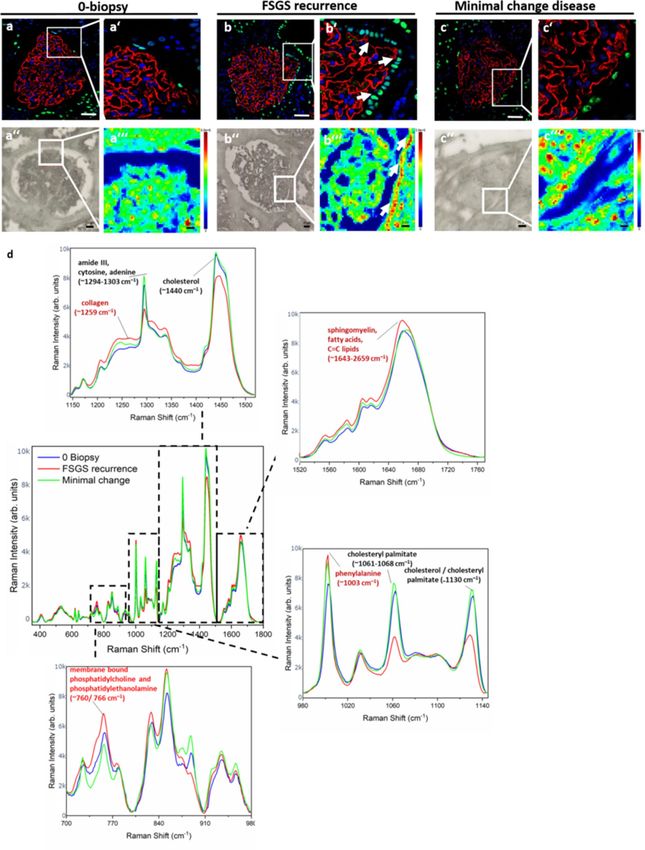
www.nature.com/scientificreports/

                                  Figure 1.  CytoSorb apheresis to treat therapy resistant and early recurrent FSGS. (A)—(a) PAS staining of
                                  native kidney biopsy of the patient at the time of initial diagnosis of FSGS. Scale bar = 100 µm. (b) Transmission
                                  electron microscopy picture of native kidney biopsy of the patient at the time of initial diagnosis of FSGS. Scale
                                  bar = 1 µm. (c) PAS staining of transplant kidney biopsy of the patient at the time of the diagnosis of recurrence
                                  of podocytopathy. Scale bar = 100 µm. (d) Transmission electron microscopy picture of transplant kidney biopsy
                                  of the patient at the time of the diagnosis of recurrence of podocytopathy. Scale bar = 1 µm. (B) Illustration of
                                  clinical course of the patient. Proteinuria measured as urine-protein-creatinine-ratio (UPC-ratio) is given in
                                  black dots and lines. Time points of kidney transplantation, transplant kidney biopsy, Rituximab treatment and
                                  CytoSorb apheresis schedule are illustrated. (C) Measurements for suPAR (a), sCD25 (b) and CLCF1 (c) in
                                  serum samples of the patient before and after first, second and third CytoSorb apheresis. The last two columns
                                  depict the mean of measurements for the parameters before and after apheresis 1–3. Normal reference levels
                                  are shown in gray. Differences before and after CytoSorb apheresis were not significant for suPAR, CLCF1 and
                                  sCD25.

                                  function and have so far not been able to wean the patient completely from CytoSorb apheresis. All attempts to
                                  increase the time between the treatment cycles have failed. Of note, if the patient is missing a session (e.g. due
                                  to a holiday) proteinuria immediately increases and rituximab treatments had to continue in 6 months intervals
                                  (data not shown). We measured proposed circulating permeability factors in the patient’s serum before and after
                                  first, second and third CytoSorb apheresis. suPAR (< 4000 pg/ml) and sCD25 (< 500 U/ml) were in normal range
                                  before the first apheresis and decreased not significantly in response to CytoSorb treatments (Fig. 1Ca,b). Serum
                                  concentration of CLCF1 was 1.67 ng/ml at the time of FSGS recurrence and decreased to 0.82 ng/ml after the 3rd
                                  CytoSorb treatment (Fig. 1Cc). In serum samples from healthy controls, concentrations of CLCF1 were between
                                  0 ng/ml (66% of controls) and 1.2 ng/ml. Cathepsin L (undetectable) and IL6 (< 2 pg/ml) were also not elevated
                                  in the patient’s serum (data not shown).

                                  Ex vivo tests to detect morphological changes in podocytes caused by FSGS serum. Even
                                  though published circulating factors were in normal range or not detectable in our patient, the early disease
                                  recurrence after kidney transplantation and the immediate response to CytoSorb treatment were still suggestive
                                  for a disease-causing factor in the patient’s circulation. To screen for functional impacts of the patient’s serum

Scientific Reports |   (2021) 11:4577 |                https://doi.org/10.1038/s41598-021-83883-w                                                  3

                                                                                                                                              Vol.:(0123456789)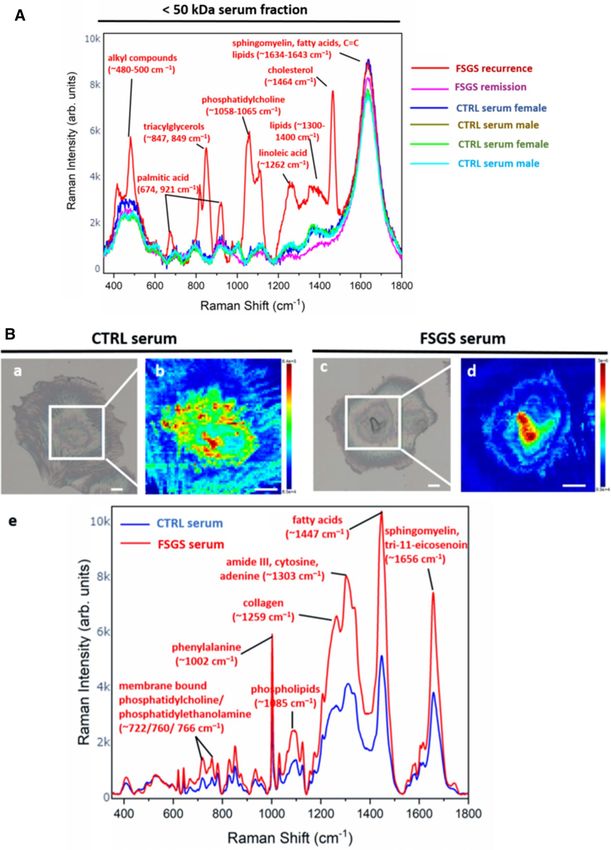
www.nature.com/scientificreports/

          Scientific Reports |   (2021) 11:4577 |   https://doi.org/10.1038/s41598-021-83883-w   4

Vol:.(1234567890)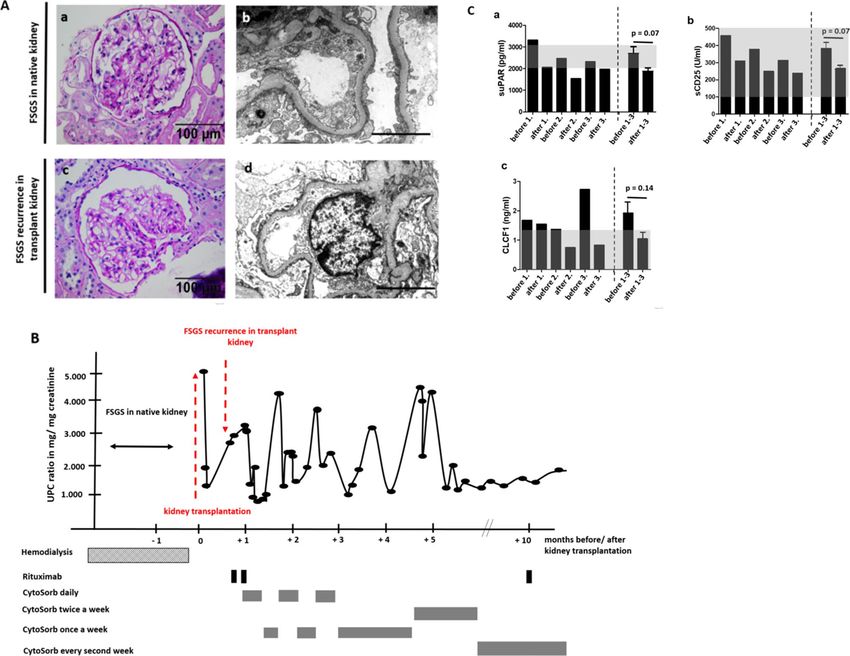
www.nature.com/scientificreports/
◂Figure 2. Cell culture and zebrafish assay to detect morphological and functional effects of unknown
circulating permeability factors in FSGS. (A)—(a) Representative images of cultured differentiated human
podocytes treated with 10% serum from a healthy control (CTRL serum), the patient with recurrent FSGS in
the kidney transplant and a patient with membranous glomerulonephritis (incubation for 0 h, 3 h and 6 h).
Cells were stained with phalloidin for cytoskeleton labeling. White arrows indicate cytoskeleton rearrangement.
Scale bar = 25 µm. (b) Quantification of stress fiber formation in podocytes after treatment with different sera
of patients. Type A: more than 90% of cell area filled with thick cables; type B: at least 2 thick cables running
under nucleus and rest of cell area filled with fine cables; type C: no thick cables, but some cables present; type
D: no cables visible in the central area of the cell. (B) Zebrafish assay for the detection of circulating permeability
factors. (a) Representative image of a transgenic Tg(l-fabp:VDBP:eGFP) zebrafish larvae (VDBP:eGFP) injected
with serum: dextran texas red into the zebrafish circulation (Dextran c.v. injection) at 48 hpf. Proper injection
leads to red fluorescence of the zebrafish vascularization. Expression of the green fluorescent vitamin D binding
protein just started. Scale bar = 500 µm. (b) At 120 hpf injected Tg(l-fabp:VDBP:eGFP) zebrafish express green
fluorescent vitamin D binding protein (VDBP:eGFP) in the circulation. Red fluorescent serum: dextran mixture
is still detectable in the circulation (dextran) and merges with the green fluorescent vitamin D binding protein
(merge). The zebrafish eye is enlarged to show the retinal plexus. (c) Tg(l-fabp:VDBP:eGFP) transgenic zebrafish
can be used to indirectly monitor proteinuria. Loss of green fluorescent protein in FSGS serum injected fish
leads to reduced GFP signal in the retinal vessels where it can easily be quantified. Quantification of loss of
fluorescent vitamin D binding proteins was done by measuring maximum GFP fluorescence in the retinal vessel
plexus of Tg(l-fabp:VDBP:eGFP) zebrafish larvae at 120 hpf. Zebrafish larvae were injected with serum: dextran
mixture from a healthy control and from a patient with FSGS recurrence in the kidney transplant at 48 hpf.
*p < 0.05. n = 107. Scale bar = 500 µm. (d) Cryo sections of Tg(l-fabp:VDBP:eGFP) transgenic zebrafish larvae
at 120 hpf showing systemic decrease in VDBP:eGFP in the systemic vascular system in FSGS serum injected
zebrafish as a hint for proteinuria. Zebrafish were injected with serum from CTRL or FSGS patient at the time
of disease recurrence. Scale bar = 100 µm. (e) Immunofluorescence staining for nephrin in FSGS and CTRL
serum injected zebrafish at 120 hpf. Zebrafish larvae were injected with serum from a healthy control and from
a patient with FSGS recurrence in the kidney transplant at 48 hpf. Scale bar = 100 µm. (f) Electron microscopy
picture of the glomerular filtration barrier of 5 day old zebrafish larvae that were injected with either serum of
the patient from the time of FSGS recurrence or with CTRL serum at 48 hpf. Black arrow head shows podocyte
effacement. Scale bar = 500 nm. hpf: hours post fertilization, VDBP: Vitamin D binding protein.
on podocytes we used a cell-based ex vivo screening model. Differentiated human podocytes were cultured in
the presence of serum from our patient with FSGS at the time of recurrence in transplant kidney and before
the first CytoSorb treatment (FSGS serum) and compared to podocytes cultured in the presence of serum of
a transplanted FSGS patient without a relapse in the transplant (CTRL serum) as well as serum from a patient
with membranous glomerulonephritis (MGN serum) for three and 6 h. For quantification of changes in actin
cytoskeleton of podocytes, we used a scoring system published earlier (cell type A–D, see “Methods”)14–16.
Type A actin arrangement with more than 90% of cell area filled with thick cables was significantly less abun-
dant whereas type B and C with no thick cables and no cables in the central area of the cell were significantly
more often after podocytes were exposed to serum derived from our patient with recurrent FSGS. In contrast,
serum from a nephrotic patient with MGN did not induce cytoskeletal changes (Fig. 2Aa,b). Thus, the in vitro
assay indicates the presence of unknown pathogenic circulating factors.
To test if these factors would also induce increased permeability of the glomerular filtration barrier, we used
our zebrafish model for proteinuria screening. The zebrafish is an ideal model system for glomerular diseases as
the zebrafish larvae develops a pronephros which is morphological almost indistinguishable from the human
glomerulus and genes are highly conserved between zebrafish and human. In the past, we successfully used this
zebrafish model to screen for proteinuria after genetic knockdown using morpholinos17–24. We usually use a trans-
genic zebrafish line that expresses a fluorescent Vitamin D binding plasma protein Tg(l-fabp:VDBP:eGFP fish)
to indirectly measure proteinuria25. If plasma proteins are retained in the vascular system, the fluorescent signal
from the Vitamin D binding protein can easily be detected in the retinal vessels of the zebrafish (Fig. 2Ba,c). In
case of proteinuria, the fluorescent signal decreases17–21,26. Given the idea of an unknown circulating permeability
factor, we refined our zebrafish model by injecting patient serum that was mixed 1:1 with red fluorescent dextran
to control proper injection procedure in the zebrafish circulation at 48 h post fertilization (hpf) (Fig. 2Ba,b).
Compared to zebrafish that were injected with serum from a healthy control, zebrafish injected with serum from
the patient with recurrent FSGS developed lost high molecular weight plasma proteins at 120 hpf (Fig. 2Bc,d). In
contrast, FSGS serum at the time of remission did not cause proteinuria (supplementary Fig. S1). We performed
immunofluorescent staining and transmission electron microscopy of the zebrafish pronephros of fish that
were injected with the serum of the FSGS patient from the time of disease recurrence and could show reduced
nephrin expression (Fig. 2Be) and podocyte effacement compared to CTRL serum injected zebrafish (Fig. 2Bf).
Taken together these tests proved that our patients FSGS serum contains a so far unknown permeability
factor that acts on the podocyte cytoskeleton and changes the permeability of the glomerular filtration barrier.
Raman spectroscopy reveals molecular fingerprint of FSGS serum and changes in podocyte
metabolome induced by FSGS serum. In order to further characterize this unknown factor, we used a
novel technique, which has so far not been used in the context of FSGS, Raman spectroscopy. This spectroscopy
method is a technique for optical characterization of the compositional properties of materials. It detects the
inelastic scattering of light from molecules, which results in a change in wavelength that corresponds to specific
Scientific Reports | (2021) 11:4577 | https://doi.org/10.1038/s41598-021-83883-w 5
Vol.:(0123456789)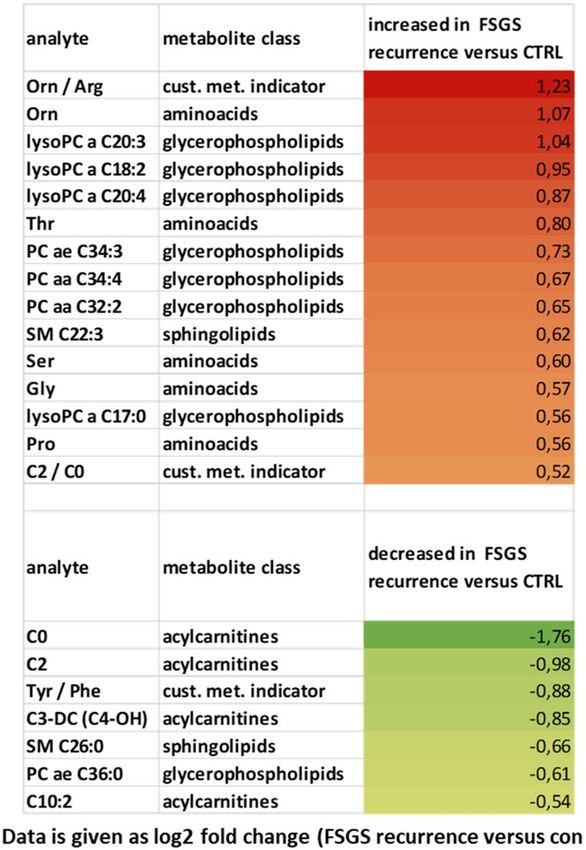
www.nature.com/scientificreports/
Raman shift Assignment Referencesa
–1 77,78
~ 417 c m Cholesterol
–1 85
~ 480–500 c m Alkyl components
–1 86
~ 674/912 cm Palmitic acid
–1 79,80
~ 720/780 c m DNA/RNA
–1 81,86
~ 722/718, 766 c m Membrane bound/free phosphatidylcholine
–1 77,79,80
~ 743 c m Thymine
–1 82
~ 760 c m Phosphatidylethanolamine
~ 847/849 c m–1 Triacylglycerols 86
~ 876/1058–1065 c m–1 Phosphatidylcholine 82,86
~ 1003/1030 c m–1 Phenylalanine 77,79,80
~ 1002/987 c m–1 Membrane bound/free phosphatidylcholine 81
~ 1068 c m–1 Cholesteryl palmitate 86
~ 1125 c m–1 Carbohydrates 70
–1 77,79,80
~ 1125/1580 c m Cytochrome c
–1 86
~ 1131 c m Cholesterol/cholesteryl palmitate
–1 79
~ 1259 c m Collagen
–1 86
~ 1262 c m Linoleic acid
–1 83
~ 1303 c m Amide III, cytosine, adenine
–1 77,79,80,84
~ 1433/1457 c m α(CH2/CH3) and β(CH2/CH3) of fatty acid
–1 86
~ 1442/1464 c m Cholesterol
~ 1643 c m–1 Sphingomyelin 56
~ 1656 c m−1 tri-11-eicosenoin 86
~ 1660 c m–1 Amide I 77,79
~ 1665 c m–1 CC lipids 77,79
Table 1. Raman spectra wavelength with corresponding published assignments . a Slight differences in Raman
shifts between measurements in this manuscript and references from the literature can be due to differences in
Raman laser energy and molecular composition.
molecular vibrational modes. As CytoSorb therapy eliminates molecules with a molecular weight below 50 kDa,
we analyzed the < 50 kDa serum fractions of the FSGS patient before the first CytoSorb apheresis at the time of
FSGS recurrence and at the time of remission as well as in four healthy control persons by Raman spectroscopy.
Raman shifts corresponding to alkyl components (~ 500 cm–1), phosphatidylcholine (~ 876 cm–1, ~ 1065 cm–1),
lipid fractions (~ 1300–1400 cm–1) and cholesterol (~ 1442 cm–1) were elevated at the time of FSGS recurrence.
In contrast, Raman signals of the < 50 kDa serum fraction at time of FSGS remission resembled the Raman
signal of < 50 kDa serum fraction of control persons (Table 1 and Fig. 3A). Thus, Raman spectroscopy revealed
a changed serum lipid metabolome in FSGS. Raw data of Raman intensity and Raman shift can be found in sup-
plementary table S1.
To explore the molecular basis of the patient’s serum-induced morphological changes on podocytes further
we performed Raman micro-spectroscopy mapping of cultured podocytes treated with FSGS serum and control
serum. Interestingly, the Raman signal intensity of cells treated with control serum for 6 h was less intense com-
pared to podocytes treated with FSGS serum (Fig. 3B). Among others, increased Raman signal shifts assigned
to membrane bound phosphatidylcholine/phosphatidylethanolamine (~ 722, 760, 766 cm–1), to phenylalanine
(~ 1003 cm–1), phospholipids (~ 1085 cm–1), fatty acids (~ 1447 cm–1 ) and to sphingolipid cluster (~ 1656 cm–1)
were detectable in podocytes treated with FSGS serum (Table 1). Raman signal corresponding to collagen showed
a vertical but also horizontal shift indicating collagen modification due to FSGS serum treatment. Raw data of
Raman signal intensity and Raman signal shift can be found in supplementary Table S2.
Taken together, changes in Raman signals in FSGS treated cultured human podocytes could mostly be attrib-
uted to cellular lipoproteins.
Raman spectroscopy gives a molecular fingerprint of recurrent FSGS on tissue level. To
explore if we can also get a molecular fingerprint of recurrent FSGS on tissue level, we performed Raman micro-
spectroscopy mapping on different glomerular regions of a kidney graft biopsy at time of transplantation (0
biopsy) (Fig. 4a’’,a‴) and at the time of FSGS relapse (FSGS recurrence) (Fig. 4b’’,b‴) and in a patient with
minimal change disease (Fig. 4c’’,c‴). Interestingly, increased Raman signal was detected in the region of pari-
etal epithelial cells in the Bowman’s capsule in the biopsy with FSGS recurrence indicating activation of these
cells (arrowheads in Fig. 4b′,b‴). We could detect an increase in Raman peak abundance for membrane bound
phosphatidylcholine and phosphatidylethanolamine, sphingomyelin, fatty acids and phenylalanine in the kid-
ney biopsy with FSGS relapse. Especially peak ratio between sphingomyelin and cholesterol and between sphin-
gomyelin and cholesteryl palmitate revealed the disturbance in lipids in kidney biopsy with FSGS relapse. Other
lipids like membrane bound phosphatidylcholine and phosphatidylethanolamine showed a vertical as well as
Scientific Reports | (2021) 11:4577 | https://doi.org/10.1038/s41598-021-83883-w 6
Vol:.(1234567890)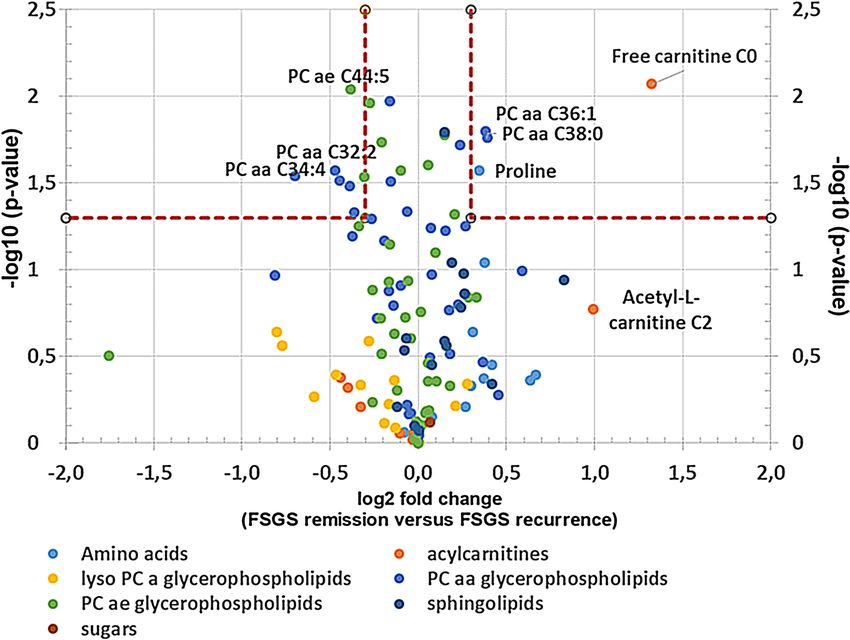
www.nature.com/scientificreports/

                                  Figure 3.  Raman spectroscopy reveals molecular fingerprint of FSGS serum and changes in podocyte metabolome
                                  induced by FSGS serum. (A) Mean Raman spectra of < 50 kDa serum fractions of FSGS at the time of disease
                                  recurrence (red), at the time of remission (purple) as well as of < 50 kDa serum fractions of four healthy control
                                  person (dark blue, green, brown and light blue). Different Raman signal corresponding mostly to lipoproteins
                                  were detected at the time of FSGS recurrence. Raman signals at the time of FSGS remission however resembled
                                  Raman signals of the CTRL serum fraction. Assignments of the Raman peaks according to the literature are given.
                                  (B) Representative bright field illumination (a,c) and heat map of Raman signal intensity (b,d) of cultured human
                                  podocytes treated with CTRL serum (a,b) and FSGS serum (c,d). Scale bar 10 µm. (e) Mean Raman spectra of three
                                  podocytes treated with FSGS serum (red line) and three podocytes treated with CTRL serum (blue line) showing
                                  increased Raman signal for FSGS treated cells.

Scientific Reports |   (2021) 11:4577 |                https://doi.org/10.1038/s41598-021-83883-w                                                      7

                                                                                                                                               Vol.:(0123456789)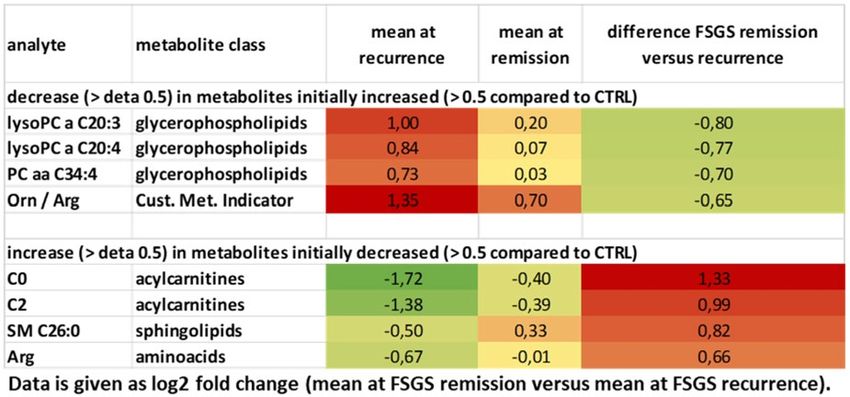
www.nature.com/scientificreports/

          Scientific Reports |   (2021) 11:4577 |   https://doi.org/10.1038/s41598-021-83883-w   8

Vol:.(1234567890)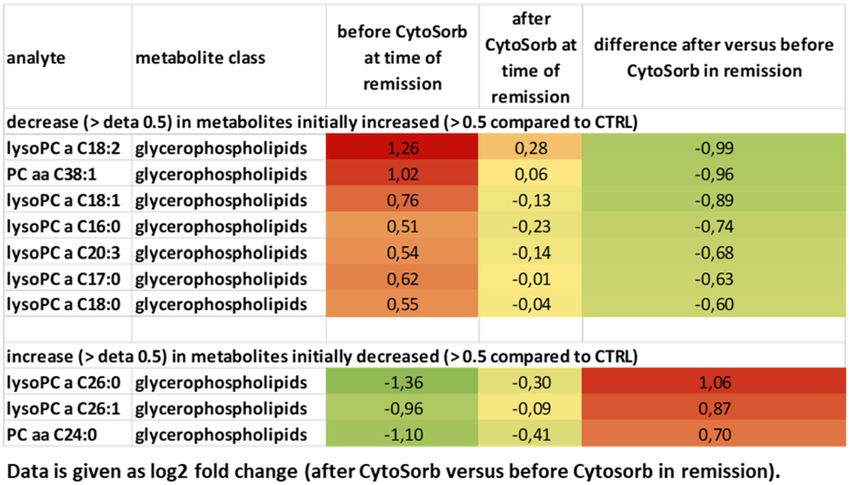
www.nature.com/scientificreports/
◂Figure 4. Raman spectroscopy gives a molecular fingerprint of recurrent FSGS on tissue level. (a,b) PAX8
staining (green) and synaptopodin staining (red) of a glomerulus from the kidney biopsy at transplantation
(0-biopsy) (a,a′) and at the time of FSGS recurrence (FSGS recurrence) (b,b′) and from a patient with minimal
change disease (c,c′) showing increased PAX8 staining in the Bowman’s capsule (arrow head in b′), scale
bar = 100 µm. Representative bright field illumination (a″,b″,c″) and heat map of Raman signal intensity
(a‴,b‴,c‴) of a glomerulus from the kidney biopsy at transplantation (0-biopsy) (a″,a‴), at the time of FSGS
recurrence (FSGS recurrence) (b″,b‴) and of a biopsy with minimal change disease (c″,c‴) showing increased
Raman signal at the region of parietal epithelial cell in the Bowman’s capsule (arrow head in b‴). Scale
bar = 50 µm. (d) Mean Raman spectra of three glomeruli from the kidney biopsy at transplantation (blue line)
and three glomeruli at the time of FSGS recurrence (red line). Assignments of the Raman peaks according to the
literature are given.
horizontal Raman shift that indicated differences in molecular composition as well as concentration change of
these lipids. Most Raman shifts of the minimal changes biopsy were comparable to that of the 0-biopsy (Fig. 4d,
Table 1).
To analyze anomalies in Raman spectra between 0-biopsy and FSGS recurrence we generated a Raman
spectroscopy map from two measurements belonging to each biopsy and used a machine learning approach
(One-Class SVM) (Fig. 5). Raman spectra were visualized, whereby the intensity and color range cover the
degree of the Raman anomaly. Areas of parietal epithelial cells in the Bowman capsule as well as focal glomeru-
lar lesions (white arrows in Fig. 5) could be detected as an anomaly in the FSGS samples. Dividing the whole
Raman signal into only parts of the spectrogram revealed that there were significant differences in focal areas
of glomeruli in the FSGS recurrence biopsy (dotted red line in Fig. 5a′–d′) compared to the 0-biopsy (blue line
in Fig. 5a′–d′). This was most prominent in the wavelength range of 775–1160 cm−1, 1138–1523 cm−1 as well as
1500–1800 cm−1. Anomaly spectra from the parietal cell region of the bowman capsule were most prominent in
wavelength range of 775–1160 cm−1 (red line in Fig. 5a′–d′). Raw data of Raman intensity and Raman shift can
be found in supplementary Table S3.
Serum metabolome analysis of FSGS serum reveals potential disease‑causing factors. To
characterize the patient’s serum further we performed mass spectrometry analysis. 163 metabolites and metabo-
lite ratios were analyzed by a targeted mass spectrometry approach in the FSGS patient’s serum at different
time points as well as in serum from a stable transplanted control patient. This patient had stable transplant
function (serum creatinine around 80 µmol/l), no proteinuria and no rejection. Transplantation time and
baseline immunosuppression was the same as in our FSGS recurrent patient. Ornithine/arginine ratio, orni-
thine, different lysophosphatidylcholines, tyrosine phosphatidylcholines as well as proline were increased in
the FSGS serum at the time of relapse in the kidney transplant compared to serum of a stable transplanted
patient (log2 fold change > 0.3) (Table 2). In contrast, different acylcarnitines (C0, C2, C3-DC (C4-OH)) and
tyrosine/phenylalanine ratio were decreased in serum of the FSGS patient compared to serum of the control
patient (log2 fold change < − 0.5 (Table 2). Comparing the metabolite abundances at the time of FSGS remis-
sion to that at the time of recurrence revealed a decrease of initially elevated lysophosphatidylcholines and
an increase in initially reduced acylcarnitines (Table 3). This change was significant for l-carnitine C0 (log2
fold change = + 1.33; − log10 (p-value) = 0.009) and phosphatidylcholine aaC34:4 (log2 fold change of − 0.75,
− log10 (p-value) = 0.029) (Fig. 6). Comparing different metabolite classes after the first CytoSorb apheresis to
that before the first CytoSorb apheresis showed a decrease in amino acids initially increases in FSGS serum and
an increase in acylcarnitine initially reduced (Table 4). CytoSorb apheresis in a stable phase of FSGS further
decreased lysophosphatidylcholines and phosphatidylcholines that were still elevated compared to the control
patient (Table 5). Raw data of mass spectrometry analysis normalized by the serum of the stable transplanted
patient can be found in supplementary Table S4. The altered lipidome/metabolome in our FSGS patient with
increase in phosphatidylcholines and ornithine and decrease in acylcarnitines could be confirmed when com-
pared to ten 10 healthy control persons from previously published EPIC-study (supplementary Table S5)27.
In summary, mass spectrometry analysis revealed changes in serum lipoprotein profile in FSGS that could
be influenced by CytoSorb therapy. Furthermore, mass spectrometry results correlated to Raman signals found
in FSGS serum treated podocytes, FSGS serum fractions and FSGS kidney biopsy.
Discussion
Idiopathic FSGS is a disease group that is believed to be caused by circulating permeability factors. Despite long
lasting research efforts over many decades and several identified potential factors a unifying concept has not
been established for circulating factors. Here, we report a patient with recurrent idiopathic FSGS negative for all
published circulating permeability factors. Since we previously published successful removal of suPAR treatment
with CytoSorb apheresis in a patient with FSGS and since our patient had progressed to end-stage renal disease
of her native kidney despite all other treatment attempts we decided to use CytoSorb as compassionate u se28.
CytoSorb preferentially absorbs hydrophobic substances and remove molecules with a weight range between 5
and 60 kDa. Already one treatment with CytoSorb apheresis led to rapid decrease in proteinuria with no side
effects in this patient. However, at the beginning of the treatment proteinuria relapsed shortly after apheresis
frequency was reduced. This might indicate the rapid rebound of the circulating components after CytoSorb
treatment. Only after daily treatment sessions over several weeks and additional rituximab treatment CytoSorb
apheresis sessions could be reduced to once a week. Even though the patient achieved remission with our treat-
ment, the actual circulating component in the patient’s blood remains unknown.
Scientific Reports | (2021) 11:4577 | https://doi.org/10.1038/s41598-021-83883-w 9
Vol.:(0123456789)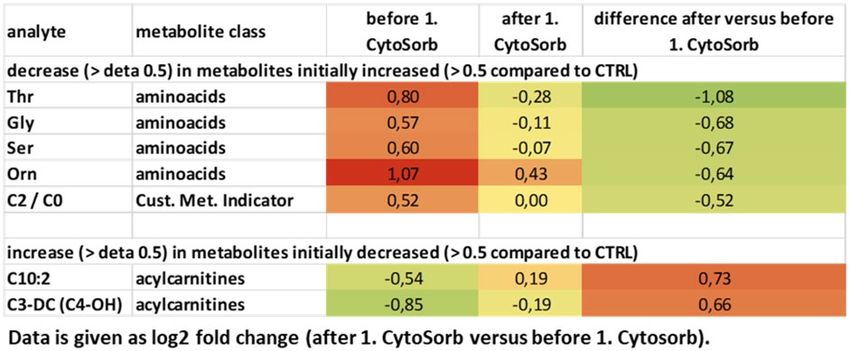
www.nature.com/scientificreports/
Figure 5. Machine learning reveals anomalies in Raman spectroscopy maps between 0-biopsy and FSGS
recurrence. Raman spectra of glomeruli from the 0-biopsy and two glomeruli from the biopsy with FSGS
recurrence were visualized, whereby the intensity and color range cover the degree of the anomaly. Areas of
focal glomerular lesions as well as parietal epithelial cells in the Bowman capsule are highlighted as an anomaly
in the FSGS samples. (a) Visualization of the occurring anomaly using the entire spectrum. (b–d) Consideration
of only parts of the spectrogram that have been baseline corrected individually. Especially in the range of
775–1160 cm−1 (b) there were significant differences in FSGS glomeruli comparison to spectra from glomeruli
of the 0-biopsy in focal areas as well in parietal cell region of the bowman capsule. Likewise, a similar effect was
observed for the wavelength range 1138–1500 cm−1 (c) and 1500–1800 cm−1 (d). (a′–d′) Raman spectra for the
anomalies with confidence > 80% in FSGS recurrence of the parietal cell region (red line) and the glomerular
region (spotted red line) compared to 0-biopsy (blue line) for the entire spectrum (a′) and divided in wavelength
range of 775–1160 c m−1 (b′) 1138–1523 cm−1 (c′) as well as 1500–1800 cm−1 (d′).
There is plenty of evidence for a causative circulating factor in idiopathic FSGS: serum from patients with
FSGS increases glomerular albumin permeability in vitro and induces proteinuria in rats7,29. Proteinuria can
recur days to weeks after kidney transplantation and plasmapheresis is able to induce proteinuria r emission30,31.
Implantation of a kidney allograft with FSGS in another patient was successful without causing proteinuria32.
One of the most prominent, but also most debated circulating factor suggested to cause FSGS is suPAR8,33.
suPAR is released during inflammation or immune activation, and therefore the suPAR levels reflect immune
activation34. Normal suPAR level range from 2000–3000 pg/mL in healthy individuals, about 3000–4000 pg/mL
in unselected patients in emergency departments, and about 9000–10,000 pg/mL in critically ill patients. suPAR
levels are higher in females compared to males and smoking is associated with an increase in s uPAR35. We could
show in a previously published case report, that CytoSorb treatments can decrease suPAR levels28. However, our
recent patient showed suPAR levels in a normal range. CLCF1 is another putative circulating permeability factor
described in FSGS36. Recombinant human CLCF1 increased albumin permeability of isolated rat glomeruli37.
Incubation of cultured murine podocytes with CLCF1 caused marked changes in the configuration of the actin
cytoskeleton38. Serum CLCF1 concentration was 1.67 ng/ml at the time of FSGS recurrence in our patient. Even
though undetectable in most of our healthy controls, serum CLCF1 reached concentrations up to 1.2 ng/ml in
Scientific Reports | (2021) 11:4577 | https://doi.org/10.1038/s41598-021-83883-w 10
Vol:.(1234567890)www.nature.com/scientificreports/
Table 2. Differences in serum metabolites of a transplanted patient with FSGS recurrence versus a transplanted
control measured by mass spectrometry. Table shows metabolites that were increased > 0.5 and decreased > 0.5 in
the FSGS patient competed to the control patient. All values are given as log2 (FSGS patient/stable transplanted
control). Color shades represent values as heat map.
Table 3. Difference in serum metabolites in FSGS remission versus recurrence measured by mass spectrometry.
Table shows metabolites that were initially increased > 0.5 and decreased more than > 0.5 as well as metabolites
that were initially decreased and increased more than > 0.5. All values are given as log2 (FSGS patient/stable
transplanted control). The mean of two measurements at the time of FSGS relapse (before and after the 1.
CytoSorb apheresis) to the mean of two measurements at the time of FSGS remission (before and after the
CytoSorb apheresis at stable remission) were used for calculations.
one control. Therefore, we do not believe that CLCF1 is specific for recurrent FSGS and most likely was not the
disease-causing factor in our patient. Kemper et al. observed increased levels of the T-cell activation marker
sCD25 during relapses of steroid dependent nephrotic syndrome39. sCD25 level was in normal range before the
first apheresis session in our patient. Cathepsins are other suggested candidates for the circulating permeability
factor. Cathepsins are proteases involved in intracellular protein degradation and activation of enzyme precursors.
Immunohistochemically staining of human kidney biopsy specimens indicated that the expression of cathepsin
D was significantly increased in Minimal change disease compared to that in FSGS maybe because of a high
level of autophagic activity40,41. IL6 was demonstrated to contribute to renal diseases like FSGS42. Cathepsin L
and IL6 were undetectable or in normal range in our patient.
Since our patient had normal range of published circulating permeability factors, we used our cell culture
model and our zebrafish proteinuria assay to show that the patient’s serum contained disease-causing factors.
Cultured human podocytes can be a useful bioassay to monitor disease activity and to screen for podocyte dam-
aging factors. Sera of patients with recurrent FSGS induced downregulation of SMPDL-3b in cultured podocytes
making them more susceptible to actin remodeling43. We treated cultured human podocytes with the patient’s
Scientific Reports | (2021) 11:4577 | https://doi.org/10.1038/s41598-021-83883-w 11
Vol.:(0123456789)www.nature.com/scientificreports/
Figure 6. Serum metabolome analysis of recurrent FSGS reveals changes in carnitine and phosphatidylcholine-
levels. Volcano-Plot of the serum metabolome analysis of the patient with FSGS. Log2 fold change of metabolites
at FSGS remission versus FSGS recurrence as well as –log10 (p-values) are given. PCaaC34:4 and l-carnitine
were significantly altered at remission versus recurrence. Confidence limits (fold change > 0.3, p-value < 0.05) are
shown with dashed lines. Metabolomics are labeled in different colors according to their metabolomics class.
Table 4. Difference in metabolites after first CytoSorb versus before first CytoSorb measured by mass
spectrometry. Tables shows metabolites that were initially increased > 0.5 and decreased more than > 0.5 as well
as metabolites that were initially decreased and increased more than > 0.5. All values are given as Log2 (FSGS
patient/stable transplanted control).
serum and could detect a significant cytoskeleton rearrangement. Actin stress fibers in the central part of the cells
decreased and the cells displayed a typical actin rim-like structure. These changes are consistent with activation
of the cell towards a more motile phenotype that may be more vulnerable to detachment.
In the past, we established the zebrafish as a screening model for proteinuria in gene knockdown models17–24.
Now, we refined our model for a screening of circulating permeability factors. We injected serum of patient with
recurrent FSGS in the cardinal vein of the zebrafish and detected a significant loss of plasma proteins, reduced
nephrin and partial podocyte effacement 3 days later.
In order to characterize the unknown circulating permeability factor further, we performed Raman spectros-
copy in < 50 kDa serum fractions, on kidney biopsies and on podocytes treated with serum of our patient with
recurrent FSGS. Raman spectra are directly related to the biochemical composition of tissues44–46. In the past,
Raman was used to detect metabolomic changes in different cancers47,48. However, Raman spectroscopy was
never used before to study metabolomics in FSGS. Li et al. demonstrated that Raman spectroscopy combined
with multivariate analysis can be a potential non-invasive diagnostic tool for nephritis in an anti-GBM mouse
model44. We previously used Raman to detect cell stress induced by micro particles49. As the disease-causing
factor was unknown in our patient, we used a global approach based on the ability of Raman to identify spectral
markers of the global intrinsic molecular composition. Most prominent differences in Raman peaks between
Scientific Reports | (2021) 11:4577 | https://doi.org/10.1038/s41598-021-83883-w 12
Vol:.(1234567890)www.nature.com/scientificreports/
Table 5. Difference in metabolites after versus before CytoSorb in remission measured by mass spectrometry.
Table shows metabolites that were initially increased > 0.5 and decreased more than > 0.5 as well as metabolites
that were initially decreased and increased more than > 0.5. All values are given as Log2 (FSGS patient/stable
transplanted control). Color shades represent values as heat map.
FSGS serum treated and control serum treated cultured human podocytes were found at wavelength correspond-
ing to membrane bound phosphatidylcholine, phenylalanine, phospholipids, fatty acids and sphingomyelin.
Small vertical wavelength shifts were present between FSGS serum and control serum treated human podo-
cytes between 700 and 800 cm−1. It has been suggested that differences in protein secondary structures result in
a horizontal shift of Raman bands50,51. For example, the phenylalanine bands shifted between 997 and 1007 cm−1
in different types of collagen. Raman spectra of < 50 kDa serum fraction of the FSGS patient at the time of recur-
rence corresponded to phospholipids, phosphatidylcholine, and sphingomyelin confirming a dysbalance in the
serum lipoprotein profile.
On tissue level, increased Raman signal was detected in the region of the Bowman’s capsule in the biopsy
with FSGS recurrence but not in the preimplantation biopsy. We have also applied a machine learning based
anomaly detection to identify discrepancies in the Raman spectra between the 0-biopsy and FSGS recurrent
biopsy. Differences were found in the area of parietal epithelial cells and in the focal points of the glomerulus in
the FSGS recurrent biopsy. Recently, a novel parietal epithelial cell subpopulation called cuboidal parietal cells
co-localized with the Bowman’s capsule were proposed to form tip lesions in F SGS52. In line, activation of parietal
53
epithelial cells has been described in early recurrent F SGS . In three different models of FSGS and in human
biopsies with FSGS focal activation of parietal epithelial cells contributed to the development and progression
of sclerotic lesions54. Thus, the increased Raman signal in the Bowman’s capsule in recurrent FSGS might cor-
respond to activated parietal epithelial cells.
Raman signal of the FSGS biopsy again revealed increased membrane bound phosphatidylcholine, phenylala-
nine, phospholipids, fatty acids and sphingomyelin. Increased Raman peaks in the FSGS biopsy corresponding to
phosphatidylcholine, phospholipids and fatty acids were in line with disturbed systemic and renal lipid expression
in FSGS55. A characteristic Raman band of sphingomyelin was identified at ∼1643 cm−156. This Raman signal was
increased in our FSGS biopsy compared to the preimplantation-biopsy. Increased collagen along the Bowman’s
capsule was reported in FSGS mice and fitting to our Raman measurements with increased signal 1259 cm−157.
Albumin has major Raman peaks at 830 cm−1, 950 cm−1, 1350 cm−1, and 1650 cm−158. All these spectra were
increased in FSGS relapse biopsy compared to 0-biopsy indicating a higher albumin abundance in the damaged
kidney due to leakage in the glomerular filtration barrier.
Dyslipidaemia is a typical finding of nephrotic syndrome including FSGS. The beauty of our study is that
for the first time we could not only detect this dyslipidaemia in serum but also disturbed lipid profiles on tissue
level and in podocytes treated with FSGS serum using Raman spectroscopy. These changes in lipoproteins might
reveal novel pathways involved in the pathomechanism of recurrent FSGS.
In addition to Raman spectroscopy, we performed mass spectrometry in the patient’s serum at different time
points of the disease to characterize the circulating metabolome in FSGS. Metabolite signatures have been dem-
onstrated to possess diagnostic or predictive power for several renal dysfunctions such as acute kidney injury,
chronic kidney disease, diabetic nephropathy, kidney cancer, membranous nephropathy, polycystic kidney dis-
ease as well as for transplant r ejection59. Fouque et al. could show that several acyl-carnitines were significantly
increased and inversely associated with lower eGFR60. Plasma free carnitine concentrations were significantly
higher in the acute period of steroid-sensitive nephrotic syndrome compared to the remission period and plasma
free carnitine positively correlated with low-density lipoprotein cholesterol, total cholesterol and triglyceride61.
Phosphatidylcholine, lysophosphatidylcholine, and sphingomyelin were all described to be elevated in diabetic
nephropathy and dysregulation of ceramide metabolism was recently reported to be also involved in diabetic
kidney disease62,63. Metabolomic profiling of patients with a failing kidney allograft revealed a correlation of
serum concentrations of tryptophan, glutamine, dimethylarginine isomers and short-chain acyl-carnitines (C4
and C12) with a reduced G FR64. There is emerging evidence that disturbed lipid metabolism might play a role
in FSGS. Erkan et al. reported increased fatty acids and phosphatidylcholines as well as reduced phosphatidyl-
cholines in urines from patients with F SGS65.
In our analysis, we compared mass spectrometry data of the patient’s serum at time of FSGS recurrence
to serum of a transplanted control and the FSGS serum before and after CytoSorb treatment at the time of
FSGS relapse and at the time of remission. Even though a targeted mass spectrometric approach can only cover
Scientific Reports | (2021) 11:4577 | https://doi.org/10.1038/s41598-021-83883-w 13
Vol.:(0123456789)www.nature.com/scientificreports/
a predefined set of metabolites the accuracy and reproducibility is higher compared to profiling approaches
and was therefore used in this study. Several molecules of the changed lipid metabolome profiles associated
with idiopathic FSGS interact with each other and were published in similar context: Phosphatidylcholine and
lysophsphatidylcholine were both elevated at the time of FSGS relapse. Both lipids are converted to each other
by lecithin–cholesterol acyltransferase (LCAT) and lysophosphatidylcholine acyltransferase (LPCAT). Well in
line, lysophosphatidylcholine 16:0 and 18:0 were also found in a podocyte-selective injury mouse m odel66. Fur-
thermore, podocyte injury-driven lysophosphatidylcholine accelerated glomerular macrophage-derived foam
cell infiltration via lysophosphatidylcholine-mediated expression of adhesion molecules and chemokines in
glomerular resident cells in F SGS66. In addition, phosphatidylcholines were accumulated in the FSGS serum.
Urine of patients with FSGS was previously described to contain elevated levels of fatty acids (C16:0, C22:4)
and lysophosphotidylcholines (C14:0, C18:1) but decreased levels of phosphotidylcholine (C38:4) compared to
healthy subjects65.
Serum sphingomyelin was reduced in our FSGS patient in our mass spectrometry analysis. In contrast,
Raman spectroscopy revealed increased signal corresponding to sphingomyelin on podocyte and tissue level in
FSGS. Dysregulation and tissue accumulation of different sphingolipids are typical findings in genetic diseases
including Tay–Sachs disease, Fabry disease, hereditary inclusion body myopathy 2, Niemann–Pick disease, and
nephrotic syndrome of the Finnish type67–70. Similarly, sphingolipid accumulation has also been reported in
glomerular diseases of non-genetic origin including diabetic kidney disease, HIV-associated nephropathy, lupus
nephritis and idiopathic FSGS70,71. Sphingomyelins are synthesized during the transfer of phosphorylcholine from
phosphatidylcholine to ceramide in a reaction catalyzed by sphingomyelin synthase. SMPDL3b, an enzyme that
modulates sphingomyelinase activity in podocytes has been shown to be reduced in F SGS43,72. Thus, our findings
are well in line with previously described dysregulation of sphingolipids in FSGS.
Sphingomyelin synthesis from ceramide and phosphatidylcholine is catalyzed by sphingomyelin synthase. We
speculate that the decrease in sphingomyelin in the patient at the time of FSGS recurrence most likely was due
to decreased ceramide and decreased sphingomyelin synthase activity and at the same time causing an increase
in phosphatidyl-choline due to accumulation. A decrease in catabolism of amino acids might have resulted in
decreased amino-acid derived acylcarnitines and higher levels of tyrosine seen in the patient.
Moreover, acylcarnitine that also belongs to the sphingolipid family was reduced at the time of FSGS relapse.
Acylcarnitines were previously described to be reduced in urines from FSGS patients65. Acylcarnitines play a
role in fatty acid oxidation and transport of acyl-CoA across the inner mitochondrial membrane73. A decrease in
catabolism of amino acids might have resulted in decreased amino-acid derived acylcarnitines, l-carnitine and
higher levels of tyrosine seen in the patient. Lower acylcarnitine levels are therefore a hint for impaired fatty acid
oxidation and mitochondrial dysfunction. Taken together we identified several serum metabolomic signatures
involved in lipid metabolism disturbances in FSGS that corresponded to Raman signals of FSGS serum, Raman
signal of serum treated podocytes and Raman signals in the biopsy after FSGS recurrence. It is possible that not
a single circulating factor but several molecules of the disturbed lipid metabolome might have induced the recur-
rence of FSGS and that the molecules we detected might have been surrogates rather than causal for the disease.
Our innovative methods might shed new light on the pathogenesis of recurrent FSGS and could be used as
a novel tool to predict response to treatment. Metabolic profiling was shown to predict outcome of rituximab
therapy in rheumatoid arthritis. Phenylalanine, choline, glycine, threonine and glycerol were all increased in
non-rituximab responders versus rituximab responder74. Interestingly, all these metabolites were also increases
in our FSGS patient that did previously not respond to rituximab when the disease occurred in the native kidneys
(Tables 2 and 3). It is tempting to speculate that the CytoSorb therapy changed the metabolites and thus changed
rituximab responsiveness after disease recurrence.
In summary, we provide novel evidence for additional circulating factors in FSGS causing early recurrence
of the disease in the transplanted kidney. This is supported by the following pieces of evidence: First, the patient
had normal levels of previously described circulating factors but rapidly responded to CytoSorb treatment.
Second, the patient’s serum caused podocyte cytoskeleton rearrangements and proteinuria was induced by injec-
tion of the patient’s serum in zebrafish. Third, Raman spectroscopy was able to give a molecular fingerprint of
recurrent FSGS on serum cell and tissue level and revealed metabolomic changes corresponding to serum mass
spectrometry from the patient’s serum.
Our findings have several limitations. Assignments of Raman signals to lipid fractions was performed accord-
ing to the literature and we did not measure the pure substances. However, we could detect dyslipidaemia in
the FSGS serum by mass spectroscopy. Furthermore, our innovative methods were only performed in a very
limited number of patient samples. However, we were the first analyzing Raman and mass spectroscopy serially
over time in the same patient in serum and kidney biopsies. Next to the serial measurements in the same patient
we used different controls like a stable transplanted patient, minimal change biopsy, serum from membranous
glomerulonephritis and samples from healthy individuals as controls. As idiopathic FSGS is a heterogeneous
disease most likely caused by different factors in different patients an individualized approach seems reason-
able. Second, we did not actually identify “the” causing disease factor. However, we describe morphological and
functional changes induced by the serum and found an altered lipid metabolome associated with idiopathic FSGS
that might reflect a new subtype of FSGS. The innovative treatment management and analysis methods of this
study might be used as a model for personalized treatment approaches and further research on recurrent FSGS.
We believe that a patient centric approach is necessary to tailor treatment regimens for individual patients due
to the heterogeneity of the disease.
Scientific Reports | (2021) 11:4577 | https://doi.org/10.1038/s41598-021-83883-w 14
Vol:.(1234567890)www.nature.com/scientificreports/
Methods
CytoSorb apheresis. CytoSorb apheresis was performed in the department of Nephrology at University of
Erlangen. The patient received daily/weekly CytoSorb apheresis over a cimino fistula on the left forearm. Blood
flow rate was 200 ml/min. Anticoagulation during the apheresis was done with 1000 IE Heparin bolus followed
by 1000 IE Heparin/h. Patients’ blood pressure, heart rate and electrolytes were measured during to the proce-
dure. Venous pressure, arterial pressure and transmembrane pressure were controlled at the site of the apheresis
machine. Informed consent was obtained from the participant.
Measurement of circulating permeability factors. CLCF1 levels in patients’ serum were measured
with human CLCF1 Sandwich ELISA Kit—LS-F7193 (Catalog # BMS257, LSBio, Seattle, WA, USA) according to
the manufacture protocol. The ELISA can detect levels of CLCF1 between 0.156 and 10 ng/ml. According to the
company, healthy subjects have serum levels between 0 and 1.5 ng/ml. Cathepsin L in patient’s serum was meas-
ured with human cathepsin L ELISA Kit (Catalog # BMS257, Invitrogen, Thermo Fisher scientific) according to
the manufacture protocol. The ELISA can detect cathepsin L levels between 3.1 and 50 ng/mL. According to the
company, healthy subjects have serum levels between 0 and 56 ng/ml. IL-6, suPAR and sCD25 were measured
in the laboratory of the University of Heidelberg. The study was approved from ethic committee of Friedrich-
Alexander University Erlangen-Nuremberg (182_19B) and the patient gave written consent. All experiments
were performed in accordance with relevant named guidelines and regulations.
Treatment of cultured human podocytes with patient serum. Immortalized cultured human
podocytes were proliferated under permissive conditions at 33 °C. When cultivated at 37 °C, the SV40 T-antigen
was inactivated for cell differentiation. Podocytes were differentiated for 10 days on cover slides in RPMI 1640
Medium (Roth, Karlsruhe, Germany) with 10% fetal calf serum, 1% Penicillin/Streptomycin and 0.1% Insulin.
At day 7 fetal calf serum was replaced to 10% control serum or patient serum. Cells were fixed at 0 h and 6 h
using ice-cold methanol at − 20 °C for 10 min and permeabelized using 0.1% Triton for 10 min. After blocking
with 10% donkey serum, immunofluorescent labeling of F-actin was done by incubation with Alexa Fluor 546
phalloidin (Invitrogen) at 4 °C overnight. Nuclei staining was done with Hoechst. Sides were mounted on glass
slides and were visualized under fluorescent microscopy. For quantification of changes in actin cytoskeleton of
podocytes, we used a scoring system published e arlier14–16: Type A: more than 90% of cell area filled with thick
cables; type B: at least 2 thick cables running under nucleus and rest of cell area filled with fine cables; type C: no
thick cables, but some cables present; type D: no cables visible in the central area of the cell.
Serum injection in zebrafish larvae. Zebrafish were grown and mated at 28.5 °C. Larvae were kept and
handled in standard embryo raising medium, as previously described. Two-day-old zebrafish larvae were anes-
thetized with 1.5% MS-222, transferred to an agarose injection mold. Zebrafish were injected with human serum
derived from the patient and a healthy control into the cardinal venous sinus using a Drummond Nanoject 200
micro-injector. Following injection zebrafish were transferred to embryo raising medium to recovery. Larvae
were checked daily until 120 h post fertilization at which point they were euthanized using 1.5% MS-222 or 1:500
2-phenoxy-ethanol.
We only used zebrafish until 120 hpf in our experiments, which does not need animal approval by licensing
committees. Zebrafish breeding protocol were approved by the Office for Veterinary and Consumer Health
Protection Erlangen (I/39/FN003). All methods were carried out in accordance with European Convention on
the Protection of Vertebrate Animals (EU commission recommendation 2007/526/EC). The study was carried
out in compliance with the ARRIVE guidelines.
Proteinuria detection in zebrafish larvae. A transgenic zebrafish line that expresses a fluorescent Vita-
min D binding protein Tg(l-fabp:VDBP:eGFP fish) was used to indirectly measure proteinuria. If plasma pro-
teins are retained in the vascular system, the fluorescent signal from the Vitamin D binding protein increases
over time and can easily be seen in the retinal vessels of the zebrafish. The maximum fluorescence intensities of
grayscale images of the pupil of zebrafish larvae that were injected with control serum or patient serum at 48 hpf
were measured using Image J (Version 1.48 Wayne Rasband National Institutes of Health, USA) and reported in
relative units of brightness.
Transmission electron microscopy of zebrafish larvae. Zebrafish larvae were fixed in solution D and
embedded in EPON according to the manufacture protocol (recipe/protocol from EMS, Hatfield, PA). Semi-thin
(300 nm) and ultra-thin (90 nm) sectioning were performed with a microtome (Reichert Austria Ultracut) and
transferred onto copper slit grids (EMS, Hatfield, PA). Grids were optionally stained with uranyl acetate (2%) for
30 min and then lead citrate for 15 min with three washing steps in between. Images were recorded using Leo912
transmission electron microscope (Zeiss, Oberkochen, Germany).
Immunofluorescence staining of zebrafish larvae. For paraffin tissue sections, zebrafish larvae were
fixed in 2% PFA for 1 day, dehydrated in ascending concentrations of ethanol in PBS (25%, 50%, 70%, and 100%)
and transferred in xylene (100%) for 5 min before embedding in paraffin (60 °C) overnight. With a rotational
microtome (Leica SM 2000 R) sections of 5 μm were cut, incubated in ethanol (100%, 70%, 50%, and 25%).
For cryosections larvae were fixed in 2% PFA for 2 h followed by an overnight incubation in 30% saccharose at
4 °C. After embedding the larvae in Tissue-Tek (Sakura, Staufen, Germany), sections (20 μm, 60 μm) were cut
using a Leica CM 1950 microtome and stained with antibodies. The following primary antibodies were used:
Scientific Reports | (2021) 11:4577 | https://doi.org/10.1038/s41598-021-83883-w 15
Vol.:(0123456789)You can also read