A meta-analysis of mesophyll conductance to CO2 in relation to major abiotic stresses in poplar species
←
→
Page content transcription
If your browser does not render page correctly, please read the page content below
Journal of Experimental Botany, Vol. 72, No. 12 pp. 4384–4400, 2021
doi:10.1093/jxb/erab127 Advance Access Publication 19 March 2021
This paper is available online free of all access charges (see https://academic.oup.com/jxb/pages/openaccess for further details)

RESEARCH PAPER

A meta-analysis of mesophyll conductance to CO2 in relation
to major abiotic stresses in poplar species
Raed Elferjani1,*, , Lahcen Benomar2,*,†, , Mina Momayyezi3, Roberto Tognetti4, Ülo Niinemets5,

                                                                                                                                                        Downloaded from https://academic.oup.com/jxb/article/72/12/4384/6178815 by guest on 30 August 2021
Raju Y. Soolanayakanahally6, Guillaume Théroux-Rancourt7, , Tiina Tosens5, Francesco Ripullone8,
Simon Bilodeau-Gauthier9, Mohammed S. Lamhamedi9, Carlo Calfapietra10 and Mebarek Lamara2
1
  Quebec Network for Reforestation and Intensive Silviculture, TELUQ University, Montreal, QC, H2S 3L5, Canada
2
  Forest Research Institute, University of Quebec in Abitibi-Temiscamingue, Rouyn-Noranda, QC, J9X 5E4, Canada
3
  Department of Viticulture and Enology, University of California, Davis, CA 95616, USA
4
  Università degli Studi del Molise, Via De Sanctis, 86100 Campobasso, Italy
5
  Estonian University of Life Sciences, Kreutzwaldi 1, 51006 Tartu, Estonia
6
  Indian Head Research Farm, Agriculture and Agri-Food Canada, Indian Head, SK, S0G 2K0, Canada
7
  Institute of Botany, University of Natural Resources and Life Sciences, Gregor-Mendel-Strasse 33, 1180 Vienna, Austria
8
  University of Basilicata, Via Ateneo Lucano 10, 85100 Potenza, Italy
9
  Direction de la Recherche Forestière, 2700 rue Einstein, Québec, QC, G1P 3W8, Canada
10
   Institute of Agro-Environmental & Forest Biology (IBAF), National Research Council (CNR), Via Marconi 2, Porano (TR) 05010, Italy

* These authors contributed equally to this work.
†
  Correspondence: lahcen.benomar.1@gmail.com

Received 8 December 2020; Editorial decision 15 March 2021; Accepted 17 March 2021

Editor: Ros Gleadow, Monash University, Australia

Abstract
Mesophyll conductance (gm) determines the diffusion of CO2 from the substomatal cavities to the site of carboxylation
in the chloroplasts and represents a critical component of the diffusive limitation of photosynthesis. In this study, we
evaluated the average effect sizes of different environmental constraints on gm in Populus spp., a forest tree model.
We collected raw data of 815 A–Ci response curves from 26 datasets to estimate gm, using a single curve-fitting
method to alleviate method-related bias. We performed a meta-analysis to assess the effects of different abiotic
stresses on gm. We found a significant increase in gm from the bottom to the top of the canopy that was concomitant
with the increase of maximum rate of carboxylation and light-saturated photosynthetic rate (Amax). gm was positively
associated with increases in soil moisture and nutrient availability, but was insensitive to increasing soil copper con-
centration and did not vary with atmospheric CO2 concentration. Our results showed that gm was strongly related to
Amax and to a lesser extent to stomatal conductance (gs). Moreover, a negative exponential relationship was obtained
between gm and specific leaf area, which may be used to scale-up gm within the canopy.

Keywords: Abiotic stress, A–Ci curve, mesophyll conductance, meta-analysis, photosynthesis, poplar.

© The Author(s) 2021. Published by Oxford University Press on behalf of the Society for Experimental Biology.
This is an Open Access article distributed under the terms of the Creative Commons Attribution License (http://creativecommons.org/licenses/by/4.0/),
which permits unrestricted reuse, distribution, and reproduction in any medium, provided the original work is properly cited.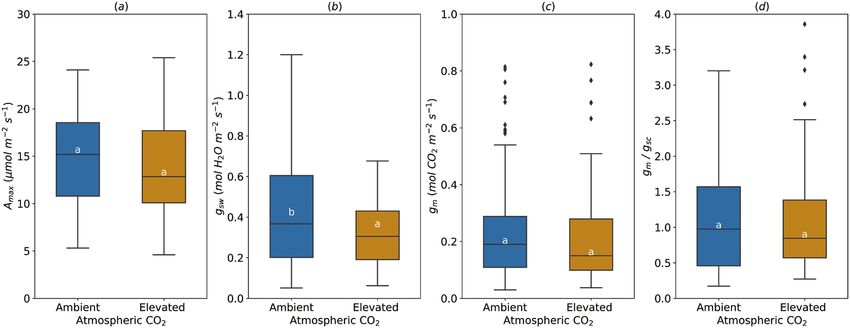
Meta-analysis of mesophyll conductance in poplar under abiotic stress | 4385

Introduction
Carbon assimilation in plants is importantly determined by            contribution of these traits (Marchi et al., 2008; Tomás et al.,
the diffusion efficiency of CO2 from the atmosphere to the            2013), and (ii) the level of coordination between gm, gs, and
site of carboxylation. The rate of CO2 diffusion is affected by       leaf specific hydraulic conductivity (KL) (Flexas et al., 2013;
two main diffusion limitations.The first limitation controls the      Théroux-Rancourt et al., 2014; Xiong et al., 2017). Given the
CO2 flux from the atmosphere to the sub-stomatal cavities             complex interplay between different factors controlling gm, it
through the stomata and is characterized by stomatal conduct-         is important to examine its acclimation at the genus and spe-
ance (gs). The second limitation determines the diffusion of          cies level to gain a general insight into the mechanistic basis of
CO2 from the substomatal cavities to the sites of carboxyl-           changes in gm.
ation in the chloroplasts and is characterized by mesophyll              Five methods exist to estimate gm: (i) chlorophyll fluores-
conductance (gm). gm is composed of gaseous and liquid phase          cence coupled to gas exchange (Harley et al., 1992), (ii) carbon

                                                                                                                                            Downloaded from https://academic.oup.com/jxb/article/72/12/4384/6178815 by guest on 30 August 2021
resistances (Flexas et al., 2008; Evans et al., 2009; Niinemets       isotope discrimination coupled to gas exchange (initially de-
et al., 2009). CO2 diffusion inside the leaves is complex, fa-        veloped by Evans et al., 1986), (iii) oxygen isotope discrimin-
cing a series of structural barriers coupled with biochemical         ation (Barbour et al., 2016), (iv) A–Ci curve fitting (Ethier and
regulation. It has been shown that gm is typically limited by         Livingston, 2004; Sharkey et al., 2007), and (v) 1D modeling of
liquid phase conductance both in species with soft meso-              gm from leaf structural characteristics (Evans et al., 2009; Tosens
phytic leaves and in species with tough xerophytic leaves             et al., 2012b; Tomás et al., 2013). All of these methods are based
(Tosens et al., 2012a, b; Tomás et al., 2013). The liquid phase       on specific assumptions and each one has its limitations (Flexas
is a multicomponent pathway that involves the mesophyll cell          et al., 2013; Tosens and Laanisto, 2018). The standard deviation
wall thickness and porosity, the plasmalemma, the chloroplast         of the estimate of gm may vary from 10% to 40%, which may
envelope, the chloroplast thickness, and the mesophyll surface        limit our understanding of gm acclimation to growth condi-
area exposed to intercellular air spaces per unit of leaf area        tions, particularly when the variation between treatments or
(Evans et al., 2009; Tosens et al., 2012b; Tomás et al., 2013).       studies is less than the error of estimates (Sun et al., 2014a).
After extensive study during the past two decades, gm is now             Populus spp., model crops in forestry characterized by high
widely accepted as a critical limiting factor to photosynthesis,      yield potential, have been the subject of numerous studies to
which has to be considered in characterizing plant carbon gain        understand the physiological response to environmental factors
potentials and responses to future climate change (Evans et al.,      but research is still necessary to make assessment of effects sizes
2009; Niinemets et al., 2009, 2011; Flexas et al., 2016).             and to make generalizations (Larocque et al., 2013). A general
   Mesophyll conductance has been shown to respond to envir-          understanding of the CO2 pathway through mesophyll and
onmental stress and may govern functional plasticity of photo-        how it is affected by environmental factors would be beneficial
synthesis and plant fitness under limited resources (Galle et al.,    in the effort to (i) accurately predict canopy photosynthesis
2009; Barbour et al., 2010; Buckley and Warren, 2014;Théroux          under different environmental conditions, particularly under
Rancourt et al., 2015; Flexas et al., 2016; Shrestha et al., 2018).   warmer and drier climate, and improve global carbon assimi-
However, recent findings on the response of gm to abiotic stress      lation models, and (ii) effectively select more resilient and pro-
are conflicting and inconclusive, demonstrating the complex           ductive cultivars for wood and bioenergy. In poplar plantations,
nature of gm variation (Flexas et al., 2008; Niinemets et al.,        organic amendments like biosolids and pig slurry are used to
2009; Zhou et al., 2014; Shrestha et al., 2018). This suggests        increase growth rate at a low cost (Paniagua et al., 2016). These
that the environmental and species-specific responses (and            amendments are rich in copper, the effect of which on photo-
consequently the level of acclimation) of gm to growth con-           synthetic activity, growth, and nutrient uptake has been well-
ditions should be considered in predicting plant performance          documented in Populus spp. (Tognetti et al., 2004; Borghi et al.,
in the field. Among the contrasting environmental responses,          2008; Pietrini et al., 2017). In addition, poplar is a good candi-
growth temperature may (Warren, 2008; Silim et al., 2010) or          date for environmental use in phytofiltration of contaminated
may not (Dillaway and Kruger, 2010; Benomar et al., 2018)             water in agriculture lands, where copper is a major contam-
affect gm. Similarly, the increase in soil nitrogen may (Warren,      inant due to the large use of copper sulfate as a fungicide and
2004; Shrestha et al., 2018; Xu et al., 2020; Zhu et al., 2020) or    in weed control (Fischerová et al., 2006; Marmiroli et al., 2011).
may not (Bown et al., 2009) stimulate gm. The magnitude of               Substantial data of A–Ci response curves in the literature
decrease in gm under water stress and low light differed among        have been used to estimate photosynthetic parameters, not to
studies (Warren et al., 2003; Niinemets et al., 2006; Montpied        estimate gm, and such compiled dataset would provide a basis
et al., 2009; Bögelein et al., 2012; Tosens et al., 2012a; Zhou       to make such assessments of the response of gm to the envir-
et al., 2014; Peguero-Pina et al., 2015; Théroux Rancourt             onment. In this study, we compiled 815 A–Ci response curves
et al., 2015). These discrepancies among studies result in part       from 26 datasets of different poplar species and hybrids (Table
from (i) the absolute changes in structural and biochemical           1). Published A–Ci curve-fitting approaches differ broadly re-
traits controlling gm, as well as from changes in the relative        garding the rectangularity of the hyperbola, segmentations of
4386 | Elferjani et al.

Table 1. List of dataset sources used in the meta-analysis

Author                      Populus species or                   Number of   Treatment           Provenance   Growth            Number of curves
                            hybrid parents                       genotypes                       of plant     Environ-
                                                                                                 material     ment
Attia et al. (2015)         P. balsamifera L.                    3           N/A                 Canada       Growth            15
                            P. simonii Carrière                                                               chamber
                            P. balsamifera L. × P. simonii
                            Carrière
Benomar et al. (https://    P. maximowiczii A. Henry ×           2           Water stress        Canada       Growth             12
doi.org/10.5061/            P. balsamifera L.                                                                 chamber
dryad.9cnp5hqhp)
Benomar (2012)              P. maximowiczii A. Henry ×           2           Spacing and         Canada       Plantation         52

                                                                                                                                                   Downloaded from https://academic.oup.com/jxb/article/72/12/4384/6178815 by guest on 30 August 2021
                            P. balsamifera L.                                canopy level
                            P. balsamifera L. × P. trichocarpa
                            Torr. & A. Gray
Benomar et al. (2019)       P. maximowiczii A. Henry ×           2           Temperature and     Canada       Growth             23
                            P. balsamifera L.                                nitrogen                         chamber
                            P. maximowiczii A. Henry ×
                            P. nigra L.
Borghi et al. (2007)        P. × euramericana (P. deltoides      1           Copper              Italy        Growth             21
                            W. Bartram × P. nigra L.) (clone                                                  chamber
                            Adda)
Borghi et al. (2008)        P. alba L.                           2           Copper              Italy        Growth             18
                            P. × Canadensis (P. nigra L. ×                                                    chamber
                            P. deltoides W. Bartram)
Calfapietra et al. (2005)   P. × euramericana (P. deltoides      1           Nitrogen and        Italy        Plantation        60
                            W. Bartram × P. nigra L.)                        atmospheric CO2
                                                                             and canopy level
Castagna et al. (2015)      P. × canadensis (P. nigra L. ×       2           Ozone and           Italy        Greenhouse        16
                            P. deltoides W. Bartram)                         cadmium soil
                            P. deltoides W. Bartram ×                        contamination
                            P. maximowiczii A. Henry
Di Baccio et al. (2009)     P. × euramericana (P. deltoides      1           Zinc soil contam-   Italy        Growth             12
                            W. Bartram × P. nigra L.) (clone                 ination                          chamber
                            i-214)
Elferjani et al. (2016)     P. trichocarpa Torr. & A. Gray ×     4           Latitudinal gra-    Canada       Plantation         24
                            P. balsamifera L. (clone 747215)                 dient
                            P. balsamifera L. ×
                            P. maximowiczii A. Henry (clones
                            915004 and 915005)
                            P. maximowiczii A. Henry ×
                            P. balsamifera L. (clone 915319)
Li et al. (2013)            P. euphratica Oliv.                  1           Ground water        China        In field under      9
                                                                             availability                     shelter (lysim-
                                                                                                              eter)
Merilo et al. (2010)        P. nigra L.                          2           Atmospheric         Italy        Plantation        104
                            P. alba L.                                       CO2 (FACE) and
                                                                             nitrogen and
                                                                             canopy level
Niinemets et al. (1998)     P. tremula L.                        1           Canopy level        Estonia      Natural forest     14
                                                                                                              stands
Ripullone et al. (2003)     P. × euramericana (P. deltoides      1           Nitrogen            Italy        Greenhouse         14
                            W. Bartram × P. nigra L.) (clone
                            i-214)
Ryan et al. (2009)          P. deltoides W. Bartram ×            2           Ozone               United       Greenhouse        118
                            P. trichocarpa Torr. & A. Gray                                       Kingdom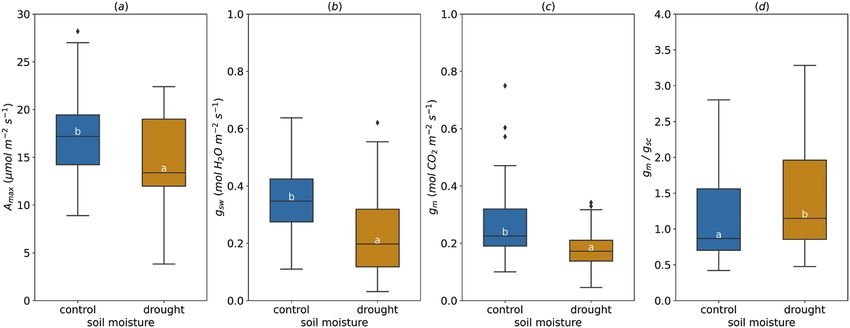
Meta-analysis of mesophyll conductance in poplar under abiotic stress | 4387

Table 1. Continued

Author                      Populus species or                   Number of   Treatment           Provenance   Growth        Number of curves
                            hybrid parents                       genotypes                       of plant     Environ-
                                                                                                 material     ment
Silim et al. (2010)         P. balsamifera L.                    1           Habitat and         Canada       Greenhouse    30
                                                                             growth tempera-
                                                                             ture
Soolanayakanahally          P. balsamifera L.                    1           Latitudinal gra-    Canada       Greenhouse    72
et al. (2009)                                                                dient
Théroux-Rancourt            P. deltoides W. Bartram × P. nigra   8           Water stress        Canada       Greenhouse    38
et al. (https://            L. (clone 3570)
doi.org/10.5061/            P. maximowiczii A. Henry ×

                                                                                                                                               Downloaded from https://academic.oup.com/jxb/article/72/12/4384/6178815 by guest on 30 August 2021
dryad.7sqv9s4s0)            (P. deltoides W. Bartram ×
                            P. trichocarpa Torr. & A. Gray)
                            (clones 505372 and 505508)
                            P. maximowiczii A. Henry ×
                            P. trichocarpa Torr. & A. Gray
                            (clone 750361)
                            P. maximowiczii A. Henry ×
                            P. balsamifera L. (clones 915302,
                            915313, 915318)
                            (P. deltoides W. Bartram × P.
                            nigra L.) × P. trichocarpa Torr. &
                            A. Gray (clone 915508)
Théroux-Rancourt et al.     Assiniboine: [(P. × ‘Walker’:        2           N/A                 Canada       Greenhouse     3
(2014)                      P. deltoides W. Bartram × P. ×                                                    and growth
                            petrowskiana R. I. Schrod. ex                                                     chamber
                            Regel) × male parent unknown]
                            Okanese [(P.×’Walker’) × P.×
                            petrowskiana R. I. Schrod. ex
                            Regel]
Théroux-Rancourt et al.     (P. maximowiczii A. Henry)×          5           N/A                 Canada       Greenhouse    12
(2015)                      (P. deltoidesW. Bartram ×                                                         and growth
                            P. trichocarpa Torr. & A. Gray)                                                   chamber
                            P. maximowiczii A. Henry ×
                            P. balsamifera L.
                            ‘Walker’ [P. deltoides W. Bartram
                            × (P. laurifolia Ledeb. × P. nigra
                            L.)] × P. deltoides W. Bartram
                            ‘Walker’ × P. petrowskyana Schr.
                            P. balsamifera L.
Tissue and Lewis (2010)     P. deltoides W. Bartram              1           Phosphorous and     Australia    Growth        76
                                                                             atmospheric CO2                  chamber
Tognetti et al. (https://   P. × euramericana (P. nigra L. ×                 Zinc soil contam-   Italy         Greenhouse   24
doi.org/10.5061/dryad.      P. deltoides W. Bartram) (clone                  ination
w3r2280qq)                  i-214)
Tognetti et al. (2004)      P. deltoides W. Bartram ×            2           Heavy metals        Italy        Greenhouse    24
                            P. maximowiczii A. Henry
                            P. × euramericana (P. deltoides
                            W. Bartram × P. nigra L.) (clone
                            i-214)
Tosens et al. (2012a)       P. tremula L.                        1           Light and water     Estonia      Growth         8
                                                                             stress                           chamber
Velikova et al. (2011)      P. nigra L.                          20          Nickel soil con-    Italy        Growth        16
                                                                             tamination                       chamber
                                                                                                              (climate
                                                                                                              chamber)
Xu et al. (2020)            P. × euramericana (P. deltoides      1           Nitrogen and        China        Growth         6
                            W. Bartram × P. nigra L.) (cv.                   ozone                            chamber
                            ‘74/76’)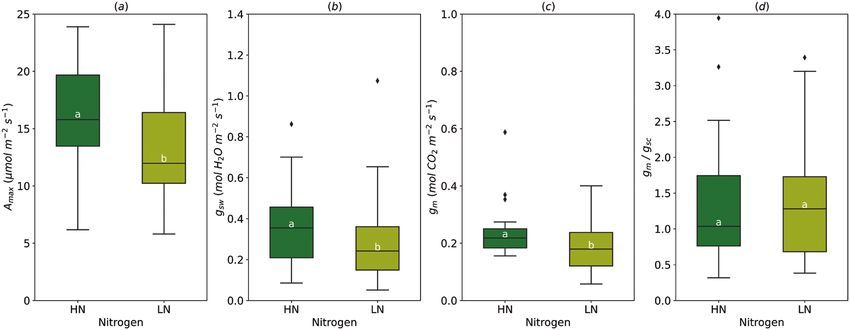
4388 | Elferjani et al.

the model of photosynthesis, and determination of the tran-                    et al., 2012a; Théroux-Rancourt et al., 2014; Momayyezi and Guy,
sition value of CO2 from carboxylation to electron transport                   2017; Xu et al., 2020). Then, gm values >1 mol m−2 s−1 were considered
                                                                               as non-available data (94 entries), and Vcmax and J values were retained
(Harley et al., 1992; Ethier and Livingston, 2004; Manter and                  for further analyses.
Kerrigan, 2004; Dubois et al., 2007; Sharkey et al., 2007; Pons
et al., 2009; Gu et al., 2010). These approaches led to different
fitted values (Miao et al., 2009; Sun et al., 2014a). Although                 Data subsets
A–Ci curve fitting is unreliable for species with large gm, it can             To examine the effect of a given abiotic factor on gm, we estimated
provide results similar to those obtained from direct measure-                 that a minimum of three studies is necessary to have reliable con-
                                                                               clusions, regardless of the genotype used, except copper for which
ments for species with medium to low gm (Niinemets et al.,                     only two studies were examined because they had been conducted
2005, 2006; Warren, 2006; Qiu et al., 2017; Xu et al., 2020).                  under the same experimental conditions. Then, we could come up
Using the compiled A–Ci response curves, we performed curve                    with subsets of data that focused on the same variable and performed
fitting using a single method (Ethier and Livingston, 2004) to                 analyses on them separately (identified in the column ‘Treatment’ in

                                                                                                                                                                 Downloaded from https://academic.oup.com/jxb/article/72/12/4384/6178815 by guest on 30 August 2021
alleviate the fitting method bias and to obtain uniformed es-                  Table 1). Our first goal was to examine the effect of variations in these
                                                                               factors on gm, light-saturated photosynthetic rate (Amax), gs, J, Vcmax,
timates of gm, maximum rate of carboxylation (Vcmax) and rate                  and in a second step, the relationships between gm and other photo-
of electron transport (J). We further collected related variables              synthetic characteristics (Amax, gs, J, Vcmax). The data subsets included
like leaf nitrogen content, stomatal conductance, and specific                 the following environmental factors:
leaf area (SLA) when data were available. Our main goal was                    •		 Canopy level: four studies addressed the photosynthetic activity of
to find trends in the response of mesophyll conductance to                         leaves at the bottom, middle and top of trees (Niinemets et al., 1998;
prevalent abiotic stressors and to examine the relationship be-                    Calfapietra et al., 2005; Merilo et al., 2010; Benomar, 2012).
tween gm and other leaf traits.We believe that a meta-analytical               •		 Atmospheric CO2: we examined the response of trees to elevated at-
approach to analyse the accumulated data on the diffusion of                       mospheric CO2 from the studies of Calfapietra et al. (2005), Merilo
                                                                                   et al. (2010) and Tissue and Lewis (2010). We considered 370 ppm
CO2 through the mesophyll diffusion pathway in relation to                         as the control treatment in the three studies, while the elevated CO2
other photosynthesis-related traits provides key insights into                     was 550 ppm of CO2 for the studies of Calfapietra et al. (2005) and
the different controls on mesophyll conductance and into the                       Merilo et al. (2010), and 700 ppm for the study of Tissue and Lewis
environmental plasticity of mesophyll conductance. We aim to                       (2010).
contribute to the efforts of improving poplar photosynthetic                   •		 Copper (Cu) stress: datasets from the studies of Borghi et al. (2007)
                                                                                   and Borghi et al. (2008) were used to examine the response of poplar
efficiency in poplar breeding programs, and to improve mod-                        trees to contamination of the substrate with Cu. Treatments were
elling of global carbon assimilation of biomass and bioenergy                      assigned to three levels of Cu: 0 (0–0.4 µM), 20 (20–25 µM) and 75
crops under climate change.                                                        (75–100 µM).
                                                                               •		 Soil nitrogen (N) content: high vs. low soil N content treatments
                                                                                   were reported in four studies: Ripullone et al. (2003), Calfapietra
                                                                                   et al. (2005), Benomar et al. (2018) and Xu et al. (2020). In the study
Materials and methods                                                              of Merilo et al. (2010), the authors showed that no effect of nitrogen
                                                                                   fertilization was observed due to high background nutrient availa-
Data collection
                                                                                   bility in the plantation site.
Data were collected by a web search in Web of Science, Scopus, and             •		 Soil moisture: water status of trees was assessed and data from four
Google Scholar using the following key words: (‘Populus’ or ‘poplar’ or            studies were classified into two treatments: control (optimal wa-
‘hybrid poplar’ or ‘aspen’) and (‘Vcmax’ or ‘maximum rate of electron              tering) vs. water deficit (Li et al., 2013; Tosens et al., 2012a; Théroux-
transport (Jmax)’ or ‘mesophyll conductance’). At this step, the abstract of       Rancourt (data available at Dryad Digital Repository: https://doi.
every item was checked to confirm the paper is actually about gm. Then,            org/10.5061/dryad.7sqv9s4s0); Benomar (data available at Dryad
we looked at the ‘Materials and methods’ section of selected papers where          Digital Repository: https://doi.org/10.5061/dryad.9cnp5hqhp).
A–Ci response curves of Populus spp. were measured.
   To get raw data of A–Ci response curves, we contacted the corres-           For Xu et al. (2020), we extracted data from the article (means and
ponding authors or co-authors of the targeted studies by e-mail and via        standard errors) and generated three replicates assuming a normal distri-
ResearchGate. We obtained 23 datasets from published studies and three         bution using the SURVEYSELECT procedure of SAS (version 9.4; SAS
datasets from Benhomar, Tognetti and Théroux-Rancourt studies (Table           Institute, Cary, NC, USA). The reason is that the authors used the same
1; datasets available at Dryad Digital Repository). Collectively, they pro-    curve fitting approach (Ethier and Livingston, 2004) the we used in this
vided a total of 815 A–Ci response curves.                                     meta-analysis study (Table 1).
   The total data of 72 genotypes were collected from measurements                For studies with two or more investigated factors, we considered the
on plants growing in plantations (five studies), or under controlled           different levels of the factor of interest and the control level of the rest of
conditions (greenhouse or growth chamber set-ups; 21 studies) with             the factors to avoid between-factor interaction effects on the results. For
optimal and stressful conditions (Table 1). After compiling all A–Ci           example, in Calfapietra et al. (2005), trees were subject to different levels
curves, the quality of the data was assessed based on the following cri-       of N and CO2; when we focused on the effect of N, we selected trees
teria: (i) only curves with at least two points in the saturation region       exposed to ambient CO2 only (control).
(J region) were retained; (ii) only fitted curves with P-value
Meta-analysis of mesophyll conductance in poplar under abiotic stress | 4389

C3 plants (Farquhar et al., 1980). This method was calibrated for low gm
                                                                               ∂Ac   Vcmax Γ∗ + kc 1 + O ko
species (
4390 | Elferjani et al.
A ranged from 4 to 15 µmol m−2 s−1. Average gsw significantly de-
creased under medium (20 µM, 0.17±0.02 mol H2O m−2 s−1)
and high Cu treatment (75 µM, 0.18±0.03 mol m−2 s−1), com-
pared with control treatment (Fig. 4B). Increasing Cu concen-
tration in the soil did not affect gm and the gm/gsc ratio (Fig.
4C, D).
Soil nitrogen
Amax was significantly greater (16.07±0.61 µmol m−2 s−1) under
high soil nitrogen (HN, 250 kg N ha−1 y−1 in field study or
20 mM for pot study) compared with low nitrogen treatment
Downloaded from https://academic.oup.com/jxb/article/72/12/4384/6178815 by guest on 30 August 2021
(LN, 12.93±0.65 µmol m−2 s−1) (Fig. 5A). A high supply of ni-
trogen increased gsw (from 0.29±0.03 in LN to 0.36±0.03 mol
B m−2 s−1 in HN) and gm (from 0.19±0.02 to 0.23±0.02 to mol
m−2 s−1), but had no effect on the gm/gsc ratio (1.38±0.16 on
average) (Fig. 5B–D).
Soil moisture
Average Amax decreased by drought (range of leaf predawn
water potential under water deficit, Ψ leaf=−0.7 to −0.8, soil
water content=10%), dropping from 17.13±0.71 µmol m−2
s−1 to 14.62± 0.91 µmol m−2 s−1 on average with the min-
imum value (3.83 µmol m−2 s−1) much lower than in watered
trees (8.90 µmol m−2 s−1) (Fig. 6A). As expected, soil moisture
deficit markedly altered gsw, decreasing its average value from
0.33±0.02 mol m−2 s−1 in control trees to 0.20±0.03 mol m−2
Fig. 1. Cumulative number of published studies for mesophyll
s−1 under drought conditions (Fig. 6B). Drought had the same
conductance (gm) between the years 2000 and 2020 (A), and cumulative effect on gm, but to a lesser extent than gsw. gm decreased from
number of published studies for mesophyll conductance (gm) in Populus 0.27±0.02 mol m−2 s−1 to 0.19±0.02 mol m−2 s−1 under soil
spp. between the years 2001 and 2020 (B). The number of publications moisture deficit (Fig. 6C). In addition, the gm/gsc ratio increased
was determined using keywords (e.g. gm and Populus) through database by 37% when plants were subject to drought (Fig. 6D).
search available at the Web of Science Core Collection (https://clarivate.
com/webofsciencegroup/solutions/web-of-science-core-collection/).
Quantitative limitations
canopy (1.17±0.11), compared with the mid-canopy leaves
(0.88±0.09) and was not different everywhere else (Fig. 2D). In general, photosynthetic rate was mostly limited by CO2
Vcmax increased similarly to Amax and gm from the bottom to diffusion (up to 75%): stomatal limitation (Ls) and mesophyll
the top of the canopy (Fig. 2E); however, SLA had an opposite limitation (Lm) (Table 2). Biochemical limitation (Lb) of photo-
trend (Fig. 2F). synthesis rate was relatively low. Higher atmospheric CO2
decreased biochemical limitation (16.62% to 14.73%) and in-
creased mesophyll limitation (from 41.80% to 44.28%) while
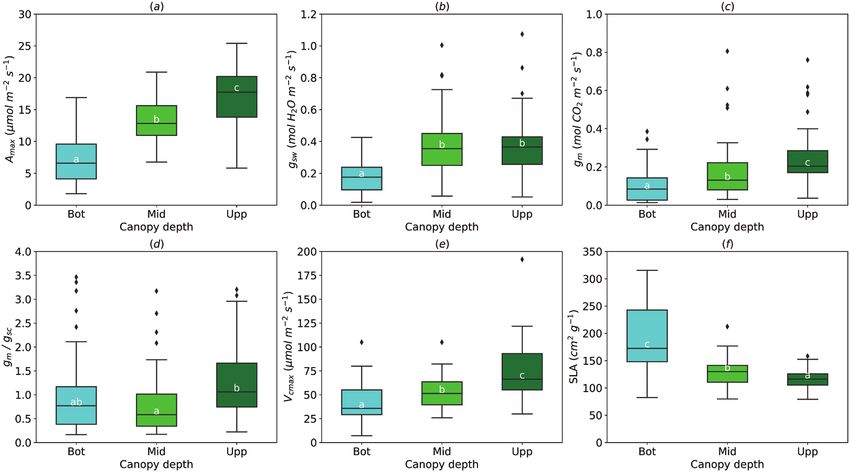
Atmospheric CO2 stomatal limitation remained unchanged. Within the canopy,
Increased atmospheric CO2 had no effect on average Amax stomatal and biochemical limitations were the greatest in the
(14.43±0.60 µmol m−2 s−1), gm (0.21±0.02 mol m−2 s−1) and upper (47.79%) and the middle (16.05%) layers of the canopy,
gm/gsc (1.09±0.11) (Fig. 3A–C). However, average gsw was higher respectively (Table 2). The mesophyll conductance limitation
(0.40±0.03 mol H2O m−2 s−1) under ‘Ambient’, compared with was higher at the middle (50.47%) and the bottom (50.85%)
‘Elevated’ CO2 (0.32±0.02 mol H2O m−2 s−1) (Fig. 3B). than at the upper part of the canopy (40.51%). The decrease of
Amax (58.04 %) from the top, as a reference, to the bottom of
the canopy (calculated with Equation 10) was mostly caused by
Copper stress
mesophyll (absolute limitation=29.48%), followed by stomatal
Amax was not affected when soil Cu concentration increased (19.16%) limitation and to a lesser extent by Vcmax (5.11%).
from 0 to 20 or 75 µM (9.67±0.95 µmol m−2 s−1) (Fig. 4A). At the middle of the canopy, the decrease of Amax (21.58%)
It should be noted that at the highest Cu level (75 µM), Amax was mostly due to gm (13.15%) and to a lesser extent to VcmaxMeta-analysis of mesophyll conductance in poplar under abiotic stress | 4391
Downloaded from https://academic.oup.com/jxb/article/72/12/4384/6178815 by guest on 30 August 2021
Fig. 2. Effect of the leaf position in the canopy (Bot, bottom; Mid, middle; Upp, upper) on light-saturated photosynthetic rate (Amax, A), stomatal
conductance (gsw, B), mesophyll conductance (gm, C), gm/gsc ratio (D), maximum rate of carboxylation (Vcmax, E), and specific leaf area (SLA, F). For
gm/gsc ratio, gsw for water (mol H2O m−2 s−1) was divided by 1.6 to obtain gsc (mol CO2 m−2 s−1). The horizontal line inside the boxes marks the median
for the observations, the box ends indicate the upper (third) to lower (first) quartiles of the value ranges, and the whiskers indicate the highest and lowest
observations. Means having the same letters are not significantly different at α=0.05 (number of studies=4, number of genotypes=6).
Fig. 3. Effect of the atmospheric CO2 concentration on light-saturated photosynthetic rate (Amax, A), stomatal conductance (gsw, B), mesophyll conductance
(gm, C), and gm/gsc ratio (D). For gm/gsc ratio, gsw for water (mol H2O m−2 s−1) was divided by 1.6 to obtain gsc (mol CO2 m−2 s−1). The horizontal line inside the
boxes marks the median for the observations, the box ends indicate the upper (third) to lower (first) quartiles of the value ranges, and the whiskers indicate
the highest and lowest observations. Means having the same letters are not significantly different at α=0.05 (number of studies=3, number of genotypes=4).
(4.74%) while the contribution of gsc was marginal (2.76%). limitations. The decrease of Amax (20.11 %) under low soil ni-
The copper stress resulted in an increase of the stomatal limi- trogen was mostly caused by gsc (9.38%) and gm (7.58%) and
tation and a decrease in mesophyll and biochemical limita- to a lesser extent by Vcmax (1.42%). Water stress increased sto-
tions. Change in soil nitrogen did not affect the status of the matal limitation and decreased biochemical limitation but had4392 | Elferjani et al.
Downloaded from https://academic.oup.com/jxb/article/72/12/4384/6178815 by guest on 30 August 2021
Fig. 4. Effect of the soil copper (Cu) concentration on light-saturated photosynthetic rate (Amax, A), stomatal conductance (gsw, B), mesophyll
conductance (gm, C), and gm/gsc ratio (D). For gm/gs ratio, gs for water (mol H2O m−2 s−1) was divided by 1.6 to obtain gsc (mol CO2 m−2 s−1). The horizontal
line inside the boxes marks the median for the observations, the box ends indicate the upper (third) to lower (first) quartiles of the value ranges, and the
whiskers indicate the highest and lowest observations. Means having the same letters are not significantly different at α=0.05 (number of studies=2,
number of genotypes=3).
Fig. 5. Effect of the soil nitrogen content (HN, high nitrogen; LN, low nitrogen) on light-saturated photosynthetic rate (Amax, A), stomatal conductance
(gsw, B), mesophyll conductance (gm, C), and gm/gsc ratio (D). For gm/gsc ratio, gsw for water (mol H2O m−2 s−1) was divided by 1.6 to obtain gsc (mol CO2
m−2 s−1). The horizontal line inside the boxes marks the median for the observations, the box ends indicate the upper (third) to lower (first) quartiles of
the value ranges, and the whiskers indicate the highest and lowest observations. Means having the same letters are not significantly different at α=0.05
(number of studies=5, number of genotypes=7).
no effect on mesophyll limitation (Table 2). Therefore, the on the collected data, gm was significantly correlated to gsw
observed decrease in Amax (21.02%) under water deficit was (P=0.04). However, the relationship was not linear. gm was the
mainly due to stomatal (15.22 %) and mesophyll limitation highest (0.4–0.5 mmol m−2 s−1) when gsw values were inter-
(7.64 %). mediate (0.2–0.4 mol m−2 s−1), and lowest at high gsw values
(Fig. 7E).
Relationship between CO2 diffusion and photosynthetic We found a significant negative exponential relationship
activity between SLA and gm (P=0.001) (Fig. 7G) based on the col-
lected data from studies that measured SLA (n=12). Leaf
Amax was strongly correlated to both gsw and gm (P=0.001) nitrogen content reported by three studies showed a signifi-
and to Vcmax (P=0.001) over all the studies (Fig. 7A–C). Based cant correlation between gm and N content per area (Narea)Meta-analysis of mesophyll conductance in poplar under abiotic stress | 4393
Downloaded from https://academic.oup.com/jxb/article/72/12/4384/6178815 by guest on 30 August 2021
Fig. 6. Effect of the soil moisture on light-saturated photosynthetic rate (Amax, A), stomatal conductance (gsw, B), mesophyll conductance (gm, C), and
gm/gsc ratio (D). For gm/gsc ratio, gsw for water (mol H2O m−2 s−1) was divided by 1.6 to obtain gsc (mol CO2 m−2 s−1). The horizontal line inside the boxes
marks the median for the observations, the box ends indicate the upper (third) to lower (first) quartiles of the value ranges, and the whiskers indicate the
highest and lowest observations. Means having the same letters are not significantly different at α=0.05 (number of studies=4, number of genotypes=13).
Table 2. The relative limitation (%) of stomatal conductance, mesophyll conductance, and biochemistry to photosynthesis (for each
treatment, the sum of relative limitations is 100%)
Factor Treatment Stomatal limitation (Ls) Mesophyll limitation (Lm) Biochemical limitation (Lb)
Canopy level Bottom 37.71 (2.11) 50.86 (2.68) 11.43 (1.22)
Middle 33.46 (1.99) 50.48 (2.4) 16.06 (1.34)
Upper 45.97 (2.18) 40.52 (1.98) 13.69 (1.09)
Atmospheric CO2 Ambient 41.57 (2.3) 41.8 (2.27) 16.62 (1.43)
Elevated 40.97 (1.87) 44.29 (2.04) 14.74 (1.21)
Copper stress 0 μM Cu 42.42 (6.78) 31.17 (7.38) 26.43 (7.1)
20 μM Cu 57.88 (4.96) 25.16 (6.7) 16.96 (2.71)
75 μM Cu 59.13 (7.58) 28.22 (6.92) 12.65 (1.29)
Soil nitrogen High nitrogen 45.09 (2.49) 39.31 (2.07) 15.6 (1.46)
Low nitrogen 46.02 (2.69) 39.27 (2.37) 14.71 (1.67)
Soil moisture Control 42.47 (2.29) 38.04 (1.97) 19.49 (1.09)
Drought 48.8 (2.78) 38.74 (2.11) 12.46 (1.25)
Data are expressed as means (SD).
(Fig. 7F). gm increased with Narea until a saturation point variation of gm within the canopy and its mechanistic basis are
(~0.25 mol m−2 s−1). scarce, in particular for Populus spp. This situation may explain
why most global carbon cycle models remain ‘gm-lacking’, with
possible consequences, such as overestimation of the fertiliza-
Discussion tion effect of CO2 on global gross primary production and
Canopy level underestimation of water-use efficiency (WUE) and canopy
gross photosynthesis under future climate (Sun et al., 2014b;
The scaling up of photosynthesis from leaves to the canopy Knauer et al., 2019).
and stands (using the model of Farquhar et al. (1980)) requires The steep and parallel increase of gm, Amax, and Vcmax from
a deep understanding of within-canopy variations in leaf the bottom to the top of the canopy found here for Populus spp.
morpho-physiology and the main drivers of foliage acclimation is in agreement with the findings of Niinemets et al. (2006) for
to the dynamic gradient of environmental conditions (light, Quercus ilex L., Montpied et al. (2009) for Fagus sylvatica L., and
temperature, vapor pressure deficit (VPD) and soil moisture) Warren et al. (2003) for Pseudotsuga menziesii (Mirbel) Franco.
(Niinemets et al., 2006; Buckley and Warren, 2014; Niinemets A decrease of gm from the bottom to the top of the canopy
et al., 2015). Unfortunately, pieces of knowledge regarding the was also reported (Bögelein et al., 2012; Cano et al., 2013). We4394 | Elferjani et al.
A B
Downloaded from https://academic.oup.com/jxb/article/72/12/4384/6178815 by guest on 30 August 2021
C D
E F
G H
Fig. 7. Relationship between light-saturated photosynthetic rate (Amax), stomatal conductance (gsw), mesophyll conductance (gm), maximum rate of
carboxylation (Vcmax), electron transport rate (J), gm/gsc ratio, specific leaf area (SLA) and per area leaf nitrogen concentration (Narea). For gm/gsc ratio, gsw
for water (mol H2O m−2 s−1) was divided by 1.6 to obtain gsc (mol CO2 m−2 s−1).Meta-analysis of mesophyll conductance in poplar under abiotic stress | 4395
observed a greater gm limitation under shade conditions (mid Atmospheric CO2
and bottom of canopy), which may lead to an overestimation
of canopy photosynthesis. Overall, our results highlight the The response of photosynthetic capacity and diffusion of CO2
need to incorporate the acclimation of gm to light conditions to free-air CO2 enrichment considerably differed between
along the canopy in process-based models. species and experimental set-ups. The decrease in Amax and
We observed a significant inverse relationship between gm gsw in response to elevated CO2 shown in our meta-analysis
and SLA, comparable to previous studies (Niinemets et al., is in agreement with numerous studies on Populus spp. and
2006; Montpied et al., 2009; Tosens et al., 2012b). This sug- other species (Ainsworth and Rogers, 2007; Medlyn et al.,
gests that the increase in leaf thickness (lower SLA), e.g. in 2013; DaMatta et al., 2016), but is in disagreement with the
developing leaves and in leaves grown under higher light, may findings of some other studies, e.g. Sigurdsson et al. (2001)
be associated with increased gm (Tosens et al., 2012b). Contrary and Uddling et al. (2009). For gm, the effect of growth CO2
to this, a positive relationship between gm and SLA was demon- changed among studies and some species having an intrinsic
Downloaded from https://academic.oup.com/jxb/article/72/12/4384/6178815 by guest on 30 August 2021
strated across Solanum species (Muir et al., 2014), reflecting the low gm are more likely to respond to elevated CO2 than species
effect of increased leaf density and mesophyll cell wall thick- with high intrinsic gm (Niinemets et al., 2011). However, sev-
ness on gm.These lines of evidence collectively demonstrate the eral studies have reported that gm may decrease or be unrespon-
complex nature of the relationship between SLA and gm, re- sive to CO2 enrichment (Singsaas et al., 2004; Zhu et al., 2012;
flecting the circumstance that SLA is an inverse of the product Kitao et al., 2015; Mizokami et al., 2019). This suggests that
of leaf thickness and density, which can respond differently to the increase of Amax under elevated CO2 cannot be attributed
environmental drivers (Niinemets, 1999; Poorter et al., 2009). solely to gm variation (Singsaas et al., 2004). The absence of gm
The profile of gm within the canopy observed here may be par- response to elevated CO2 complicates the research on mech-
tially attributable to the morphological acclimation of Populus anisms underlying this variation. Unlike gm, researchers have
spp. foliage to light availability within the canopy. Moreover, proposed some hypotheses such as least-cost theory, nitrogen
this inverse relationship between SLA and gm was used as an limitation, and resources investment to explain the decrease
empirical model to estimate a maximum attainable gm at dif- of Amax, Vcmax, and gs under elevated CO2 (Leakey et al., 2009;
ferent canopy layers for C3 plants and was implemented in Smith and Keenan, 2020).
the Community Land Model (CLM.4.5) (Sun et al., 2014b;
Knauer et al., 2019).
Copper stress
The change in morphological traits and their role in the
acclimation of gm to a vertical gradient of environmental con- Similar to our findings, gm remained unchanged in the herb-
ditions within the canopy need additional investigation. For aceous plant Silene paradoxa L., exposed to high Cu concen-
instance, shade acclimation of leaf morphology is associated tration, although gs decreased significantly (Bazihizina et al.,
with a lower surface area of chloroplasts exposed to intercel- 2015). In other cases of exposure to other heavy metals, like
lular air spaces (Sc/S) and thicker chloroplasts (Hanba et al., nickel (Ni), Velikova et al. (2011) reported a significant de-
2002; Niinemets et al., 2006; Tosens et al., 2012b; Peguero-Pina crease in chloroplast CO2 content and mesophyll conduct-
et al., 2015). Species-specific leaf development patterns (i.e. ance in black poplar (P. nigra L.) exposed to 200 µM Ni under
evergreen sclerophyllous versus deciduous broadleaves) af- a hydroponic set-up (compared with control of 30 µM Ni).
fect limitations to gas diffusion, thus determining the carbon This reduction of gm might be attributed to an alteration of
balance of leaves (Marchi et al., 2007). However, light acclima- leaf structure by toxic effects of high concentrations of heavy
tion may be species-specific and altered by water, soil nitrogen, metals in mesophyll cells (Velikova et al., 2011). Hermle et al.
and leaf ontogeny (Niinemets et al., 2006; Tazoe et al., 2009; (2007), reported an acceleration of senescence and necrosis of
Peguero-Pina et al., 2015; Shrestha et al., 2018). It is still unclear mesophyll cells in P. tremula L. leaves exposed to Cu, Zn, Cd,
whether the gm profile within the canopy is the result of the and Pb at 640, 3000, 10, and 90 mg kg−1 soil, respectively, and
change in SLA. a decrease of chloroplast size from the early stages of exposure.
Our results showing higher gsw and gm/gsc at the top of the The study of Hermle et al. (2007) also reported the thickening
canopy are in disagreement with the findings of Montpied of cell walls and change of their chemical composition in dam-
et al. (2009) and Bögelein et al. (2012), suggesting a species- aged mesophyll cells, which might have affected permeability
and environment-specific gradient of gm/gs. Temperature and of cell walls and diffusion of CO2 through them. Mercury
VPD responses of gm and gs are different (Cano et al., 2013), (Hg; HgCl2 form) altered CO2 diffusion through aquaporins,
resulting in different diurnal patterns of gm and gs. Then, the a membrane channel of CO2 diffusion, in faba bean (Vicia faba
gradient of gm/gs ratio along the canopy may drive the WUE at L.) (Terashima and Ono, 2002) and significantly reduced gm in
the canopy level and the midday depression of photosynthetic P. trichocarpa Torr. & Gray. HgCl2 may also decrease gm indir-
rate regardless of the level of isohydry of clones (Cano et al., ectly by disrupting carbonic anhydrase activity, as reported by
2013; Buckley and Warren, 2014; Stangl et al., 2019). Momayyezi and Guy (2018), who demonstrated that carbonic4396 | Elferjani et al.
anhydrase activity is strongly associated with gm variation in 2012a). Simultaneously, drought stress induced a decrease in
P. trichocarpa Torr. & Gray (Momayyezi and Guy, 2017). SLA accompanied with an increase in the cell wall thickness
and a decrease in the chloroplast surface area exposed to the
Soil nitrogen intercellular air space per unit leaf area (Tosens et al., 2012a).
Other studies have shown that biochemical changes induced
The increase of Amax by the enhancement of Vcmax in response by drought stress could decrease CO2 diffusion to carboxyl-
to more available soil nitrogen has been established in the lit- ation sites in the chloroplast (Miyazawa et al., 2008a).
erature. However, the possible contribution of gm to this aug- Adaptation to the local environment might be a key driver
mentation remains unexplored for several species. Our results of gm variation among taxa, similarly to other morpho-
showed a concomitant increase of gm with a higher supply physiological traits. Interspecific and intraspecific differences
of N. A positive correlation between the level of expression in gm from mesic versus xeric environments (Quercus spp. and
of aquaporin genes (plasma membrane intrinsic proteins and Eucalyptus spp.) were reported by Zhou et al. (2014). Their
Downloaded from https://academic.oup.com/jxb/article/72/12/4384/6178815 by guest on 30 August 2021
tonoplast intrinsic proteins) and gm has been reported (Hanba study showed that gm, as well as gs, Vcmax, and J of species from
et al., 2004; Flexas et al., 2006; Kaldenhoff et al., 2008; Perez- drier regions was less sensitive to water deficit, which main-
Martin et al., 2014), although it is still unclear whether this tains transpiration and photosynthesis activity at higher rates
is a direct effect or a pleiotropic effect reflecting simultan- under drought, compared with species from the mesic envir-
eous increase in Amax, gm, and gs (Flexas et al., 2012). Recent onment. Marchi et al. (2008) observed that structural protec-
studies have demonstrated that an increase in gm has coincided tion of mesophyll cells had a priority over functional efficiency
with an increase in the amount of aquaporins after fertiliza- of photochemical mechanisms in Olea europaea L. (evergreen
tion (Miyazawa et al., 2008b; Zhu et al., 2020). The biochem- sclerophyllous) but not in Prunus persica L. (deciduous broad-
ical limitation to photosynthesis was relatively low (16%) and leaf), depending on age-related variation in mesophyll anatomy.
the absolute contribution of this limitation to the decrease in
Amax under low nitrogen was much lower again (1.5%). This
suggests that the limitations to photosynthesis resulting from Conclusion and future directions
low soil nitrogen are more attributable to CO2 diffusion for
Populus spp. The present review shows that gm in Populus spp. varies pre-
dictably along light gradients and that it responds to changes
Soil moisture in soil moisture and nutrient availability, but is not affected by
metal concentration and increasing atmospheric CO2 concen-
Although many studies showed a decline of gm in response to tration. Although metabolic processes noticeably influence the
soil water deficit (Flexas et al., 2009; Galle et al., 2009; Tosens response of gm to environmental changes, physical constraints
et al., 2012a), it remains unclear if this limitation is happening through leaf development and ageing need to be considered
within the mesophyll environment or occurs as a result of a in scaling photosynthesis from leaf to canopy, and in breeding
stomatal limitation, which decreases intercellular CO2 (Ci). Ma programs for high WUE. Because fast-growing Populus spp.
et al. (2021) reported that, across a broad range of species, gm and trees are important players in combating climate change, miti-
gs decline concomitantly, which has the effect of keeping the gating carbon emissions to some extent, comparisons of geno-
gm/gsc ratio constant for all species and between well-watered types with different adaptations to changing environments and
and water-stressed plants, but with variation between plant breeding for novel genotype–climate associations are urgently
functional types. We report similar gm/gsc ratios within our soil needed. This study shows that the variability of gm in dif-
moisture dataset. However, reports in poplar have shown that ferent experimental conditions offers a potential indicator for
this concomitant decline is not present all the time or within the improving Populus spp. productivity and resilience. However,
full range of gm and gs values observed.Théroux Rancourt et al. more research is yet needed, also combined with anatomical
(2015) showed that, in hybrid poplar, gm remained unchanged studies, to better understand the sources of variation of CO2
(~0.3 mol m–2 s–1) following soil drying until Ψ leaf≈−1.2 MPa, diffusion through the mesophyll and their consequences on
after which gm decreased significantly. Our results showed that carbon assimilation and growth.
although gm/gs increased under water deficit conditions, sto- Moreover, determination of the efficiency and optimal
matal conductance was, in absolute term, the most important age for early selection of fast-growing poplar clones require
limitation to Amax, as reported elsewhere (Cano et al., 2013). In an understanding of the genetic control and age-based gen-
a trial on Quercus robur L. and Fraxinus angustifolia Vahl grown etic correlations for traits related to gm and growth. For that,
in the field, Grassi and Magnani (2005) reported a concomi- a detailed evaluation of the genotypic control of the vari-
tant decrease of both gs and gm in a dry year (Ψ soil≈−1.7 MPa), ances and clonal heritability of gm is needed. Finally, the
compared with a wetter year (Ψ soil≈−0.2 MPa). In P. tremula L., identification of molecular bases of the regulation of gm is
gm significantly declined when Ψ leaf of saplings dropped from necessary to further refine a multi-criteria early selection
−0.3 to −0.7 MPa due to applied osmotic stress (Tosens et al., approach of poplar clones dedicated to the future forestryMeta-analysis of mesophyll conductance in poplar under abiotic stress | 4397
capable of ensuring better productivity and increased resist- mesophyll conductance in C4 plants, and reveals that mesophyll conduct-
ance decreases as leaves age in both C4 and C3 plants. New Phytologist
ance to environmental stresses (frost, drought, water logging, 210, 875–889.
heavy metals, heat waves, etc.). Barbour MM, Warren CR, Farquhar GD, Forrester G, Brown H. 2010.
Variability in mesophyll conductance between barley genotypes, and effects
on transpiration efficiency and carbon isotope discrimination. Plant, Cell &
Environment 33, 1176–1185.
Supplementary data Bazihizina N, Colzi I, Giorni E, Mancuso S, Gonnelli C. 2015.
The following supplementary data are available at JXB online. Photosynthesizing on metal excess: copper differently induced changes in
various photosynthetic parameters in copper tolerant and sensitive Silene
Table S1. Analysis of variance of the effect of different fac- paradoxa L. populations. Plant Science 232, 67–76.
tors on photosynthesis-related traits. Benomar L. 2012. Plantation de peuplier hybride dans la région boréale du
Canada: Espacement entre les arbres, déploiement mixte et modélisation
éco-physiologique de l’assimilation du carbone à l’échelle de la canopée.
Downloaded from https://academic.oup.com/jxb/article/72/12/4384/6178815 by guest on 30 August 2021
PhD thesis, Université du Québec en Abitibi-Témiscamingue. https://
Acknowledgements depositum.uqat.ca/id/eprint/442
Benomar L. 2021. Dataset: Mesophyll conductance to CO2 in relation to
This research was supported by the University of Québec in Abitibi-
drought in hybrid poplar. Dryad Digital Repository https://doi.org/10.5061/
Témiscamingue (UQAT) as startup funds to ML. The authors acknow- dryad.9cnp5hqhp
ledge researchers who kindly provided data used in the meta-analysis, Benomar L, Lamhamedi MS, Pepin S, Rainville A, Lambert MC,
and the editor and two anonymous reviewers for their constructive Margolis HA, Bousquet J, Beaulieu J. 2018. Thermal acclimation of
comments. photosynthesis and respiration of southern and northern white spruce seed
sources tested along a regional climatic gradient indicates limited potential
to cope with temperature warming. Annals of Botany 121, 443–457.
Benomar L, Moutaoufik MT, Elferjani R, Isabel N, DesRochers A,
Author contributions El Guellab A, Khlifa R, Idrissi Hassania LA. 2019. Thermal acclimation
of photosynthetic activity and RuBisCO content in two hybrid poplar clones.
RE and LB conceived the study, developed methodology, carried out PLoS One 14, e0206021.
data curation, formal analysis, investigation, data visualization, wrote ori- Bögelein R, Hassdenteufel M, Thomas FM, Werner W. 2012.
ginal draft, and reviewed and edited the manuscript. MM contributed to Comparison of leaf gas exchange and stable isotope signature of
data curation and visualization, and to reviewing and editing the manu- water-soluble compounds along canopy gradients of co-occurring Douglas-
script. RT and UN contributed to investigation, methodology, and to re- fir and European beech. Plant, Cell & Environment 35, 1245–1257.
viewing and editing the manuscript. MM carried out funding acquisition Borghi M, Tognetti R, Monteforti G, Sebastiani L. 2007. Responses of
Populus × euramericana (P. deltoides × P. nigra) clone Adda to increasing
and contributed to reviewing and editing the manuscript. RYS, GTR,
copper concentrations. Environmental and Experimental Botany 61, 66–73.
TT, FR. SBG, MSL, and CC contributed to reviewing and editing the
Borghi M, Tognetti R, Monteforti G, Sebastiani L. 2008. Responses of
manuscript. two poplar species (Populus alba and Populus × canadensis) to high copper
concentrations. Environmental and Experimental Botany 62, 290–299.
Bown HE, Watt MS, Mason EG, Clinton PW, Whitehead D. 2009. The
influence of nitrogen and phosphorus supply and genotype on mesophyll
Conflict of interest conductance limitations to photosynthesis in Pinus radiata. Tree Physiology
29, 1143–1151.
The authors declare that there is no conflict of interest.
Buckley TN, Warren CR. 2014. The role of mesophyll conductance in the
economics of nitrogen and water use in photosynthesis. Photosynthesis
Research 119, 77–88.
Data availability Calfapietra C, Tulva I, Eensalu E, Perez M, De Angelis P, Scarascia-
Mugnozza G, Kull O. 2005. Canopy profiles of photosynthetic parameters
Soil moisture data from Théroux-Rancourt are available at Dryad Digital under elevated CO2 and N fertilization in a poplar plantation. Environmental
Repository (https://doi.org/10.5061/dryad.7sqv9s4s0); Benomar data Pollution 137, 525–535.
are available at Dryad Digital Repository (https://doi.org/10.5061/ Cano FJ, Sánchez-Gómez D, Rodríguez-Calcerrada J, Warren CR,
dryad.9cnp5hqhp);Tognetti data are available at Dryad Digital Repository Gil L, Aranda I. 2013. Effects of drought on mesophyll conductance and
photosynthetic limitations at different tree canopy layers. Plant, Cell &
(https://doi.org/10.5061/dryad.w3r2280qq).All other datasets generated Environment 36, 1961–1980.
for this study are available from the corresponding author upon request.
Castagna A, Di Baccio D, Ranieri AM, Sebastiani L, Tognetti R. 2015.
Effects of combined ozone and cadmium stresses on leaf traits in two
poplar clones. Environmental Science and Pollution Research International
References 22, 2064–2075.
DaMatta FM, Godoy AG, Menezes-Silva PE, Martins SC, Sanglard LM,
Ainsworth EA, Rogers A. 2007. The response of photosynthesis and sto- Morais LE, Torre-Neto A, Ghini R. 2016. Sustained enhancement of
matal conductance to rising [CO2]: mechanisms and environmental inter- photosynthesis in coffee trees grown under free-air CO2 enrichment condi-
actions. Plant, Cell & Environment 30, 258–270. tions: disentangling the contributions of stomatal, mesophyll, and biochem-
Attia Z, Domec JC, Oren R, Way DA, Moshelion M. 2015. Growth and ical limitations. Journal of Experimental Botany 67, 341–352.
physiological responses of isohydric and anisohydric poplars to drought. Di Baccio D, Tognetti R, Minnocci A, Sebastiani L. 2009. Responses
Journal of Experimental Botany 66, 4373–4381. of the Populus × euramericana clone I-214 to excess zinc: carbon assimi-
Barbour MM, Evans JR, Simonin KA, von Caemmerer S. 2016. lation, structural modifications, metal distribution and cellular localization.
Online CO2 and H2O oxygen isotope fractionation allows estimation of Environmental and Experimental Botany 67, 153–163.4398 | Elferjani et al.
Dillaway DN, Kruger EL. 2010. Thermal acclimation of photosynthesis: HvPIP2;1 increases internal CO2 conductance and CO2 assimilation in the
a comparison of boreal and temperate tree species along a latitudinal tran- leaves of transgenic rice plants. Plant and Cell Physiology 45, 521–529.
sect. Plant, Cell & Environment 33, 888–899. Harley PC, Thomas RB, Reynolds JF, Strain BR. 1992. Modelling
Dubois JJ, Fiscus EL, Booker FL, Flowers MD, Reid CD. 2007. photosynthesis of cotton grown in elevated CO2. Plant, Cell & Environment
Optimizing the statistical estimation of the parameters of the Farquhar– 15, 271–282.
von Caemmerer–Berry model of photosynthesis. New Phytologist 176, Hermle S, Vollenweider P, Günthardt-Goerg MS, McQuattie CJ,
402–414. Matyssek R. 2007. Leaf responsiveness of Populus tremula and Salix
Elferjani R, DesRochers A, Tremblay F. 2016. Plasticity of bud phen- viminalis to soil contaminated with heavy metals and acidic rainwater. Tree
ology and photosynthetic capacity in hybrid poplar plantations along a lati- Physiology 27, 1517–1531.
tudinal gradient in northeastern Canada. Environmental and Experimental Kaldenhoff R, Ribas-Carbo M, Sans JF, Lovisolo C, Heckwolf M,
Botany 125, 67–76. Uehlein N. 2008. Aquaporins and plant water balance. Plant, Cell &
Ethier GJ, Livingston NJ. 2004. On the need to incorporate sensitivity Environment 31, 658–666.
to CO2 transfer conductance into the Farquhar–von Caemmerer–Berry leaf Kattge J, Knorr W. 2007. Temperature acclimation in a biochemical
photosynthesis model. Plant, Cell & Environment 27, 137–153. model of photosynthesis: a reanalysis of data from 36 species. Plant, Cell &
Downloaded from https://academic.oup.com/jxb/article/72/12/4384/6178815 by guest on 30 August 2021
Ethier GJ, Livingston NJ, Harrison DL, Black TA, Moran JA. 2006. Environment 30, 1176–1190.
Low stomatal and internal conductance to CO2 versus Rubisco deacti- Kitao M, Yazaki K, Kitaoka S, Fukatsu E, Tobita H, Komatsu M,
vation as determinants of the photosynthetic decline of ageing evergreen Maruyama Y, Koike T. 2015. Mesophyll conductance in leaves of Japanese
leaves. Plant, Cell & Environment 29, 2168–2184. white birch (Betula platyphylla var. japonica) seedlings grown under ele-
Evans JR, Kaldenhoff R, Genty B, Terashima I. 2009. Resistances along vated CO2 concentration and low N availability. Physiologia Plantarum 155,
the CO2 diffusion pathway inside leaves. Journal of Experimental Botany 60, 435–445.
2235–2248. Knauer J, Zaehle S, De Kauwe MG, Bahar NHA, Evans JR, Medlyn BE,
Evans JR, Sharkey TD, Berry JA, Farquhar GD. 1986. Carbon isotope Reichstein M, Werner C. 2019. Effects of mesophyll conductance on
discrimination measured concurrently with gas exchange to investigate CO2 vegetation responses to elevated CO2 concentrations in a land surface
diffusion in leaves of higher plants. Functional Plant Biology 13, 281–292. model. Global Change Biology 25, 1820–1838.
Farquhar GD, von Caemmerer S, Berry JA. 1980. A biochemical model Larocque GR, DesRochers A, Larchevêque M, et al. 2013. Research
of photosynthetic CO2 assimilation in leaves of C3 species. Planta 149, on hybrid poplars and willow species for fast-growing tree plantations: its
78–90. importance for growth and yield, silviculture, policy-making and commercial
Fischerová Z, Tlustos P, Száková J, Sichorová K. 2006. A comparison applications. The Forestry Chronicle 89, 32–41.
of phytoremediation capability of selected plant species for given trace Leakey AD, Ainsworth EA, Bernacchi CJ, Rogers A, Long SP, Ort DR.
elements. Environmental Pollution 144, 93–100. 2009. Elevated CO2 effects on plant carbon, nitrogen, and water relations:
Flexas J, Barbour MM, Brendel O, et al. 2012. Mesophyll diffusion con- six important lessons from FACE. Journal of Experimental Botany 60,
ductance to CO2: an unappreciated central player in photosynthesis. Plant 2859–2876.
Science 193–194, 70–84. Li J, Yu B, Zhao C, Nowak RS, Zhao Z, Sheng Y, Li J. 2013. Physiological
Flexas J, Barón M, Bota J, et al. 2009. Photosynthesis limitations during and morphological responses of Tamarix ramosissima and Populus
water stress acclimation and recovery in the drought-adapted Vitis hybrid euphratica to altered groundwater availability. Tree Physiology 33, 57–68.
Richter-110 (V. berlandieri×V. rupestris). Journal of Experimental Botany 60, Ma WT, Tcherkez G, Wang XM, Schäufele R, Schnyder H, Yang Y,
2361–2377. Gong XY. 2021. Accounting for mesophyll conductance substantially im-
Flexas J, Díaz-Espejo A, Conesa MA, et al. 2016. Mesophyll conduct- proves 13C-based estimates of intrinsic water-use efficiency. New Phytologist
ance to CO2 and Rubisco as targets for improving intrinsic water use effi- 229, 1326–1338.
ciency in C3 plants. Plant, Cell & Environment 39, 965–982. Manter DK, Kerrigan J. 2004. A/Ci curve analysis across a range of woody
Flexas J, Ribas-Carbó M, Diaz-Espejo A, Galmés J, Medrano H. plant species: influence of regression analysis parameters and mesophyll
2008. Mesophyll conductance to CO2: current knowledge and future pro- conductance. Journal of Experimental Botany 55, 2581–2588.
spects. Plant, Cell & Environment 31, 602–621. Marchi S, Guidotti D, Sebastiani L, Tognetti R. 2007. Changes in as-
Flexas J, Ribas-Carbó M, Hanson DT, Bota J, Otto B, Cifre J, similation capacity during leaf development in broad-leaved Prunus persica
McDowell N, Medrano H, Kaldenhoff R. 2006. Tobacco aquaporin and sclerophyllous Olea europaea. Journal of Horticultural Science &
NtAQP1 is involved in mesophyll conductance to CO2 in vivo. The Plant Biotechnology 82, 69–78.
Journal 48, 427–439. Marchi S, Tognetti R, Minnocci A, Borghi M, Sebastiani L. 2008.
Variation in mesophyll anatomy and photosynthetic capacity during leaf
Flexas J, Scoffoni C, Gago J, Sack L. 2013. Leaf mesophyll conduct-
development in a deciduous mesophyte fruit tree (Prunus persica) and an
ance and leaf hydraulic conductance: an introduction to their measurement
evergreen sclerophyllous Mediterranean shrub (Olea europaea). Trees 22,
and coordination. Journal of Experimental Botany 64, 3965–3981.
559–571.
Galle A, Florez-Sarasa I, Tomas M, Pou A, Medrano H, Ribas-
Marmiroli M, Pietrini F, Maestri E, Zacchini M, Marmiroli N,
Carbo M, Flexas J. 2009. The role of mesophyll conductance during water
Massacci A. 2011. Growth, physiological and molecular traits in Salicaceae
stress and recovery in tobacco (Nicotiana sylvestris): acclimation or limita-
trees investigated for phytoremediation of heavy metals and organics. Tree
tion? Journal of Experimental Botany 60, 2379–2390.
Physiology 31, 1319–1334.
Grassi G, Magnani F. 2005. Stomatal, mesophyll conductance and bio- Medlyn BE, Duursma RA, De Kauwe MG, Prentice IC. 2013. The op-
chemical limitations to photosynthesis as affected by drought and leaf on- timal stomatal response to atmospheric CO2 concentration: alternative so-
togeny in ash and oak trees. Plant, Cell & Environment 28, 834–849. lutions, alternative interpretations. Agricultural and Forest Meteorology 182,
Gu L, Pallardy SG, Tu K, Law BE, Wullschleger SD. 2010. Reliable esti- 200–203.
mation of biochemical parameters from C3 leaf photosynthesis–intercellular Mengersen K, Gurevitch J, Schmid CH. 2013. Meta-analysis of primary
carbon dioxide response curves. Plant, Cell & Environment 33, 1852–1874. data. In: Koricheva, J,Gurevitch J, Mengersen K, eds. Handbook of meta-
Hanba YT, Kogami H, Terashima I. 2002. The effect of growth irradiance analysis in ecology and evolution. Princeton, NJ: Princeton University Press,
on leaf anatomy and photosynthesis in Acer species differing in light de- 300–312.
mand. Plant, Cell & Environment 25, 1021–1030. Merilo E, Kaurilind E, Tulva I, Räim O, Calfapietra C, Kull O. 2010.
Hanba YT, Shibasaka M, Hayashi Y, Hayakawa T, Kasamo K, Photosynthetic response to elevated CO2 in poplar (POP-EUROFACE) in
Terashima I, Katsuhara M. 2004. Overexpression of the barley aquaporin relation to leaf nitrogen partitioning. Baltic Forestry 16, 162–171.You can also read