Determination of in vivo biological activities of Dodonaea viscosa flowers against CCL4 toxicity in albino mice with bioactive compound detection ...
←
→
Page content transcription
If your browser does not render page correctly, please read the page content below
www.nature.com/scientificreports
OPEN Determination of in vivo biological
activities of Dodonaea viscosa
flowers against CCL4 toxicity
in albino mice with bioactive
compound detection
Zhao‑Wei Tong1*, Hina Gul2*, Muhammad Awais3*, Salina Saddick4, Falak Sher Khan5,
Muhammad Gulfraz2, Umara Afzal6, Khizar Nazir7, M. Y. Malik8, Sami Ullah Khan9 &
M. Ijaz Khan10*
Dodonaea viscosa L.Jacq. is an evergreen shrub and native to Asia, Africa, and Australia. It has been
used as traditional medicine in different countries. The foremost objective of the current study was
to discover the protective potential of D. viscosa flowers Methanol (DVM) and Chloroform (DVC)
extracts against CCL4 induced toxicity in mice. This study was intended to identify phytochemicals
through HPLC, GCMS, and FT-IR, as well as in vitro antioxidant and in vitro anti-tuberculosis activity.
Our comprehensive findings indicate that Dodonaea viscosa is valuable and widespread herbal
medicine through therapeutic potentials for curing various ailments. Dodonaeaviscosa flowersare
found to have a protective effect against oxidative stress produced by CCL4 in the liver, kidney, and
spleen. The intake of DV extracts restored the level of hepatic enzymes (ALP, AST ALT, and Direct
bilirubin), hematological parameters (RBCs, WBCs, and Platelets), total protein, and liver antioxidant
enzymes (SOD, GPx, and CAT) after a decline in levels by CCL4. Histopathological results discovered
the defensive effect of 300 mg/kg of DVM extract against CCL4 induced damage, thus having an
improved protective effect compared to DVC and control. As a result of metabolite screening, the
total flavonoids and total phenolics were present in abundance. A phytochemical investigation by
HPLC identified gallic acid, epicatechin, cumeric acid, flavonoids, while GCMS estimated oleic acid
(Octadecenoic acid) (C18H34O2), Stearic acid (C18H36O2), Ricinoleic acid (C18H34O3), and Cedrol (C15H26O).
DVM extract exhibited resistance against in vitro Mycobacterium tuberculosis strains. So this study
proposed that the protective effect of DV against oxidative damage induced in the liver, kidney, and
spleen can be correlated to the antioxidant compounds.
Oxidation–reduction reactions fuel different biological processes1 andproduce free radicals such as lipid perox-
ides that damagecell membrane and alters enzyme activity2,3 and induces liver injury, cirrhosis, inflammation,
and necrosis4.
A foremost cause of toxicity is exposure toalcohol, carbon tetrachloride, x-rays, and many other radiations,
which stimulate reactive oxygen species and make different parts of the body susceptible to injury, i.e., liver,
1
Department of Infectious Diseases, Huzhou Central Hospital, Zhejiang 313000, Huzhou, People’s Republic of
China. 2University Institute of Biochemistry and Biotechnology (UIBB), PMAS UAAR Rawalpindi, Rawalpindi,
Pakistan. 3Department of Biochemistry and Molecular Biology, Faculty of Sciences, University of Sialkot,
Sialkot, Pakistan. 4Department of Biological Sciences, Faculty of Science, King Abdulaziz University,
P.O. Box 80203, Jeddah 21589, Kingdom of Saudi Arabia. 5Department of Biotechnology, University of Sialkot,
Sialkot, Pakistan. 6Department of Chemistry, Rawalpindi Women University, Satellite Town, Rawalpindi,
Pakistan. 7Department of Biosciences, University of Wah, Wah Cantt 47040, Pakistan. 8Department of
Mathematics, College of Sciences, King Khalid University, Abha 61413, Kingdom of Saudi Arabia. 9Department
of Mathematics, COMSATS University Islamabad, Sahiwal 57000, Pakistan. 10Department of Mathematics and
Statistics, Riphah International University, I‑14, Islamabad 44000, Pakistan. *email: tongzhaowei2021@126.com;
gulsatti@gmail.com; docter_shahgee@yahoo.com; mikhan@math.qau.edu.pk
Scientific Reports | (2021) 11:13336 | https://doi.org/10.1038/s41598-021-92638-6 1
Vol.:(0123456789)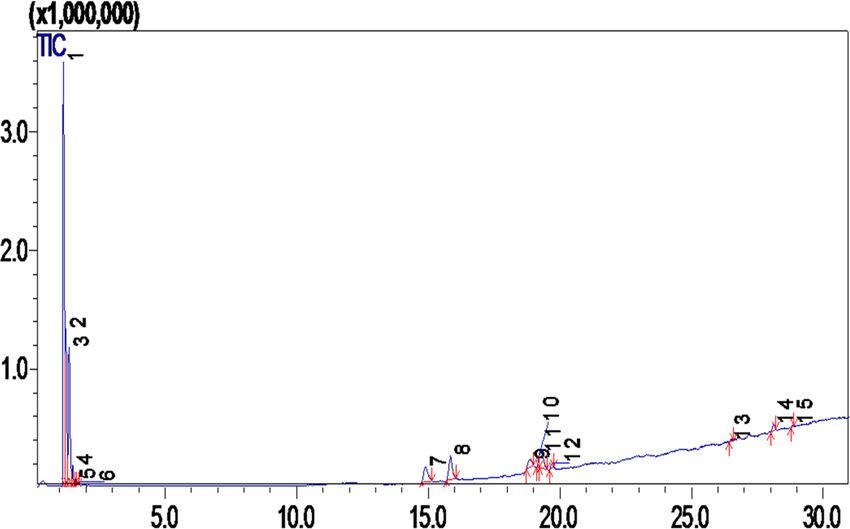
www.nature.com/scientificreports/
kidney, spleen, and many o thers5,6 and facilitate damage to the biological molecule and oxidize most of them7.
CCL4 has been used in a mouse model for chemically induced hepatotoxicity as a result of oxidative stress.
Carbon tetrachloride produces several reactive oxygen species and generates liver injury by cytochrome P450.
Synthetic drugs are inadequate and possible to have adverse effects around the world. So to detoxify the xeno-
biotics, drugs, and infections, natural products have been extensively used in the treatment of various diseases
due to the presence of antioxidants8,9. There is a lot of research to uncover the potential of antioxidants to scav-
enge free radicals and fight against cellular damage, aging, and other chronic diseases10,11. Among antioxidants,
phenolics are extensively distributed in herbal medicines, act as anti-inflammatory compounds, and protect the
anti-oxidant defense system in the liver12,13. Multi-drug-resistant tuberculosis (MDRTB) is growing very fast in
medical science andislooking for a short-term and effective treatment m easure14. Many plant species have always
shown potential in ancient times to treat medical disorders with promising therapeutic a gents15. The knowledge
about a single chemical component in medicinal plants plays a critical role from the method of extraction to
understanding pharmacological assay and possible t oxicity16.
The evergreen shrubDodonaea visocosa (DV) belongs to the family Sapindaceae, which comprises species
(2000) and genera (150). This plant is native to Asia, Africa, and Australia and islocally known as vilayati Mehndi
in South East Asia17. The previous studies reported the presence of phytochemicals such as triterpenoids, fla-
vonoids, saponins, tannins, and coumarins in D V18–20. DV has been widely used in traditional medicineto treat
inflammation, stomach ulcers, and liver a ches21,22. The crude extractof DV revealed antioxidant, anti-microbial,
anti-diabetic, gastro-protective activities and also reported hepato-protective activity in m ice23–26. There is no
detailedstudy reported regarding protective effects of flowers of DV, so taking it into accountpresent study was
conducted to validate the potential of therapeutic activity of DV against liver and other organ toxicity. The
foremost objective of this study was to discover the protective potential of D. viscosa flowers Methanol (DVM)
and Chloroform (DVC) extracts against C CL4 induced toxicity in mice. This study was intended to identify
phytochemicals by using HPLC, GCMS, and FT-IR as well as antioxidantand anti-tuberculosis activities.
Material and methods
Sample collection and preparation. The collection of Dodonaea Viscosaflowers were carried out dur-
ing March and April from Murree hills, District Rawalpindi, Punjab, Pakistanaccording to the guidelines of
institution (Quaid i Azam University, Islamabad)and alsothrough the permission of local community. With the
Help of the Department of Botany Quaid-I-Azam University Islamabad, Pakistan, the plant species was detailed
identifiedby Dr. Mushtaq ahmad (Plant taxonomist, QAU) before further processing. Voucher specimen HG052
was submitted to the herbarium of Pakistan (ISL) for future records. Cleaned specimens were subjected to shade
drying followed by grinding and sieving. Dried the plant sample in a heating oven (37◦C) to eradicate excess
moisture for absolute drying, and the pulverized material was prepared for further examination. Five hundred
grams of plant powder was dissolved in Methyl alcohol and Chloroform for 5 days, and filtration of extracts was
done with Whatman filter paper. Both extracts were evaporated with the help of a rotary evaporator, and crude
dried extracts were stored in air-fitted vials for more processing.
In vivo study. Selection and purchase of animals. Fifty male albino mice (body weight 55.2 ± 2.5 g) were
purchased from NIH (National Institute for health) Islamabad. The experimental study was approved by the
National Veterinary Lab Islamabad ethical committee adhering to the institution’s guidelinesand also in compli-
ance with ARRIVE guidelines. All the protocols having animal study were in acquiescence with the guidelines
of the ethics committee. The mice were housed under controlled conditions and had free access to mouse chow
(Feed Mills, Islamabad) and water ad libitum. Animals were cautiously monitored and kept up in standard house
conditions.
Acute oral toxicity study. An acute toxicity study was done to select suitable doses of plant extracts for animals,
as earlier reported b y27. The bodyweight of animals was recorded before and after thestudy. Plant extracts were
orally given to mice at the dose of 100–300 mg/kg body weight. After the dosage, animals were meticulously
observed after 24, 48, and 72 h for the development of any toxicological symptoms. Animals were euthanized on
21 days of the experiment.
Experimental design. Animals of the same age were divided randomly into 10 groups, and each group contains
5 animals.
1 Normal control group Normal feedwas given without any treatment for 21 days
2 Olive oil group 1 ml of olive oil was given orally with their feed up to 21 days
CCL4 (1 cc/kg b. w) was induced by the intra-peritoneal wayand-
3 CCL4 group (− ve control)
given normal feed
This group was induced CCL4 and after that100 mg/kg b. w of
4 100 mg Methanol group
methanol extractswas orally given with normal feed
Animals were given CCL4 + 200 mg/kg b. w of methanol extracts
5 200 mg Methanol group
with normal feed
Animals were provided CCL4 + 300 mg/kg b. w of methanolic
6 300 mg Methanol group
extract
This group was administered CCL4 + 100 mg/kg b. w of chloro-
7 100 mg Chloroform group
form extract
Scientific Reports | (2021) 11:13336 | https://doi.org/10.1038/s41598-021-92638-6 2
Vol:.(1234567890)www.nature.com/scientificreports/
1 Normal control group Normal feedwas given without any treatment for 21 days
The group was nourished with 200 mg/kg b. w of chloroform
8 200 mg Chloroform group
extract after CCL4
9 300 mg Chloroform group After CCL4, 300 mg/kg b. w (chloroform extract) was given
10 Silyamrin group CCL4 + 100 mg/kg body weight of Silymarin (standard drug)
At 20 days of the experiment, mice were kept for fasting for 12 h and animals were anesthetized and eutha-
nized with sodium pentobarbiton. After anesthesia (21 days) whole blood was obtained from the heart by car-
diac puncture. To get the serum, place the blood sample tube to clot for 30 minand subjected to centrifugation
(3000 rpm for 10 min). Animals were sacrificed through cervical dislocation, and organs were collected and then
rinsed using ice-cold saline solution and kept at − 20 °C for further analysis. The weight of collected organs from
all the groups was recorded. For biochemical analysis, phosphate buffer saline was used to the homogenized liver
(one part), then centrifuged at 3000 rpm for 20 min and supernatant was stored at − 20 °C. For the histopatho-
logical study, the liver, kidney, and spleen were stored in formalin solution (10%).
Analysis of blood samples. The serum biomarkers alanine aminotransferase (ALT), aspartate aminotransferase
(AST), alkaline phosphatase (ALP), and bilirubin were examined by using an auto-analyzer with AMS diagnos-
tic kits (Italy). RBC (red blood cells), WBC (White blood cells), and platelets in blood samples were estimated
with the method reported by28.
Antioxidant enzymes. Liver homogenates were used toevaluate oxidative defense markers (antioxidant
enzymes). Catalase (CAT) and superoxide dismutase (SOD) activity was measured by using the protocol29, Glu-
f30, and total protein was evaluated by the method
tathione peroxidase (GPx) was calculated by the method o
suggested by31.
Histopathological study. Mice organs (liver, kidney, and spleen) were removed carefully after sacrifice and pre-
served in formalin (10%). Test specimen were fixed, dehydrated in alcohol, cleaned in xylene, and then inserted
into molten paraffin wax. Paraffin sections were cut into 5 µm thickness by using a microtome, and obtain tissues
were mounted on slides and deparaffinized. Tissue sections were processed to staining with Ehrlich’s hematoxy-
lin and eosin counterstained (H&E) and examined under a light microscope32,33.
Determination of total phenolic and total flavonoid content. The total phenolic content of extracts
was measured by using Folin–Ciocalteu r eagent34. Results were expressed as grams of gallic acid equivalents per
500 g/dry weight. The total flavonoid content of the extracts was measured using colorimetric assay35. Results
were expressed by using grams of quercetin equivalents per 500 g/dry weight.
Antioxidant activity. Chemicals required. Methyl alcohol, ethyl alcohol, chloroform, DPPH, ABTS, Hy-
drogen peroxide, EDTA, Formalin, Xylene, Heamotoxylin, Essen, KH2PO4 buffer, ALT Alanine aminotrans-
ferase, AST Aspartate aminotransferase, ALP alkaline phosphatase, and bilirubin were obtained. Analytical
grade solvents and reagents were purchased from local dealers of Sigma Aldrich and Merck.
DPPH assay. This process is used to calculate the scavenging capacity of the sample by the protocol with some
modifications36. 2 ml aliquot of DPPH (2,2-diphenyl-1-picrylhydrazyl) was poured into each concentration of
plant sample ranged from 20 to 100 µg/ml. This mixture was incubated at 37 °C for 30 min in darkness. Standard
or Positive controls were Ascorbic and Gallic acid. DPPH solution was taken as a negative control. Reading was
taken recorded at 517 nm, and results were expressed in ascorbic acid equivalent AAE and gallic acid equivalent
GAE. The experiment was done in a triplicate manner, and the inhibition percentage is obtained by the follow-
ing formula
DPPH % = Aa −Ah /Aa × 100
Aa—absorbance of reaction mixture exceptfor plant extract. A h—absorbance of a reaction mixture comprising
plant extract. IC 50 (µg /mg) was measured by plotting scavenging percentage against extract concentration.
Iron chelating assay. The Iron Chelating method was described by37. Antioxidant potential of plant extract
was assessed through incubation of reaction mixture that comprises ofdifferentconcentrations of plant sample
extracts (20–100 µg/ml), 2 mM ferrous sulfate (1 ml), and 0.25 mM Ferrozine (1 ml). After stirring, let the mix-
ture stand for10 min, and absorbance was read at 517 nm.
Chelating rate % = Aa −Ah /Aa × 100
Aa—absorbance of control lacking plant extract. A h—absorbance of mixture with plant extract. Standard solu-
tions or Positive controls (Ascorbic and Gallic acid) were used to make the calibration curve. I C50 was stated as
µg AAE/mg and GAE/mg.
Scientific Reports | (2021) 11:13336 | https://doi.org/10.1038/s41598-021-92638-6 3
Vol.:(0123456789)www.nature.com/scientificreports/
Hydroxyl radical scavengingassay. Plants extract concentrations 20 to100 µg/ml were investigated by adding
0.2 M Sodium phosphate buffer (7 pH), 2deoxyribose (10 mM), FeSO4-EDTA (10 mM), H 2O2 (10 mM) and
525 µl of H2O. Put all the mixture into TCA (2.8%) and TBA (1%) and incubate at 90 °C for color development.
Spectrophotometric reading was observed at 520 nm. Standard drugs (Ascorbic and Gallic acids) were taken as
Positive control, and results were measured in AAE and GAE µg/mg38.
Scavenging activity = 1 − Ah /Aa × 100
where Aa—absorbance of the mixture (without plant sample extracts) and Ah—absorbance of a mixture contain-
ing plant sample.
ABTS (2,2‑azinobis [3‑ethylbenzothiazoline‑6‑sulfonate]) radical cation decolorization assay. Plant extracts
were analyzed through the enhanced ABTS + radical cation scavenging capacity by some m odification39,40.
ABTS + mixture was prepared by adding 3 mM ABTS (2,2-azinobis [3-ethylbenzothiazoline-6-sulfonate]) and
potassium persulfate (2.5 mM). Leave the solution in the dark for 12 h. To measure ABTS + activity, ABTS + solu-
tion (3 ml) was taken with different concentrations of plant extract (20 to100 µg/ml). Optical density was meas-
ured at 734 nm. Standard drug used was Ascorbic and Gallic acids.
Percent Scavenging potential = Aa −Ah /Aa × 100
Aa—absorbance of control; A
h—absorbance of plant extract.
Reducing power assay. FRAP (Ferric ion reducing power) was determined by the method that involved the
mixing of each plant sample concentrations (20–100) µg/ml) with phosphate buffer (0.2 M) and potassium ferri-
cyanide (0.1%). Allow the mixture to incubate in a water bath for 20 min. Subsequently, add trichloroacetic acid
(10%), and the mixture was centrifuged at 3000 rpm for 10 min. The supernatant was mixed in distilled water
(2 ml) andferric chloride (0.01%) and set it down for incubation. Blank and samples were interpreted at 700 nm.
Standard compounds, i.e., Ascorbic and Gallic acid, were utilized as a positive control. Results were quantified
as AAE and GAE (µg/mg)41,42.
Hydrogen peroxide scavenging activity (H2O2). Hydrogen peroxide scavenging activity was described according
to the protocol of43. Reaction mixture comprised of H2O2 solution 4 Mm (prepared in phosphate buffer) with
different plant concentrations (20–100) µg/ml) followed by incubation for 10 min at room temperature. The
reading was observed at 230 nm against a blank solution comprising phosphate buffer with 7.4 pH. Gallic acid
and Ascorbic acid were used as standard and expressed in GAE and AAE (µg/mg).
Scavenging activity % = Aa −Ah /Aa × 100
Aa absorbance of H2O2 and Ah is the absorbance of mixture with plant extract.
Superoxide assay. The activity was determined by NBT reduction as per the method of Beauchamp and Fri-
dovich, 197144. PMS (phenazine methosulfate) and NADH (nicotinamide adenine dinucleotide) systems pro-
duce superoxide radicals that condense nitro blue tetrazolium (NBT) to purple formazan. Add up 50 mM Phos-
phate buffer, 0.73 mM NADH, 20 mM PMS and 0.5 Mm NBT in numerous concentrations of sample (20 µg/ml)
and incubate them for 20 min. Optical density was documented at 560 nm against blank to determine generated
formazan. The positive control was Ascorbic acid and Gallic acid. Inhibition concentration was obtained from
the formula:
Scavenging percentage = 1 − Ah /Aa × 100
where Aa—absorbance except plant concentrate and A
h—absorbance of mixture with plant distillate.
Analysis of plant with high‑performance liquid chromatography (HPLC). Crude extracts analy-
sis was performed using a Shimadzu HPLC (high-performance liquid chromatography) system, Tokyo, Japan,
equipped with a C18 column (250 mm × 4.5 mm, 5 m) used for the separation at the flow rate of 1 ml/min. The
column temperature was sustained at 40◦C followed by gradient pump and UV/Visible detector. HPLC grade
methanol was used for extraction of the crude plant to prepare the tested sample. Before injection, the filtration
of samples was done using a 0.2 μm PTFE filter, and the injection volume was 10 µl. The compounds were eluted
usinga gradient elution of mobile phases A and B (Acetonitrile and 0.1% phosphoric acid; 36:64). Separation
steps are as follows: 0 min-5% B, 15 min-15% B, 15 min-45% B, 5 min-90%B, and Conditioning cycle for 5 min
along with the analysis of the following initial conditions. The UV–Vis detection was recorded at 280–285 nm
at a current rate of 1 ml/min per 20 min retention time. Quercetin was used as standard, and all data were done
in triplicates.
GC–MS. Gas chromatography and mass spectrometry analysis. GC–MS system QP2010 model (Shimadzu®)
equipped with Mass selective Detector and split–a split-less system of injection. The instrument was fitted with
capillary column RTx-5MS (cross bond 5% diphenyl—95% dimethylpolysiloxane) with 30 m × 0.25 mm with
Scientific Reports | (2021) 11:13336 | https://doi.org/10.1038/s41598-021-92638-6 4
Vol:.(1234567890)www.nature.com/scientificreports/
Treatments Liver weight (g) Kidney weight (g) Spleen weight (g) Rise (%) in body weight
Normal 5.60 ± 1.21 0.48 ± 0.1 2.080 ± 0.19 16 ± 2.9
Olive oil control 5.82 ± 0.94 0.51 ± 0.08 2.15 ± 0.2 20 ± 3.10
CCL4 3.96 ± 1.18 0.34 ± 0.12 3.34 ± 0.5 7.41 ± 2.05
Silymarin + CCL4 6.02 ± 0.749 0.5 ± 0.17 2.150 ± 0.31 22.27 ± 0.09
DV (100 mg/kg) + CCL4 4.016 ± 0.83 0.25 ± 0.045 3.11 ± 0.77 6.03 ± 0.67
DV (200 mg/kg) + CCL4 4.67 ± 0.71 0.33 ± 0.01 2.85 ± 0.3 10.060 ± 1.04
DV (300 mg/kg) + CCL4 5.105 ± 0.51 0.41 ± 0.1 2.49 ± 0.5 15.52 ± 1.75
Table 1. Protective effect of methanol extract of Dodonaea Viscosa flowers. Results were expressed in triplicate
manner with mean ± SD.
0.25 μm film thickness. At the rate of 1.2 ml/min, helium was being used as carrier gas. The temperature program
of the column was started at 150 °C (1 min) then programmed at 4 °C/min to 150 °C (10 min). The temperature
of the injector was 275 °C while the detector was at 250 °C. 0.2 µl volume was injected in split mode. A split ratio
was 1:50, and the mass spectra were operated electron ionization at 70 eV in Selected Ion Monitoring (SIM)
mode were maintained. The run time of the machine was 40 min. The relative percentage of the plant extract
compounds was expressed in percentage with normalization of peak area.
Compounds identification. GC mass spectrum interpretation was conducted by employing the database of the
National Institute Standard and Technology (NIST). The compound name, molecular weight, and structure of
the test materials were determined. The percentage (%) of each compound was calculated by comparison of the
average area to total area. The spectrum of unknown constituents was compared with the version 2005, software,
and Turbo mass 5.2. The aim was to discover the individual compound or group of compounds that might show
its current commercial and traditional roles45,46.
Fourier transform infrared spectrophotometer analysis. The plant extract was analyzed for infrared
spectrum analysis by FT-IR (Fourier transform Infrared) spectroscopy Shimadzu machine, IR affinity 1, Japan.
At first, loaded samples were grounded by KBr (1:100 w/w) with scan range (400–4000 cm) and 4 cm−1 resolu-
tion. Samples components were subjected to structural characterization and indicated functional groups with
chemical bond types47.
Anti‑tuberculosis activity. The anti-mycobacterial activity of Dodonaea viscosa L. was measured using
the REMA m ethod48. Mycobacterium tuberculosis strains bug 206 and bug 1972 and H37Rv were grown in 7H9
broth. Sample stock solutions were diluted using DMSO to get the final concentration ranging from 0.98 to
250 μg/mL. Rifampicin was used as positive control drug ranges 0.004 to 1 μg/mL. Add the bacterial culture
(5 × 10⁵ CFU/mL) to each well of the 96-well plate and incubate at 37 °C. Viability was tested using resazurin,
and the color change and fluorescence were examined in plates by using SPECTRAfluor Plus microfluorimeter
(TECAN). Experiments were performed in triplicates. The lowest concentration resulting in 90% growth inhibi-
tion of M. tuberculosis. The MIC was defined as the lowest concentration results in the inhibition of 90% growth
of M. tuberculosis.
Statistical analysis. All the data were obtained in a triplicate manner, and results are presented as
mean ± standard deviation. One-way ANOVA was used for the processing of results. Statistical analysis (Mean,
standard deviation, probability, and Pearson coefficient correlation) was obtained via statistical software (Prism
pad 7). The level of significance was considered at < 0.05.
Results
In vivo study. Acute toxicity and effect on weight. According to the results, acute toxicity manifested sig-
nificant noticeable signs on the mice’s body weight. The observed change was shown in Tables 1 and 2. In the pre-
sent study, DV flowers with methanol and chloroform extracts found no devastating effect on mice. No mortality
was found at the highest dose of 2000 mg/kg as it is considered the highest dose by OECD guidelines for any
acute toxicity assay. Three plant concentrations 100 mg/kg, 200 mg/kg and 300 mg/kg were selected for the study.
Liver enzymes. DV flower extracts were tested for protective effect on liver enzymes in albino mice. Group
1 and 2 showed normal enzymes level with no treatment. As a result of C CL4 treatment in (Group 3) slight to
elevated changes were observed after 1, 2, 3, and 21 days in liver enzymes while compared with other groups.
(Group 4–9) DVM showed a more restorative effect on liver enzymes than chloroform extract, and group 10
indicated hepatoprotective effect by Silymarineffect (Table 3).
Hematological parameters. Induction of CCL4 resulted in a decline in RBCs, WBCs and plateletslevel. DV
methanol and chloroform extract significantly increase the level of parameters (Table 4). DV methanol depicted
greater RBCs and WBCs values closer to the normal control with significant results (p < 0.05).
Scientific Reports | (2021) 11:13336 | https://doi.org/10.1038/s41598-021-92638-6 5
Vol.:(0123456789)www.nature.com/scientificreports/
Treatments Liver weight (g) Kidneyweight (g) Spleen weight (g) Rise (%) in body weight (g)
Normal 5.60 ± 1.21 0.48 ± 0.05 2.080 ± 0.1 16 ± 2.9
Olive oil control 5.82 ± 0.94 0.51 ± 0.02 2.15 ± 0.5 20 ± 3.10
CCL4 3.96 ± 1.18 0.34 ± 0.08 3.34 ± 0.2 7.41 ± 2.05
Silymarin + CCL4 6.02 ± 0.749 0.5 ± 0.1 2.150 ± 0.16 22.27 ± 0.09
DV (100 mg/kg) + CCL4 4.15 ± 0.92 0.24 ± 0.03 3.06 ± 0.8 7.22 ± 0.92
DV (200 mg/kg) + CCL4 4.62 ± 1.23 0.28 ± 0.14 2.76 ± 0.5 10.24 ± 2.31
DV (300 mg/kg) + CCL4 5.16 ± 0.92 0.36 ± 0.02 2.3 ± 0.33 12.94 ± 2.08
Table 2. Protective effect of chloroform extract of Dodonaea Viscosa flowers. All the values are obtained in
triplicate (mean ± standard deviation).
ALT AST ALP Direct bilirubin
Normal contro 38 ± 0.83 80.2 ± 4.1 110 ± 9.2 0.2 ± 0.001
Olive oil control 40 ± 5.2 63 ± 2 175 ± 20 0.32 ± 0.06
CCL4 control 1st day (24 h) 74.5 ± 7.7 90 ± 11 208 ± 5.1 1.0 ± 0.2
CCL4 control 2nd day (48 h) 85 ± 12 95 ± 3.5 225 ± 11 1.25 ± 0.04
CCL4 control 3rd day (72 h) 89 ± 14 109 ± 9.2 247 ± 2 1.7 ± 0.45
CCL4 control 21 day 120 ± 9 127.8 ± 8.6 294 ± 15 1.91 ± 0.08
Silymarin drug 66.4 ± 7.2 76.1 ± 12 185 ± 31 0.53 ± 0.09
DVM 100 mg + CCL4 62.5 ± 8 104 ± 20 264.8 ± 11 0.7 ± 0.08
DVM 200 mg + CCL4 61.8 ± 4.5 88 ± 11 236 ± 14 0.6 ± 0.01
DVM 300 mg + CCL4 53 ± 2 74.5 ± 6 197 ± 9.8 0.56 ± 0.02
DVC 100 mg + CCL4 77 ± 5 126 ± 7.1 357 ± 12.4 1.1 ± 0.2
DVC 200 mg + CCL4 72 ± 3 104.3 ± 5 283.6 ± 3.2 0.98 ± 0.05
DVC 300 mg + CCL4 69 ± 6 96 ± 4.3 229 ± 11 0.81 ± 0.07
Table 3. Estimation of liver enzymes from mice blood serum. Results are taken in a triplicate way with
mean ± SD. Level of significance at < 0.05.
Groups RBCs WBCs Platelets
Normal group 4.80 ± 0.06 5.02 ± 0.47 240 ± 6.9
Olive oil control 4.93 ± 0.2 5.50 ± 0.008 252 ± 10.1
CCL4 control 1st day (24 h) 3.05 ± 0.081 3.68 ± 0.03 170 ± 5.03
CCL4 control 2nd day (48 h) 2.73 ± 0.03 3.25 ± 0.15 155.2 ± 0.25
CCL4 control 3rd day (72 h) 2.40 ± 0.009 2.913 ± 0.092 140.01 ± 0.17
CCL4 control 21 day 1.88 ± 0.005 2.351 ± 0.11 100.59 ± 2.9
Silymarin drug 3.97 ± 0.12 4.802 ± 0.060 227.3 ± 4.12
DVM 100 mg + CCL4 3.7 ± 0.016 4.67 ± 0.04 240.3 ± 0.15
DVM 200 mg + CCL4 4.181 ± 0.004 5.002 ± 0.12 247.09 ± 0.21
DVM 300 mg + CCL4 4.62 ± 0.21 5.56 ± 0.01 256.6 ± 0.82
DVC 100 mg + CCL4 2.612 ± 0.093 3.205 ± 0.83 174.1 ± 0.26
DVC 200 mg + CCL4 3.05 ± 0.02 3.84 ± 0.131 198.3 ± 0.03
DVC 300 mg + CCL4 3.73 ± 0.1 4.291 ± 0.20 224.20 ± 0.19
Table 4. Hematological parameters of different groups of mice.
Antioxidant enzymes. The results showed that the normal level of enzymes getsaltered due to CCL4 admin-
istration. After carbon tetrachloride induction, hightoxicity reduced the antioxidant enzymes. Silymarin drug
(positive control) and plant extracts revealed positive results. Results obtained in a triplicate manner along with
coefficient variation were < 0.05 (Table 5).
Histopathology. Morphological changes in organ (Liver, kidney, and spleen) tissues were investigated by histo-
pathological microscopy. CCL4 intoxication damaged the normal architecture of cells, and after 21 days of DV
treatment, the cell structure of mice tissues was integrated. Several concentrations of plant extracts exhibited a
Scientific Reports | (2021) 11:13336 | https://doi.org/10.1038/s41598-021-92638-6 6
Vol:.(1234567890)www.nature.com/scientificreports/
Groups CAT (m mol/min/mg protein) SOD (U SOD/mg protein) GPx (µmol/min/mg protein) Protein tissue
Normal control 8.2 ± 2 10.15 ± 1.4 32.10 ± 3 3.15 ± 0.4
Olive oil 7.9 ± 0.5 10.23 ± 2 34.7 ± 4.5 3.2 ± 0.25
CCL4 1st day (24 h) 5.94 ± 1.3 6.89 ± 0.7 22.40 ± 3.7 1.2 ± 0.11
CCL4 2nd day (48 h) 5.28 ± 1.7 6.24 ± 1 20.47 ± 1.9 1.03 ± 0.2
CCL4 3rd day (72 h) 5.03 ± 0.43 5.98 ± 1.4 18.16 ± 2 0.98 ± 0.3
CCL4 21 day 4.75 ± 1.9 5.75 ± 0.6 17.83 ± 3 0.75 ± 0.08
DVM100 mg + CCL4 6.8 ± 0.2 7.79 ± 1 19.4 ± 1.2 1.58 ± 0.05
DVM200 mg + CCL4 7.3 ± 0.8 8.58 ± 2.3 23.0 ± 3.5 2.1 ± 0.4
DVM300 mg + CCL4 7.8 ± 1.03 10.7 ± 0.5 29.4 ± 2 2.8 ± 0.08
DVC100 mg + CCL4 5.9 ± 1.5 5.86 ± 1.09 20.1 ± 3 1.02 ± 0.5
DVC200 mg + CCL4 6.2 ± 2 6.9 ± 1.5 23.4 ± 0.7 1.71 ± 0.9
DVC300 mg + CCL4 6.57 ± 1 8.02 ± 1 25.8 ± 1 2.1 ± 0.71
Silymarin + CCL4 8.11 ± 1.2 11.62 ± 0.6 33.7 ± 1.5 3.22 ± 0.8
Table 5. Effects of Dodonaea Viscosa flowers on Antioxidant enzymes and total proteins. All the results were
obtained in triplicate with mean and standard deviation.
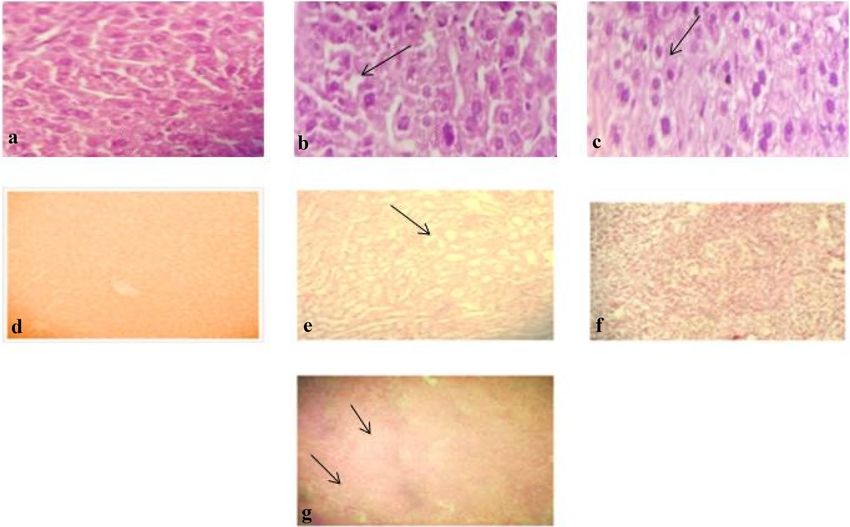
Figure 1. “a” showed the normal mice liver tissues, followed by “b” (arrow) showed the degeneration of
hepatocytes. “c” presents recovery of degenerated hepatocytescaused by CCL4 induction. “d” CCL4 treated
cellular structure of kidney. “e” DVM treated kidneyshowed slight recovery of renal tubules. “f” presents a
normal spleen, while “g” arrow depicts normal lymphoid masses and red pulp in DVC-treated spleen.
protective effect on tissues by attenuating injuries, while methanol extract presented more supportive evidence
on the cellular organization than DVC extract (Fig. 1).
The normal liver architecture depicts central vein, hepatic sinusoids as well as portal veins with normal
appearance. Fibrosis and vascular irregularities, for instance, liver sinusoids alteration and central vein conges-
tion, were seen in carbon tetrachloride mice. Renal histology revealed normal features like intact glomerular,
tubular structure, bowman’s space and capillary tufts. Treated spleen showed white pulp containing normal
lymphoid masses followed by extremely vascular red pulp, which was similar to normal mice histology.
Scientific Reports | (2021) 11:13336 | https://doi.org/10.1038/s41598-021-92638-6 7
Vol.:(0123456789)www.nature.com/scientificreports/
Hydroxyl
Reducing Iron chelating Hydrogen scavenging Superoxide
ABTS assay power assay DPPH assay assay peroxide assay Assay assay
D. viscosa 107.1 ± 11.4 75.59 ± 4 54.95 ± 2.1 20.7 ± 1.3 11.37 ± 0.4 19 ± 0.56 111.6 ± 2.1
Ascorbic acid 119 ± 7.9 25.7 ± 2 15.7 ± 3 29.2 ± .7 16.8 ± 2.1 24.5 ± 0.84 116.6 ± 2.8
Gallic acid 229 ± 15 39.2 ± 1 24.7 ± 2 34.8 ± 2 13.1 ± 1 26.2 ± 1 134.2 ± 5.6
Table 6. IC50 of different antioxidant assays. The values were measured in µg/g.
Figure 2. Different peaks on chromatograms showing different compounds. (a) Gallic acid standard graph (b)
epicatechin standard graph (c) cumeric acid standard graph (d) quercetin standard graph (e) peaks showing
gallic acid, epicatechin and cumeric acid from DVM (f) chromatogram peaks exhibited quercetin from DVM.
Phytochemical analysis and antioxidant assays. Dodonaea viscosa flower possessed total phenolic
content 174 ± 4 mg/g dry weight and total flavonoid content 98 ± 7 mg/g, where the results are significantly dif-
ferent p < 0.05. DVM extract was evaluated against different antioxidant activities. The lowest I C50 was found in
hydrogen peroxide assay 11.37 ± 0.4 mg/g dry weight and hydroxyl radical scavenging assay 19 ± 0.56 mg/g dry
Scientific Reports | (2021) 11:13336 | https://doi.org/10.1038/s41598-021-92638-6 8
Vol:.(1234567890)www.nature.com/scientificreports/
Compounds Area Quantity (mg/kg)
Gallic acid 690,219 196.78
Catechin 0 − 1.04
Epichatechin 101,583 140.76
Cumeric acid 3,374,640 110.85
Quercetin 1,760,828 59.49
Table 7. HPLC analysis of Dodonaea viscosa flower methanol extract.
Peaks Compounds name Formula Molecular weight (amu) Area % Retention time (min)
1 Ethyl fluoride C2H5F 48 44.66 1.132
2 Isobutyl alcohol C4H10O 74 16.36 1.218
3 Isopentyl alcohol C5H12O 88 16.78 1.350
4 Furanone C5H8O2 100 1.58 1.488
5 Dimethyl Sulfoxonium formylmethylide C4H8O2S 120 0.34 1.612
6 Isopentyl alcohol C7H14O2 130 0.30 1.660
7 Ascorbic acid C38H68O8 652 4.56 14.900
8 Ascorbic acid C38H68O8 652 5.56 15.846
9 Octadecenoic acid C18H34O2 282 2.11 18.858
10 Ricinoleic acid C18H34O3 298 1.02 19.205
11 Octadecenoic acid C18H34O2 282 4.30 19.278
12 Stearic acid C18H36O2 284 0.74 19.697
13 Carboxylic acid C23H32O4 372 0.40 26.460
14 Cyclopentanone C15H20O 216 1.08 28.112
15 Cedrol C15H26O 222 0.21 28.862
Table 8. GCMS of Dodonaea viscosa flowers compounds. Data were obtained by triplicate readings with mean
and standard deviation.
Figure 3. GCMS Chromatogram of Dodonaea viscosa flowers.
Scientific Reports | (2021) 11:13336 | https://doi.org/10.1038/s41598-021-92638-6 9
Vol.:(0123456789)www.nature.com/scientificreports/
Peaks Wavelength Bond Functional group
1 3399.20 O–H stretch, H-bonded Alcohols, phenols
2 2926.68 O–H stretch Carboxylic acids
3 2855.03 C–H stretch Alkanes
4 1712.97 C=O stretch Carbonyl (general)
5 1651.11 –C=C– stretch Alkenes
6 1514.15 N–O asymmetric stretch Nitro compounds
7 1454.94 C–H Bend Alkanes
9 1265.80 C–H wag (–CH2X) Alkyl halides
10 1168.38 C–N stretch Aliphatic amines
11 1079.18 C–N stretch Aliphatic amines
12 724.89 C–H rock Alkanes
13 632.98 C–Br stretch Alkyl halides
Table 9. FT-IR analysis of flowers of Dodonaea Viscosa.
Figure 4. FT-IR analysis of Dodonaea viscosa flowers methanolic extract.
Mean CFU on media Percentage Inhibition
Isolates bg1972 H37Rv Bg206 bg1972 H37Rv Bg206
Control 130 140 150 130 140 150
5 mg/ml extracts 80 40 53 38 71 65
10 mg/ml 55 4 26 58 97 83
50 mg/ml 0 0 0 100 100 100
Table 10. Anti-tuberculosis activity of DV Methanol against different strains. % Inhibition = Ccn − Ct/
Ccn × 100, where Ccn = no of colonies in the control media slope, Ct = No of colonies in the Test media slope.
Scientific Reports | (2021) 11:13336 | https://doi.org/10.1038/s41598-021-92638-6 10
Vol:.(1234567890)www.nature.com/scientificreports/
weight, which is greater than Ascorbic and Gallic acid. DVM also showed good activity to quench free radicals
in DPPH free radical scavenging assay (Table 6).
High‑performance liquid chromatography. For the detection of some important medicinal com-
pounds, HPLC analysis was carried out. Identification of peaks wasmade by comparing the retention time of
the Dodonaea viscosa flower with standard compounds. The resulting peaks correspond to each compound
were proportioned (Fig. 2). HPLC quantification of DVM flower extract identified the presence of gallic acid,
epicatechin, cumeric acid, and quercetin compound. Whereas catechin has not been quantified in DV extract
(Table 7). Gallic acid was the highest content observed with the quantity of 196.78 mg/kg.
Gas chromatography‑mass spectroscopy (GC–MS) analysis. DVM extract is composed of vola-
tile-based organic compounds, mainly fatty acids. Numerous compounds were identified by GC–MS, and the
compound list followed by the corresponding GC–MS spectrum was presented in Table 8 (Fig. 3). Among all
compounds, the most significant were Ascorbic acid (C38H68O8), Octadecenoic acid (C18H34O2), Ricinoleic acid
(C18H34O3), Carboxylic acid (C23H32O4), Stearic acid ( C18H36O2), and Cedrol (C15H26O).
Fourier transform infrared spectroscopy. The most notable peaks in DVM were observed between
3500 and 2800 nm. A peak at 2926.68 nm belongs to O–H stretch, Carboxylic acids and then at 3399.20 nm
correspond to O–H stretch, H-bonded which signifies Alcohols, phenols. Peaks ranging from 2900 to 700 nm
belong to C–H stretch, C=O stretch, C–N stretch, and –C=C– stretch (Table 9; Fig. 4).
Anti‑tuberculosis assay of Dodonaea Viscosa flowers. Anti-tuberculosis assay of DVM extract was
screened out against Mycobacterium tuberculosis 3 strains bg 1972, bg 206 and H37Rv. 5 mg, 10 mg, and 50 mg/
ml concentrations were used, and tuberculosis % inhibition was increased with the rise in concentrations.
Plant extract showed resistance against all strains, but the highest activity was found against the H37Rv strain
(Table 10). Minimum inhibitory concentration (MIC) was determined at 25 mg against H37Rv and bg 206. At
the same time, standard drug (Rifampicin) exhibited MIC at 0.125 mg against H37Rv strain.
Discussion
The present study demonstrated the in vitro and in vivo biological activities of Dodonaea viscosa flowers. The
liver, kidney, and spleen are important parts of our body and are involved in different pivotal functions. The
liver is one of the most important organs and played an important role in the detoxification of t oxins49,50. CCl4
has been used to illuminate some mechanisms regarding various toxicities, i.e., lipid peroxidation, and cause
necrosis, fibrosis, and apoptosis of c ells2.
CCL4 is the toxin well known to produce chemical stimulated liver injurywhen it get metabolized into trichlo-
romethyl radical (CCl3). This radical damages important cellular process by altering lipid metabolism and quanti-
ties of protein and then also induce mutations and produce hepatocellular carcinoma (HCC). Moreover, CCl3
oxygenation resulted in trichloromethylperoxy radicals ( CCl3OO) thatlead to lipid peroxidation, polyunsaturated
fatty acidsdestruction and lowered the permeability of the cellular membrane, and cause hepatic damage that is
distinguished by fibrosis, cirrhosis, HCC, and I nflammation51.
Mice weight was reduced with the variation in weight of organs (Liver, Kidney, and Spleen). An increase in
body weight owing to Dodonaea viscosa exhibited its protective effect. Dodonaea viscosa showed innocuous and
protective to the mice, as reported e arlier52. Level of liver enzymes ALT, ALP, AST, and direct bilirubin aimed to
determine the sternness of damagedtissue53. Biochemical markers get altered by carbon tetrachloride and then
restored by the treatment with plant extracts and standard drug Silymarin, indicating the usage of Dodonaea
viscosa flowers against liver injury. CCL4 has been reported to increaseliver enzyme levels in some biochemical
studies54,55. When there areunstablechangesobserved in the ALP level, it causes liver d iseases56. Harmful changes
in liver enzymes reflected several conditions likethe development of tissue necrosis, the decline in liver capacity
(biosynthetic and catabolic), and alter normal structure of h epatocytes57.
Hematological parameters such as RBCs, WBCs, and platelets were also disturbed by C CL4 administration.
Methanol and chloroform extracts of DV flower revealed positive effects on hematological parameters, which
specify its suitability for managing blood cell disorders58. An endogenous enzyme CAT, SOD, and GPx involved in
scavenging free radicals and declining normalenzyme levels indicate hepatic damage58. CCL4 reduces the level of
antioxidant enzymes (CAT, SOD, and GPx) and total protein compared with the normal group and confirmsliver
injury59, whereas the above factors were reinstated after administrating plant extracts. Intoxication of C CL4 in
antioxidant enzymes can be improved using Medicinal plants60,61. Natural products have been investigated for
the source of antioxidants that are being used for the hepato-protective activity. For the management of different
diseases, flavonoids rich plants have shown protective effectsby decreasing serum markers with antioxidant and
anti-inflammatory processes62.
Exposure to CCL4 leads to liver damage such as necrosis, fibrosis, and central vein alteration. In the kidney,
it caused renal fibrosis, glomerular and tubular changes, while in the spleen, deterioration in white and red pulp
occurred63–65. As a result of C CL4 toxicity, the cellular structure and function of the kidney rely onthe func-
tional state of the liver66. Similar studies reveal that at high doses of extracts, liver, kidney, and spleen seemed
nearly normal, with no observable gross morphological and histopathological modifications, supporting present
findings67. Studies signify the use of Dodonaea viscosaagainst toxicity inan animal model and found to have
revealeda protective effect for liver enzymes and attenuated the injury by diminishing the production of reactive
oxygen species in h epatocytes68.
Scientific Reports | (2021) 11:13336 | https://doi.org/10.1038/s41598-021-92638-6 11
Vol.:(0123456789)www.nature.com/scientificreports/
Methanol solvent was selected for further activities based onthe best results in the in-vivo study compared to
chloroform. Preliminary screening of secondary metabolites resulted ina significant amount of total phenolic
compounds and total flavonoid content. Phenolics and Flavonoids are considered singlet oxygen quenchers, radi-
cal scavengers, reducing agents, and hydrogen d onors69. So, the analysis of the plant’s total flavonoids and phe-
nolic compounds is important to measure its antioxidant capacity. The results of the experiment presented strong
antioxidant activities of D. viscosa flowers. The highest antioxidant activity of DVM was shown against hydrogen
peroxide assay. DVM manifested great radical scavenging ability as follows Hydroxyl radical assay > iron chelating
assay > DDPH assay > Reducing power assay > ABTS radical assay > Superoxide assay. In the current study, the
reducing capacity of D. viscosa significantly decreases the complex of ferric cyanide to ferrous. The occurrence
of antioxidants was determined by evaluating the ability of plant extract to form ferrous by reducing the ferric
cyanide complex70. Reducing the power of plant compounds specifies its potential antioxidant capacity. High
reducing power in a sample hasa great ability to donate the electron and free radicals and produce stable elements
by accepting donated electrons, which terminates the free radical r eaction71. Hydroxyl radicals are highly reac-
tive free radicals in biological systems, and there are no specific enzymes present in humans to protect against
them. Their presence in the human body causes oxidative DNA damage. Therefore, there is a need for a solution
to scavenge ROS with natural products having scavenging activity. Due to the high reactivity of OH radicals, the
antioxidant activity of scavenging hydroxyl radicals is i mportant72,73. The most commonly used method for the
evaluation of antioxidants is the DDPH assay. The quenching of DPPH measurement relies on the discoloration
of the purple-colored 2,2-diphenyl-2-picryl-hydroxyl compound by antioxidant. Donor antioxidant decolorized
DPPH radical by electron acceptance and measured quantitatively from variations in absorbance74. Furthermore,
D. viscosa expressed significant radical scavenging activity against ABTS assay with a low value of I C50. All the
essays are positive as well as significantly correlated with phenols and flavonoids.
HPLC quantified four compounds in DVM, i.e., gallic acid, epicatechin, quercetin, and cumeric acid. Querce-
tin is an iso flavonoid and flavonoid content (rutin and quercetin) was identified in the stem of dodonaea viscosa.
The remedial aptitudes of Dodonaea viscosaare associated using pharmacological effects brought through the
synergistic action of numerous constituents, i.e., flavonoids, saponins, di, and triterpenes, along with a combina-
tion of phenolics existing in the p lant75. Flavonoids and diterpenoids are the richest secondary metabolites that
werepreviously identified and isolated from Dodonaea76. These phenolic and flavonoid compounds revealed anti-
cancer, antiallergic, antibacterial, antiviral, and anti-inflammatory activities77. The chemical compounds eluci-
dated by GCMS were Oleic acid (Octadecenoic acid), Ascorbic acid, Ricinoleic acid, Stearic acid, Carboxylic acid,
Cyclopentanone, and Cedrol. Fatty acids (Oleic, linoleic and linolenic acids) enriched food showed pleiotropic
effects and used for the management of inflammation, hypertension, cardiovascular diseases, hyperlipidemia,
reproductive ailments, immune system, and aggregation of p latelets78,79. Research studies showed that Oleic
acid exerts remedial effects on the human body, such as cancer, anti-inflammatory and autoimmune diseases,
anda vital role in wound h ealing80. Ricinoleic acid is a significant unsaturated and hydroxylated fatty acid that
depicts antipathogenic activity by deterring bacteria, viruses, mold, and y east81. DVM showed very good activ-
ity against Tuberculosis strains. Mycobacterium tuberculosis is responsible for tuberculosis, which is among the
fatal diseases. DodonaeaViscosa has been locally used in traditional medicines to treat t uberculosis82,83. Tested
plant extract of DV flowers exhibited stronger resistance from all tested strains of Mycobacterium tuberculosis
owing to the occurrence of bioactive components among the different concentrations of plant methanol extract
that are probably anti-mycobacterial metabolites. Tuberculosis remains accountable for numerous mortalities
around the world. During treatment, TB patients require extensive chemical analysis and eventually generate
antagonistic effects on patient wellbeing. To diminish the use of unnatural resistant drugs, medicinally important
plants contribute to great sureness as a potential reason for bioactive anti-mycobacterial m etabolites84. A limited
distinct species of genus Dodonaea have been extensively examined both chemically and pharmacologically. The
most known species of genus Dodonaea is D. viscosa in literature85.
Conclusion
Dodonaea viscosa is well-known plant species and widely possesses so many biological activities. Results showed
the potential pharmacological effect of Dodonaea Viscosa against acute toxicity in albino mice, specifying its
use against different diseases, most of all liver diseases. This plant showed significant biological activities such
as antioxidant and anti-tuberculosis. The chemical composition of the plant is rich in antioxidant compounds,
flavonoids, and phenols, and a rich source of Fatty acids, mainly oleic acid. These compounds could probably
protect elevated hepatic enzymes caused by carbon tetrachloride and chronic tuberculosis. These curative effects
are linked with the traditional use of this plant against different diseases. This plant might be used to extract
promising drugs for the management of liver and multiple organs injury. The active compounds and their action
mechanism, pharmacokinetics, toxicology, efficacy, and molecular mechanisms still need to be explored to attain
integration into remedial practice.
Received: 25 February 2021; Accepted: 11 June 2021
References
1. Kong, M., Chen, X. G., Xing, K. & Park, H. J. Anti-microbial properties of chitosan and mode of action: A state-of-the-art review.
Int. J. Food Microbiol. 144(1), 51–63 (2010).
2. Kandimalla, R. et al. Bioactive guided fractions of Annona reticulata L. bark: Protection against liver toxicity and inflammation
through inhibiting oxidative stress and proinflammatory cytokines. Front. Pharmacol. 7, 168 (2016).
3. Kosecik, M., Erel, O., Sevinc, E. & Selek, S. Increased oxidative stress in children exposed to passive smoking. Int. J. Cardiol. 100(1),
61–64 (2005).
Scientific Reports | (2021) 11:13336 | https://doi.org/10.1038/s41598-021-92638-6 12
Vol:.(1234567890)www.nature.com/scientificreports/
4. Huang, W. et al. Depletion of liver Kupffer cells prevents the development of diet-induced hepatic steatosis and insulin resistance.
Diabetes 59(2), 347–357 (2010).
5. Cesta, M. F. Normal structure, function, and histology of the spleen. Toxicol. Pathol. 34(5), 455–465 (2006).
6. Vedi, M., Kalaiselvan, S., Rasool, M. & Sabina, E. P. Protective effects of blue green algae Spirulina fusiformis against galactosamine-
induced hepatotoxicity in mice. Asian J. Pharm. Clin. Res. 6(3), 150–154 (2013).
7. Liu, C. M., Ma, J. Q. & Sun, Y. Z. Puerarin protects the rat liver against oxidative stress-mediated DNA damage and apoptosis
induced by lead. Exp. Toxicol. Pathol. 64(6), 575–582 (2012).
8. Sundararajan, R. et al. Cytisus scoparius link-A natural antioxidant. BMC Complement. Altern. Med. 6(1), 8 (2006).
9. Fu, S. Y. et al. Liver resection under total vascular exclusion with or without preceding Pringle manoeuvre. Br. J. Surg. 97(1), 50–55
(2010).
10. Pareek, A., Godavarthi, A., Issarani, R. & Nagori, B. P. Antioxidant and hepatoprotective activity of Fagonia schweinfurthii (Hadidi)
Hadidi extract in carbon tetrachloride induced hepatotoxicity in HepG2 cell line and rats. J. Ethnopharmacol. 150(3), 973–981
(2013).
11. Stevenson, D. E. & Hurst, R. D. Polyphenolic phytochemicals–just antioxidants or much more?. Cell. Mol. Life Sci. 64(22), 2900–
2916 (2007).
12. Nayak, B. S., Marshall, J. R., Isitor, G., & Adogwa, A. (2011). Hypoglycemic and hepatoprotective activity of fermented fruit juice
of Morinda citrifolia (Noni) in diabetic rats. Evidence Based Complement. Altern. Med., 2011.
13. Mojzer, E., Knez Hrnčič, M., Škerget, M., Knez, Ž & Bren, U. Polyphenols: Extraction methods, antioxidative action, bioavailability
and anticarcinogenic effects. Molecules 21(7), 901 (2016).
14. Fauziyah, P. N., Sukandar, E. Y. & Ayuningtyas, D. K. Combination effect of anti-tuberculosis drugs and ethanolic extract of selected
medicinal plants against multi-drug resistant Mycobacterium tuberculosis isolates. Sci. Pharm. 85(1), 14 (2017).
15. Sahu, L., Jena, S., Swain, S. S., Sahoo, S. & Chand, P. K. Agrobacterium rhizogenes-mediated transformation of a multi-medicinal
herb, Boerhaavia diffusa L.: optimization of the process and anti-microbial activity against bacterial pathogens causing urinary
tract infections. Front. Life Sci. 7(3–4), 197–209 (2013).
16. Wagner. H. In Handbook of Medicinal plants (Ed, Yaniv, Z. B., U.) Haworth Press, 2005.
17. Anilreddy, B. Preparation, characterization and biological evaluation of some overview of Dodonaea viscosa Linn. J. Pharm. Sci.
Technol. 1(1), 1–9 (2009).
18. Perry, L. M., & Metzger, J. Medicinal Plants of East and Southeast Asia: Attributed Properties and Uses. MIT Press (1980).
19. Pengelly, A. R. Flavonoid Profile and Bioactivity of Dodonaea Viscosa (Australian Hop Bush)-an Indigenous Shrub. University of
Newcastle (2008).
20. Getie, M. et al. Evaluation of the anti-microbial and anti-inflammatory activities of the medicinal plants Dodonaea viscosa, Rumex
nervosus and Rumex abyssinicus. Fitoterapia 74(1–2), 139–143 (2003).
21. Veerapur, V. P., Prabhakar, K. R., Thippeswamy, B. S., Bansal, P., Srinivasan, K. K., & Unnikrishnan, M. K. (2010). Antidiabetic
effect of Dodonaea viscosa (L). Lacq. aerial parts in high fructose-fed insulin resistant rats: a mechanism-based study.
22. Rajamanickam, V. et al. Anti-diarrheal activity of Dodonaea viscosa root extracts. Int J Pharm. Biol. Sci 1(4), 182–185 (2010).
23. Sachdev, K. & Kulshreshtha, D. K. Flavonoids from Dodonaea viscosa. Phytochemistry 22(5), 1253–1256 (1983).
24. Ghisalberti, E. L. Ethnopharmacology and phytochemistry of Dodonaea species. Fitoterapia 69, 99–113 (1998).
25. Ali, H. et al. Hautriwaic acid as one of the hepatoprotective constituent of Dodonaea viscose. Phytomedicine 21, 131–140 (2014).
26. Sastry, K. N. S. & Nayudamma, Y. Leucocyanidin from Dodonaea viscosa bark. Leather Sci. 13, 174–176 (1966).
27. Wagner, C., Ludwig, L., Grotjahn, M. S. & Khan, Y. Phytochemistry 26, 697–702 (1987).
28. Li, M. et al. MicroRNA-223 ameliorates alcoholic liver injury by inhibiting the IL-6–p47phox–oxidative stress pathway in neutro-
phils. Gut 66(4), 705–715 (2017).
29. Dacie, J. W. & Lewis, S. M. Practical Haematology 7th edn, 556 (Churchill Livingstone, 1991).
30. Misra, H. P. & Fridovich, I. The role of superoxide anion in the autoxidation of epinephrine and a simple assay for superoxide
dismutase. J. Biol. Chem. 247(10), 3170–3175 (1972).
31. Flohé, L., & Günzler, W. A. (1984). Assays of glutathione peroxidase. In Methods in Enzymology (Vol. 105, pp. 114–120). Academic
Press.
32. Lowry, O. H., Rosebrough, N. J., Farr, A. L. & Randall, R. J. Protein measurement with the Folin phenol reagent. J. Biol. Chem.
193(1), 265–275 (1951).
33. Yakubu, M. T., Akanji, M. A. & Oladiji, A. T. Evaluation of antiandrogenic potentials of aqueous extract of Chromolaena odoratum
(L.) KR leaves in male rats. Andrologia 39(6), 235–243 (2007).
34. Giribabu, N., Karim, K., Kilari, E. K. & Salleh, N. Phyllanthus niruri leaves aqueous extract improves kidney functions, ameliorates
kidney oxidative stress, inflammation, fibrosis and apoptosis and enhances kidney cell proliferation in adult male rats with diabetes
mellitus. J. Ethnopharmacol. 205, 123–137 (2017).
35. Sabir, S. M. & Rocha, J. B. T. Antioxidant and hepatoprotective activity of aqueous extract of Solanum fastigiatum (false “Jurubeba”)
against paracetamol-induced liver damage in mice. J. Ethnopharmacol. 120(2), 226–232 (2008).
36. Moreno, M. I. N., Isla, M. I., Sampietro, A. R. & Vattuone, M. A. Comparison of the free radical-scavenging activity of propolis
from several regions of Argentina. J. Ethnopharmacol. 71(1–2), 109–114 (2000).
37. Moon, J. K. & Shibamoto, T. Antioxidant assays for plant and food components. J. Agric. Food Chem. 57(5), 1655–1666 (2009).
38. Dinis, T. C., Madeira, V. M. & Almeida, L. M. Action of phenolic derivatives (acetaminophen, salicylate, and 5-aminosalicylate)
as inhibitors of membrane lipid peroxidation and as peroxyl radical scavengers. Arch. Biochem. Biophys. 315(1), 161–169 (1994).
39. Nagai, T., Nagashima, T., Suzuki, N. & Inoue, R. Antioxidant activity and angiotensin, I-converting enzyme inhibition by enzymatic
hydrolysates from bee bread. Zeitschrift für Naturforschung C 60(1–2), 133–138 (2005).
40. Ashafa, A. O. T., Grierson, D. S. & Afolayan, A. K. In vitro antioxidant activity of extracts from the leaves of Felicia muricata
Thunb. an underutilized medicinal plant in the eastern cape province, South Africa. Afr. J. Tradit. Complement. Altern. Med. 7(4),
66 (2010).
41. Dehghan, G. & Khoshkam, Z. Tin (II)–quercetin complex: Synthesis, spectral characterization and antioxidant activity. Food Chem.
131(2), 422–426 (2012).
42. Hazra, B., Biswas, S. & Mandal, N. Antioxidant and free radical scavenging activity of Spondias pinnata. BMC Complement. Altern.
Med. 8(1), 63 (2008).
43. Adedapo, A. A., Jimoh, F. O., Afolayan, A. J. & Masika, P. J. Antioxidant properties of the methanol extracts of the leaves and stems
of Celtis africana. Rec. Nat. Prod. 3(1), 66 (2009).
44. Aiyegoro, O. A. & Okoh, A. I. Preliminary phytochemical screening and in vitro antioxidant activities of the aqueous extract of
Helichrysum longifolium DC. BMC Complement. Altern. Med. 10(1), 21 (2010).
45. Beauchamp, C. & Fridovich, I. Superoxide dismutase: Improved assays and an assay applicable to acrylamide gels. Anal. Biochem.
44(1), 276–287 (1971).
46. Daferera, D. J., Ziogas, B. N. & Polissiou, M. G. GC–MS analysis of essential oils from some Greek aromatic plants and their
fungitoxicity on Penicillium digitatum. J. Agric. Food Chem. 48(6), 2576–2581 (2000).
47. Upadhyay, R. K. GC-MS analysis and in vitro anti-microbial susceptibility of Foeniculum vulgare seed essential oil. Am. J. Plant
Sci. 6(07), 1058 (2015).
Scientific Reports | (2021) 11:13336 | https://doi.org/10.1038/s41598-021-92638-6 13
Vol.:(0123456789)You can also read