Transcriptomic and network analyses reveal distinct nitrate responses in light and dark in rice leaves (Oryza sativa indica var. Panvel1)
←
→
Page content transcription
If your browser does not render page correctly, please read the page content below
www.nature.com/scientificreports
OPEN Transcriptomic and network
analyses reveal distinct nitrate
responses in light and dark in rice
leaves (Oryza sativa Indica var.
Panvel1)
Ravi Ramesh Pathak, Annie Prasanna Jangam, Aakansha Malik, Narendra Sharma,
Dinesh Kumar Jaiswal* & Nandula Raghuram*
Nitrate (N) response is modulated by light, but not understood from a genome-wide perspective.
Comparative transcriptomic analyses of nitrate response in light-grown and etiolated rice leaves
revealed 303 and 249 differentially expressed genes (DEGs) respectively. A majority of them were
exclusive to light (270) or dark (216) condition, whereas 33 DEGs were common. The latter may
constitute response to N signaling regardless of light. Functional annotation and pathway enrichment
analyses of the DEGs showed that nitrate primarily modulates conserved N signaling and metabolism
in light, whereas oxidation–reduction processes, pentose-phosphate shunt, starch-, sucrose- and
glycerolipid-metabolisms in the dark. Differential N-regulation of these pathways by light could
be attributed to the involvement of distinctive sets of transporters, transcription factors, enriched
cis-acting motifs in the promoters of DEGs as well as differential modulation of N-responsive
transcriptional regulatory networks in light and dark. Sub-clustering of DEGs-associated protein–
protein interaction network constructed using experimentally validated interactors revealed that
nitrate regulates a molecular complex consisting of nitrite reductase, ferredoxin-NADP reductase and
ferredoxin. This complex is associated with flowering time, revealing a meeting point for N-regulation
of N-response and N-use efficiency. Together, our results provide novel insights into distinct pathways
of N-signaling in light and dark conditions.
A major challenge in improving crops for input use efficiency is to understand and optimize the inputs for vari-
ous agroclimatic conditions including light and photoperiod, soil type, altitude, humidity etc. Nitrogen (N) is
quantitatively the most important fertilizer input for intensive cropping, but globally, nitrogen use efficiency
(NUE) is as low as 30–40% for various crops, which is a major cause for economic losses and environmental con-
sequences of N pollution1. Rice has the least NUE among cereals and therefore tops all other crops in N-fertilizer
consumption in I ndia2. The molecular aspects of nitrate transport, assimilation, signalling and crosstalk with
water, hormone, and development are better understood than the biological determinants of crop nitrogen use
efficiency3–14. Characterization of the phenotype for NUE will be crucial for progress in this regard15.
Nitrate is taken up into the cell by a family of transporters and converted into ammonium ions by the serial
action of nitrate reductase (NR) and nitrite reductase (NiR), followed by their assimilation into amino acids
through the glutamine synthetase and glutamate synthase (GS-GOGAT) cycle. This requires 2-oxoglutarate
(2-OG) from the carbon metabolism and hence coordination between C and N metabolism4. Transcriptomic
studies have revealed thousands of nitrate-responsive genes in Arabidopsis3,16–18, rice19–23 and maize24. They
include those involved in metabolism, redox balance, signaling, stress, hormones, development etc., indicat-
UE6,8,10,25,26. Heterotrimeric G-protein gamma subunit has been identified as a QTL
ing their possible role in N
for NUE in r ice27, while the beta subunit has been shown to mediate nitrate-responsive root d evelopment28.
University School of Biotechnology, Guru Gobind Singh Indraprastha University, Sector 16C, Dwarka, New
Delhi 110078, India. *email: dinesh.jaiswal82@gmail.com; raghuram@ipu.ac.in
Scientific Reports | (2020) 10:12228 | https://doi.org/10.1038/s41598-020-68917-z 1
Vol.:(0123456789)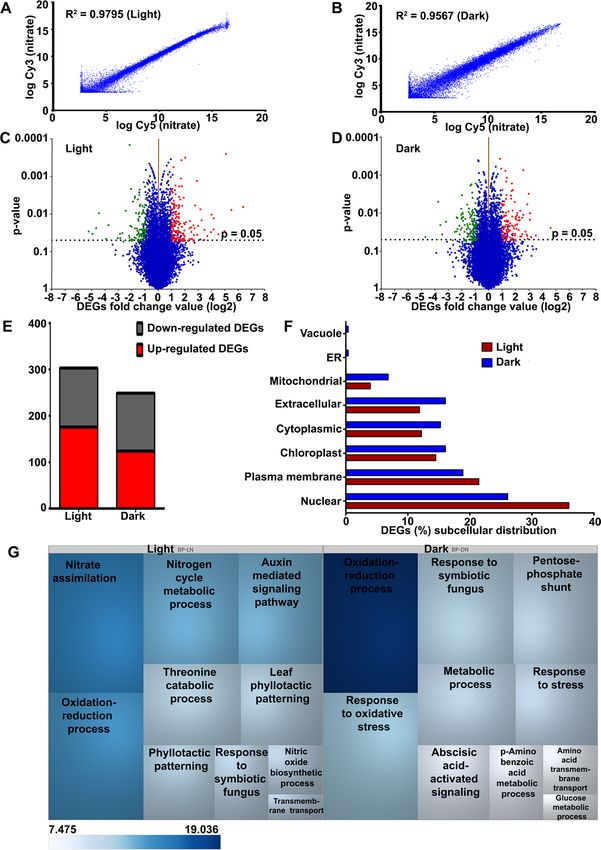
www.nature.com/scientificreports/
Figure 1. Phenotypic, physiological and molecular analyses of nitrate responses in 10 days old light-grown and
etiolated seedlings in rice. (A) Representative image of light-grown and etiolated seedlings. (B) Mesocotyl and
coleoptile length of light-grown and etiolated seedlings and data represent the average of 16 seedlings. (C) Leaf
chlorophyll content. The data represents the means ± SD of three independent biological replicates. (D) Effect
of nitrate doses on nitrate reductase activity in the leaves of light-grown and etiolated seedlings. (E) Relative
expression level of nitrate reductase and nitrite reductase genes in the leaves of light-grown and etiolated
seedlings treated with either water (control) or 120 mM nitrate for 90 min, determined by qRT-PCR. ***p
value < 0.001.
G-proteins were implicated in light regulation of NR gene expression in our earlier studies in maize29,30 and rice31.
Our transcriptome studies in G-protein mutants showed their role in other nitrogen and/or stress r esponses32–36.
Light is an important regulator of plant N-responses, both through photosynthesis and C/N balance, as well
as through light signaling37. Light promotes N uptake and/or assimilation in maize29, rice38 and Arabidopsis39,40.
Recently, elongated hypocotyl 5 (Hy5), a positive regulator of light signalling, has been shown to enhance nitrate
uptake in Arabidopsis40. Interestingly, N regulates flowering time by modulating a blue-light receptor cryp-
tochrome 1 (CRY1) in Arabidopsis41. Sucrose mimics light-responses and its exogenous application induces
NR activity possibly via hexose’s sensor independent N-signalling pathway in A rabidopsis42. Further, metabo-
lite sensor SNRK1 regulates NR and sucrose phosphate synthase activity and therefore controls both N and C
metabolism43.
Most of the above information on the role of light in N-response was based on Arabidopsis and not on crop
plants. Therefore, to delineate the molecular basis of light-dependent and independent nitrate response, we
analysed the nitrate-responsive leaf transcriptomes of light-grown and etiolated rice seedlings in this study.
Results
Delineation of nitrate responses in etiolated and light‑grown rice seedlings. The experimen-
tal conditions for analysis of nitrate response in excised leaves of etiolated and light-grown 10-days old rice
seedlings were confirmed as follows. Etiolated seedlings were pale yellow in colour and showed significantly
(p < 0.05) elongated mesocotyl and coleoptile length compared to light-grown condition (Fig. 1A,B). The leaf
chlorophyll contents (chl-a and chl-b) were relatively higher in light-grown seedlings, as expected (Fig. 1C). The
optimum concentration for nitrate treatment of excised leaves was determined by a dose–response analysis of
NR activity and 120 mM K NO3 was found to be optimum in light and dark conditions (Fig. 1D). The NR activity
Scientific Reports | (2020) 10:12228 | https://doi.org/10.1038/s41598-020-68917-z 2
Vol:.(1234567890)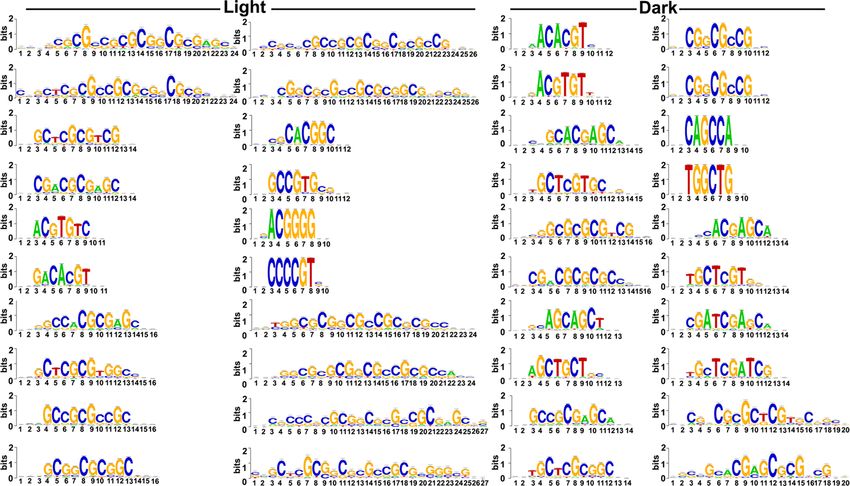
www.nature.com/scientificreports/
was much higher in light as compared to dark condition at all doses of nitrate (Fig. 1D). This was also true for
transcript levels of NR and NiR at the optimum nitrate dose (Fig. 1E). These results confirmed the conditions of
etiolation and nitrate treatments for microarray analysis.
Nitrate‑responsive leaf transcriptomes in light and dark. Genome-wide expression profiling of
nitrate-response was carried out by microarray analysis using leaves from ten days old etiolated and light-grown
rice seedlings treated with or without 120 mM K NO3 for 90 min under light and dark conditions. Hierarchi-
cal clustering of expression values obtained for light- and dark nitrate-treated samples revealed similar trends
among the two independent biological-cum-flip dye replicates (Fig. S1). Scatter plots of replicates revealed high
correlations between replicates (R2 = 0.9795 for light-nitrate and R2 = 0.9561 for dark nitrate) (Fig. 2A,B), indi-
cating data quality and reproducibility. A geomean cutoff ( log2FC) of ± 1 and p value ≤ 0.05 were used to define
the differentially expressed genes (DEGs). Multiple testing corrections using Benjamini–Hochberg adjusted p
value were tried but not considered, as they produced many false negatives by eliminating many well-known
N-responsive genes obtained from qualifying our geomean cutoff (log2FC) of ± 1 (Tables S1, S2). An overview
of global gene expression using volcano plots showed that nitrate regulates substantially more DEGs in light
as compared to dark condition (Fig. 2C,D). Data analysis revealed 303 nitrate-responsive DEGs in light (176
up- and 127 down-regulated) and 249 DEGs under dark condition, with 124 up- and 125 down-regulated genes
(Fig. 2E). The ratio of up/down regulated genes was also higher in light, indicating substantial transcriptional
reprogramming and molecular changes in light.
We have used CELLO tool (https: //cello. life.nctu.edu.tw/)44,45 to predict the subcellular distribution of proteins
encoded by nitrate-responsive DEGs in light and dark, which revealed that they are predominantly targeted to
the nucleus, followed by plasma membrane, chloroplast and others (Fig. 2F). Their comparative analyses revealed
that more such proteins were localized to the nucleus in light, whereas there were more extracellular proteins in
the dark. The latter may be involved in etiolated phenotype in the dark, as genes encoding extracellular or cell
wall proteins are known for their role in cell expansion46. The secretory nature and the presence of other signal
peptides of proteins encoded by DEGs were analyzed using TargetP 2.0. We observed that a higher percentage
of DEGs encoded proteins are non-secretory in nature in both light and dark conditions (Fig. S2).
To understand the nitrate-responsive biological processes, we functionally annotated the DEGs based on
their GO enrichment analysis using ExPath t ool47. It revealed that in addition to the expected enrichment of
DEGs involved in nitrate signaling and metabolism, light-grown seedlings showed auxin-mediated signaling
and leaf phyllotactic patterning, among others (Fig. 2G). However, in the dark, oxidation–reduction processes,
pentose-phosphate shunt and oxidative stress response were the top-most significantly enriched GO terms for
nitrate response (Fig. 2G). The details of GO-enrichment analyses are provided in Table S3.
To understand the biological processes that constitute nitrate-response, we mapped the DEGs and their
expression values onto various cellular pathways/processes using MapMan (https://mapman.gabipd.org/mapma
n)48. The results were broadly similar to those from GO analysis, with nitrate-responsive changes to metabo-
lism, cellular responses, regulation and hormone biosynthesis among others (Tables S4, S5). Further, a number
of DEGs were found to be involved in development, biotic and abiotic stresses, suggesting signaling crosstalk
between nitrate and stress responses in p lants26. PageMan analysis revealed the over- and under-representation
of different pathways affected by nitrate in light and dark conditions. The significantly enriched categories were
photosynthesis, nitrogen metabolism, amino acid metabolism, carbohydrate metabolism, signaling and develop-
ment among others (Fig. 3).
Further, ExPath-based comparative pathway analyses revealed the enrichment of statistically significant (p
value < 0.05) pathways such as phenylpropanoid biosynthesis, nitrogen metabolism, phenylalanine metabolism,
hormone signal transduction and photosynthesis in light, whereas in the dark, they were starch and sucrose
metabolism, metabolic pathways, glycerolipid metabolism and N-Glycan biosynthesis (Table S6).
Validation of N‑responsive genes involved in nutrients, stress and development. To validate
the expression profile of nitrate-responsive genes involved in nutrient, stress and development, 6 DEGs out of 8
tested DEGs encoding transporter, transcription factors and others showed statistically significant differences in
qRT-PCR, thus validating the microarray results (Fig. 4).
The details of these DEGs and corresponding primer sequences used for qRT-PCR are provided in Table S7.
Three of them were up-regulated by nitrate in light but not detected in dark condition. They were, calcium-
dependent protein kinase (Os08g0540400/BGIOSGA026567) and basic helix-loop-helix proteins bHLH120
(Os09g0455300/BGIOSGA030896), bHLH066 (Os03g0759700/BGIOSGA013600). However, universal
stress domain containing protein (Os02g0707900/BGIOSGA005763), efflux transporter of nicotianamine 1
(Os11g0151500/BGIOSGA034485) and MYB family transcription factors (Os02g0618400/ BGIOSGA006030,
Os05g0195700/BGIOSGA018651) were up-regulated by nitrate in the dark but not detected in light condi-
tion. The SPX domain containing protein (Os02g0202200/BGIOSGA007749) was down-regulated in both light
and dark. The reason for non-detected DEGs in microarray was their statistically non-significant expressions
(Table S7). The qRT-PCR results of six DEGs confirmed their similar regulation as observed in the microarray
experiments, thus validating them (Fig. 4).
Organ association of the expression of identified N‑responsive genes. As transcriptome analysis
reveals only those genes expressed in the particular stage and tissue used (leaves of 10-days old seedlings in this
case), it was of interest to examine how many of the N-responsive genes identified here are expressed in other
stages/tissues of the rice plant. This allows to separate those genes that are ubiquitously expressed in most of
the organs from those that are unique to specific organs/stages for further validation of their nitrate response.
Scientific Reports | (2020) 10:12228 | https://doi.org/10.1038/s41598-020-68917-z 3
Vol.:(0123456789)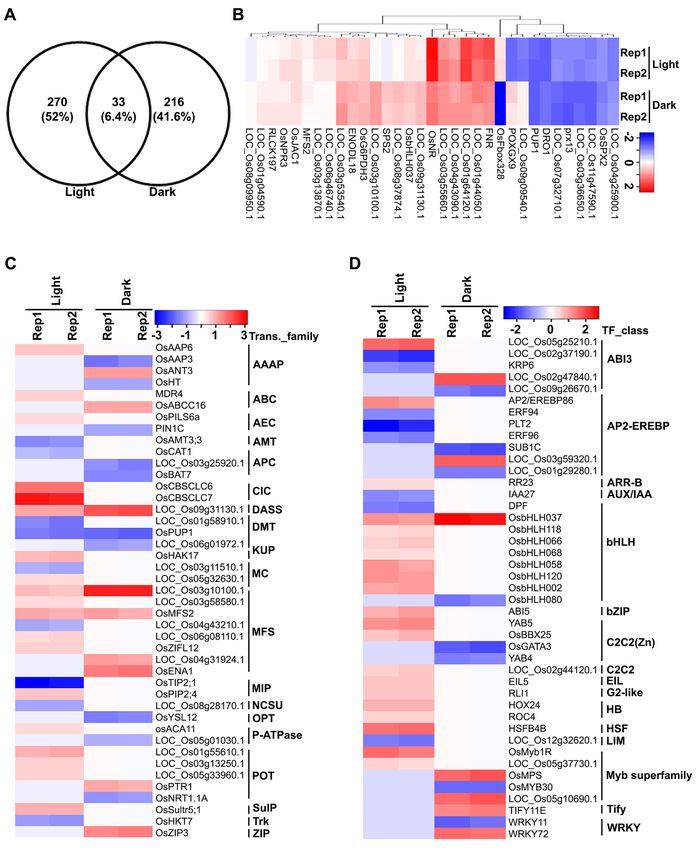
www.nature.com/scientificreports/

          Scientific Reports |   (2020) 10:12228 |   https://doi.org/10.1038/s41598-020-68917-z   4

Vol:.(1234567890)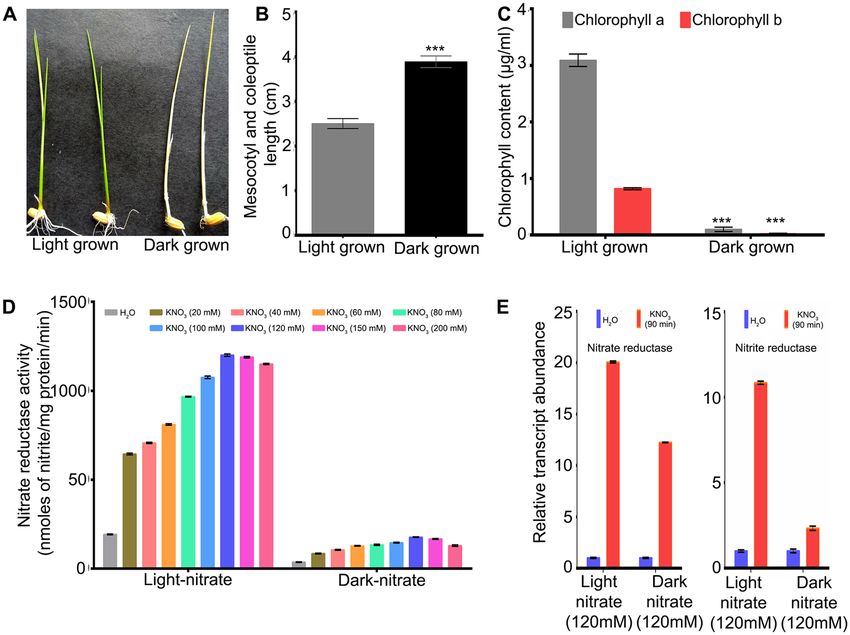
www.nature.com/scientificreports/
◂Figure 2. Analysis of nitrate-responsive leaf transcriptomes of light-grown and etiolated rice seedlings.
Scatter plots show the correlation between the biological replicates of transcriptomes in light (A) and dark
(B) conditions. The correlation coefficients of normalized ratios were calculated between the dye swapped
nitrated treated samples in light (R2 = 0.9795) and dark (R2 = 0.9567). The volcano plots of microarray data
are shown for light (C) and dark (D). The X-axis represents the fold change (log2) and p-value on Y-axis. The
dashed horizontal line shown on the plots represents the p value cut-off (p = 0.05) and the genes above this
line are statistically significant. Each transcript is represented by scattered dots. The red and green coloured
scattered dots represent the up- and down-regulated DEGs, respectively. (E) Column graph shows the numbers
of up-regulated or down-regulated nitrate-responsive genes in light and dark conditions. (F) Bar graph
depicting the subcellular localization of DEGs-encoded proteins identified in light and dark. (G) The DEGs
were functionally annotated into different biological processes using Expath tool. Top 10 statistically significant
biological processes (P < 0.05) were visualized using TreeMap software (https://www.treemap.com/). The size of
the box is inversely proportional to the ranking of the biological processes by p value and coloured according to
their statistically significant p value (−log2). In other words, a biological process with the lowest p value has the
biggest box size and its colour intensity shows its statistical significance. BP-LN biological process-light nitrate,
BP-DN biological process-dark nitrate.
This was particularly relevant in view of the incomplete characterization of the phenotype for N-response/
NUE. We therefore searched the oryzabase database (https://shigen.nig.ac.jp/rice/oryzabase/) and found that
N-responsive DEGs were assigned to culm, root, leaf, spikelet, seed, heading date and panicle (Fig. 5). The avail-
ability of nitrate in the soil significantly affects the root system a rchitecture8,22. Five root-associated N-responsive
DEGs were identified only in light, including phytoene synthase (LOC_Os09g38320.1) and LTP family protein
(LOC_Os02g44310.1). Phytoene synthase (PSY) regulates carbon flux in carotenoid biosynthesis and is required
to induce carotenogenesis-dependent ABA accumulation in root under different abiotic stress conditions49,50.
The up-regulated expression of PSY in light may be associated with root inhibition by high nitrate in rice. Leaf
is the primary organ for photosynthesis in rice and application of high N dose has been shown to reduce pho-
tosynthetic NUE51. Among leaf-associated N-responsive DEGs, we observed up-regulated expression of Zn
transporter 3 (LOC_Os04g52310.1) and ABA stress-ripening (LOC_Os11g06720.1) in light, whereas plastid
terminal oxidases 1 (LOC_Os04g57320.1) and YABBY domain containing protein (LOC_Os04g45330.1) were
up-reregulated in dark (Fig. 5 and Table S8).
Plastid terminal oxidase was differentially regulated during N starvation in lower o rganisms52,53, whereas
YABBY domain containing proteins are known to regulate leaf morphology in p lants54. A few DEGs were also
associated with agronomically important traits (Table S8) indicating their regulation by nitrate in rice.
Common and unique processes of N‑response in dark and light. To identify the similarities and
differences in nitrate-response under light and dark conditions, the DEGs were subjected to venn selections
using Venny 2.1.0 (https://bioinfogp.cnb.csic.es/tools/venny/), which revealed 270 and 216 N-responsive DEGs
exclusive to light and dark conditions, respectively, with an additional 33 genes in common (Fig. 6A). A heat
map revealed the expression pattern of common DEGs, which were associated with N-transport, metabolism,
signaling and hormone (Fig. 6B) among others (Table S9).
To further segregate the common and exclusive DEGs, we performed venn selections using four different
classes of DEGs i.e. up-regulated in light, down-regulated in light, up-regulated in dark and down-regulated in
dark. A major fraction of DEGs were exclusive to their classes, with only 21 up-regulated DEGs common in light
and dark, whereas 8 down-regulated DEGs common in light and dark (Fig. S4). MapMan analysis revealed that
some genes of the ‘transport’, ‘signaling’ and associated transporter and transcription factor categories responded
differently in light and dark conditions (Fig. 3).
Leaf acts as a source of N partitioning, which is mediated by phloem networks and the transport across this
networks regulates N-transport pathways in root, stem and other organs. N-transport pathways are regulated
by transporters and carrier proteins present in the membranous structures. Transporters are also considered as
potential targets to improve N UE55, but it is not well known which transporters are involved in N partitioning
and how N-uptake and subsequent transport towards and within different organs in plants are coordinated56. To
catalogue different classes of N-responsive transporters known to be involved in other transport pathways, we
identified 43 nitrate-responsive DEGs belonging to 19 families of transporters (Fig. 6C and Table S10) in light
and dark conditions. Out of these, 9 are regulated by nitrate in both light/dark, whereas 8 are exclusive to light
and 2 are unique to dark conditions only (Fig. S5). We found that nitrate up-regulated not only the expression of
nitrate transporters in light, but also chloride channel protein, sulfate transporter, high-affinity potassium trans-
porter and peptide transporter among others. Others such as sodium/sulphate symporter, sorbitol transporter
and nodulin-like protein were up-regulated by nitrate in both light and dark conditions (Table S10).
To understand how nitrate regulates transcriptional networks, we identified DEGs encoding transcription
factors (TFs) in rice. This was done by searching the for N-responsive DEGs in different transcription fac-
tor databases viz. RiceFREND (https://ricefrend.dna.affrc.go.jp/), RiceSRTFDB (https://www.nipgr.ac.in/RiceS
RTFDB.html), STIFDB (https://caps.ncbs.res.in/stifdb/) and MapMan and classifying them into families using
Rice SRTFDB (Fig. 6D and Table S11, Fig. S6). This revealed 43 TFs belonging to 16 families as regulated by
nitrate in both light and dark conditions (Fig. 6D and Table S11). Among these TF families, basic helix-loop-
helix (bHLH), aptela-2/ethylene-responsive element binding protein (AP2-EREBP) and MYB superfamily were
the most abundant in rice. The members of bHLH, AP2-EREBP, MYB superfamily, abscisic acid-insensitive 3
(ABI3) and zinc finger C2H2 [C2C2(Zn)]TF family were regulated by nitrate in both light and dark conditions.
The up-regulated TFs were predominant in light, whereas down-regulated TFs were found in both light/dark
Scientific Reports | (2020) 10:12228 | https://doi.org/10.1038/s41598-020-68917-z 5
Vol.:(0123456789)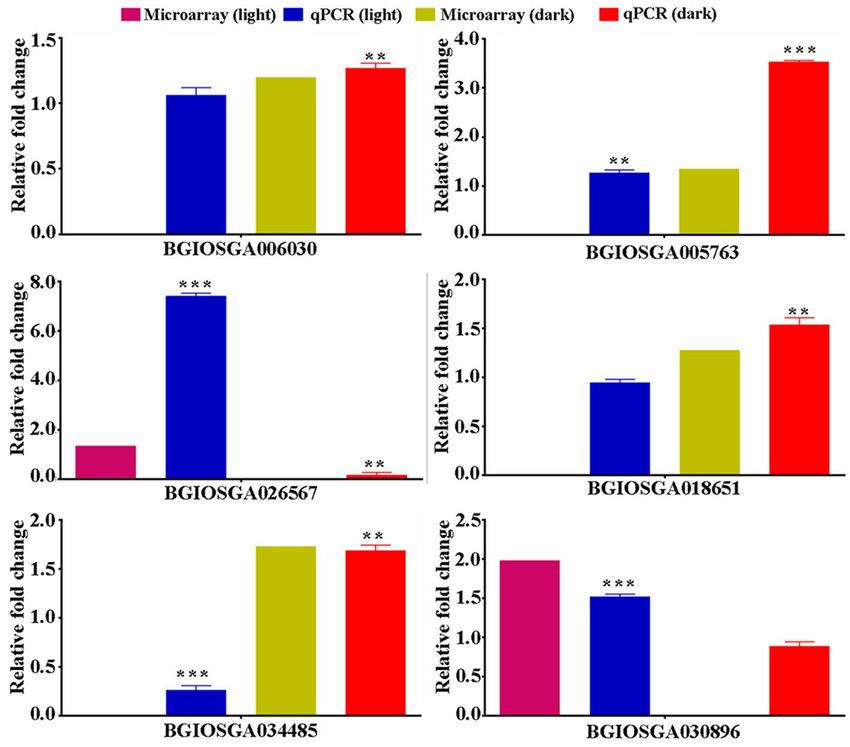
www.nature.com/scientificreports/
Figure 3. PageMan analyses of nitrate-responsive transcripts differentially expressed between light and
dark conditions. Over- and under-represented nitrate-responsive pathways in light and dark conditions
were analyzed in PageMan (https://mapman.gabipd.org/pageman) using Wilcoxon algorithm with default
parameters. Bin names are shown to the left of the image and treatment conditions are mentioned at the top
of the image. Significant functional groups are indicated by either red (over-represented) or blue (under-
represented) colour according to the scale and details are provided in Fig. S3.
Scientific Reports | (2020) 10:12228 | https://doi.org/10.1038/s41598-020-68917-z 6
Vol:.(1234567890)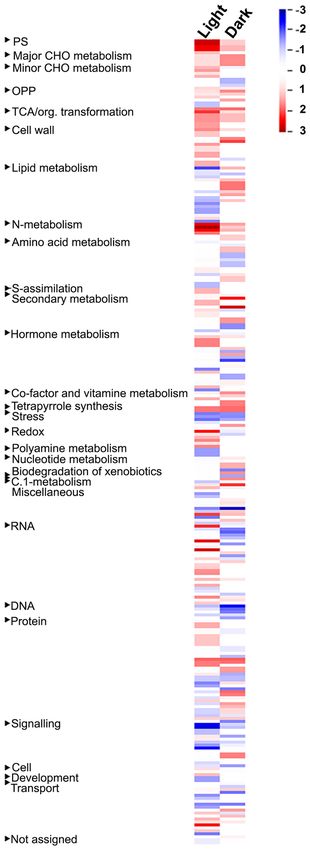
www.nature.com/scientificreports/
Figure 4. qRT-PCR validation of nitrate-responsive genes identified in light and dark conditions. Total
RNA was isolated from control (H2O) and nitrate-treated leaves of 10 days old light-grown and etiolated
rice seedlings. Relative transcript abundance was calculated by comparative Ct method using actin as
a reference gene for data normalization. The data represent the mean ± SE of three technical replicates.
Final relative fold change values (qPCR) of DEGs and their corresponding values obtained in microarray
experiment were plotted for parallel comparison of DEG trends in qPCR and microarray experiments. To
avoid additional bars and better clarity of the results, control value (H2O) obtained in qPCR were not included
in the image. However, the statistical analyses were performed between control ( H2O) and nitrate treated
value (comparative Ct method) obtained by qPCR. Statistical unpaired T test analyses [control ( H2O) vs.
nitrate] were performed in the GraphPad Prism 6 software using technical replicates (**p value < 0.01, ***p
value < 0.001). The experiments were performed with three independent biological replicates. MYB family
transcription factors (BGIOSGA006030, BGIOSGA018651); universal stress protein domain containing protein
(BGIOSGA005763); calcium-dependent protein kinase (BGIOSGA026567); efflux transporter of nicotianamine
1 (BGIOSGA034485); bHLH120 (BGIOSGA030896).
conditions (Fig. 6D, Table S11), suggesting the involvement of different TFs in mediating nitrate responses in
light and dark conditions in rice.
Different cis‑acting motifs may mediate nitrate responses in light and dark. Transcription fac-
tors (TFs) act as master regulators by binding to cis-acting motifs in the promoter regions of genes to control
diverse cell processes, including N signaling9. Identification of such motifs upstream of N-responsive genes will
aid in understanding N signaling and may also reveal candidate genes for NUE. The oligo analysis program of
Regulatory Sequence Analysis Tools (RSAT) was used to identify the over-represented motifs in the 1 kb pro-
moter sequences of the N-responsive DEGs identified in light and dark conditions.
We separately downloaded promoter sequences of up- and down-regulated DEGs identified in light and
dark conditions and predicted the enriched N-responsive motifs present in their promoter regions. Most of
the predicted motifs are exclusive to their group (Tables S12, S13), which could be due to few common DEGs
between light and dark (Fig. S4). A few enriched motifs predicted in the promoter of up-regulated DEGs in light
condition were similar to nitrate-regulated motifs (Table 1) validated in Arabidopsis57. We further predicted
the motif enrichment using 1 kb promoter sequence of all the DEGs identified in light and dark conditions.
Examination of the 20 most significantly enriched motifs in DEGs identified under light and dark conditions
revealed that they are entirely different sets, despite the fact that 33 DEGs were common to both conditions
(Fig. 7 and Table S14). Many of them pertain to nitrate-regulated transcription factors known in Arabidopsis.
This indicates that different TFs may mediate N-response in light and dark conditions through their respective
binding motifs identified in this study.
Scientific Reports | (2020) 10:12228 | https://doi.org/10.1038/s41598-020-68917-z 7
Vol.:(0123456789)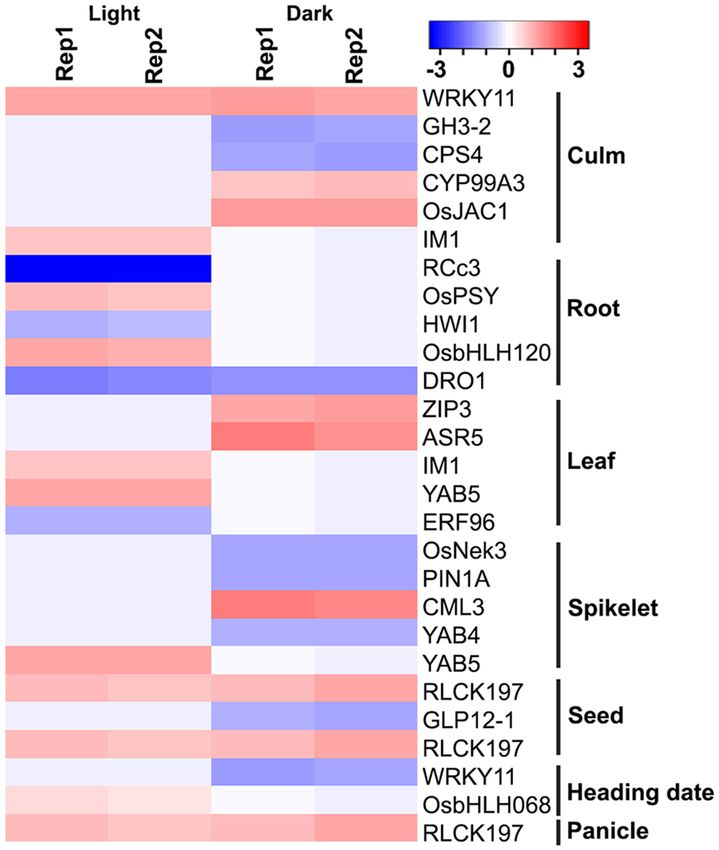
www.nature.com/scientificreports/
Figure 5. Organ-association of nitrate-responsive genes. The identified N-responsive DEGs were searched in
Oryzabase database, catalogued and their expression presented as heat maps using heatmapper (https://heatm
apper.ca/). The default colour scale shows the expression value of DEGs (calculated as z-scores) associated with
culm, root, leaves, spikelet, seed, heading date and panicle. Rep1, replicate 1; Rep2, replicate 2. The symbols of
genes were according to CGSNL.
Nitrate‑responsive transcriptional regulatory networks. It is known that orthologous proteins are
conserved and perform similar function in different plants. For example, nitrate transporter and other pro-
teins involved in nitrate-associated pathways are known to perform similar function in different p lants64. Our
MapMan pathway analyses and functional classification of DEGs in light and dark conditions revealed 43 TFs
as N-responsive (Fig. 6D, Table S11). Recently, nitrate-responsive transcriptional regulatory (NTR) networks
have been developed in Arabidopsis57. Using Arabidopsis nitrate-responsive transcriptional regulatory (NTR)
networks built from yeast one-hybrid screens and validated by knockouts57, similar networks were developed in
this study using their orthologues in rice. Prior to this, we verified the level of gene conservation between rice
and Arabidopsis using Orthovenn 265. We observed 11,367 and 11,956 orthologous clusters in Arabidopsis and
rice, respectively, of which 9,698 orthologous clusters were common (Fig. S7), confirming their high level of
conservation of orthologs and associated pathways/processes.
All the nitrate-regulated transcriptional network information was retrieved from published literature57 and
the corresponding rice orthologs were downloaded from PlantGDB database (https://www.plantgdb.org/). We
identified 144 conserved orthologs in rice, with 91 in light and 53 in dark conditions, of which many, but not
all were N-responsive in our microarray data (Table S15). We therefore constructed NTR networks associated
separately for light and dark conditions in Cytoscape and mapped the expression of the N-responsive DEGs
onto the networks (Fig. 8).
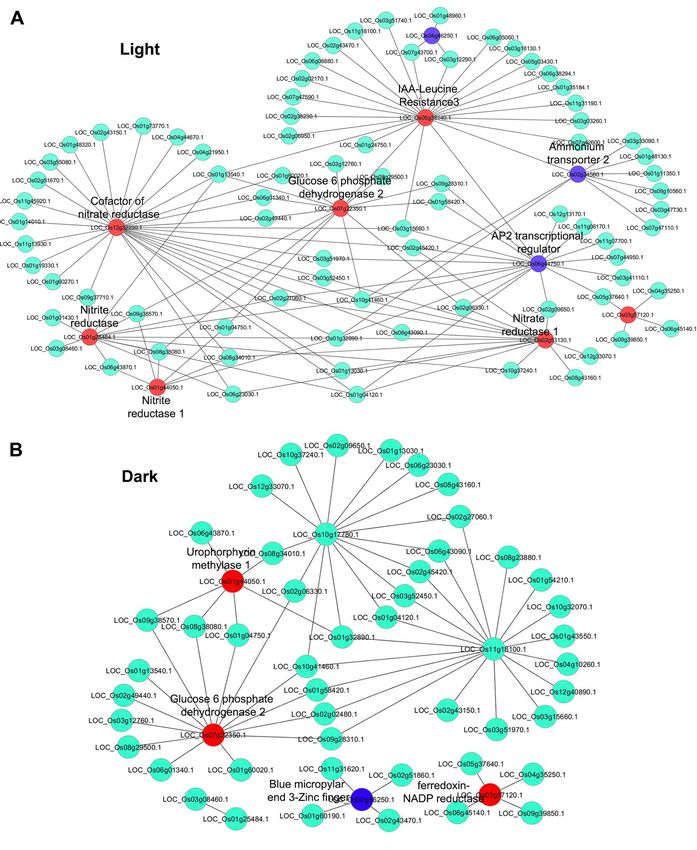
We observed well-conserved nitrate-regulated genes such as nitrate transporters, nitrate reductase, nitrite
reductase among others in NTR networks (Fig. 8). To check the biological relevance of the constructed NTR
networks in rice (Fig. 8), we functionally annotated the NTR networks genes using ExPath GO enrichment
tool. The most over-represented GO term for biological processes were regulation of transcription, response to
nitrate, nitrate assimilation, biosynthetic process, cellular response to nitrate among others in light, whereasin
dark, they were regulation of transcription, nitrate assimilation, cellular nitrogen compound metabolic process,
response to water deprivation and auxin-activated signaling pathway among others (Table S16). Interestingly,
the GO terms associated with nitrate metabolism were over-represented in light-NTR network as compared to
dark-NTR network, confirming that light enhances nitrate-regulation of N-metabolism.
Nitrate‑responsive protein networks reveal overlaps between N‑metabolism, development
and stress. Nitrate-regulated growth and developmental plasticity of the plant is tightly regulated by light.
To understand the underlying interactions at the protein level, we constructed protein–protein interaction (PPI)
networks using N-responsive DEGs in light and dark conditions (Figs. S8, S9). The experimentally validated
interactors associated with DEGs were retrieved from BioGRID, PRIN MCDRP and STRING databases and
networks were constructed and visualized in Cytoscape 3.0.066. We mapped the DEGs expression value onto the
Scientific Reports | (2020) 10:12228 | https://doi.org/10.1038/s41598-020-68917-z 8
Vol:.(1234567890)www.nature.com/scientificreports/
Figure 6. Transcriptomic analyses reveals common and distinct nitrate regulation by transporters and transcription factors in light
and dark. (A) Venn diagram showing the number of common and exclusive DEGs identified in light and dark conditions. Heat
map depicting the expression profile of common DEGs (B), transporters (C) and transcriptions factors (D). Each row represents
individual nitrate-responsive gene and the columns correspond to light and dark conditions. The colour on scale bar matches the
fold change value ( log2FC) of DEGs calculated as z-scores. Heat maps were generated using heatmapper (https://heatmapper.ca/).
AAAP Amino acid/auxin permease, ABC ATP-binding cassette, AEC auxin efflux carrier, Amt ammonia transporter channel, APC
amino acid-polyamine-organocation, ClC chloride carrier/channel, DASS divalent anion:Na+ symporter, DMT drug/metabolite
transporter, KUP K+ uptake permease, MC mitochondrial carrier, MFS major facilitator superfamily, MIP major intrinsic protein,
NCS2 nucleobase:cation symporter-2, OPT oligopeptide transporter, P-ATPase P-type ATPase, POT proton-dependent oligopeptide
transporter, SulP sulfate permease, Trk K+ transporter, ZIP Zinc ( Zn2+)-iron (Fe2+) permease. The symbols of genes were according to
CGSNL.
Scientific Reports | (2020) 10:12228 | https://doi.org/10.1038/s41598-020-68917-z 9
Vol.:(0123456789)www.nature.com/scientificreports/
Enriched motifs in the promoter
of light-nitrate up-regulated DEGs
(oligo-analyses-RSAT)
TF Id (TAIR) TF Id (RGAP) Motif details TF class TF-binding-sitesRef cccgcc Cgtggc acgtgg cacgtgg
ABFs binding site 58
At1g49720 No ortholog bZIP CACGTGGC − + + +
motif
ABFs binding site
At1g45249 LOC_Os06g10880.1 bZIP CACGTGGC58 − + + +
motif
CBF2 binding site
At4g25470 LOC_Os04g48350.1 AP2-EREBP CCACGTGG59 − − + +
motif
GBF1/2/3 BS in
At4g36730a LOC_Os06g43870.1 bZIP CCACGTGG60 − − + +
ADH1
GBF1/2/3 BS in
At4g01120a No ortholog bZIP CCACGTGG60 − − + +
ADH1
GBF1/2/3 BS in
At2g46270 LOC_Os01g46970.1 bZIP CCACGTGG60 − − + +
ADH1
ABRE binding site
At3g19290a LOC_Os09g28310.1 bZIP (C/T)ACGTGGC61 − + + −
motif
TGA1 binding site
At5g65210a No ortholog bZIP TGACGTGG62 − − + −
motif
E2F-varient binding
At2g36011 No ortholog E2F-DP TCTCCCGCC63 + − − −
site motif
Table 1. Nitrate-responsive transcription factors and their experimentally validated DNA binding sites. Ref
reference. a Nitrate regulated transcription factors in Arabidopsis57.
Figure 7. Prediction of over-represented cis-regulatory motifs in the promoter of nitrate-responsive genes.
Significant enrichment of nitrate-responsive motifs in the promoter region of DEGs was identified using RSAT
plantstool (https://rsat.eead.csic.es/plants/).
networks and nodes were colour coded accordingly. To better understand the PPI networks, sub-clustering of
networks were performed using MCODE plugin in Cytoscape, which yielded only one molecular complex from
light-nitrate network (Fig. S8) and none in the dark-nitrate network. Light-nitrate associated molecular complex
consisted of 3 nodes representing N-metabolic and signaling components viz. NiR, ferredoxin-NADP reductase
(FNR) and ferredoxin (Fig. S8), suggesting the potent role of light in nitrate response. To understand the global
function of PPI networks for differential nitrate responses in light and dark, the DEG-associated interactors
were subjected to GO enrichment analysis using ExPath. It revealed most enriched GO terms for biological
processes in light as signal transduction, regulation of transcription, hormone signaling, response to stress and
Scientific Reports | (2020) 10:12228 | https://doi.org/10.1038/s41598-020-68917-z 10
Vol:.(1234567890)www.nature.com/scientificreports/
Figure 8. Transcriptional regulatory network of nitrate-responsive genes in light and dark. Nitrate-responsive
transcriptional regulatory networks (NTR) in light (A) and dark (B) were generated using known information
in Arabidopsis. NTR networks were constructed in Cytoscape version 3.0.0 (https://cytoscape.org/)67 using rice
orthologs and the expressions of DEGs were mapped onto the networks. The red and purple nodes represent the
up- and down-regulated DEGs and light colour nodes are interactors but not DEGs.
Scientific Reports | (2020) 10:12228 | https://doi.org/10.1038/s41598-020-68917-z 11
Vol.:(0123456789)www.nature.com/scientificreports/
transport among others, whereasin the dark, they were, response to cadmium ion, pentose-phosphate shunt,
glucose metabolic process, immune and hormone responses among others (Table S17). This clearly showed that
nitrate-regulated signaling differs in the leaves of light-grown and etiolated seedlings.
Discussion
To date, a number of N-transcriptomic studies were carried out to identify the number of genes and associated
pathways involved in N-uptake, -signaling, -metabolism and assimilation among others17–24. Light regulation
of nitrate assimilation was studied extensively in etiolated and green plants from the point of view of direct
light signaling through photoreceptors or indirect signaling through C-metabolites. However, to the best of our
knowledge, no study has comprehensively analyzed genome-wide nitrate signaling in light and dark conditions.
Therefore, we exploited the availability of functional genomic tools to analyze the nitrate-responsive transcrip-
tome in etiolated and green leaves of rice, a crop notorious for its poor NUE among cereals. This enabled us
to understand light-dependent and light-independent nitrate responses, visualize the networks of underlying
interactions and identify potential candidates to manipulate N-responses/NUE in rice.
Our experimental design of treating excised leaves by floating them on nitrate solution was aimed at measur-
ing short-term N-response to locally supplied nitrate and to avoid secondary r esponses3, downstream metabo-
lites, or the influence of root-shoot translocation parameters that may respond differently in light and dark29.
These experimental factors can confound the interpretation of results, whereas we obtained consistent results
when cut-leaves were treated with standardized concentrations of nitrate29 as was done in the present case. Our
transcriptome analyses showed very distinctive sets of nitrate responsive genes in etiolated and green leaves,
with only 33 common between them. The common up-regulated genes such as NR, FNR, ENOD20, BTBA4
were involved in N-metabolism while those commonly down-regulated such as peroxidase cysteine-rich repeat
secretory protein 55, go35 NBS-LRR were involved in stresses (Table S9). We found opposite regulation of a
F-box domain containing protein (OsFBX207), which was up-regulated in light but down-regulated in the dark
(Table S9). F-box domain containing proteins are associated with protein degradation and could be one of the
major pathways for adaptive mechanism by regulating unfolded protein response (UPR) signaling, specifically
through endoplasmic reticulum associated degradation (ERAD) pathway in plants. Our pathway analyses as well
as previous transcriptomic s tudy67 have shown that many N-responsive genes are associated with degradation
pathway in plants. This suggests faster turnover of metabolic processes by light-activated degradation pathways,
thus offering new targets to regulate nitrate signaling in the context of damage and repair processes in plants. The
stress-associated genes among the down-regulated DEGs common to light and dark conditions suggest crosstalk
between nitrate and stress, an underexplored area of immense agronomic i mportance26,68.
GO analyses revealed the nitrate-responsive biological processes that are common or specific to light/dark
conditions (Fig. 2, Table S3). N-metabolism, oxidation–reduction and hormone were prominent among the
common biological processes regulated by nitrate in both light and dark conditions. However, processes associ-
ated with leaf phyllotactic patterning were highly enriched in light (Fig. 2, Table S3). In this context, we found
up-regulated expression of APETALA2/ethylene-responsive element binding protein 86 (Os03g0313100) in
light. Its up-regulated expression in leaf primordia is known to promote leaf development in A rabidopsis69,
but its regulation by nitrate/light is a novel finding that links N-nutrition with photomorphogenesis for further
investigation, especially in a crop plant like rice. We found the preponderance of biological processes associated
with sugar metabolic pathways such as pentose-phosphate pathway (PPP) in dark condition (Table S6). The up-
regulation of its rate limiting enzyme glucose-6-phosphate 1-dehydrogenase (Os07g0406300) in the dark in our
study may increase the production of NADPH, the reductant for glutamate synthase70.
To understand the interactions underlying nitrate signaling and N-response, we compared the N-responsive
PPI network in light and dark (Figs. S8, S9). Interestingly, we found that only 39 interactors (~ 8%) were com-
mon, while 376 interactors were exclusive to light and 97 exclusive to dark. This could be a reflection of the
fact that an equally small % of the DEGs are common to nitrate response in dark and light, indicating very
different modes of N-signaling in the two conditions. Importantly, we found significant number of signaling
and hormone-associated pathways in the nitrate-responsive PPI networks in light and dark. These findings are
consistent with the recent finding that manipulation of N-responsive genes results in the change in hormonal
pathways and their crosstalk with those of nitrate71. Similarly, both networks revealed DEGs involved in stress
response, such as the universal stress protein domain containing protein and MYB family transcription factor,
among others. Such crosstalk between nitrate and stress signaling needs further characterization in view of its
immense agronomic i mportance26,68.
Sub-clustering of the PPI networks using MCODE did not reveal any molecular complex in the dark, but
a single molecular complex was identified in light, consisting of NiR, FNR and ferredoxin (Fig. S8). FNR has
been shown to be involved in the regulation of flowering time by modulating the nuclear abundance of blue-
light receptor cryptochrome 1 (CRY1) in a nitrate-dependent manner in Arabidopsis41. Such a phenomenon
is not documented in crop plants and our finding in rice is significant for two reasons: Firstly, it links nitrate
and light signaling and is consistent with our other finding that genes related to N-signaling are enriched in
light. Secondly and more importantly, flowering time is an important phenotypic trait for NUE in rice (Sharma
et al., submitted); its regulation by light offers a crucial meeting point in the mechanism of nitrate response and
therefore a potential target to manipulate NUE. Moreover, flowering time is also an important determinant of
crop duration in rice and we have already shown that long duration rice genotypes tend to have higher NUE15.
An important differentiator of nitrate signaling in light and dark conditions is the differential regulation of
various transporters in this study. Major facilitator superfamily (MFS) transporters were among the most abun-
dant DEGs, though their members were different in light and dark conditions (Table S10). They are involved in
the transport of nitrate, and sugar among others in p lants72. Genes involved in the transport of chloride, amino
Scientific Reports | (2020) 10:12228 | https://doi.org/10.1038/s41598-020-68917-z 12
Vol:.(1234567890)www.nature.com/scientificreports/
acid, potassium, sulfate, and water channel were also up regulated in light (Table S10). It is known that the accu-
mulation of nitrate in the vacuole is regulated by a chloride channel localized in plant vacuolar m embranes73.
Nitrate and light regulation of all these channels may be important for ionic homeostasis of nitrate and other
ions in the cellular pool. This could be a reason for the downregulation of most of the transporters in the dark,
such as zinc transporter, ABC transporters, auxin efflux carrier, phospholipid-transporting ATPase. Their down-
regulation could also be due to less physiological and metabolic activity in dark and the low demand for nutrient
uptake/homeostasis.
Another differentiator of nitrate signaling in light and dark is the differential regulation of transcription
factors (Fig. 6D and S6). This was explored further using transcriptional regulatory networks we constructed,
based on the known information on nitrate-regulatory networks available in Arabidopsis57. The constructed
NTR networks using rice orthologs were similar to Arabidopsis NTR networks as expected, suggesting a core
of nitrate-regulated genes and that their associated connections are highly conserved between rice and Arabi-
dopsis. Mapping the nitrate-responsive gene expression data produced two distinct NTR networks for light and
dark (Fig. 8). Their comparison revealed functional connections between nitrate and light signaling, as evident
from NR, NiR and AP2 family of transcriptional regulators among others (Fig. 8), which function in a primar-
ily light-dependent manner. Those that function in the dark include FNR1, methylase 1, blue micropylar end-3
zinc finger (BME3-ZF).
We predicted different motifs to be enriched in the promoters of DEGs in dark and light (Tables S12–S14),
in view of the previous difficulties in finding nitrate response elements74,75. Some of these predicted motifs in
N-responsive DEGs up-regulated in light are reported to be bound by well-known nitrate-regulated transcription
factors such as TGA1 and GBF1 (Table 1) in A rabidopsis57,76. Identification of reliable motifs for nitrate response
not only provides a handle for transcriptional manipulation of multiple genes for desired N-response/NUE, but
also to construct synthetic promoters for other applications that require an external trigger.
To further characterize interactors of the DEGs identified in PPI and NRT networks, we checked their GO
annotations for their biological process as an indicator of their relevance in N-regulated signaling and found
that many of them are involved in nitrate signaling in rice. Some of them such as brefeldin A-sensitive Golgi
protein-like, DUF581 domain containing protein, inducer of CBF expression 2 are unknown in the context of
nitrate signaling/response and are being reported here for the first time as novel candidates for further valida-
tion in rice and beyond.
In summary, this study clearly demonstrates the substantial differences in the nitrate-responsive transcrip-
tomes in light and dark conditions as well as in their transcriptional and protein networks. This enabled new
insights into nitrate signaling, its cross talk with stress, hormones, developmental pathways and NUE phenotype,
revealing potential targets to manipulate N-response/NUE for further validation.
Methods
Plant material, growth conditions and nitrate treatments. Seeds of rice Oryza sativa ssp. Indica,
genotype Panvel1 were obtained from the Kharland Research Station, Maharashtra, India. Seeds were surface-
sterilized with 70% ethanol and 0.01% Triton-X 100, washed thoroughly and spread in a plastic tray on washed
absorbent cotton presoaked with autoclaved double distilled water. They were grown in a growth chamber for
10 days set at 28 °C, 90 ± 5% relative humidity in total darkness for etiolated plants or under 12/12 photoperiod
with 1 kilo lux white light obtained from W/72 Osrambiolux plus fluorescent tubes. The seedlings were watered
intermittently. Their primary and secondary leaves were excised and floated on potassium nitrate solution
(120 mM) or double distilled water (control) for 90 min. In case of dark experiments, similar treatments were
given to excised leaves in dark condition. The control and nitrate-treated leaves were instantly frozen in liquid
nitrogen and stored at -80 ºC till use.
Measurement of mesocotyl and coleoptile length. Ten days old seedlings grown in light and dark
conditions were kept in horizontal position and digital images were captured. The lengths of mesocotyl and
coleoptile were measured using ImageJ software (https://imagej.nih.gov/ij/download.html). Statistical unpaired
T test analyses were performed in the GraphPad Prism 6 software(https://www.graphpad.com/scientific-softw
are/prism/).
Estimation of chlorophyll content
The chlorophyll content was estimated as described earlier77. Approximately 0.5 g of light-grown or etiolated rice
leaves were homogenized in 10 ml of aqueous 80% ice-cold acetone and centrifuged at 15,000 g (10,000 rpm) for
10 min at 4 °C. The supernatant was retrieved and 0.5 ml of it was mixed with 4.5 ml of aqueous 80% ice-cold
acetone. The absorbance was measured at 663.2 and 646.8 nm and chlorophyll content was calculated using the
formula: Ch-a = 12.25 × A663.2—279 × A646.8; Ch-b = 21.5 × A646.8—5.1 × A663.2. Statistical unpaired T test
analyses were performed in the GraphPad Prism 6 software (https://www.graphpad.com/scientific-software/
prism/).
Nitrate reductase assay. Nitrate reductase assay was performed after 6 h of treatment with potassium
nitrate as described earlier38. Briefly, 100 µl of leaf crude extract was added to the reaction mixture containing
5 mM KNO3 and 5 mM EDTA in 0.1 M sodium phosphate buffer (pH 7.5) in a total reaction volume of 0.4 ml.
The reaction was incubated for 20 min at 25 °C and terminated by adding 0.6 ml of freshly prepared stopping
mixture [1:1 ratio of NED (0.1% w/v) and sulfanilamide (1% w/v in 3 N HCl)]. The pink colour was measured
spectrophotometrically at 540 nm. NR activity was calculated as nmoles of nitrite/mg protein/min with the
help of a standard curve generated using known concentration of nitrite. NR specific activity was expressed as
Scientific Reports | (2020) 10:12228 | https://doi.org/10.1038/s41598-020-68917-z 13
Vol.:(0123456789)www.nature.com/scientificreports/
enzyme activity per mg protein and mean data of three independent experiments with internal triplicates were
used to plot the graph with standard errors.
Total RNA extraction and microarray analysis. Total RNA was isolated from leaves frozen after
90 min of treatment with either water (control) or potassium nitrate (120 mM), using modified hot phenol
method as described78. The RNA pellet was washed with ethanol (70%, 80% and 100%), dried at room tempera-
ture, dissolved in DEPC-treated autoclaved water and frozen at − 20 °C till further use. Microarray experiments
were performed using RNA isolated from two independent biological replicates as flip-dye replicates at Geno-
typic Technology Pvt Ltd, Bengaluru, India. The quality and quantity of total RNA were analyzed using Agilent
Bioanalyzer as per the manufacturer’s protocol.
Microarray data analyses were performed as described earlier79. Labeling was performed using low RNA
Input Fluorescent Linear Amplification Kit (P/N: 5184-3523 Agilent, USA).Total RNA was used to synthesize
the first and second strand cDNA. Reaction mixture containing 500 ng RNA and 1.2 µl of oligo dT-T7 Promoter
Primer in nuclease-free water was incubated at 65 °C for 10 min. Then 4.0 µl of 5 × First strand buffer, 1 µl of
10 mM dNTP mix, 2 µl of 0.1 M DTT, 1 µl of 200 U/µl MMLV-RT, and 0.5 µl of 40U/µl RNaseOUT were added
and incubated at 40 °C for 2 h. After CDNA synthesis, 8 µl of NTP mixture, 2.4 µl of 10 mM Cyanine-5-CTP or
Cyanine-3-CTP (Perkin-Elmer, USA), 6 µl of 0.1 M DTT, 20 µl of 4 × Transcription buffer, 0.6 µl of inorganic
pyrophosphatase, 0.5 µl of RNaseOUT, 0.8 µl of T7 RNA polymerase, and 15.3 µl of nuclease-free water were
added to reaction mixture and incubated at 40 °C for 2 h. Qiagen’sRNeasy mini spin columns were used to purify
the amplified samples. The cRNA quantity and specific activity were determined using NanoDrop ND-1000 (v
3.2.1.) and samples with specific activity > 8 were used for hybridization. Reaction mixture containing 1,650 ng
of each Cyanine labeled cRNA (41.8 µl), 10 × Blocking agent (11 µl) and 25 × Fragmentation buffer (2.2 µl) was
incubated at 60 °C for 30 min in dark. The fragmented cRNA were mixed with 2 × Hybridization Buffer (55 µl)
and resulting 110 µl mixtures was hybridized at 65 °C for 17 h in an Agilent Microarray Hybridization Chamber
with Hybridization Oven. After hybridization, slides were washed with Agilent Gene Expression Wash Buffer
I and incubated them for 1 min at room temperature and 37 °C. Slides were washed again with Wash buffer
II in similar condition, cleaned and dried by rinsing with acetonitrile and then scanned using Agilent scanner
(G2565B) set at 100% laser power. Agilent Feature Extraction software (version 9.1) was used to extract the data,
which was normalized as per the recommended Per Spot and Per Chip protocol. This is a 2-color default nor-
malization, (Per Spot and Per Chip: Intensity dependent (Lowess) normalization) where each raw intensity value
corresponding to the control channel is adjusted using a locally-weighted regression method called Lowess. Each
value in the signal channel was divided by the adjusted control value, resulting in the final normalized value.
The raw data were analyzed using GeneSpring 9 GX software and submitted at NCBI GEO database (Accession
number: GSE12940).
Functional classification of DEGs and pathway analyses. Gene ontology based functional annota-
tions of the DEGs were performed by Expath 2.0 t ool47 using default parameters. We have considered only statis-
tically significant (p value < 0.05) GO terms for further analyses. TreeMap (https://www.treemap.com/) software
was used to graphically represent the GO enrichments obtained from Expath analysis. Expath 2.0 t ool47 was also
used to perform the comparative pathway enrichment analyses of DEGs in light and dark. Mapping of DEGs
onto various biological pathways was done using MapMan version 3.5.1 (https://mapman.gabipd.org/mapma
n-download)48. The fold change value ( log2FC) and corresponding p value were used for significant enrichment
of DEGs associated pathways in PageMan80. Over-represented and under-represented pathways are depicted
with red and blue coloured boxes, respectively.
Subcellular localization of DEGs. To predict the subcellular localization, the amino acid sequences of
DEGs were retrieved from RGAP database (https://rice.plantbiology.msu.edu/) and then analyzed by CELLO
program (https://cello.life.nctu.edu.tw/) using default parameters for eukaryotes. Subcellular predictions were
also made using TargetP 2.0 (https://www.cbs.dtu.dk/services/TargetP/)81.
qPCR validation of differential gene expression. To confirm the expression pattern of the DEGs,
qRT-PCR was performed in three independent biological replicates, with three technical replicates using gene-
specific primers (Table S7). All the primers used in this study were designed using online QuantPrime tool (https
://quantprime.mpimp-golm.mpg.de/?page=about). DEGs were selected based on their up- and down-regulated
expression for described biological pathways. Approximately 2 µg of total RNA isolated from the control and
nitrate-treated leaves was reverse transcribed into cDNA (20 μl volume) using cDNA synthesis kit (GCC Bio-
tech, India). Its amplification reaction was carried out in 10 μl volume containing 1 μl of cDNA, 0.5 μl of forward
and reverse gene specific primers (10 µM) and 5 μl of KAPA SYBR FAST Master Mix (2X) Universal (Kapa
Biosystems, USA). The reactions were performed in Aria Mx real-time PCR system (Agilent, USA). The relative
accumulation of transcripts was analyzed by the comparative C(T) method using actin (BGIOSGA013463) as an
internal control. Melting curve analyses of the amplicons were used to determine the specificity of qPCR reac-
tions. Statistical unpaired T test analyses were performed using GraphPad Prism 6 software (https://www.graph
pad.com/scientific-software/prism/).
Construction of protein–protein interaction networks and detection of molecular com-
plexes. The lists of experimentally validated interacting proteins for the DEGs analyzed in this study were
retrieved from the databases STRING (https://string-db.org/), MCDRP (https://www.genomeindia.org/biocu
ration/), BioGRID (https://thebiogrid.org/) and PRIN (https://bis.zju.edu.cn/prin/). We mapped the DEGs to
Scientific Reports | (2020) 10:12228 | https://doi.org/10.1038/s41598-020-68917-z 14
Vol:.(1234567890)www.nature.com/scientificreports/
the protein–protein interaction (PPI) networks based on experimental score, using Cytoscape version 6.066. To
detect the molecular complexes, we used molecular complex detection (MCODE) plugin in Cytoscape. We also
downloaded all the Arabidopsis orthologs from PlantGDB database (https://www.plantgdb.org/), which were
used to generate and annotate DEGs-associated PPI and nitrate-responsive transcriptional regulatory networks
in rice.
Motif analyses among promoters of nitrate‑responsive genes. One kb promoter regions upstream
of the translational start site of the DEGs were downloaded from RAPDB database (https://rapdb.dna.affrc
.go.jp/tools/dump). The motif discovery oligo analysis tool of Regulatory Sequence Analysis Tools (RSAT)
software82 was used to identify enriched motifs (6–8 bases oligonucleotides) in the promoter sequences using
default parameters. Rice (Oryza sativa IRGSP-1.0.42) whole genome was used as the background and motifs
were predicted in both the DNA strands.
Data availability
GEO accession number: GSE12940.
Received: 9 December 2019; Accepted: 30 June 2020
References
1. Sutton, M. et al. The nitrogen fix: from nitrogen cycle pollution to nitrogen circular economy-frontiers 2018/19: emerging issues
of environmental concern chapter 4. Frontiers 2018/19: Emerging Issues of Environmental Concern (2019).
2. Abrol, Y. P. et al. in The Indian nitrogen assessment: Sources of reactive nitrogen, environmental and climate effects, management
options, and policies (Elsevier, 2017).
3. Wang, R. et al. Genomic analysis of the nitrate response using a nitrate reductase-null mutant of Arabidopsis. Plant Physiol. 136,
2512–2522 (2004).
4. Pathak, R. R., Ahmad, A., Lochab, S. & Raghuram, N. Molecular physiology of plant nitrogen use efficiency and biotechnological
options for its enhancement. Curr. Sci. 1, 1394–1403 (2008).
5. O’Brien, J. A. et al. Nitrate transport, sensing, and responses in plants. Mol. Plant. 9, 837–856 (2016).
6. Li, H., Hu, B. & Chu, C. Nitrogen use efficiency in crops: lessons from Arabidopsis and rice. J. Exp. Bot. 68, 2477–2488 (2017).
7. Mandal, V. K., Sharma, N. & Raghuram, N. Molecular targets for improvement of crop nitrogen use efficiency: Current and emerg-
ing options. In Engineering Nitrogen Utilization in Crop Plants 77–93 (Springer, 2018).
8. Wang, Y. Y., Cheng, Y. H., Chen, K. E. & Tsay, Y. F. Nitrate Transport, Signaling, and Use Efficiency. Annu. Rev. Plant. Biol. 69,
85–122 (2018).
9. Zhao, L., Liu, F., Crawford, N. M. & Wang, Y. Molecular regulation of nitrate responses in plants. Int. J. Mol. Sci. 19, 1. https://doi.
org/10.3390/ijms19072039 (2018).
10. Raghuram, N. & Sharma, N. Improving Crop Nitrogen Use Efficiency. In Comprehensive Biotechnology, Vol. 4, Moo-Young, M.,
Ed., 211–220 (Elsevier: Pergamon, 2019)
11. Vega, A., O’Brien, J. A. & Gutierrez, R. A. Nitrate and hormonal signaling crosstalk for plant growth and development. Curr. Opin.
Plant Biol. 52, 155–163 (2019).
12. Vidal, E. A. et al. Nitrate 2020: Thirty years from transport to signaling networks. Plant Cell (2020).
13. Jia, Z. & Wiren, N. V. Signaling pathways underlying nitrogen-dependent changes in root system architecture: from model to crop
species (J. Exp, Bot, 2020).
14. Plett, D. C. et al. The intersection of nitrogen nutrition and water use in plants: new paths toward improved crop productivity (J. Exp,
Bot, 2020).
15. Sharma, N. et al. Phenotyping for nitrogen use efficiency: rice genotypes differ in N-responsive germination, oxygen consumption,
seed urease activities, root growth, crop duration, and yield at low N. Front. Plant. Sci. 9, 1452 (2018).
16. Menz, J., Li, Z., Schulze, W. X. & Ludewig, U. Early nitrogen-deprivation responses in Arabidopsis roots reveal distinct differences
on transcriptome and (phospho-) proteome levels between nitrate and ammonium nutrition. Plant J. 88, 717–734 (2016).
17. Vidal, E. A. et al. Integrated RNA-seq and sRNA-seq analysis identifies novel nitrate-responsive genes in Arabidopsis thaliana
roots. BMC Genomics 14, 701 (2013).
18. Coneva, V. et al. Metabolic and co-expression network-based analyses associated with nitrate response in rice. BMC Genomics 15,
1056 (2014).
19. Yang, S. Y. et al. RNA-Seq analysis of differentially expressed genes in rice under varied nitrogen supplies. Gene 555, 305–317
(2015).
20. Reddy, M. M. & Ulaganathan, K. RNA-Seq analysis of urea nutrition responsive transcriptome of Oryza sativa elite Indica cultivar
RP Bio 226. Genom. Data 6, 112–113 (2015).
21. Chandran, A. K. et al. Genome-wide transcriptome analysis of expression in rice seedling roots in response to supplemental
nitrogen. J. Plant Physiol. 200, 62–75 (2016).
22. Sun, L., Di, D., Li, G., Kronzucker, H. J. & Shi, W. Spatio-temporal dynamics in global rice gene expression (Oryza sativa L.) in
response to high ammonium stress. J. Plant Physiol. 212, 94–104 (2017).
23. Sinha, S. K. et al. Transcriptome analysis of two rice varieties contrasting for nitrogen use efficiency under chronic N starvation
reveals differences in chloroplast and starch metabolism-related genes. Genes (Basel) 9, 1. https://doi.org/10.3390/genes9040206
(2018).
24. Zanin, L. et al. Transcriptomic analysis highlights reciprocal interactions of urea and nitrate for nitrogen acquisition by maize
roots. Plant Cell Physiol. 56, 532–548 (2015).
25. Chakraborty, N. & Raghuram, N. Nitrate sensing and signaling in genomewide plant N response. in Nitrogen Use Efficiency in
Plants, V.Jain, P.Anandakumar (eds) New India Publishing Agency, New Delhi, 45–62 (2011).
26. Jangam, A.P. & Raghuram, N. Nitrogen and stress. In Elucidation of Abiotic Stress Signaling in Plants Vol. 2, Pandey G.K. (Ed)
323–339 (Springer, 2015).
27. Sun, H. et al. Heterotrimeric G proteins regulate nitrogen-use efficiency in rice. Nat. Genet. 46, 652–656 (2014).
28. Liang, Y., Zhao, X., Jones, A. M. & Gao, Y. G proteins sculp root architecture in response to nitrogen in rice and Arabidopsis. Plant
Sci. 274, 129–136 (2018).
29. Raghuram, N. & Sopory, S. K. Roles of nitrate, nitrite and ammonium ion in phytochrome regulation of nitrate reductase gene
expression in maize. Biochem. Mol. Biol. Int. (IUBMB Life) 47, 239–249 (1999).
30. Raghuram, N., Chandok, M. R. & Sopory, S. K. Light regulation of nitrate reductase gene expression in maize involves a G-protein.
Mol. Cell Biol. Res. Commun. 2, 86–90 (1999).
Scientific Reports | (2020) 10:12228 | https://doi.org/10.1038/s41598-020-68917-z 15
Vol.:(0123456789)You can also read