Network Level Footprints of Facebook Applications
←
→
Page content transcription
If your browser does not render page correctly, please read the page content below
Network Level Footprints of Facebook Applications

       Atif Nazir1,* , Saqib Raza1,* , Dhruv Gupta1,* , Chen-Nee Chuah1,* , Balachander Krishnamurthy2,+
                                                   1
                                                    University of California–Davis, CA USA
                                                       2
                                                         AT&T Labs–Research, NJ USA
                                                 *
                                                   {anazir, sraza, dgupta, chuah}@ucdavis.edu
                                                             +
                                                               bala@research.att.com

ABSTRACT                                                                             1.   INTRODUCTION
With over half a billion users, Online Social Networks (OSNs) are                       Online social networking sites command over half a billion users.
the major new applications on the Internet. Little information is                    Sites such as Facebook, LinkedIn, MySpace, Flickr, and Twitter al-
available on the network impact of OSNs, although there is every                     low users to seek out friends and interact with them in different
expectation that the volume and diversity of traffic due to OSNs is                  ways. Besides providing basic communication capabilities (email,
set to explode. In this paper, we examine the specific role played by                instant messaging, and bulletin board writing), some sites also pro-
a key component of OSNs: the extremely popular and widespread                        vide other genre of applications such as sharing documents, send-
set of third-party applications on some of the most popular OSNs.                    ing virtual gifts, or gaming. The type and number of applications
With over 81,000 third-party applications on Facebook alone, their                   became unbounded, as popular sites such as Facebook and MyS-
impact is hard to predict and even harder to study.                                  pace opened up their Developer Platforms, allowing external devel-
   We have developed and launched a number of Facebook appli-                        opers to create and launch their own applications. Facebook alone
cations, all of which are among the most popular applications on                     has over 81,000 third-party applications [13].
Facebook in active use by several million users monthly. Through                        The open-API model on OSN sites, and the increasing popular-
our applications, we are able to gather, analyze, correlate, and re-                 ity of these third-party applications, can have a profound impact
port their workload characteristics and performance from the per-                    on the Internet. OSNs act as distribution platforms that re-direct
spective of the application servers. Coupled with PlanetLab exper-                   traffic between their users and third-party application servers. Each
iments, where active probes are sent through Facebook to access a                    application generates additional traffic between existing users and
set of diverse applications, we are able to study how Facebook for-                  increases workload flowing through the associated OSNs. This may
warding/processing of requests/responses impacts the overall de-                     be compounded by potential upsurge in the number of new users,
lay performance perceived by end-users. These insights help pro-                     contributing to a spiral growth. Facebook’s site traffic increased by
vide guidelines for OSNs and application developers. We have also                    30% in the week following the launch of its developer platform [9],
made the data studied here publicly available to the research com-                   while Twitter observed traffic increase by a factor of twenty after
munity. This is the first and only known study of popular third-                     opening up its API [6]. Although OSN traffic volume in bytes is
party applications on OSNs at this depth.                                            still relatively small compared to P2P networks, new OSN applica-
                                                                                     tions that allow uploading of videos would easily change the Inter-
Categories and Subject Descriptors                                                   net traffic landscape again. These factors pose new challenges in
                                                                                     managing traffic growth from a network infrastructure perspective,
C.2.0 [Computer - Communication Networks]: General; H.4.3 [In-                       especially considering server costs are a major source of headache
formation Systems Applications]: Communications Applications                         for large social sites such as Facebook1 . A better understanding of
                                                                                     OSN applications as a new workload is thus critical and overdue.
General Terms                                                                           Last year, we studied application-level user behavior on third-
                                                                                     party applications and their users on Facebook [8]. This paper
Measurement
                                                                                     focuses exclusively on the network-level effects of popular third-
                                                                                     party applications on Facebook, which has over 150 million monthly
Keywords                                                                             active users (MAU)2 , and is thus an ideal candidate for just such a
Online Social Networks, Social Games, Facebook, Applications,                        study. We perform a comprehensive measurement study from the
Platform, Delays                                                                     perspective of third-party applications—an unstudied, interesting,
                                                                                     rapidly growing, and diverse part of the OSN landscape. We shed
                                                                                     light on the components of interactions between OSN users and
                                                                                     third-party applications through the OSN platform, which is treated
                                                                                     as a black box due to the lack of access to proprietary information
Permission to make digital or hard copies of all or part of this work for
                                                                                     about their internal design details. The key performance metric is
personal or classroom use is granted without fee provided that copies are            end-to-end delay perceived by users, which depends on three main
not made or distributed for profit or commercial advantage and that copies           components: (a) the geographical distribution of users and their ac-
bear this notice and the full citation on the first page. To copy otherwise, to
republish, to post on servers or to redistribute to lists, requires prior specific   1
permission and/or a fee.                                                               http://gigaom.com/2008/05/11/the-rising-cost-of-facebook-
IMC’09, November 4–6, 2009, Chicago, Illinois, USA.                                  infrastructure/
                                                                                     2
Copyright 2009 ACM 978-1-60558-770-7/09/11 ...$10.00.                                  http://www.insidefacebook.com/2009/01/23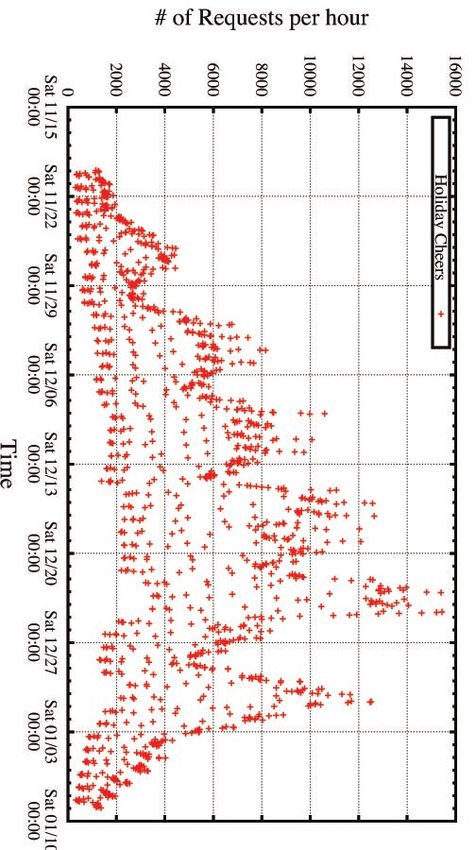
OSN
esis about various provisioning strategies at Facebook and applica-
Internal
2a*. Store/Retrieve tion servers. In particular, we address the following questions:
gi n OSN Application
1.
Lo
ut/O
utp
ut
ve 3b*. Store/Retrieve • Do external developers of popular and viral applications need
Inp etrie
2* . re/R
3b*
. Sto exorbitantly high resources to serve content to users? While on-
ve
ie
OSN Database
server processing requirements may vary for different applications,
etr
3*. Input/Output Third Party
e/R
OSN Application 3a*. Store/Retrieve
4. Log
or
out
we report our findings with regards to other constituents of delays
St
Third Party OSN
.
#a
User
Application Server(s)
#. In
p ut/O
utpu
at application servers. For example, request queuing delays are
t
External small and stable, response sizes do not vary across time-of-day, etc.
Application
For our applications, even non-exorbitant resources are sufficient to
support viral application growth.
Figure 1: An OSN framework illustrating interactions between • How much do Facebook request forwarding and response pro-
users, OSN, and external as well as third-party applications. cessing delays affect user experience? How is this overhead af-
fected by the type and size of user content? We found that Face-
cess speeds, (b) processing speed and overhead of OSNs, and (c)
book processing contributes a significant portion of the overall de-
bandwidth and processing speed of application servers. One open
lay experienced by a typical user accessing third-party applications,
question we seek to answer is whether the overheads incurred by
ranging from 44.4% of 1.7s total delay in case of a less-popular ap-
Facebook and application developers constitute a significant por-
plication to 68.8% of 2.21s total delay for the most popular one
tion of the end-to-end delays. The answer is needed by both Face-
that we study. We measured how this overhead varies with dif-
book and application developers for design decisions (e.g., provi-
ferent type and amount of content that needs to be rendered using
sioning strategies), given that their main revenue source is adver-
PlanetLab experiments. For example, the presence of Javascript in
tisements, which are added into the pages rendered to users, intro-
application responses adds substantial delay as Facebook performs
ducing further overheads.
additional checks to filter malicious content.
We use an integrated measurement methodology, which com-
• What are the possible provisioning strategies at OSNs like
bines active tracing from client side with passive measurements at
Facebook? Does Facebook segregate user data according to user
application servers, to infer interactions through Facebook and esti-
characteristics such as country, network or number of friends? Does
mate various network-level as well as data processing and queuing
it provision resources differently for third-party applications, or
delays in user-application interactions. Designing such a measure-
differentiate user requests based on properties such as geographi-
ment study is a challenging task: unlike the typical run-of-the-mill
cal locations? Given the vast amount of resources at Facebook, and
client-server interaction study on the Web, this involves correlating
especially due to the extensive use of caching, our results showed
observations at multiple intermediary components. To better ap-
that Facebook serves user requests generally without preferential
preciate the complexity and challenges involved, consider the OSN
treatment (even by locality of request origin).
framework shown in Figure 1. There are three main players: the
Based on our study, we conclude that Facebook is well provi-
client, the OSN, and the third-party application server. The client
sioned, even for viral applications. However, significant impact ex-
can be an OSN user anywhere on the globe, with varying access
ists on user experiences due to geographical location, which can be
speed and browser rendering capabilities. The OSN may serve the
resolved by either locating the data center and application servers
client’s requests from a server farm or CDNs. The third-party ap-
closer to users, and/or avoiding frequent setup and tear down of
plication servers are also geographically distributed with different
HTTP connections that incurs multiple long RTTs. The technical
server capabilities. No single entity controls how users running
accuracy of this paper has been verified through high-ranking mem-
an OSN application are served. This makes predictions of perfor-
bers of the Facebook Platform team through private conversations,
mance impact very difficult.
and recent actions by the same team serve as a public acknowl-
Our first contribution is a detailed and thorough measurement
edgement of the issues highlighted in this paper3 . We also provide
methodology that encompasses all angles, by collecting data at the
insights aimed to improve resource utilization for application de-
application server, and by sending probes through an OSN from
velopers, and have made the data studied here publicly available to
numerous vantage points (synthetic clients). We exploit the Face-
the research community4 .
book open developer platform by becoming one of the players and
The rest of the paper is structured as follows. Section 2 out-
launching a set of third-party applications. We managed to amass
lines related work, and Section 3 describes the Facebook developer
a considerable user-base for all of the applications we launched, of
platform architecture and a typical session invoking third-party ap-
which three applications have achieved more than 1 million MAU
plications. The proposed measurement methodology is described
at the time of this study, which the other three achieved between 10
in Section 4. In Section 5, we present the characteristics of the
thousand to 500 thousand MAU. To provide a reference point, we
workload from the perspective of the application server and analyze
characterize how our applications are similar to or different from
how load impacts the queuing/processing delays. In Section 6, we
the 200 most used Facebook applications. We analyze network
analyze delay perceived by Facebook clients based on PlanetLab
traces, as well as application server logs, which are then correlated
experiments and infer the Facebook forwarding/processing delays.
to perform self-validations of phenomena observed at application
Section 7 discusses lessons learnt from our measurement study and
servers. We also conduct a large number of experiments using Plan-
implications of our findings on third-party application design and
etLab nodes to model the popular usage cases (as observed in our
for Facebook. Section 8 concludes the paper.
traces), as well as hypothetical scenarios, where users request con-
tent with varying properties. Our comprehensive data allows us
to make inferences on the dynamic interactions between users and 2. RELATED WORK
Facebook through the third-party applications. Online social networks have become increasingly popular over
The second contribution of the paper is the characterization of the last few years. Accordingly, there has also been an increase in
various delays involved in user and Facebook third-party applica-
3
tion interactions—the first-of-its-kind large-scale study. We demon- http://developers.facebook.com/news.php?blog=1story=222
4
strate how the proposed methodology allows us to test our hypoth- http://www.ece.ucdavis.edu/rubinet/data.html
research on analysis of OSNs. While some researchers have fo-                   Client                      OSN Server                APP Server
cused on graph theoretic properties of social networks [4,7,8], oth-
ers have analyzed the usage patterns of individual networks [1, 3].        t1            Page Vie
                                                                                                 w   Request
                                                                                                             Sent
Another recent work [8] focused on the graph theoretic properties          t2
                                                                                                                       Page Vie               OSN Request
of large OSNs such as YouTube, Flickr, and Orkut. Some works                                                                   w Req          Forwarding Delay (df)
                                                                           t3                                             Forward uest
have also focused on privacy and security in OSNs [5].                                                                            ed

   Retention of users and virality are crucial to growth and survival      t4                                                                 App. Server Request
                                                                                                                                              Queuing Delay (dq)
of large online social networks, and consequently there has been           t5                                                                 App. Server Request
great momentum towards social third-party applications. Facebook           t6                                                     onse Sen
                                                                                                                                          t   Processing Delay (dp)
                                                                                                                            w Resp
pioneered this space by opening its Platform to third-party develop-                                                Page Vie
                                                                           t7                                                                 OSN Response
ers for on-site applications, and has most recently expanded itself                                     onse
                                                                                                 w Resp                                       Processing Delay (dg)
                                                                           t8            Page Vie     d
to mobile platforms such as the iPhone through Facebook Connect.                              Forwarde

It was imperative, then, that several recent studies focused on one        t9
particular OSN, namely Facebook.
   A newly published study on characterization of Facebook appli-          Figure 2: Sequence of interactions between Client-OSN-
cations [2] uses profile crawling to explore the high-level character-     Application, along with delays incurred at each step.
istics of application users on Facebook, as well as growth patterns                dp is delay incurred in executing database queries to gener-
of applications using publicly available usage statistics from Ado-                ate dynamic HTML content. Also, note that while dq may
nomics. Another important study [3] on messaging activity inside                   decrease with an increase in number of web servers, dp will
Facebook highlights Facebook-specific characteristics such as reg-                 remain unaffected.
ularities in daily and weekly traffic, and its relation to the use of
Facebook by a select demographic (college students).                            The OSN server delays include the following:
   We previously studied a number of user behavior-related mea-
surements on three of our highly popular gaming and non-gaming                  1. OSN Server Request Forwarding Delay (df = t3 − t2 ): df
Facebook third-party applications [9]. In particular, we empha-                    is the amount of time the OSN server takes to pre-process
sized the distinction between user behavior on gaming versus non-                  the request received from the user and convert it to be for-
gaming applications.                                                               warded to the application server. The OSN server will typi-
   Note that all known previous works that analyze OSN-based ap-                   cally process a request to add user-related information to it.
plications (especially [9]) have mainly focused on studying user                   For instance, Facebook includes a list of IDs for the user’s
behavior and traffic patterns. We go one step beyond these existing                friends in the forwarded request. The OSN server may also
studies by analyzing activity data from several third-party applica-               perform certain bookkeeping tasks and security checks. We,
tions on Facebook that we have access to. Given the increasing                     however, are not privy to all the tasks undertaken before a
popularity of OSN applications, it is crucial to understand their im-              request is forwarded by an OSN.
pact on the current Internet. We believe that this work is a first at-
tempt to measure and characterize this new Internet workload, and               2. OSN Server Response Processing Delay (dg = t8 − t7 ): dg
the components of interactions between users and these third-party                 is the amount of time the OSN server takes to post-process
applications. We focus on investigating factors that impact end-                   a response sent by the application server and convert it to a
user experience, thus providing insights to third-party application                response that can be forwarded to the user. A response for-
developers and OSNs.                                                               warded by the application server typically has placeholders
                                                                                   for content that the OSN server populates by retrieving in-
                                                                                   formation from the OSN database. As for df , dg is likely to
3.     OSN APPLICATION FRAMEWORK                                                   include time taken for additional bookkeeping and security
   The OSN application framework is depicted in Figure 1, show-                    tasks that we are not privy to.
ing the three different types of applications, i.e., internal, external,
and third-party applications. Third-party applications are charac-            The delay components t2 − t1 , t4 − t3 , t7 − t6 , and t9 − t8 rep-
terized by the presence of the OSN server as an intermediary for           resent connection setup overheads, and network transmission and
all communication (shown by the solid lines in Figure 1) between           propagation delays for interactions between the user, OSN server,
the client and the application server. A client forwards a request to      and the application server.
the OSN server, which forwards it to the application server. The
application server then sends the response back to the OSN server,         4.      MEASUREMENT METHODOLOGY
which then relays to the client. The focus of our paper is to investi-
gate network level effects of such third-party applications.                  Section 1 discussed the need for data from multiple vantage points
   The sequence of interactions in a typical user session is shown in      to study them, while Section 3 discussed the different intermediate
Figure 2. In addition to the network transmission and propagation          stages of interaction between a client and a third-party OSN ap-
delays, there are two major categories of delays: a) those seen at         plication. We developed and launched a set of third party appli-
the application server, and b) those seen at the OSN server.               cations on Facebook (Section 4.1), and carried out extensive pas-
   The application server delays consist of two components:                sive and active measurements using these applications. Section 4.2
                                                                           describes the information extracted from the network traces and
     1. App. Server Request Queuing Delay (dq = t5 − t4 ): dq is           application-layer logs collected at the application servers. We also
        the amount of time a request is queued at the network layer        designed and implemented several PlanetLab experiments to col-
        before being passed to the application layer for processing.       lect data from the clients’ perspective (Section 4.3).
     2. App. Server Request Processing Delay (dp = t6 − t5 ): dp is
        the amount of time the application server takes to generate
        a response for a request. Typically, a major constituent of
4.1 Selected Third Party Applications 24000
Application layer (PV only)
Network Layer (PV only)
5
We launched six Facebook applications that achieved varying 20000
Network layer (all)
# of Requests per hour
popularity and maturity (i.e., duration of deployment and user base).
These include Hugged, iSmile, and My Angels that allow friends 16000
to exchange virtual hugs, smiles, or angels, respectively; as well
12000
as Holiday Cheers (users can send virtual seasonal greetings to
friends), Pound Puppies (lets users adopt virtual pets), and The 8000
Streets (similar to Fighters’ Club [9], where users pick fights with
other users). 4000
Table 1 reports the average number of daily active users (DAU),
0
monthly active users (MAU), and the rank of the six applications Sat 11/22 Sun 11/23 Mon 11/24 Tue 11/25 Wed 11/26 Thu 11/27 Fri 11/28
00:00 00:00 00:00 00:00 00:00 00:00 00:00
Sat 11/29 Sun 11/30
00:00 00:00
among Facebook third-party applications [10]. All six applica- Time
tions are in the top 5% of Facebook applications (ranked by DAU),
with Hugged, iSmile, and Holiday Cheers placed in the top 100 Figure 3: Total and PV requests (per hour) for Hugged.
(out of over 57,000 applications). Hugged is both the most popu- Network- and application-layer logs conform.
lar and the longest deployed, followed by iSmile. Holiday Cheers OSN and generate corresponding responses, thereby providing good
was launched half a month before Thanksgiving, and was tailored vantage points for passive measurements. In our case, there are
specifically towards the upcoming holiday season to achieve ‘viral’ three categories of requests that are forwarded by the Facebook
growth. It attracted more than 1.4 million users in less than two server: (1) Page View requests (PV)—regular requests from clients
months. The Streets and Pound Puppies grew much slower as can that have installed the application, (2) Not Installed requests (NI)—
be seen by their metrics. requests from clients that have not yet installed the application
To gauge the extent our applications are representative of other (these are redirected to an installation page for the application), and
widely used third-party applications, we installed and manually ex- (3) Inline requests (IR)—AJAX-based queries for rendering con-
plored workflows involved in interaction with the 200 most used tent within the HTML pages.
Facebook applications over a period of two weeks from Jan 10 to We have access to both network and application-layer traces gath-
Jan 24, 2009. Our findings regarding how our six applications com- ered at the application server. Results presented here are based on
pare to the 200 most used Facebook applications along several di- traces for the period from Nov 18, 2008 to Jan 05, 2009 for Hugged,
mensions are: Holiday Cheers, and The Streets. The network layer traces log all
Application semantics: The decision to limit an application’s users’ request and response packets using tcpdump. The payload informa-
interactions to their friends or non-friends impacts its virality as tion contains fields specifying the ID of the request, the ID of the
well as user engagement. We refer to the type of interactions al- client from which the request originated, and the type (PV/NI/IR)
lowed on an application as its semantics. In this regard, Hugged, of the request. The tcpdump logs have a time stamp (t4 in Fig-
iSmile, My Angels, and Holiday Cheers are similar to 61% of the ure 2) for each request that records when a request is completely
top 200 applications in that they only allow users to interact with received at the network layer. Less than 2.2% of all requests in our
their Facebook friends, while The Streets and Pound Puppies (like network layer traces for Hugged, Holiday Cheers, and The Streets,
the remaining 39%) do not impose such a restriction. are IR requests. The fraction of NI requests depends upon how fast
Delay requirements: Lower delays in rendering responses are cru- an application grows. NI requests form 7.9% of all Hugged re-
cial to enhanced user experience on social (web) applications. How- quests, and 28.1% of the rapidly growing Holiday Cheers requests.
ever, lower delays might mean higher required processing power An NI request is re-directed to a Facebook application installation
for popular applications. We find that a majority (70%) of the top page, and does not involve database access or significant process-
200 applications utilize the Facebook canvas design (as do these ing at application servers. Thus, in order to minimize processing
six). The canvas design requires application responses to be ren- overhead, the application servers record information only for PV
dered by the Facebook server, and mandates that application servers requests, which constitute most of the workload. The application
respond to a forwarded request within 8 seconds. The rest of the layer traces record time stamps when the server starts to process a
applications are delay insensitive. user request, and when the response is written to the TCP socket.
Engagement ratio: The last column of Table 1 (ratio of DAU These serve as estimates of t5 and t6 in Figure 2, respectively.
to MAU) shows the engagement ratio—an indicator of how many For validation, we analyze the request arrival patterns observed
users are returning users. The engagement ratio represents an ap- at both network and application layers. Figure 3 shows the total
plication’s overall ‘demand’ by its users. A higher value implies number of requests seen at the network layer, and the number of PV
more application visits per user. This ratio is high for The Streets request arrivals at both network and application layers, for Hugged.
and Pound Puppies as these are point-based games that require mul- More than 89% of the total request arrivals are of type PV. Ideally,
tiple visits for users to increase their scores. By clustering the top the number of PV requests seen at both layers should be identi-
200 applications according to their engagement ratio, we found that cal. However, we see slight discrepancy due to (1) tcpdump failing
Hugged, Holiday Cheers, and iSmile are similar to 31.6%, The to log a fraction (around 8.3%)6 of arriving requests during high
Streets and Pound Puppies are similar to 19.2%, and My Angels is load periods (confirmed by PV requests seen at application-layer
similar to 13.5%, of all applications. but not in tcpdump logs), and (2) a fraction of requests (around
Hence, our six applications represent a diverse mix that is fairly 2.6%) are dropped before being processed by the application layer,
representative of top Facebook applications. which also coincides with high load periods. We, therefore, focus
on the application-layer PV request arrivals, which give a more ac-
4.2 Passive Measurements curate representation of the application server workload.
The application servers receive user requests forwarded by the
6
This is due to tcpdump’s sampling of logged packets, and does not
5
All were developed using Ruby on Rails. indicate dropped packets.Application Launch Date Avg. DAU Avg. MAU Rank DAU/MAU
Hugged Feb 2008 131,292 2.3M 50 0.057
iSmile Aug 2008 120,361 2.4M 65 0.05
Holiday Cheers Nov 2008 75,283 1.1M 97 0.068
My Angels Aug 2008 14,016 370K 339 0.038
Pound Puppies Jun 2008 1,545 14K 1,368 0.11
The Streets Nov 2008 1,232 12.5K 1,520 0.099
Table 1: Application Usage Statistics. The average DAU and MAU statistics were calculated from Dec 20 to Jan 24. Application
ranks show how popular the six applications are among 81,000+ Facebook third-party applications.
In addition to the PV requests initiated by clients, the application Our goal was to quantify these delays for the different experiments.
server can make certain API calls to the OSN server (see Figure 1, To measure the effect of df , we vary Sclient−req from 0 Kb
3b*). Even though these API calls are not tightly synchronized with to 50 Kb in our experiments. We achieve this by appending ran-
client requests, they do impact the overall user-OSN experience. dom characters into a single junk parameter with the HTTP GET
An example of such an API call is a request to update a client’s request. The application response to this experiment is simply a
newsfeed based upon recent activity. Our application-layer traces blank page (i.e., Sapp−resp = 0 Kb7 ).
log the total duration between making an API call and receiving a Our experiments for measuring dg keep Sclient−req = 0 Kb
response, the sizes of the API call request, and the call response. (i.e., excluding the experiment’s ID, which is appended to the re-
quested URL), while Sapp−resp and the application response con-
4.3 Active Tracing using PlanetLab tent vary. The response content and size will determine dg . The
In order to collect data from multiple vantage points, we conduct response content for different experiments may be:
a large number of experiments using PlanetLab (PL) nodes spread • Non-User-Related: The response content either has random
across the globe. We use these nodes to send active probes (in the HTML content or Javascript. Content may also be OSN-specific
form of synthetic requests), via the OSN, to various application tags or placeholders that target non-user OSN entities, such as Face-
servers. We model various characteristics of user PV requests to book networks. For example, a Facebook network tag targeting a
understand how they affect OSN request forwarding and response certain network ID, is replaced with the target ID’s Facebook net-
processing delays. work name during Response Processing at the OSN.
To diversify user locations in our experiments, we selected two • User-Related: The response content will contain different types
PL nodes across 32 different countries, each in a different insti- of OSN-specific tags targeting OSN users. For our experiments,
tution when possible. We launched a set of experiments on every these tags may be of the following types: (1) FBML name tags that
node, twice a day (10AM and 10PM), from Dec 27, 2008 to Jan 27, fetch target users’ real names, (2) FBML profile picture tags that
2009. We used 3 different Facebook user accounts, User X, User Y, fetch target users’ profile picture URLs, (3) FBML user status tags
and User Z, having 39, 4, and 208 Facebook friends, respectively. that display target users’ Facebook status messages.
Based on sampled friend-list sizes of users accessing our six ap- We diversify the User-Related content experiments by targeting
plications, we estimate that the average number of friends per user users with differing characteristics, such as different number of
on Facebook is around 35, with a standard deviation of 65. Hence, OSN friends (popularity), network memberships, and geographi-
User X represents the average Facebook user, while users Y and Z cal locations. Furthermore, since many large Web sites cache re-
represent users with very low and significantly above average num- sponses, our experiments randomly select target OSN entities from
ber of friends, respectively. From these accounts, we accessed all pools of thousands of IDs, gathered at the application servers. We
the six Facebook applications described in Section 4.1. also repeat our experiments (with exactly the same application re-
We launched our experiments with the intention to answer ques- sponses) to gauge the effect of caching more accurately.
tions listed in Section 1. For each of these concerns, we conducted Since PL nodes run on virtual machines, updating hardware clocks
a set of experiments (coded in Java), which can be described on a for synchronization with NTP was not possible. This meant df and
high level as follows: dg could not be decoupled cleanly through one-way communica-
1: A client sends an HTTP GET request to the OSN for a given tion delays; we had to rely on round-trip delays. Calculating df
application, with a parameter specifying an experiment ID. The and dg requires elimination of the various network (propagation
client logs the time stamp of request departure (Tdep ) from the PL and transmission) delays associated with each user-to-third-party-
node and request size (Sclient−req ). application interaction. Propagation delays between two hosts are
2: The given application’s server receives the user request (for- measured using ping8 . Transmission delays are estimated using the
warded by the OSN) and logs the arrival time stamp. CapProbe utility [12] that approximates bandwidth by employing
3: The application server responds with content specific to the ping to send/receive specific-sized packets (1,000 packets of 1,450
experiment ID, along with the response size (Sapp−resp ), the re- bytes each) to/from the target host. We use these approximations9
quest arrival, and departure time stamps. to calculate df and dg . Note that PL nodes are not repreentative
4: The client receives the response (forwarded by the OSN), and of all OSN clients, since end-users may have a variety of connec-
notes the time stamp of request arrival (Tarr ) at the PL node, as tion speeds and a richer diversity of geographic locations than PL
well as the response size (Sosn−resp ). 7
Excluding the value for Rapp−resp , which is reported back to the
A client is one of the PL nodes logged into the OSN as one of client for calculation of df and dg .
our users, and the application is one of our six applications. As 8
Most countries only have two PL nodes. This limits our ability to
shown in Figure 2, any interaction between a user and a third-party estimate propagation delays for different geographical locations.
application is subject to a certain OSN Request Forwarding Delay 9
CPU load on PL nodes vary considerably, impairing CapProbe’s
(df ) and a Response Processing Delay (dg ). We expected these accuracy. However, we verified CapProbe’s results to be within 5-
delays to vary with Sclient−req , Sapp−resp , and response content. 10kbps of actual average data transfer rates observed on the nodes.nodes. However, PL nodes provide the best estimate available to us
at this time.
The following two sections report our results and findings from
measurements at the application servers (Section 5) and PL nodes
(Section 6).
5. OBSERVATIONS AND INFERENCES AT
APPLICATION SERVERS
As outlined in Section 3, the client-OSN interaction process faces
two types of delays at third-party application servers: request queu-
ing delay (dq ) and request processing delay (dp ). Hence, we ex-
pect resource provisioning at application servers to have an impact
on the overall experience of an OSN user. From the application
developer’s perspective, one important question is: Are exorbi-
tantly high resources needed to ensure satisfactory user experi-
ence (e.g., low latency) in case of popular and viral applications?
To answer this question, we need to understand the workload
characteristics (such as request arrival patterns and response sizes),
as seen by the application servers, and how they impact dq and dp .
Furthermore, we need to analyze the delays involved when applica-
tion servers interact with OSN servers through API calls (described
in Section 4.2). In this section, we summarize the key observa-
tions and the corresponding analysis of our data. We present results
based on our two most popular applications: Hugged and Holiday
Cheers, and the least popular application, The Streets. As we estab-
lished in Section 4.1, these applications are fairly representative of
top Facebook applications, and our findings from these applications
are therefore relevant to third-party applications on Facebook.
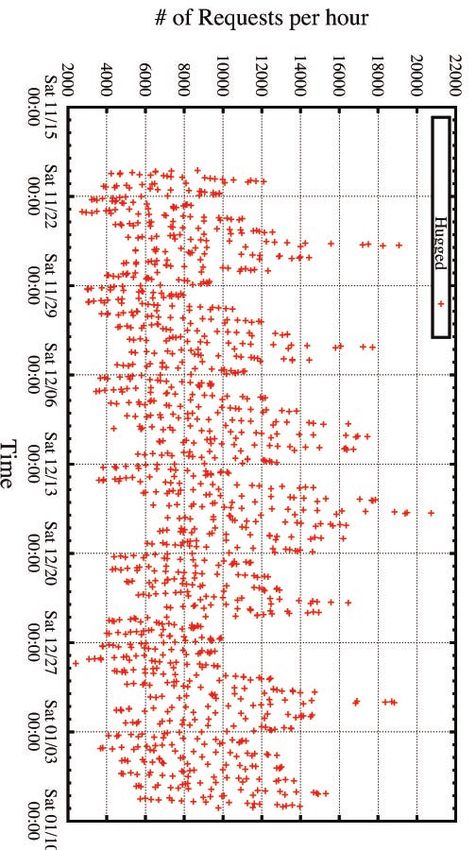
(1) The server loads, measured in terms of number of user re-
quests, follow a diurnal pattern, and show different growth pat-
terns depending on the popularity and seasonal nature of the ap-
plications. Already popular applications attract more new users
— exhibiting preferential attachment phenomena. Figure 4 shows
hourly request arrivals for three applications: Hugged, Holiday
Cheers, and The Streets. We observed a diurnal pattern in the ar-
rival process for all three. However, the request arrival rate, and
its evolution over time, was vastly different due to the different
popularity levels. The Hugged application provides an insight into Figure 4: Per hour application-layer request arrivals for
the request arrival pattern for an extremely popular application that Hugged, Holiday Cheers and The Streets. All three applica-
has a relatively mature subscription base. Even though Holiday tions show a diurnal pattern.
Cheers and The Streets are examples of recently launched applica-
tions, they have widely different growth patterns. Holiday Cheers, of the global request inter-arrival pattern seen by the application
being a seasonal application, showed viral growth during the holi- server. We found that for Hugged, the inter-arrival time follows an
day season (Thanksgiving, Christmas, and New Year). The Streets exponential distribution, with a mean of 0.4 seconds.
is essentially a gaming application and did not attain the same level (2) Queuing delay is negligible, while processing delays correlate
of popularity as Holiday Cheers. This shows how targeting applica- positively with loads and are affected by resource provisioning.
tion content to time of the year can play a crucial role in the growth We found that dq at the application servers was less than 20ms on
of an application. average, and had approximately the same distribution across appli-
To further understand what contributes to the busy period (high cations. Figure 6 shows the distribution of dp for various applica-
load) at the application servers, we divided the request arrivals tions: Hugged had a larger dp than the other two. Since Hugged is
into two categories: requests from users that have already installed more mature, with a larger user base, we expect that higher server
the application, and new installation requests. Figure 5 shows a load may be the reason behind the larger processing delay.
positive correlation between new installation requests and requests Next, we correlated the observed load with the application server
from authorized application users. This suggests that increased us- delays. While dq was negligible, we did observe a small number of
age of social network applications begets more users, indicating dropped requests on the application servers. The drop rate peaked
some kind of preferential attachment model at work. This con- during periods of high load (∼ 2.6%). Figures 7 and 8 show how
tributes to the increased load during busy periods, as there is not the load on the servers impacts dp . For Hugged, dp showed a pos-
only a higher number of requests from regular users, but also a itive correlation with load and shows a diurnal pattern. While the
larger number of new application installation requests. Another in- current provisioning at the application server for Hugged seems to
dication of load that we analyzed was the request inter-arrival time be adequate, an increase in the popularity of the application may
at the application servers. We consider all incoming requests (irre- mandate more resources. For Holiday Cheers, we saw an initial in-
spective of their type, or which client they belong to) to get an idea crease in dp , with increasing user base, during the first week after10000 1
hugged-facebook
0.9
# of installation requests
0.8
0.7
1000
0.6
CDF
0.5
0.4
100
0.3
0.2
hugged-facebook
0.1 holiday-facebook
streets-facebook
10 0
10 100 1000 10000 0 0.2 0.4 0.6 0.8 1 1.2 1.4 1.6 1.8 2
# of requests from installed users App. Server Processing Delay (sec)
10000
holiday-facebook
Figure 6: Distribution of application server processing delay.
Hugged, being a more popular application, had a larger dp .
# of installation requests
1000 10 22000
App. Server Processing Delay (logscale)
Request Arrivals
Processing Delay 20000
18000
100 16000
# of requests
14000
1 12000
10 10000
8000
6000
1 4000
1 10 100 1000 10000
0.1 2000
# of requests from installed users Sat 11/15 Sat 11/22 Sat 11/29 Sat 12/06 Sat 12/13 Sat 12/20 Sat 12/27 Sat 01/03 Sat 01/10
00:00 00:00 00:00 00:00 00:00 00:00 00:00 00:00 00:00
Time
Figure 5: Installation requests vs. Requests from authorized
application users for Hugged (top) and Holiday Cheers (bot- Figure 7: Variation of dp with load for Hugged. The dp showed
tom). A high correlation coefficient between these two signals a positive correlation with the load on the application server.
some kind of preferential attachment process at work for ap-
plication growth. 10 16000
App. Server Processing Delay (log scale)
Request Arrivals
Processing Delay
14000
the application was launched (11/15 ∼ 11/22). On Nov 23rd, ap- 12000
plication servers were upgraded: from sharing 4GB memory with
# of requests
10000
two other applications, Hugged now shared 8GB with one other ap- 1 8000
plication, while Holiday Cheers had dedicated 4GB memory. The 6000
impact of this is clearly visible in Figure 8 for Holiday Cheers: sub- 4000
sequent to the upgrade, dp no longer increased with load or across 2000
time, despite the viral growth of the application. 0.1 0
(3) Request response sizes remain stable across time, indepen- Sat 11/15 Sat 11/22 Sat 11/29 Sat 12/06 Sat 12/13 Sat 12/20 Sat 12/27 Sat 01/03 Sat 01/10
00:00 00:00 00:00 00:00 00:00 00:00 00:00 00:00 00:00
dent of load. For each application, we extract the response size Time
associated with each individual request from the OSN server to
the application server as follows. Using the tcpdump logs, we ob- Figure 8: Variation of dp with load for Holiday Cheers. After
tain the time stamp for the request arrival and the source IP/port the server upgrade (Nov. 23), resources seemed sufficient to
from which the request was sent. We then look at the packets that handle the viral growth of this application.
were sent back to this IP/port from the application server follow- plication servers to OSNs affect application server delays, impact-
ing the request. These packets constitute the response, and contain ing the overall user experience. We studied the delay associated
the client data. For example, for Hugged, this data would con- with making API calls from application servers to OSN servers
tain previous hugs that the client has sent and received. The re- (termed as the API call duration). Figure 9 shows the distribution
sponse sizes should be larger for more mature applications because of API call durations for various applications. The call duration
(a) they have a larger user base, and (b) individual users may have for The Streets was observed to be fairly small, followed by Holi-
more application-related data (such as activity history). Our results day Cheers, while Hugged observed the largest API call duration.
show that the average response size remains stable for the entire To understand the role of API calls, we analyzed how the API call
measurement period. The average response size for The Streets duration is affected by server load for two popular applications:
(least popular application) is the smallest (1.5–3 KB), and Hugged Hugged and Holiday Cheers. While average API call duration for
(most popular application) has the biggest average response size Holiday Cheers remains fairly stable across time (Figure 11), call
(4–5 KB). Furthermore, we expected average response sizes to de- duration for Hugged shows a remarkable increase during peak ac-
crease during periods with high request arrival rates (period during tivity periods (shown by ‘All API calls’ in Figure 10).
which more new application installation requests arrive), since new To explain this difference, we compared the specific type of API
users have less (or no) activity data. Our measurement results indi- calls made by these two applications. We found that Hugged and
cate that no such relationship exists for the applications considered, Holiday Cheers make several similar API calls10 , except for a cou-
showing that high request arrival periods are not dominated by new
application installation requests. 10
profile.setFBML, feed.publishUserAction, notifications.send and
(4) The type of interactions (i.e., API calls) from third-party ap- users.getInfo. We term these as Type B calls.1
0.9 10 20000
Request Arrivals
Type A API calls
Avg. API Call Duration (logscale)
0.8 Type B API calls 18000
All API calls
0.7 16000
0.6 14000
# of requests
CDF
0.5 12000
1
0.4 10000
0.3
8000
0.2
6000
hugged-facebook
0.1 holiday-facebook
streets-facebook 4000
0
0 0.5 1 1.5 2 2.5 3 3.5 4 0.1 2000
Sat 12/20 Mon 12/22 Wed 12/24 Fri 12/26 Sun 12/28 Tue 12/30 Thu 01/01 Sat 01/03 Mon 01/05
API Call Duration (sec) 00:00 00:00 00:00 00:00 00:00 00:00 00:00 00:00 00:00
Time
Figure 9: Distribution of API call duration. Hugged had higher
call durations than the other two applications. Figure 10: Variation in API call duration with load for Hugged.
The Type A calls cause the overall call duration for Hugged to
ple of additional API calls made only by Hugged11 . We subse- be extremely sensitive to load.
quently analyzed the average API call duration for Hugged, sepa-
10 16000
rately for the additional API calls (Type A) and the common API Request Arrivals
API Call Duration
calls (Type B) in Figure 10. We observed that Type A calls were re- 14000
API Call Duration (logscale)
sponsible for the surge in the average API delays during high load.
12000
However, even Type B calls show greater variation with load for
# of requests
Hugged as compared to Holiday Cheers. We suspect this is because 10000
of per-application or per-API-call resource budgets at the OSN, that 1 8000
are fully consumed by the relatively higher load for Hugged (or
6000
third-party applications in general) during peak traffic periods.
Concluding Remarks: Based on our observations, we conclude 4000
that one does not need exorbitant resources to launch and main-
2000
tain an extremely popular OSN application, despite its viral growth
and/or large fluctuations in seasonal usage. We do acknowledge 0.1 0
Sat 12/20 Mon 12/22 Wed 12/24 Fri 12/26 Sun 12/28 Tue 12/30 Thu 01/01 Sat 01/03 Mon 01/05
that processing requirements may differ on a per-application basis. 00:00 00:00 00:00 00:00 00:00 00:00 00:00 00:00 00:00
Time
Yet, in our case study, a server with Dual Core Xeon 2.0ghz, 4-8GB
Memory, and 100 Mbps connection speed is sufficient to serve ex- Figure 11: Variation in API call duration with load for Holiday
tremely popular applications like Hugged or Holiday Cheers that Cheers. The call duration seemed to be fairly stable despite the
attract 100-200K DAU. viral growth of the application.
6. GAUGING FACEBOOK INTERNALS nodes farther away geographically having higher round-trip delays.
Experiments from nodes in different countries showed similar df
After examining results from the perspective of the application and dg values (with differences of less than 10ms on average for
servers, we now turn to characterizing delay components from the the same experiment). However, the outliers among these nodes
perspective of end-users. This is motivated by the question: Do (most notably in Armenia, India and China) registered larger OSN
OSNs such as Facebook introduce significant delay overhead to delays consistently. This is mainly due to the differences in the
impact user experience while interacting with third-party appli- CPU power and loads on these nodes at the time of the experiment.
cations? If so, what factors influence these delays? Since per-country results are diluted by differences in CPU load
We first discuss how OSN delays are estimated by sending ac- and CPU power, we do not present results based on geographical
tive probes (synthetic requests) through Facebook from PL nodes, location. The variables in our experimental results include the dif-
followed by discussions of the results. ferent user accounts used, number of Facebook friends the target
6.1 Extracting OSN Delays user has, the applications being queried, the time of day and week
the experiments were performed, and the Facebook network of the
Section 3 outlines the two types of delays that are involved when targeted users. We attempt to minimize the effect of these variables;
a client interacts with an OSN to access third-party applications: our choices of variables are explained along with the results.
the OSN request forwarding delay (df ) and the OSN response pro- Our active measurements using PL nodes provide t9 − t1 (see
cessing delay (dg ). As explained in Section 4.3, our experiments Figure 2). By subtracting the Application Processing Delay (dp )
involve a diverse set of PL nodes that represent the clients. Our and the estimated transmission and propagation delays, we get the
data shows that the client requests generated in our PL experiments the sum of df and dg . Lacking synchronized clocks in PL, we rely
were forwarded by Facebook to the application servers, from 27 on round-trip times per request rather than one-way delays, for cal-
distinct IP addresses, all of which are located in California12 . We culating df and dg . As a work-around, for requests of size 0Kb
analyzed the round-trip delays from nodes in different countries to (that require 0Kb responses, except time stamp information nec-
these Facebook servers. The average RTT was around 170ms, with essary for calculating df and dg ), we simply remove all (known)
11 network and application layer delays from the total time taken for
notifications.sendEmail and users.hasAppPermission. We term
these as Type A calls. a request to return (to the client), and estimate 50% of that time as
12
Determined using geo-location services such as ‘hostip.info’ df . We use this df to calculate subsequent dg values for responsetently with application usage (load) and increase only linearly with
increasing request sizes. These delays hence do not have an appre-
ciable effect on users’ interactions with third-party applications.
6.3 OSN Response Processing Delays
Being the intermediary, Facebook parses responses from third-
party application servers before forwarding them to the users, which
incurs additional processing delays (dg ). The extent of this delay
may be affected by content type, content size, and characteristics
of target entity.
A key feature of the Facebook Developer Platform is its Face-
book Markup Language (FBML). It facilitates application develop-
ers through quick information rendering for application responses
(through FBML tags), and it disallows use of most traditional Javascript
features and other HTML content considered insecure for end-users.
We study the impact of requesting (allowed) HTML, Javascript,
Figure 12: OSN forwarding delays (df ) with varied request and other FBML content on dg through a number of experiments.
sizes (observed from Dec 27, 2008 to Jan 3, 2009). The verti- In the following, we summarize key observations with correspond-
cal bars denote minima and maxima for the averaged measure- ing details of our findings.
ments. (1) Processing HTML content takes significantly less time than
processing Javascript. We compared dg for HTML and Javascript
sizes greater than 0Kb. contents by using 200Kb of random HTML and 26Kb of Javascript
content in application responses. Our results show that dg for HTML
6.2 OSN Request Forwarding Delays content was significantly smaller (0.01ms/byte) compared to 0.04ms/byte
Facebook, being the intermediary, must ensure that users’ re- for Javascript. These stark differences in dg exist since Facebook
quests are forwarded to the application servers in a timely man- must ensure legitimacy of every portion of the Javascript content
ner. We first address key questions concerning the forwarding delay before forwarding it to the client, Javascript being a more sophisti-
(df ) and summarize our observations: cated language to verify than HTML. Note that we use milliseconds
(1) OSN request forwarding delays are around 130ms for user per byte to make a fair comparison without the bias of content size.
requests of size 0–1Kb (typical for the six chosen Facebook appli- (2) OSN response processing delay for FBML content targeting
cations). We gauge df (as explained previously) by varying user non-user entities is unaffected by the target’s popularity. It also
request sizes (from 0Kb to 50Kb) to application servers. Figure 12 remains consistent with time. We consider dg for FBML tags tar-
shows how df for Facebook applications varies with request size. geting Facebook networks (non-user entities). In our experiments
The minimum df (i.e., for a 0Kb request size) was about 130ms, with FBML network tags, we compared dg values by targeting
while requests of size 50Kb took 550–650ms to leave Facebook. Facebook networks with high and low popularity. We used the
Since all user requests are 0Kb to 1Kb in size, for the considered applications’ user base to estimate the popularity of the 15,015 to-
applications, we conclude that df constitutes negligible overhead. tal Facebook networks. We compare dg values for processing 250
(2) Per-application OSN request forwarding delays increase lin- FBML network tags targeting randomly chosen networks out of
early with request size. Figure 12 shows that for each application, 3,000 most popular and 3,000 least popular Facebook networks.
df increases steadily as request sizes increase. Note that for every We found that dg values for 250 FBML network tags were around
user request to a third-party application, Facebook appends a list of 310ms, regardless of networks’ popularity. Furthermore, this pro-
user specific parameters to the URL request. Facebook then calcu- cessing delay did not vary with time in measurements from Dec
lates a hash of the appended parameters and forwards the modified 27, 2008 to Jan 20, 2009. We had expected FBML network tag
request to the application server. We are not privy to any additional processing delays to be small, due to the small number (15,015)
tasks performed on incoming user requests, and expect that the con- of total Facebook networks. However, we expected this delay to
sistent increase in df is due to transmission delays internal to the vary with overall Facebook Platform usage (i.e., with time of day).
Facebook network. Note also in Figure 12 that plots for individual The lack of the latter result is plausible in the presence of a caching
applications never overlap or cross. Even though the differences mechanism for FBML tags. We later confirmed this caching be-
are of a few milliseconds for small request sizes, these differences havior for FBML network tags by running experiments targeting
amplify towards larger request sizes. The differences in delays, the same networks in quick succession.
however, are not correlated with application popularity. A vital set of FBML tags target various content (i.e., name, pro-
(3) Per-application OSN request forwarding delays do not vary file picture, user status) for Facebook users. Given the sheer size
with load (request arrival rate). We also analyzed the time varia- of data Facebook must store for its users, one may expect some
tion in df , from Dec 27th 2008 to Jan 23rd 2009, for the various form of data segregation to speed up processing delays at the OSN.
request sizes. We were unable to observe a relationship with third- We expected this segregation to occur mainly along three lines:
party application usage and df . Even though df fluctuated between (1) by user geography, represented by a Facebook network, (2) by
times of day and across days, the difference was not appreciable user popularity, represented by total mutual Facebook friendships,
(per-request size) nor consistent (across weeks). However, we can- and (3) by type of content for the user (name, profile picture, user
not relate the absence of a pattern in df to overall Facebook Plat- status). The following results compared dg values for these user-
form usage through our measurements, as they account for only a related FBML tags along these lines of possible data segregation.
fraction of overall traffic on Facebook. (3) FBML user tag processing delays do not vary with target
Concluding Remarks: Forwarding delays are fairly small when users’ popularity and network membership. If data on Facebook
request sizes are between 0–1Kb. They also do not vary consis- is segregated by user geography, membership in a regional Face-Figure 13: OSN processing delays (dg ) for 250 FBML user tags Figure 14: OSN processing delays (dg ) for different number
targeting users in various Facebook networks. Measurements of FBML name tags for users in networks with varied popu-
taken from Jan 23-25, 2009 evening periods, through User Z on larity. ‘Mixed networks’ are chosen from 5,000 random users
Hugged. Results were similar for other user accounts and ap- on Hugged. The New York network is the most popular with
plications as well. The vertical bars denote minima and max- 243,162 users on Hugged, followed by UAE with 12,187 and
ima for the averaged measurements. Pakistan with 6,213 users. Measurements were taken Jan 18-
22, 2009 through User Z on Hugged. Results were similar for
book network should translate into different dg values for users in other user accounts and applications as well. The vertical bars
more popular networks and for users in less popular networks. We denote minima and maxima for the averaged measurements.
performed experiments with 250 FBML user tags using five, vari-
ably sized Facebook regional networks, both inside and outside the knowledge of the internal Facebook provisioning and architecture,
U.S.13 Our measurements for dg (from Jan 18 – 25, 2009) did not we surmise this difference is due to a more efficient storage/update
show any appreciable variation for dg across these networks. We mechanism for Facebook users’ statuses.
repeated experiments for FBML user tags targeting Facebook users (5) Data caching has significant effect on FBML tag processing
with different numbers of Facebook friends—measurements (from delays. To gauge the effect of caching on dg for FBML user
the six applications we study) show that the average user has 35 tags, we repeated experiments for each FBML user tag in quick
friends, with a standard deviation of 65. To capture different ranges succession with the same set of target Facebook users. The result in
of popularity of users, we target users with 15 to 50, 400 to 600, and Figure 13 (lower delays for subsequent experiments) demonstrates
1,000 to 5,000 friends. Contrary to our expectations, dg was similar that caching of FBML user tags plays significant role in repeated
(average difference of less than 15ms) across the different ranges accesses to the same target user’s data, and that content fetches
of Facebook friends for the various FBML user tags. for our measurements are not all being performed using databases.
(4) FBML user tag processing times vary with type of FBML tag. Hence caching significantly affects our ability to estimate dg .
FBML profile picture tags take the longest, whereas FBML user Furthermore, among all the experiments reported here, we did
status tags take the shortest times. We compared dg values for not find appreciable (nor consistent) variation in dg for requests
FBML name, profile picture, and user status tags. The results seg- made through PL nodes in different geographical locations and
regated by target user geography (Facebook network), are shown through users with varying popularity14 . We thus believe Facebook
in Figure 13. The figure shows that while FBML name tag pro- does not prioritize user requests based on geography or user pop-
cessing delays are around 1, 000ms, delays due to FBML profile ularity. This is plausible considering the very heavy usage of data
picture and FBML user status tags are about 1, 350ms and 450ms, caching on Facebook [14].
respectively. These differences in dg are quite stark and consistent (6) OSN response processing time increases linearly with num-
in our measurements. To understand the reason for the high dg val- ber of FBML tags. The increased delays show no appreciable
ues for FBML profile picture tags, we examined a sample of 100 variation across third-party applications and target user charac-
public Facebook profiles across a university network and a regional teristics. We measured variation in dg using 100 to 1,000 FBML
network. We found that on average, each Facebook user has 3.64 tags. Figure 14 shows results for FBML name tags for target users
profile pictures. Facebook blogs [14] indicate that Facebook stores in the large New York Facebook network, as well as small regional
four different sizes of each user’s profile pictures. This requires a networks such as Pakistan and UAE, alongside results for mixed
more elaborate storage mechanism for profile pictures on Facebook networks. We observe an almost linear increase in dg from 100 to
(as compared to, say, users’ real names and dates of birth), and the 1,000 FBML tags, with minor (10ms) differences for different net-
high number of total profile pictures explains the higher process- works (that were inconsistent across time). This result suggests that
ing delay for FBML profile picture tags. Furthermore, a user’s Facebook does not parallelize processing of FBML tags within in-
status on Facebook must be updated more often than, say, their dividual requests, which could significantly decrease dg . Moreover,
real names and profile pictures. For the 208 Facebook friends of this trend is common across our applications with similar results for
User Z, we found that users, on average, updated their status more dg . While the lack of appreciable variation in dg across applica-
than twice a day. Because of this higher frequency of updates, user tions may hint at a lack of application-wise resource provisioning,
statuses might require a different read/write mechanism. Lacking caching at the OSN hampers efforts to ascertain this conjecture.
13 14
The highest contributor to Facebook in terms of number of users. In terms of number of OSN friends.You can also read