Deliverable D6.3 Roadmap for application improvements and extension - Shift2Rail
←
→
Page content transcription
If your browser does not render page correctly, please read the page content below
Ref. Ares(2021)2503922 - 13/04/2021

 My TRAvel Companion.

 Deliverable D6.3
Roadmap for application improvements and
 extension

 This project has received funding from the Shift2Rail Joint Undertaking under the European
 Union’s Horizon 2020 research and innovation programme under grant agreement no. 777640.

 2
Contract No. H2020 –777640

 D6.3 Roadmap for application improvements and
 extension
 Due date of deliverable: 31/12/2020
 Actual submission date: 13/04/2020

Start date of project: 01/09/2017 Duration: 40 months

 Dissemination Level
 PU Public X
 CO Confidential, restricted under conditions set out in Model Grant Agreement
 CI Classified, information as referred to in Commission Decision 2001/844/EC

 D6.3 Roadmap for application improvements and
 Page 5 of 44 13/04/2021
 extension

Contract No. H2020 –777640

Document Control Sheet
 Deliverable number: D6.3

 Deliverable responsible: Delft University of Technology

 Work package: WP6

 Main editor: Lucas Spierenburg

 Editor name Organisation
 Kristel Bronsvoort Delft University of Technology
 Eleni Chalkia Centre of Research and Technology Hellas
 Giorgos Diafas AETHON Engineering Consultants P.C
 Eirini Kastrouni ATTIKO Metro
 Konstantinos Mavromatis AETHON Engineering Consultants P.C
 Lucas Spierenburg Delft University of Technology
 Ismini Stroumpou Sparsity Technologies SL
 Maria Tsourma Centre of Research and Technology Hellas

 Modifications Introduced
 Version Date Reason Editor
 0.1 05/12/2019 Document outline Kristel Bronsvoort
 0.2 10/10/2020 Rework on the outline Lucas Spierenburg
 Improvements for the route choice model
 0.3 29/11/2020 Lucas Spierenburg
 and introduction
 Improvements of the app from the user’s
 0.4 18/12/2020 Eirini Kastrouni
 study focus group
 Improvements of the app from the usability
 0.5 21/12/2020 Eleni Chalkia
 testing
 Improvements for the time-of-departure
 0.6 21/12/2020 Konstantinos Mavromatis
 and the mode choice models
 Potential improvements expanding user’s
 0.7 11/01/2021 Ismini Stroumpou
 feedback
 Improvements for the activity
 0.8 13/01/2021 Maria Tsourma
 recommendation model
 0.9 13/01/2021 Conclusion Lucas Spierenburg
 1.0 25/01/2021 Edits after quality reviews Lucas Spierenburg
 1.1 01/02/2021 Final release Ismini Stroumpou
 1.2 06/04/2021 Edits on the operators’ portal Giorgos Diafas
 1.3 10/04/2021 Additions on section 5 Ismini Stroumpou
 2 13/04/2021 Final release Lucas Spierenburg

D6.3 Roadmap for application improvements and
 Page 5 of 44 13/04/2021
extension
Contract No. H2020 –777640

Legal Disclaimer
The information in this document is provided “as is”, and no guarantee or warranty is given that the information is
fit for any particular purpose. The above referenced consortium members shall have no liability to third parties for
damages of any kind including without limitation direct, special, indirect, or consequential damages that may result
from the use of these materials subject to any liability which is mandatory due to applicable law. © 2017 by My-TRAC
Consortium.

 D6.3 Roadmap for application improvements and
 Page 5 of 44 13/04/2021
 extension
Contract No. H2020 –777640

Executive Summary
This document presents the potential improvements to implement for further development of the My-
Trac application, based on the analysis of the pilot phase II. During the pilot phase II, the partners have
executed users’ focus groups, usability testing, and an extensive assessment of the models integrated in
the application. Additionally, all the changes in the different application components after Pilot Phase I,
have been reported in each WP respective Deliverable, i.e., the changes regarding the HMI that emerged
from Pilot Phase I have been reported in D4.4. During Pilot Phase II, we faced specific travel restrictions
due to the Covid-19 crisis that prevented us from testing the application as planned in a real environment.
Instead, some of the features of the app were assessed in virtual experiments, such as the validation of
the route choice model. The results of the analysis of the Pilot Phase I and Pilot Phase II are reported in
the deliverable D6.2. This document builds upon deliverable D6.2 and suggests ameliorations to improve
the user’s experience, the usability of the application, and the models integrated in the app.

The improvements based on the user’s experience were determined based on the analysis of the usability
testing, and of the user’s study focus group. Some improvements relate to the set-up of the application
(account creation, log in…) before use and could be fixed without affecting the design. Some others
relate to the intuitiveness of the application: the interface provides too much information and confuses
the user, understanding the navigation is not straightforward. The latter ones would require more work.

The activity recommendation was tested with a stated-choice experiment, where participants had to use
virtually the application. This virtual experiment helped identifying improvements on the
recommendation system and on the activity prediction mechanism. The recommendation system could
be improved by providing more visual information on the different points of interest, enabling filtering of
activities, and better profiling the user. The activity prediction mechanism could be improved by creating
more activity categories, and integrating other data in the analysis, such as the user’s calendar.

Concerning the route choice model, the prediction power could be increased by adding more explanatory
variables, such as the transit mode. Moreover, the parameters of the model allow to determine how a
user perceives each component of the trip (for instance the in-vehicle time, or the walking time) which
could be used to determine a personalized itinerary, using a personalized Open TripP lanner request.

The mode choice and time of departure models could be improved by adding variables that account for
parameters affecting decision. For instance, the two models could integrate a parameter representing
the change in the travellers’ habits due a pandemic such as the Covid-19.

To increase the engagement of Transport Service Providers (TSPs) and reinforce the value chain between
TSPs, users and the application, the operators’ portal (OP) will be improved. First, the OP will allow
operators to share the vehicles’ location in real-time, allowing the users to track the actual position of the
vehicles on a map. Second, an API will be developed to automate communication and data exchange
between the OP and the TSPs (currently, the interface between the two is manual).

 D6.3 Roadmap for application improvements and
 Page 5 of 44 13/04/2021
 extension
Contract No. H2020 –777640

Abbreviations and Acronyms
API Application Programming Interface
EC European Commission
GPS Global Position System
GDPR General Data Protection Regulation
GTFS General Transit Feed Specification
HMI Human-Machine Interface
IoT Internet-of-things
OP Operator’s portal
OSS Open Source Software
OTP OpenTripPlanner
PC Project Coordinator
POI Point of Interest
PT Public Transport
MaaS Mobility as a Service
UEQ User Experience Questionnaire
RP Revealed Preference
SP Stated Preference
SUS System Usability Scale
TRL Technology Readiness Level
TSP Transport Service Provider
UI User Interface
UX User Experience
WP Work Package

D6.3 Roadmap for application improvements and
 Page 5 of 44 13/04/2021
extension
Contract No. H2020 –777640

Table of Contents
1 Introduction 10
2 Potential improvements based on the users’ feedback 11
 2.1 Usability testing related recommendations 11
 2.1.1 Decrease the size of the log-in questionnaire 11
 2.1.2 Simplify the terms and conditions acceptance 12
 2.1.3 Create an account code email colours 13
 2.1.4 Simplify the personalised proposal representation 13
 2.1.5 The navigation visualisation should be more clear 14
 2.1.6 Log-out accessibility 14
 2.2 Recommendations from the study focus groups 15
 2.2.1 Introduction 15
 2.2.2 Real-time navigation 15
 2.2.3 Future trip Planning 15
 2.2.4 Additional points of interest 15
 2.2.5 Additional comments on feature improvement 16
3 Recommendation related to the models 17
 3.1 Activity recommendation model 17
 3.1.1 Introduction 17
 3.1.2 Improvements on the recommendation system 18
 3.1.3 Improvements on the Activity prediction mechanism 19
 3.2 Route choice model 20
 3.2.1 Introduction 20
 3.2.2 Improve the model’s performance by adding more explanatory variables 20
 3.2.3 Personalising the OpenTripPlanner request 21
 3.3 Time of departure and mode choice models 22
 3.3.1 Evaluating the Mode choice and Time of Departure Choice Models 23
 3.3.2 Future Considerations 25
4 Improvements of the Operators’ portal 26
 4.1 Addition of static GTFS creation/management tools 26
 4.2 Addition of real-time GTFS creation/management tools 26
 4.3 APIs for data exchange 27
5 Roadmap for potential improvements Expanding users’ Feedback 28
 5.1 General improvements of My-TRAC system 29
 5.2 Traveller's registration 29
 5.3 Trip creation 30
 5.4 Detection of changes and disruptions on a route during a trip 30
 5.5 Activities’ proposition and Activities’ proposition in groups 31
 5.6 Navigation 31
 5.7 Using My-TRAC app in a country other than home-country 31
 5.8 Communication with MaaS and 3rd party services 31

D6.3 Roadmap for application improvements and
 Page 5 of 44 13/04/2021
extension
Contract No. H2020 –777640

 5.9 Group creation, Group modification: Adding a new member, Group modification:
 Remove a member, Group deletion, group itinerary creation 31
 5.10 UI/UX personalization 32
 5.11 Points and rewards system 32
 5.12 Booking and ticketing 32
 5.13 Occupancy prediction 32
 5.14 Prioritization of app’s improvements 32
6 Conclusion 43
References 44

D6.3 Roadmap for application improvements and
 Page 5 of 44 13/04/2021
extension
Contract No. H2020 –777640

List of Figures
Figure 1: Personal info tab. 12
Figure 2: Additional info tab. 12
Figure 3: Additional questionnaire tab. 12
Figure 4: Terms and conditions proposal. 12
Figure 5: Terms and conditions not checked. 12
Figure 6: Terms and conditions details. 12
Figure 7: Verification code email colours. 13
Figure 8: Route request by giving a destination. 13
Figure 9: Suggested route and mode by My-TRAC models. 13
Figure 10: Alternative route and mode details selected by the user. 13
Figure 11: Navigation visualisation proposal. 14
Figure 12: The effect of COVID-19 in Sweden. 24
Figure 13: Improvements vs criticality and complexity 41

List of Tables
Table 1: Description of three OpenTripPlanner parameters that could be used to better represent the perceived
travel time. ....................................................................................................................................................................... 22
Table 2: Example of two itineraries with different trip components ............................................................................ 22
Table 3: My-TRAC functionalities of final version ........................................................................................................... 28
Table 4: Prioritization of app improvements.................................................................................................................. 34
Table 5: Proposed improvements criticality and complexity .........................................................................................41
Table 6: Ranking of potential improvements. ................................................................................................................ 42

 D6.3 Roadmap for application improvements and
 Page 5 of 44 13/04/2021
 extension
Contract No. H2020 –777640

1 INTRODUCTION
WP6 consists in the design, the execution and the analysis of pilots for testing the My-TRAC application
in a realistic environment. The design of the pilots, and the pilots’ execution plan are described in
deliverable D6.1, while deliverable D6.2 focuses on the execution and results of the pilots both for Phase
I and Phase II. The current document (deliverable D6.3) explores the potential improvements for further
development of the application, covering the following scope:
 ● Measurement of models’ accuracy
 ● Guidelines for system improvement in terms of models’ performance
 ● Guidelines to improve user experience in terms of interface usability and adaptability in each of
 the different functionalities
 ● Additional insights into passenger choice behaviour.

The My-TRAC application and the My-TRAC operator’s portal were tested during pilot Phase I and pilot
Phase II to evaluate, the usability of the application, the accuracy of the models, as well as the usefulness
of the operator’s portal. This allowed to steer the development of the app and to address potential issues
arising when using the app in a real environment. Unfortunately, the Covid-19 crisis impacted substantially
the execution of the pilots and the dissemination of the application amongst travellers, due to travel
restrictions and lockdown measures. The consortium partners set up a contingency plan to adapt to the
situation (see deliverable D6.1), and the execution of the pilots is described in deliverable D6.2. The
contingency plan allowed evaluating the application in depth, and determining the most relevant
improvements for developing the application further. This deliverable presents these improvements
based on the evaluation performed and reported in deliverable D6.2.
After this introduction, the second section of this deliverable focuses on the recommendations to
improve the user’s experience with the application. During pilot Phase I and pilot Phase II, two usability
tests were performed, where participants were asked to perform actions with the application, in order
to evaluate its usability. The results of pilot Phase I usability testing as well as the recommendations for
improvements based on these comments are reported in D6.2. Additionally, in D6.2 the results from the
pilot Phase II usability tests are also reported, but not the improvements based on these results. Based
on the results of the pilot Phase II usability testing, this document presents recommendations to improve
further the usability and the user experience of the app beyond the project. During pilot Phase I and pilot
Phase II, the user control groups (pilot I), and the user study focus groups (pilot II) gathered feedback
from users of the application. The main observations from the users’ feedback are summarized in
deliverable D6.2, and the related suggestions for improvements are discussed in this deliverable.
The third section of the deliverable explores potential improvements for the models integrated in the My-
TRAC app. The validation of these models is described in deliverable D6.2, while deliverable D6.3 suggests
potential improvements that could increase the accuracy of the models, and strengthen the integration
of the models in the app.

 D6.3 Roadmap for application improvements and
 Page 5 of 44 13/04/2021
 extension
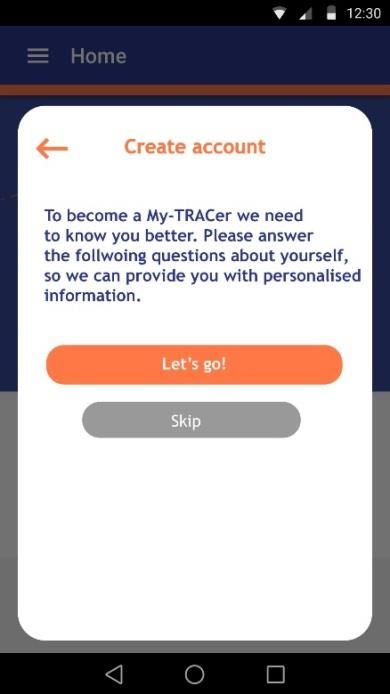
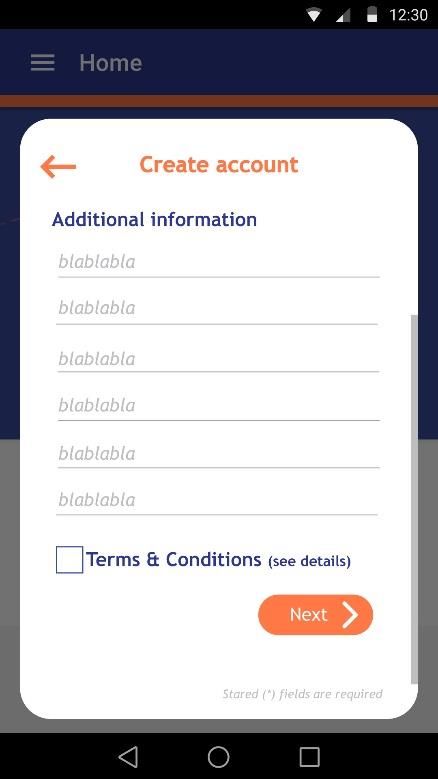
Contract No. H2020 –777640

2 POTENTIAL IMPROVEMENTS BASED ON THE USERS’ FEEDBACK

2.1 USABILITY TESTING RELATED RECOMMENDATIONS
My-TRAC usability tests were performed during both pilot Phase I and pilot Phase II. The methodology,
the hypothesis as well as the execution details for both phases are reported in D6.1 in detail. Additionally,
the results of both Pilot Phase I and Pilot Phase II, are reported in D6.2. The proposals for the update of
the app based on the users’ comments from the pilot Phase I are also reported in D6.2. Herein, we will
provide some guidance on next steps regarding a future update of the app’s UI, beyond My-TRAC project,
to elevate the user experience (UX) and its usability, based on the results of the pilot Phase II.

2.1.1 DECREASE THE SIZE OF THE LOG-IN QUESTIONNAIRE
The majority of the users at the usability tests (both in pilot Phase I and also in pilot Phase II) were
disappointed with the extended size of the log in questionnaire. During the pilot Phase I most of the user
commented negatively the extended length of the log in questionnaire and some of them even
considered it as a barrier to use the application in real life. Considering the importance of these answers
in order to make our models work and achieve providing the user with personalised feedback, we tried
to shrink the questionnaire to the minimum for the pilot Phase II. Again, even if the comments were not
so intense, they still existed. So we have to reconsider how and when will we get this info from the users
without increasing so much their workload in tasks where no effort should be put, like log in. One
suggestion is to have the questionnaire divided into two Sections; Section A and Section B. Section A
would have the basic questions (5 tops) and will be given to the user during log in. Then there will be
Section B with the questions that are needed for the personalisation. The user will be asked at that point
if he/ she is willing to answer these questions now, or at a later stage of using the app, informing him/ her
that they will not have personalised info if they never answer these questions. In that way it will be at the
user’s preference when to answer these questions. The respective wireframes from D4.4 are presented
below.

 D6.3 Roadmap for application improvements and
 Page 5 of 44 13/04/2021
 extension
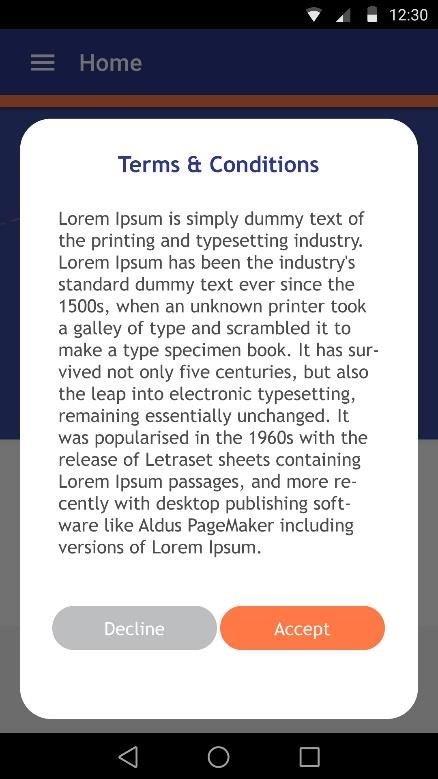
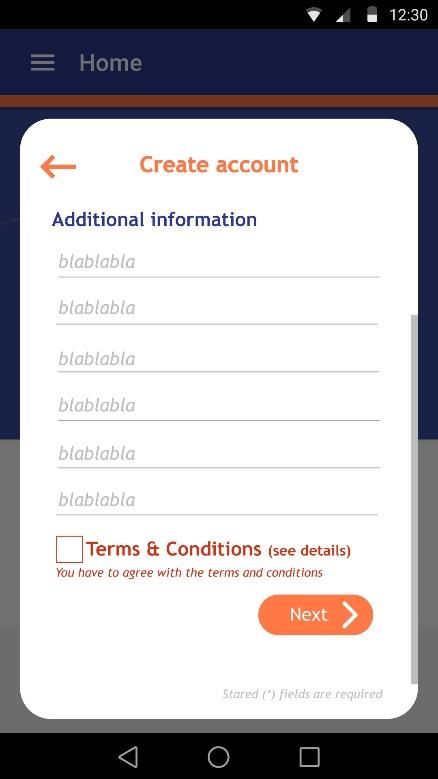
Contract No. H2020 –777640

 Figure 1: Personal info tab. Figure 2: Additional info tab. Figure 3: Additional
 questionnaire tab.

2.1.2 SIMPLIFY THE TERMS AND CONDITIONS ACCEPTANCE
Most of the users, especially during the pilot Phase II, had difficulties on finding how to accept the terms
and conditions and could not realise this sub-task without assistance. We should simplify this task, by
adding a tick box like the one in the following figure that the users should click to accept.

 Figure 4: Terms and conditions Figure 5: Terms and conditions not Figure 6: Terms and conditions
 proposal. checked. details.

 D6.3 Roadmap for application improvements and
 Page 5 of 44 13/04/2021
 extension
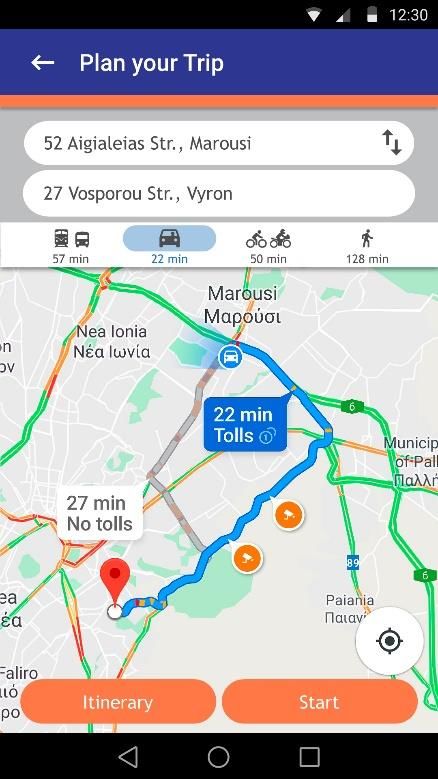
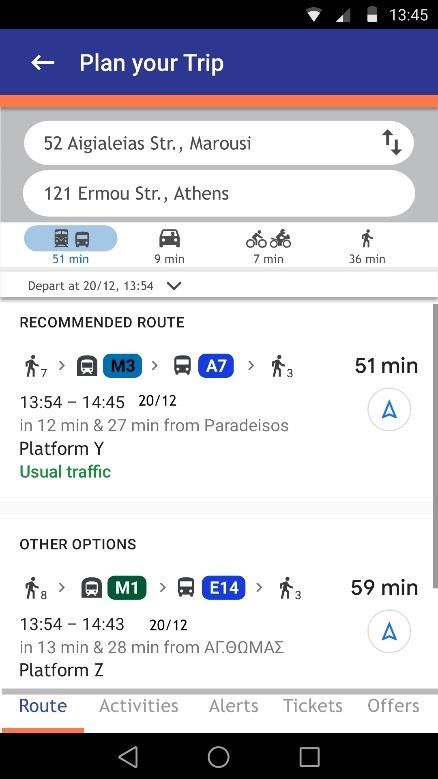
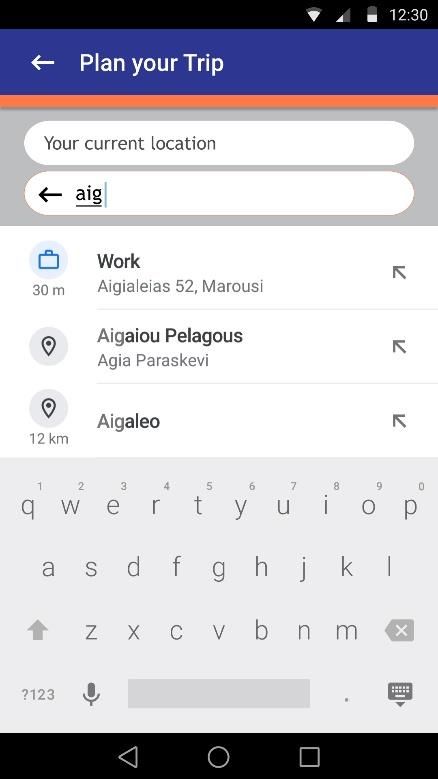
Contract No. H2020 –777640

2.1.3 CREATE AN ACCOUNT CODE EMAIL COLOURS
Some users could not read the mail text in the email that was sent to them including the verification code
for creating an account. Likewise in the figure that follows, the email should be in white font with black
or blue (My-TRAC logo’s blue) colour letters.

 Figure 7: Verification code email colours.

2.1.4 SIMPLIFY THE PERSONALISED PROPOSAL REPRESENTATION

 Figure 8: Route request by giving a Figure 9: Suggested route and mode Figure 10: Alternative route and
 destination. by My-TRAC models. mode details selected by the user.

One of the main guidelines of the affective and persuasive design that we follow in My-TRAC is to have a
UI that is simple and transparent. This means that the user should not be aware of all the models that run
to the back end of the app; he/ she should just be presented with their outcome. The majority of the users

 D6.3 Roadmap for application improvements and
 Page 5 of 44 13/04/2021
 extension
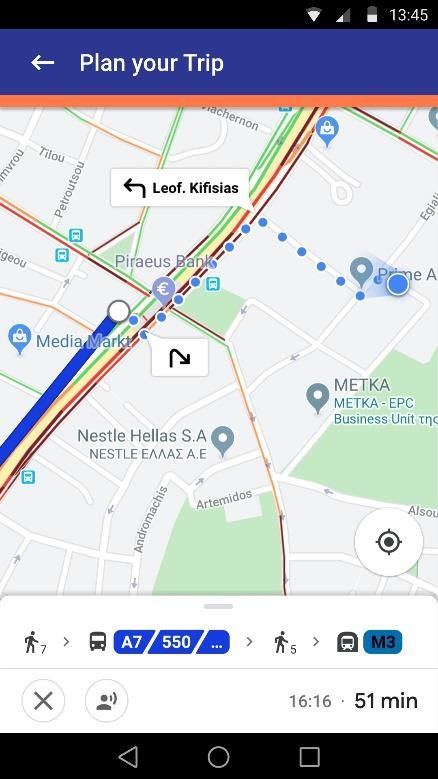
Contract No. H2020 –777640

in the usability testing did not understand the personalised route icon and they were confused with the
sequence of the actions realised to select the most suited route and mode for them. The proposal is to
hide all this information. The user should see as an outcome of the route request only the route that is
considered as the most appropriate to his/ her preferences. So the personalisation button should be
omitted. Then the user of course will have the possibility to see the rest of the routes found by the system,
as presented in the above figures.

2.1.5 THE NAVIGATION VISUALISATION SHOULD BE MORE CLEAR
Many users did not understand what was going on when the navigations started. The navigation should
be given to the user with a clear visualisation on the map, like the one presented at the following figure.

 Figure 11: Navigation visualisation proposal.

2.1.6 LOG-OUT ACCESSIBILITY
Most of the users, especially those with low technical literacy, had difficulty to find how to log out, since
there is no button available in the main screen of the application. Considering that there is actually no
reason to log out often, this comment has not been thought as major issue. Nevertheless, we could add
a log out option when pressing the three dots at the top right ankle of the major screen of the application,
under the help.

 D6.3 Roadmap for application improvements and
 Page 5 of 44 13/04/2021
 extension
Contract No. H2020 –777640

2.2 RECOMMENDATIONS FROM THE STUDY FOCUS GROUPS

2.2.1 INTRODUCTION

The purpose of the study focus groups was to collect feedback from the users of the improved My-TRAC
app, during the second pilot phase. For the pilot sites where control focus groups were also organized
during the first pilot phase (Athens, Lisbon), a qualitative comparison of user feedback during pilot
phases I and II has been performed. For the other two pilot sites (Barcelona and Netherlands), the focus
group feedback obtained from pilot phase II participation is compared with user attitudes towards post
phase II app functionalities. Each study focus group consisted of 5 to 10 participants. For more detailed
information on the study focus group methodology, as well as the main findings of each focus group
session, please refer to deliverables D6.1 and D6.2.

In the following subsections, the key recommendations received by the participants of study focus
groups in all 4 sites are discussed.

2.2.2 REAL-TIME NAVIGATION
Various users mentioned the value of having real-time navigation provided to the users when using the
app. More importantly, it was often mentioned that, when in trip navigation mode, the map point
indicating the user’s location on the map did not work properly. Additionally, compared to other similar
apps (e.g., Google Maps), navigation directions were not available, rendering the app less useful than its
counterparts/competitors in the context of navigation. Such a feature is deemed essential especially for
private vehicle, biking and walking trips. Adding this feature to the app would significantly improve its
reliability and its stance among other similar apps, it would complete the app, and it would make it more
competitive in a commercial context.

2.2.3 FUTURE TRIP PLANNING
Various participants mentioned their need to be able to plan trips into the future. During the second pilot
phase, users were only able to plan their trip on the fly, based on the transportation service provided at
the moment of planning. However, multiple users commented on the usefulness of a future trip planning
app feature. Such a feature would allow users to plan their travel ahead of time, using future travel service
information, especially with respect to public transit trips. Including this feature in the app is expected to
increase its competitiveness, especially given the fact that all similar, commercially successful apps
provide such a feature to their users.

2.2.4 ADDITIONAL POINTS OF INTEREST
A recurring suggestion during all study focus groups was with respect to the points of interest. More
specifically, users suggested that the list includes additional categories of points of interest, along with
supplementary information related to the POI (e.g., type of business, business hours, contact
information). On that note, numerous participants also suggested including a feature that would allow

 D6.3 Roadmap for application improvements and
 Page 5 of 44 13/04/2021
 extension
Contract No. H2020 –777640

them to filter the POIs based on category, or other criteria. Improving the POI functionality would
undoubtedly enhance the app altogether and would discourage users from switching to other apps (e.g.,
browser, Google Maps) in order to retrieve said information.

2.2.5 ADDITIONAL COMMENTS ON FEATURE IMPROVEMENT
In addition to the main improvements analysed in the previous subsections, a few additional
recommendations were discussed during the study focus groups. First, some users mentioned the need
for the app to provide a detailed illustration of the surrounding infrastructure; this is particularly
important for public transit trips in dense urban environments, where the location of a public transit
station may not be accurately indicated on the map (especially, if other stations are in the vicinity, and it
is not clear to the user towards which station they should walk).Additionally, several users mentioned the
lack of proper explanation for certain app features (e.g., how often and when the app refreshes, what is
the rating provided to each alternative, etc.), and emphasized the need for a concise user guide that
would explain those app features that are not necessarily straightforward. Another suggestion was
reducing the length of the questionnaire, and potentially asking the user to complete the questionnaire
after they have had some time to interact with the app and evaluate its usefulness. With respect to group
travel, several users suggested that the app includes a social component, allowing them to interact with
their friends (e.g., messaging). Last but not least, with respect to social market, users did not make any
particular recommendation, since it was only demoed to them, and they did not have the chance to
properly test it themselves. As it was pointed out in the D6.2, My-TRAC does not have an agreement with
a provider such as a travel operator or a shop in order to be able to provide to the user real products
through the social market. In general, users expressed a positive attitude towards the inclusion of this
functionality and the possibility to exchange points to get discounts etc., although they also declared that
they would not just use the application because of that.
Overall, the consensus has been that, prior to branching out to additional functionalities and features, it
should be ensured that the existing functionalities are developed to perfection, without glitches and
unintuitive behavior.

 D6.3 Roadmap for application improvements and
 Page 5 of 44 13/04/2021
 extension
Contract No. H2020 –777640

3 RECOMMENDATION RELATED TO THE MODELS

3.1 ACTIVITY RECOMMENDATION MODEL
In this section, the recommendations proposed for the improvement of the evaluated activity and
recommendation models are described. Additionally, a small description of the virtual experiment and of
the evaluation results is also provided.

3.1.1 INTRODUCTION
As discussed in deliverable D6.2, the activity models and the recommendation system were tested using
a stated-choice experiment with 50 participants. The experiment took place in Greece and was conducted
online. The online experiment was selected as an option due to the Covid-19 situation, because under
these circumstances the live pilots were threatened with the lack of participants and thus lack of data.
Due to the Covid-19 situation, the testing of both models was biased because travelling habits and the
daily behaviour of users had changed radically.
The scope of the experiment was to allow users use the My-TRAC application as they would use it before
the lockdown and the restrictions forced due to Covid-19 crisis, and receive recommendations for POIs
that they could visit when taking a certain trip, in order to retrieve the data required for the models’
evaluation. The feedback retrieved from the experiment was used for the evaluation and validation of
both the recommendation system’s model and the Activity Prediction mechanism. Apart from the main
experiment’s core, which is described in detail in D6.2, a questionnaire aiming to measure user’s
experience was also used. This questionnaire had an online version and was sent to the participants of
the virtual experiment in order to fill it in when they had finished with the experiment.
The results of the experiment described in D6.2 showed a positive impression of the users with the
recommendation system. More specifically, users were mostly satisfied with the recommendations
provided by the recommendation system and the activity types predicted. Regarding the general user’s
experience, it was measured using the System Usability Scale (SUS) and User Experience Questionnaire
(UEQ) scales used for measuring perceptions of usability and user experience in a simple and immediate
way. In both scales, the experiment’s participants were satisfied from the functionalities of the
recommendation system, as they have tested each one of them through the experiment. The scales with
excellent impression were attractiveness, efficiency, and intuitive use, quality of content, trustworthiness
of content, trust, perspicuity, dependability, stimulation and novelty. The scales that are defined as good
are the visual aesthetics, were improvement on the data presentation in the My-TRAC application can be
implemented. Additional analysis and information about the results are available in D6.2.
Based on the results of the evaluation, improvements and future extensions that could be made on both
the models, the Activity Prediction mechanism and the recommendation system are described in this
section.

 D6.3 Roadmap for application improvements and
 Page 5 of 44 13/04/2021
 extension
Contract No. H2020 –777640

3.1.2 IMPROVEMENTS ON THE RECOMMENDATION SYSTEM
The recommendation system implemented and described in D3.3 aims at providing personalized
recommendations of POIs that a user could visit on a certain itinerary. This system includes not only the
main recommendation model, responsible for predicting the best POIs that a user could visit, but also a
filtering mechanism which is responsible to filter the recommendation system’s output without changing
the core recommendation system’s algorithm. This filtering mechanism, as described in D3.5, takes into
consideration the output of the Activity Prediction module, introduced and described in D2.2, and the GPS
coordinates of the destination of user’s trip and filters the recommended POIs. The scope of this
mechanism is to provide personalized suggestions to the users, in order to increase user satisfaction,
enhance their online experience and increase the popularity of the application. This recommendation
system has been also extended as described in D5.4 aiming to support group recommendations. In this
section, the improvements proposed concern the recommendation system in general, either if it provides
personalized or group recommendations.
One first improvement, resulted from the evaluation results, concerns the update of the visual aesthetics
of the list where the POIs are provided (i.e., “Activities” tab within the My-TRAC application). This list
could be enhanced with additional information, such as the contact details of a POI or if a POI is accessible
from people with disabilities. Alongside, this interface could be more attractive to the user, by including
images of the POI, if they are available, or an image depicting the rating predicted by the recommendation
system for each POI. In this way users will have more information available helping them deciding the POI
that they will visit, giving thus an advantage in the recommendation system and the application.
A second improvement concerns the filtering mechanism included in the recommendation system.
Currently this filtering mechanism uses both the Activity Prediction mechanism’s output and the
calculation of the distance between the POI and the user in all cases. In a future improvement, the users
should be able to handle this filtering through the application. The users should be able to select from the
application id they want the POIs to be filtered using the Activity Prediction mechanism and the range in
which the POIs recommended should be included (e.g. the recommended POIs should be in range of 5km
close to the user). Additionally, the users should be able to filter the amenities of the POIs recommended
in real time through the application, allowing them to view POIs from several amenities and select the
one that better fits their preferences. This addition aims to increase user satisfaction and make not only
the recommendation system a more valuable asset for the users, increasing also user experience.
From technical perspective, the recommendation system could be extended and evaluated using
additional information as input concerning the user’s profile. Currently, the recommendation system’s
core algorithm receives as input information demographic information about the users (e.g. gender,
occupation, age) and the preferences of the users through the ratings they provide via the My-TRAC
application. The proposed extension includes the extension of the list of inputs in the recommendation
system’s core algorithm aiming to include more information about the user, such as the POI’s amenities
that they like mostly to visit (i.e., cinemas, restaurants, etc.) and information about the times that they
have visited a POI. For the support of such an addition, extensions on the application’s side in order to be
able to retrieve such data should be implemented. These additional inputs might lead to more
personalized recommendations and to increased user satisfaction.

 D6.3 Roadmap for application improvements and
 Page 5 of 44 13/04/2021
 extension
Contract No. H2020 –777640

3.1.3 IMPROVEMENTS ON THE ACTIVITY PREDICTION MECHANISM
Currently, to predict the user’s anticipated activity, the Activity Prediction mechanism takes into
consideration a set of parameters. These parameters are:

 • User’s demographic attributes (i.e., gender, age, marital status, occupation)
 • System parameters (i.e., day and month of prediction)
 • Sequences of daily activities performed by a user. For each sequence, the information needed is:
 o Activity type
 o Activity’s duration.
For the creation of a user’s sequence of daily activities, information about the activity type a user
performs daily need to be available and on an hourly basis.
Currently, the user has the ability to provide feedback for the predicted activity type and correct it only
when s/he creates a trip. The user can provide feedback for the predicted activity and correct it through
the evaluation window described in D2.5, which is integrated in My-TRAC application. However, the user
does not have the ability to provide feedback for the other activities predicted in the rest of the day
aiming to fill in the user’s daily schedule.
An improvement of the Activity Prediction mechanism would be the retrieval of live feedback of the
activity type a user performs hourly through an additional interface or mechanism. Aiming to increase the
accuracy of the model’s prediction of the user’s anticipated activity, an additional source of information
concerning the user’s daily schedule could be used in order to provide to the model the activity type a
user performs on an hourly basis. This source could be either another application (e.g. calendar), or a
mechanism who will ask for feedback from the user throughout the day. This information could be used
not only for the creation of the user’s daily program that would be inserted into the model, but also could
be used as a correction plan in order to correct the output of the Activity Prediction mechanism and
update the user’s daily schedule. With this improvement, the Activity Prediction mechanism can be
dynamic and follow the user’s updated daily routine in order for the Activity Prediction mechanism to be
used under any circumstance.
Apart from the aforementioned improvement, the Activity Prediction mechanism could be extended in
order to support the prediction of additional categories of activities than the ones currently included. In
this context, the user should also be able to enter his/her own categories of activities through an interface
without restriction. This extension aims to allow users better select activities and insert the exact activity
type they perform, in order to create a more personalized mechanism, where the system will be able to
predict the anticipated activity type from the activity categories each user defines for him/herself.

 D6.3 Roadmap for application improvements and
 Page 5 of 44 13/04/2021
 extension
Contract No. H2020 –777640

3.2 ROUTE CHOICE MODEL

3.2.1 INTRODUCTION
As discussed in deliverable D6.2, the route choice model was tested using a virtual (stated choice)
experiment where 500 participants were asked 15 questions where they had to pick their preferred
itinerary over a set of itineraries. Due to the Covid-19 situation, not enough data was collected through
the app, and the virtual experiment was an alternative way of gathering sufficient data for testing the
route choice model. After testing it, one could say that the route choice model is valid: the explanatory
variables are relevant, and the model can predict the user’s choice to a certain extent.
In the My-TRAC app, the route choice model is calibrated per individual, meaning that the
recommendations provided by the model are personalised. However, in the validation of the route choice
model described in deliverable D6.2, the model was calibrated on the population sample instead of being
calibrated for each individual, and the personalisation feature of the route choice model was therefore
not tested. Calibrating the model at the individual level requires sufficient number of observations per
individual, while only 15 questions were asked per individual during the virtual experiment.
The personalisation feature implemented in the app still needs to be tested. It should improve
significantly the predicting power of the model: instead of predicting the user’s choice based on the
choices of all users (assuming that the user behaves as the average), the model predicts the user’s choices
based on the user’s previous decisions. Testing the performance of the personalisation feature would be
the first step of the further development of the route choice model embedded in the My-TRAC app. If the
personalisation feature is effective, several improvements could be implemented to increase even more
the predicting power of the model, such as including more explanatory variables in the model, or
personalising the OpenTripPlanner request depending on the user’s preferences. These improvements
are further discussed in the following subsections.

3.2.2 IMPROVE THE MODEL’S PERFORMANCE BY ADDING MORE EXPLANATORY VARIABLES
Currently, to predict the traveller’s choice, the route choice model considers the in-vehicle time, the
walking time, the waiting time, and the number of transfers. Other trip attributes can affect the user’s
choice, and including these attributes in the model could improve the accuracy of the model’s predictions
if done properly. For instance, the model could potentially integrate the transit mode (train, bus…), or
the weather conditions in the modelling.
The route choice model does not differentiate trips regarding transit mode, while this information is
displayed to the user in the app, and it can have an impact on the user’s choice. For instance, some users
might prefer taking the train than the bus, and modelling these preferences could improve the model’s
predictive power. The effect can be constant (intrinsic to the mode), if the impact of the transit mode on
the behaviour does not depend on anything else. It can also interact with another variable (for instance
if in-vehicle time by bus is not perceived the same as the in-vehicle time by train). In the first situation, the
effect is modelled by a constant, while in the second situation, the in-vehicle time parameter is estimated
for both the bus and the train. Equation 1 shows a model where using a specific mode k is represented by

 D6.3 Roadmap for application improvements and
 Page 5 of 44 13/04/2021
 extension
Contract No. H2020 –777640

the binary variable (for instance is 1 if the train is taken, 0 otherwise). In this example, the in-
vehicle time impedance depends on the transit mode (there is one parameter for the in-vehicle time for
each possible mode), the number of transfers and the waiting time impedance do not depend on the
transit mode, and the train has an intrinsic impact on the traveller’s choice. Before integrating such
feature in the model, one should determine whether the mode indeed has an impact on the traveller’s
choice, and the impact should be assessed in detail before integration.

 = ∙ + ∙ + ∙ + ∑ ∙ − ℎ, ∙ − ℎ Equation 1

The weather can also affect the traveller’s behaviour [1] [2]. For instance, if the weather is rainy or cold,
the traveller could penalise more the walking time than in a sunny and warm day. One can represent this
effect by using the method described in the paragraph above where the walking time impedance would
depend on the weather.
The transit mode and the weather are examples of variables that could potentially improve the model’s
predictions. One could think of other variables to integrate in the route choice model. The procedure
would be to continuously track the model’s performance, identify potential flaws in the output, and
improving the model accordingly. For instance, if bus itineraries are systematically undervalued by the
traveller compared to train itineraries with similar characteristics, one could see if a constant penalising
travelling by bus improves the model’s performance. However, adding a new variable is cumbersome
since the analyst should also perform significance tests on the estimators, and find the most suited
functional form for the model. Adding inappropriate variables could affect negatively the model’s
predicting power.

3.2.3 PERSONALISING THE OPENTRIPPLANNER REQUEST
The routing algorithm in the My-TRAC app relies on the OpenTripPlanner open-source project [3], which
allows to specify how the traveller perceives the different characteristics of trips (walking time, waiting
time…), and suggests itineraries accordingly. When a traveller asks for itineraries between a starting and
a destination point, the My-TRAC app casts an OpenTripPlanner request, with parameters1 (such as
starting and destination location), and OpenTripPlanner returns a set of itineraries that best fit the
request. The list of parameters is exhaustive, and some could be used to personalise the request based
on the user’s preferences. For instance, the parameter walkReluctance indicates how long is the walking
time perceived compared to the in-vehicle time. If this parameter is set to 2, one minute of walking time
is considered twice longer when the fastest path is determined by OpenTripPlanner. This allows to
represent the travel time perceived by the user, opposite to the actual travel time.
Fortunately, the route choice model can assess the perception of the different trip components (in-
vehicle time, walking time, waiting time, and number of transfers) by the user, by expressing the walking
time, the waiting time and the number of transfers in equivalent in-vehicle time. For instance, in
deliverable D6.2, the results from the model’s validation show that, on average, users are willing to

1
 The list of parameters can be found at http://dev.opentripplanner.org/apidoc/1.0.0/resource_PlannerResource.html

 D6.3 Roadmap for application improvements and
 Page 5 of 44 13/04/2021
 extension
Contract No. H2020 –777640

perform an extra transfer if it reduces the in-vehicle time by 10 minutes (assuming that the waiting and
walking times remain the same); one transfer is therefore equivalent to an extra 10 minutes of in-vehicle
time. Similarly, one could use the model to find how much in-vehicle time is equivalent to one minute of
walking time, or to one minute of waiting time. These values could then be added to the OpenTripPlanner
request as walkReluctance, waitReluctance and transferPenalty2 (see Table 1). The routing algorithm in
OpenTripPlanner would then suggest the fastest itineraries in terms of perceived travel time, instead of
actual travel time.

 Table 1: Description of three OpenTripPlanner parameters that could be used to better represent the perceived
 travel time.

 Parameter in OpenTripPlanner Description
 walkReluctance How much longer is perceived one minute of walking
 time compared to one minute of in-vehicle time.
 waitReluctance How much longer is perceived one minute of waiting
 time compared to one minute of in-vehicle time.
 transferPenalty The burden of performing one transfer, in in-vehicle time
 unit.

Let’s suppose that the walkReluctance and the waitReluctance parameters are set to 2 and 1 respectively,
while the transfer penalty is set to 5 minutes. The perceived travel time can be computed using Equation
2. Then, if two itineraries A and B are possible to go from the starting point to the destination point (see
Table 2), itinerary B with a smaller perceived travel time will be displayed before than itinerary A, even
though itinerary A is faster in terms of actual travel time. The fact that the traveller has to transfer once
makes itinerary A less interesting for them, according to the OpenTripPlanner parameters taken in this
example.
 = ∙ + ∙ + − ℎ + ∙ Equation 2

 Table 2: Example of two itineraries with different trip components

 Itinerary Walking time Waiting time In-vehicle time Number of Actual travel Perceived
 transfers time travel time
 A 5 2 22 1 27 40
 B 5 2 25 0 32 37

3.3 TIME OF DEPARTURE AND MODE CHOICE MODELS

2
 More info on http://dev.opentripplanner.org/apidoc/1.0.0/resource_PlannerResource.html

 D6.3 Roadmap for application improvements and
 Page 5 of 44 13/04/2021
 extension
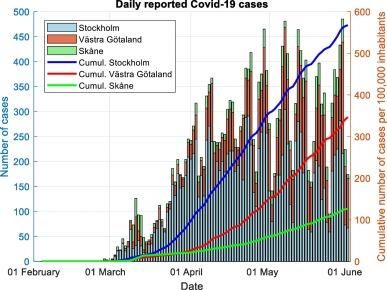
Contract No. H2020 –777640

3.3.1 EVALUATING THE MODE CHOICE AND TIME OF DEPARTURE CHOICE MODELS
This section summarizes the evaluation process of the choice models with the given revealed-choice live
pilot input. As explained, the data input was not adequate for achieving the goals of the evaluation, since
the minimum requirements (see D6.2) were not met by the end of the second phase of the live pilots. The
structure and formulation of the models per se are described in more detail in deliverables D2.3 and D2.5.
The live pilot experiment aimed to collect revealed choice data across all pilot sites for the Mode Choice
and Time of Departure Choice models to evaluate the models in the following ways:

 • Validate (or reject) the assumptions made regarding the explanatory variables that were used for
 each country’s model.
 • Verify the accuracy of the models and assess their predictive precision.
 • Re-calibrate the models by appending the RP data of the pilots to the SP dataset of the survey.

Both models used are multinomial logit models (MNL), meaning that they are using logistic regression
methods to capture the effect that the explanatory variables have on the dependent variable. The
existing design of the models contains parameters that are either related to the socioeconomic profile of
the decision-maker (e.g. age, gender, income), or related to the trip characteristics in each given situation
(duration, distance, purpose). Each variable partakes into the estimation of the utility of each option for
the given instance for the given user. Ultimately, the option that is estimated to maximize the utility of
the proposed mode or time of departure is presented to the user, based on the weights of the models
and the values of the variables.
Given this approach, the existence of a pandemic can be represented as one additional variable that
affects decision making. The modelling question that arises is how one can insert it into the models to
comprehend, formulate and ultimately predict user behaviour under these circumstances. Does COVID-
19 equally affect public transport and car use? Are these effects complementary, or is the motorbike and
bicycle use also affected? Is the decision for time of departure affected by the pandemic? To what extent
are these choices affected from the pandemic?
Researchers have begun to address these questions in an attempt to grasp the effect of the pandemic on
the way that people travel. A study in Sweden conducted some initial exploratory analysis on the effect
of COVID-19 on public transport, where the effect of the pandemic can be seen to have a crushing effect
on the use of public transport, regardless of the fact that Sweden [4] followed a controversial strategy
of minimal preventive measures against the pandemic and no forced lockdowns. The sudden drop in
public transport use can be seen in Figure 12 in relation to the outbreak of the first cases in March 2020.

 D6.3 Roadmap for application improvements and
 Page 5 of 44 13/04/2021
 extension
Contract No. H2020 –777640

 Figure 12: The effect of COVID-19 in Sweden.

The three pilot sites of the live pilots, Athens, Barcelona, Lisbon, imposed significantly harder restrictions
and that led to a similarly dramatic decrease of public transport use. In order to capture the onset of the
effects of COVID-19 on public transport, the My-TRAC models could be reworked to include a parameter
that encapsulates the effect of COVID-19. Given the fact that the data collection precedes the
reformulation of the models, selecting a binary variable for the existence of COVID-19 or not should be
able to explain the entirety of the effect. A proposed structure of the Mode Choice model is presented in
Equation 3, Equation 4, and Equation 5 depicting the utility functions associated with the three modes.

 Equation 3
 = 0 + ∑ ∙ + +1 ∙
 =1

 Equation 4
 = 0 + ∑ ∙ + +1 ∙
 =1

 Equation 5
 = 0 + ∑ ∙ + +1 ∙
 =1

As the study suggests, the travel patterns of the citizens of Stockholm changed rapidly and remained at
this stable reduced state for the months following the outbreak. Therefore, a binary value representing
the presence or not of the pandemic appears to be a valid enough way of capturing the effect within a
variable. Unfortunately for the case of My-TRAC, the very low volume of trips that was collected during
the live pilot phase is not adequate to allow such a re-formulation of the models. It would be very
interesting to capture this phenomenon if a richer dataset were to be available for the analysis.
Variations of this formulation might prove to be also interesting from a modelling perspective. Asking the
users’ perception of the danger and their personal level of concern regarding the pandemic would
provide an extra dimension of personalisation, specifically regarding the pandemic. These perceptions
can similarly be included into the models which will then be able to partially attribute the travel choices
of travellers to the pandemic.

 D6.3 Roadmap for application improvements and
 Page 5 of 44 13/04/2021
 extension
Contract No. H2020 –777640

3.3.2 FUTURE CONSIDERATIONS
My-TRAC has been built to grasp the preferences and expectations of the users. The focus is not only on
maximizing the utility of each choice for the user, but also to maximize the happiness of making the best
subjective choice at the given moment. The subjective element of the My-TRAC recommendations is in
core of the logic and formulation of the models. The inclusion of questions that aim to extract the
individual perspectives of the user will allow the models to be in line with the disposition of providing
personalised recommendations. The user should willingly share his/her stance towards travel
preferences, towards grave issues such as the COVID pandemic, and also feedback on how good a
recommendation was. That way the models will be able to produce more accurate recommendations and
make one step closer to the goal of happiness optimization.
The implementation of a reformulation for the models, as described in section 3.3.1, enables the
personalisation of the recommendations and would manifest in many ways; i) first and foremost, the
model is built to provide recommendations according to who is performing the trip based on the personal
traits and preferences of the user ii) secondly, the trip characteristics affect the outcome of the models
leading to a different suggestion per each separate trip, iii) additionally, the algorithm gradually adapts
the recommendations to each user once there are multiple revealed choices for the user through the
personalisation mechanism that is described in D2.5, iv) with the last addition of the COVID perception
variable, the outcome of the models will be fine-tuned by the perceived influence of the virus on the
choices made by the user, v) the trip suggestions are optimized for the maximization of the subjective
happiness of the traveller.
In conclusion, the mode choice and time of departure choice models can provide recommendations
based on parameters which are adaptable and expandable to potential future changes. Adding variables
that account for parameters that affect decision-making is a process that is required if the models are to
remain relevant and up to date. The structure of the My-TRAC platform facilitates this approach as it has
been created following a building-block concept, meaning that individual components can be updated
separately while the app remains live. That opportunity enables a potential workflow of periodic updates
to the individual modules whenever that is needed. This brings in focus the fact that modelling human
behaviour is a challenging endeavour and the mathematical and computational means for predicting it
are tools that need to be sharpened frequently. The ever-changing landscape of potential external
barriers and the restrictions that affect the choices of travellers need to be monitored and subsequently
transferred into concepts which will lead to a continuous improvement of the My-TRAC services.

 D6.3 Roadmap for application improvements and
 Page 5 of 44 13/04/2021
 extension
Contract No. H2020 –777640

4 IMPROVEMENTS OF THE OPERATORS’ PORTAL

4.1 ADDITION OF STATIC GTFS CREATION/MANAGEMENT TOOLS
My-TRAC wants to increase engagement with Transport Service Providers (TSPs) and reinforce the value
chain between TSPs, users and the application. To achieve that, certain tools can be created in the scope
of allowing the creation and management of GTFS data, as determined through the focus groups.
Integrating those tools on Operators’ Portal (OP) will make it a data hub that interconnects the TSPs with
the user-facing information even more; TSPs can either upload their GTFS data on OP or create them anew
and those data can be consumed by the application.
The extension can be based on open source technologies (e.g., see
https://github.com/cbick/gtfs_SQL_importer or https://github.com/BlinkTagInc/node-gtfs ). Most GTFS
open source tools appear stagnant in terms of development, some being updated years ago, increasing
the programming requirements for creating said tools. Thus, the contribution made to the open source
community in the scope of developing/updating such tools will be significant.

4.2 ADDITION OF REAL-TIME GTFS CREATION/MANAGEMENT TOOLS
The OP already contains tools to upload real-time GTFS data for 2 categories (Trip Updates and Service
Alerts) and will be extended to include a third category, which is live Vehicle Positions. In this category,
live locations of vehicles are uploaded in a specific GTFS format, allowing the user to track the actual
position of the bus on a map. In addition, live vehicle positions can be used to provide analytics, such as
time of arrival estimation. Those analytics can be:
•Estimation of time-of-arrival. In the GTFS format, the update of the vehicle positions can be done
through Trip Updates, yet the process is highly verbose, requiring many manually inserted fields to have
information. With the vehicle position data at hand, the time of arrival of a vehicle to the next stops can
be estimated instead, automating the creation of Trip Updates, or even Service Alerts.
•Estimation of network characteristics. Through analytics, an estimation of the network characteristics
can be made, such as, estimating traffic flow (density, average speed, flow) and estimating network
issues (e.g., road blockage). This can benefit the TSP in terms of improving its planning activities and also
other 3rd parties that operate on the area (e.g., MaaS, travellers, traffic management centres).
The process of retrieving live vehicle position, however, is not an easy one. It will require either the
creation of an app that tracks the position of the bus (e.g., used by drivers or by travellers
[crowdsourcing]) or the integration of currently installed live vehicle position tracking to the OP (since,
usually TSPs install positioning devices on vehicles). My-TRAC will examine all avenues first, from a
business standpoint and second, from a technical standpoint, to determine the most efficient path to
follow.

 D6.3 Roadmap for application improvements and
 Page 5 of 44 13/04/2021
 extension
Contract No. H2020 –777640

4.3 APIS FOR DATA EXCHANGE
All processes of data creation in the OP are currently manual, requiring the user to login to the platform
and insert the data in forms. This process was commented on by TSPs during the focus groups, proposing
instead the use of APIs for data sent to OP. With that method, the TSPs would integrate the OP API in
their services and allow the sending of data in an automated fashion. This process is not simple, since the
data format needs to be studied (create a data structure for the APIs that is user friendly and efficient),
learning material for TSPs will have to be produced (in order to gain knowledge on how to use the APIs),
while the OP will need to be adapted to receive inputs from APIs (tackling security, erroneous data
formats and have high fault tolerance and robustness in service provision).
Irrelevant of the difficulties though, creating a robust and reliable API system for the OP will allow it to
tap into the IoT domain and obtain information from new sources that will lead to better service provision
and a unique value proposition for the TSPs.
In addition to the above, which discusses only the TSP to OP data flow, the opposite flow, from OP to
TSPs is also interesting. Two categories of APIs can be created in that regard; first, exchange aggregated
data on user choices essentially replacing the current “download data” functionality and second but most
interesting, send GTFS data to the operators in the form of exploring the GTFS dataset (similar to
https://www.navitia.io/ which resembles more of a Living Lab than a data hub the way OP is envisioned
to become).

 D6.3 Roadmap for application improvements and
 Page 5 of 44 13/04/2021
 extension
You can also read