Revised Vegetation Classification for Mount Rainier, North Cascades, and Olympic National Parks - DNR
←
→
Page content transcription
If your browser does not render page correctly, please read the page content below
National Park Service
U.S. Department of the Interior

Natural Resource Stewardship and Science

Revised Vegetation Classification for Mount Rainier,
North Cascades, and Olympic National Parks
Project Summary Report
Natural Resource Report NPS/NCCN/NRR—2021/2225

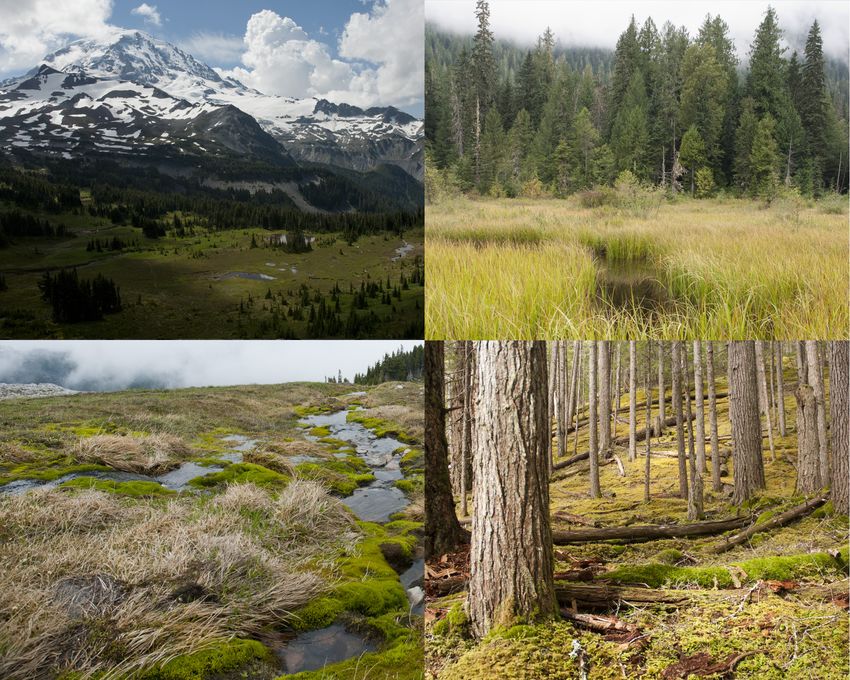
The production of this document cost $176,479, including costs associated with data collection, processing, analysis, and
subsequent authoring, editing, and publication.

ON THIS PAGE
The sun rises on a Carex spectabilis - Polygonum bistortoides Alpine Meadow in Fisher Basin, North Cascades National Park
Photograph by Tynan Ramm-Granberg

ON THE COVER
Clockwise from upper left: 1) A matrix of non-vegetated land cover (glaciers, scree, etc.), alpine turf communities, subalpine
woodlands, mesic herbaceous meadows, and high elevation wetlands on the north face of Mount Rainier; 2) Carex utriculata
Montane Marsh along the Chilliwack River at North Cascades National Park; 3) Carex nigricans - (Petasites frigidus var.
frigidus) / Philonotis fontana Seep in Spray Park at Mount Rainier National Park; 4) Pseudotsuga menziesii - Tsuga
heterophylla / Mahonia nervosa Forest near Royal Basin at Olympic National Park.
Photographs by Tynan Ramm-Granberg
Revised Vegetation Classification for Mount
Rainier, North Cascades, and Olympic National
Parks
Project Summary Report
Natural Resource Report NPS/NCCN/NRR—2021/2225

Tynan Ramm-Granberg,1 F. Joseph Rocchio,1 Catharine Copass,2 Rachel Brunner,3 Eric Nielsen3
1
 Washington Department of Natural Resources, Natural Heritage Program
1111 Washington St SE
Olympia, WA 98504-7014
2
 National Park Service, North Coast & Cascades Network
Olympic National Park
600 East Park Avenue
Port Angeles, WA 98362-6798
3
 Oregon Biodiversity Information Center
Portland State University
PO Box 751
Portland, OR 97207-0751

February 2021

U.S. Department of the Interior
National Park Service
Natural Resource Stewardship and Science
Fort Collins, Colorado
The National Park Service, Natural Resource Stewardship and Science office in Fort Collins,
Colorado, publishes a range of reports that address natural resource topics. These reports are of
interest and applicability to a broad audience in the National Park Service and others in natural
resource management, including scientists, conservation and environmental constituencies, and the
public.

The Natural Resource Report Series is used to disseminate comprehensive information and analysis
about natural resources and related topics concerning lands managed by the National Park Service.
The series supports the advancement of science, informed decision-making, and the achievement of
the National Park Service mission. The series also provides a forum for presenting more lengthy
results that may not be accepted by publications with page limitations.

All manuscripts in the series receive the appropriate level of peer review to ensure that the
information is scientifically credible, technically accurate, appropriately written for the intended
audience, and designed and published in a professional manner.

This report received formal peer review by subject-matter experts who were not directly involved in
the collection, analysis, or reporting of the data. Data in this report were collected and analyzed using
methods based on established, peer-reviewed protocols and were analyzed and interpreted within the
guidelines of the Inventory and Monitoring Program.

Views, statements, findings, conclusions, recommendations, and data in this report do not necessarily
reflect views and policies of the National Park Service, U.S. Department of the Interior. Mention of
trade names or commercial products does not constitute endorsement or recommendation for use by
the U.S. Government.

This report is available in digital format from the North Coast and Cascades Network Inventory and
Monitoring website and the Natural Resource Publications Management website. If you have
difficulty accessing information in this publication, particularly if using assistive technology, please
email irma@nps.gov.

Please cite this publication as:

Ramm-Granberg, T., F. J. Rocchio, C. Copass, R. Brunner, and E. Nielsen. 2021. Revised vegetation
classification for Mount Rainier, North Cascades, and Olympic national parks: Project summary
report. Natural Resource Report NPS/NCCN/NRR—2021/2225. National Park Service, Fort Collins,
Colorado. https://doi.org/10.36967/nrr-2284511.

NPS 105/175050, 168/175050, 149/175050, February 2021
                                                    ii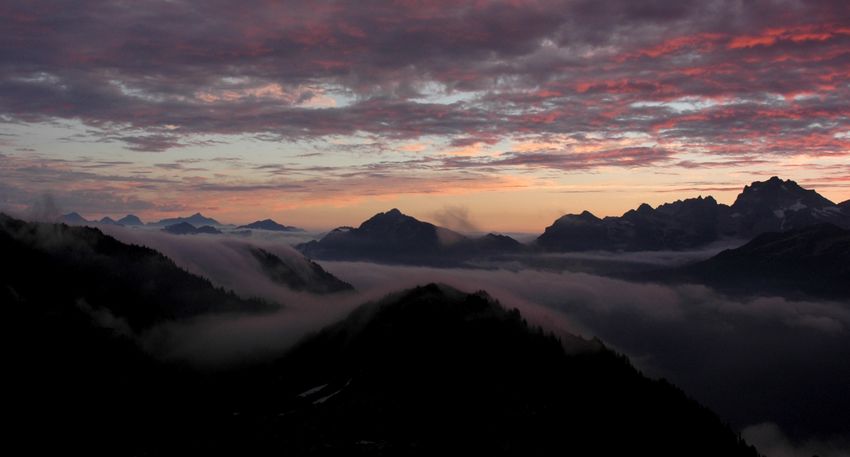
Contents
                                                                                                                                                      Page

Figures................................................................................................................................................... iv

Tables .................................................................................................................................................... iv

Executive Summary ............................................................................................................................... v

Acknowledgments................................................................................................................................. vi

Acronyms .............................................................................................................................................. vi

Introduction ............................................................................................................................................ 1

Methods.................................................................................................................................................. 2

       2009 Classification Phase ............................................................................................................... 2

            Initial Sampling Method ............................................................................................................ 2

            Initial Analysis and Plot Assignment to Types ......................................................................... 2

       Mapping Phase ............................................................................................................................... 3

       INR Analysis .................................................................................................................................. 7

       WNHP - USNVC Synthesis Phase ................................................................................................. 8

            Association Review ................................................................................................................... 8

            Wetland Group and Alliance Review ...................................................................................... 12

            Peer Review ............................................................................................................................. 13

            Updates to Key and Descriptions ............................................................................................ 13

Results .................................................................................................................................................. 14

Conclusions .......................................................................................................................................... 17

       North Cascades Sampling............................................................................................................. 17

       Wetlands ....................................................................................................................................... 17

       Sparsely Vegetated Alpine and Lithomorphic Communities ....................................................... 17

Literature Cited .................................................................................................................................... 19

                                                                             iii
Figures
Page
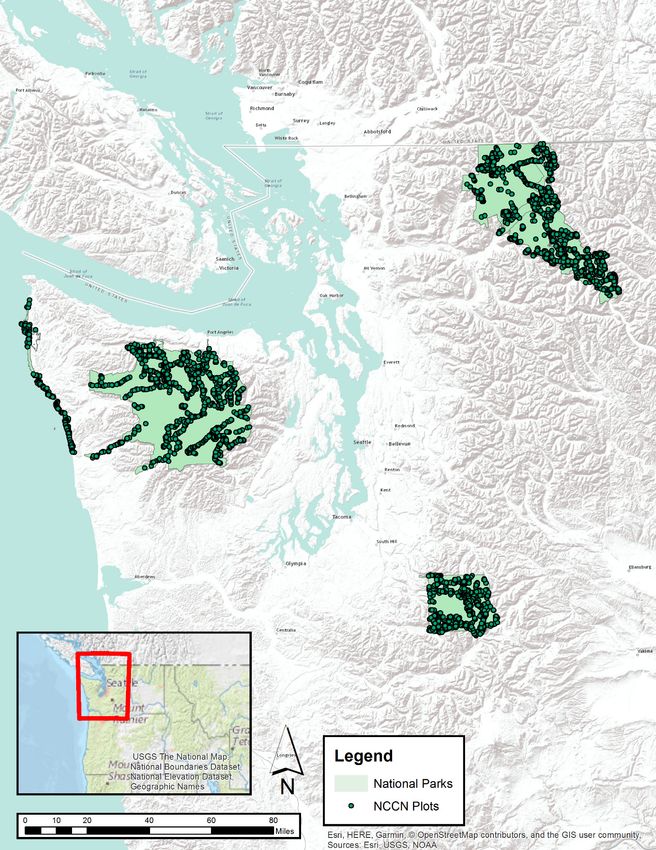
Figure 1. Map training data plots used in plant association analysis .................................................... 6
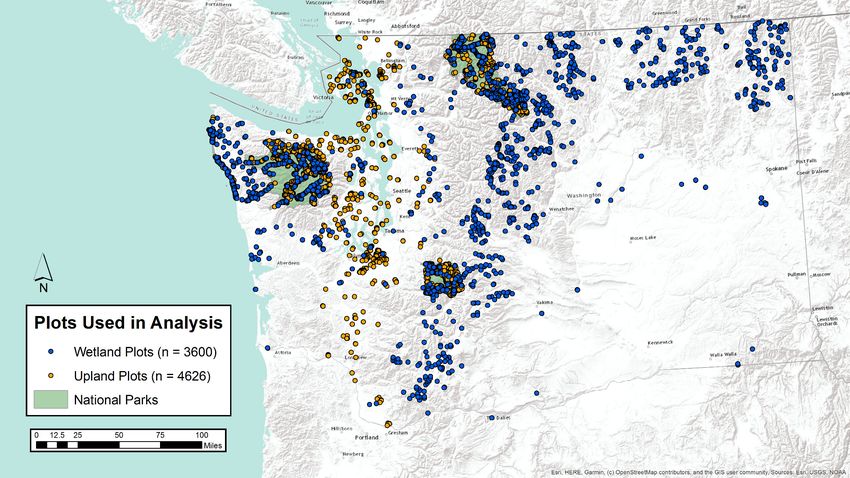
Figure 2. Map of full data set (upland and wetland plots) used in WNHP analysis. .......................... 11
Tables
Page
Table 1. Legacy plot data used in Crawford et al (2009) ...................................................................... 3
Table 2. Environmental variables used in analysis ............................................................................... 9
Table 3. Additional vegetation plot data sets used in analysis. ........................................................... 11
Table 4. Classifications lacking available plot data, but used for comparison with NCCN
types using summary tables and/or descriptions. ................................................................................. 12
Table 5. Groups prioritized for alliance review .................................................................................. 13
Table 6. Number of plant associations at MORA, NOCA, and OLYM by USNVC
division................................................................................................................................................. 14
Table 7. Breakdown of new, revised, and unchanged USNVC upland associations and
alliances by division. ............................................................................................................................ 15
Table 8. Breakdown of new and revised USNVC wetland alliances by division. .............................. 15
ivExecutive Summary
Field crews recently collected more than 10 years of classification and mapping data in support of the
North Coast and Cascades Inventory and Monitoring Network (NCCN) vegetation maps of Mount
Rainier (MORA), Olympic (OLYM), and North Cascades (NOCA) National Parks. Synthesis and
analysis of these 6000+ plots by Washington Natural Heritage Program (WNHP) and Institute for
Natural Resources (INR) staff built on the foundation provided by the earlier classification work of
Crawford et al. (2009). These analyses provided support for most of the provisional plant
associations in Crawford et al. (2009), while also revealing previously undescribed vegetation types
that were not represented in the United States National Vegetation Classification (USNVC). Both
provisional and undescribed types have since been submitted to the USNVC by WNHP staff through
a peer-reviewed process.
NCCN plots were combined with statewide forest and wetland plot data from the US Forest Service
(USFS) and other sources to create a comprehensive data set for Washington. Analyses incorporated
Cluster Analysis, Nonmetric Multidimensional Scaling (NMS), Multi-Response Permutation
Procedure (MRPP), and Indicator Species Analysis (ISA) to identify, vet, and describe USNVC
group, alliance, and association distinctions. The resulting revised classification contains 321 plant
associations in 99 alliances. A total of 54 upland associations were moved through the peer review
process and are now part of the USNVC. Of those, 45 were provisional or preliminary types from
Crawford et al. (2009), with 9 additional new associations that were originally identified by INR.
WNHP also revised the concepts of 34 associations, wrote descriptions for 2 existing associations,
eliminated/archived 2 associations, and created 4 new upland alliances. Finally, WNHP created 27
new wetland alliances and revised or clarified an additional 21 as part of this project (not all of those
occur in the parks).
This report and accompanying vegetation descriptions, keys and synoptic and environmental tables
(all products available from the NPS Data Store project reference:
https://irma.nps.gov/DataStore/Reference/Profile/2279907) present the fruit of these combined
efforts: a comprehensive, up-to-date vegetation classification for the three major national parks of
Washington State.
vAcknowledgments
This project builds upon the classification work of Crawford et al. (Crawford et al., 2009). The
National Park Service (NPS) North Coast and Cascades Network (NCCN) Inventory and Monitoring
program provided funding for this project. NatureServe senior ecologists M. Reid (retired), P.
McIntyre, and D. Faber-Langendoen provided USNVC resources and oversaw the peer review
process. Special thanks go to the field staff that collected the data, under frequently challenging
conditions: N. Anderson, W. Arneson, P. Barnes, C. Batey, W. Bennett, T. Brussel, R. Bryson, E.
Burke, W. Clark, I. Cunningham, D. Risako, J. deGuzman, P. Del Zotto, E. Derickson, C. Duncan,
H. Faulstich, A. Francis, D. Graham, L. Graham, R. Gwodz, M. Hansen, E. Hegarty, T. Hender,
M.Hiramatsu, M. Imman, S. Johnson, S. Kast, E. Keena-Levin, S. Koenig, E. Kohler, M. Lee, S.
McDonough, C. Meredith, C. Meston, T. Morrison, L. Moulton, A. Nabors, A. Nemeth, K. O’Neil,
G. Pappas, R. Peace, A. Peterson, E. Pruiksma, E. Raimundo, J. Runge, C. Schmidt, J. Smith, S.
Stowell, A. Tyson, J. Waite, B. Wallace, D. Wallace-Senft, M. Whisman, and L. Wise.
Acronyms
DBH - Diameter at Breast Height
EPA - Environmental Protection Agency
INR - Institute for Natural Resources
MMU - Minimum Mapping Unit
MORA - Mount Rainier National Park
NCCN - North Coast and Cascades Network
NOCA - North Cascades National Park
NPS - National Park Service
NVC - National Vegetation Classification
OLYM - Olympic National Park
SCAM - Species Cover - Association Match Tool
USNVC - United States National Vegetation Classification
WNHP - Washington Natural Heritage Program
viIntroduction
Plant communities can be described by patterns of species composition, structure, and/or growth
forms related to underlying ecological processes and environmental variables (United States National
Vegetation Classification 2019). The USNVC was created in order to provide a common language
for land management and conservation of these plant communities across the diverse landscapes of
the United States (Federal Geographic Data Committee 2008; Faber-Langendoen et al. 2016). The
USNVC is a hierarchical classification, with higher levels defined by broad growth form categories
and global macroclimate factors, middle levels incorporating additional physiognomic,
biogeographic, and broad floristic factors, and lower levels defined by increasingly narrow
similarities in floristic composition (Franklin et al. 2012).
Following Federal Geographic Data Committee standards, NPS Inventory & Monitoring Networks
use the USNVC as the basis for their vegetation maps. Vegetation mapping is a critical element of
NPS efforts to understand the range and long-term trends of natural resources in and around parks
(National Park Service 2018). In Washington State, the NPS is in the final stages of a project to
develop vegetation maps for all of the park units in the North Coast and Cascades Network (NCCN).
This network includes Mount Rainier (MORA) and Olympic (OLYM) National Parks, as well as the
North Cascades National Park Complex (NOCA). These large wilderness parks contain a wide range
of vegetation types, from bogs to high-quality conifer forests to alpine habitats. The first phase of
mapping work in the NCCN described and classified these varied vegetation types using the
USNVC. NCCN collaborated with the Washington Department of Natural Resources Natural
Heritage Program (WNHP) to produce an association-level classification for the three wilderness
parks, culminating in a plot- and literature-based report (Crawford et al., 2009) consisting of 375
upland and wetland plant associations. This included 171 provisional/preliminary types not yet
recognized in the nationwide USNVC.
The classification guided field data collection and provided descriptions of vegetation types that the
mapping technical team (Institute for Natural Resources, INR) later combined into coarser map
classes. During training data collection, field crews encountered previously under-sampled plant
communities and types undocumented in Crawford et al. (2009). INR’s comprehensive review of the
training plot data identified additional new associations not recognized in the USNVC (or Crawford
et al. 2009), as well as modifications to existing USNVC association concepts (such as changes to the
geographic range or floristic composition). INR also identified problematic sections of the field key
and association descriptions that may have led to inconsistent data. WNHP reviewed INR’s proposed
associations, provided region-wide context, and advanced proposed changes through a peer-review
process and into the USNVC. For wetland types, WNHP focused on revising USNVC groups and
alliances (higher levels of the hierarchy). This document and its accompanying descriptions, keys and
tables (Ramm-Granberg 2021a) represents an update of Crawford et al. (2009), promoting maximum
congruence between the final mapping products and the vegetation classification.
1Methods
2009 Classification Phase
Initial Sampling Method
Classification fieldwork began in 2005, focusing on known gaps in “legacy” data sets (see Crawford
et al. 2009, Appendix E) from existing regional vegetation classifications. Sampling methodology
combined guidance from the NPS Field Methods for Vegetation Mapping (The Nature Conservancy
& Environmental Systems Institute Inc. 1994), WNHP protocols, and USFS methods (Henderson &
Lesher 2003). Field crews established fixed-radius plots in patches of homogeneous vegetation, with
size dependent on vegetation structure. Forested plots were 400 m2, shrublands were 100 m2, and
dwarf-shrub, herbaceous, and sparsely vegetated plots were 50 m2. Within each plot, crews collected
environmental data, including aspect, slope, elevation, landform, microposition, macroposition,
apparent hydrologic regime, and topographic moisture (a moisture availability index that relates
concavity/convexity at the plot scale to relative slope position) (Henderson & Lesher 2003). Crews
dug a shallow hole at each site in order to characterize the soil, recording the texture and color of
each horizon.
Field staff characterized the vegetation at each plot by recording the physiognomic class (forested,
shrubland, etc.), dominant leaf-type (coniferous/deciduous), and the cover of dominant species (for
each stratum). When possible, association descriptions and keys were used to assign an association
call and, if not, a preliminary name for the undescribed type was recorded. Crews collected full
ocular species lists, including canopy cover (in classes). Ground stratum bryophyte species were
recorded when their cover exceeded 1%, but those growing on logs were excluded.
Initial Analysis and Plot Assignment to Types
Crawford et al. (2009) evaluated 3396 plots and assigned these to 375 association concepts. The data
set consisted of 917 new NPS classification plots and 2479 “legacy” plots pulled from historical data
sets (Table 1). All legacy data sets used in the classification were required to have near-complete
vascular species lists, with cover values and plot sizes that scaled with different vegetation types (e.g.
larger plots in forests) (Crawford et al. 2009). Of the 375 association concepts in Crawford et al.
(2009), 171 were accepted in the USNVC as of 2019 (hierarchy 36, USNVC v2.03), while 204
remained as preliminary/provisional associations. Plot data were managed in VPRO, a Microsoft
Access-based program developed and managed by the British Columbia Ministry of Forests
Research Branch (Mackenzie & Klassen 1999).
2Table 1. Legacy plot data used in Crawford et al (2009). This does not contain legacy data sets that were
evaluated, but failed to meet minimum criteria for the classification.
Park Project Name / Principal Investigator Reference
Edward’s Mt Rainier Vegetation Plots G. Rochefort, NPS, Unpublished Data
MORA Hamann Thesis Hamann (1972)
Franklin Franklin et al. (1988)
Belsky Belsky & Del Moral (1982)
Goat Reconnaissance Plots Houston et al. (1994)
OLYM Woodward LTEM Vegetation Survey - Elwha River A. Woodward, USGS, Unpublished Data
Kunze Wetland Classifications Kunze (1989, 1990, 1991, 1994)
Henderson - USFS Classification Henderson et al. (1979)
Plots not clearly assignable to preexisting types from the literature and/or USNVC were analyzed
using the following procedure (adapted from Crawford et al. 2009):
1) Plots subset into physiognomic classes: tree-dominated (> 25% tree cover), shrub-dominated,
dwarf-shrub-dominated, herbaceous-dominated, and sparsely vegetated (< 25% total vascular
plant cover). Note that these initial classes do not align with current USNVC standards that
place the cutoff for sparse/rock vegetation at 10% vascular cover (Faber-Langendoen et al.
2016). This disparity was taken into account during subsequent WNHP analyses.
2) Physiognomic classes were subdivided by PCA (Pearson 1901; Hotelling 1933; Jolliffe 2002)
or other clustering technique.
3) Evaluated subdivisions with TWINSPAN (Hill 1979) and/or stand table manipulation and
compared them to preexisting types in the USNVC or existing literature.
4) Assigned plots individually to existing associations or preliminary/provisional types.
5) Incorporated feedback from NPS field crews and staff and prioritized additional sampling.
For more detail on field and data analysis methods used in the initial 2009 classification, please
consult Crawford et al. (2009).
Mapping Phase
NPS and INR staff collected map model training data at MORA, OLYM, and NOCA from 2008-
2014. The methodology evolved somewhat as the project advanced, with new challenges and insights
arising during the modeling process. However, for this classification update, we analyzed only those
plots with reliable GPS points at plot center and near-complete to complete species lists with cover
values.
Field sampling consisted of four types of plots, with key differences from the earlier classification
phase:
31) Navigational Plots— Field crews traveled to predetermined GPS points of varying “cluster
types”. At each park, field crews targeted fifty clusters of unique geographic, topographic,
and spectral conditions, aiming to capture the full range of ecological and spectral variation.
Points were selected from relatively large patches of the same cluster, with the goal of
representing patches of homogeneous vegetation and/or structure.
2) Opportunistic Plots—These were selected and sampled by field crews. Selection focused
large patches vegetation that appeared homogeneous on the ground and in aerial imagery.
Crews were instructed to avoid ecotonal and highly disturbed areas (unless the disturbed area
supported a distinct plant community, such as an avalanche chute shrubland). Opportunistic
plots were primarily used to increase the sample size of uncommon vegetation types that
were not well represented in navigational or verification plots.
3) Verification Plots—These were revisits to plots used in the initial classification. Verification
plots confirmed that the same vegetation was still present at that location and allowed
collection of additional data to compliment map model training. Field crews assigned an
association using the most up-to-date keys and mapped the extent of the vegetation patch, up
to and exceeding a 40m radius (since classification plots had smaller, fixed radii).
4) Distance Plots—Some vegetation (e.g. Nuphar polysepala Aquatic Vegetation) or abiotic
patches (lakes, talus, etc.) could be identified visually at a distance. These plots did not
include full species lists and were not included in this analysis.
Aside from distance plots, all data were collected in the same manner: Crews recorded a GPS point,
assigned a plant association using keys developed during the classification effort, and assigned a
confidence level to the association call. Alternate calls were permitted and encouraged. The
homogeneous vegetation patch was measured in each cardinal direction, with the plot ending at a
40m radius (0.5 ha), or whenever the association call would change. The minimum plot area for
shrub and herbaceous types was 100 m2 (~5.6 m radius) though this requirement was relaxed slightly
for certain rare types. Sub-cardinal directions were also measured when incursions of other
vegetation types were noted in those quadrants. If the plot could not be keyed to an existing plant
association, it was recorded as “undescribed” and a provisional name was assigned. Small inclusions
(no greater than 20% of total area) of different plant communities were permitted, but species and
environmental data from inclusions were not included in the overall plot.
Whenever possible, plots were located in stands that exceeded the standard minimum mapping unit
(MMU) of 0.5 ha (1.24 ac). Of course, some associations were never found to occur in such large
patches, but most met the guidelines established in the NPS Field Methods for Vegetation Mapping
(The Nature Conservancy & Environmental Systems Institute Inc. 1994).
Environmental data collected at each plot included: microposition, slope, aspect, standard fuel model
(Scott & Burgan, 2005), and whether the site was riparian, in an avalanche chute, or had experienced
some other significant disturbance such as fire or beetle-infestation.
4Vegetation cover data were collected for overstory trees (> 5m), understory trees (< 5m), shrubs, and
herbaceous plant species, estimated to the nearest percent. Crews identified all tree and shrub species
and estimated average diameter at breast-height (DBH) for all overstory trees. Nearly all herbaceous
species were identified, but plots were not always exhaustive—some plants present in trace amounts
were only identified to the genus level, or frequently not recorded. Nonvascular cover was recorded,
but individual species were generally only identified when those species were diagnostic dominants
of the plant association (e.g. Racomitrium canescens - (Penstemon davidsonii) Nonvascular Rock
Vegetation). This limits our ability to differentiate vascular-species-poor associations that may have
nonvascular differential species (e.g., perhaps some forest associations in G751 North Pacific
Western Hemlock - Sitka Spruce - Western Red-cedar Seasonal Rainforest). One other possible data
gap of note is that Pseudotsuga menziesii individuals were not identified to the variety level. The
study area straddles a region in which both var. menziesii and var. glauca may occur and the presence
of one or the other may be used as an indicator of Vancouverian or Rocky Mountain floristic affinity
of the plant community as a whole.
In the end, more than 6000 training data plots were collected. Of those, approximately 4400 had
relatively complete species lists and passed other Q/A protocols necessary for inclusion in this
analysis (Figure 1).
5Figure 1. Map training data plots used in plant association analysis (n = 4403).
6INR Analysis
While the vegetation maps were not made at the association scale, associations were rolled up into
map classes that could then be mapped across the parks at the MMU (0.5 ha). When INR staff began
applying these troves of new plot data to map model development, it became apparent that certain
changes to the underlying classification (Crawford et al. 2009) might not only improve the quality of
the map, but also improve the ecological and floristic clarity of some of the component associations.
First, INR used floristic cluster analyses of the mapping data to search for alternate groupings of
plots—groupings that were more readily mappable than the original association calls made in the
field (Institute for Natural Resources, 2017). Cluster analyses used k-means classification in the
‘vegclust’ and ‘vegan’ packages in R, with log (+1) transformed species cover data and Euclidean
distance measures (Institute for Natural Resources, 2017). INR then reviewed the resulting clusters to
see if the component plots shared ecological characteristics, particularly those characteristics
explicitly used to help differentiate associations in the Crawford et al. (2009) classification (fire
history, landscape position, aspect, biogeography, etc.) (Institute for Natural Resources 2017). This
helped to identify groups of plots that not only mapped well together, but were also ecologically and
floristically coherent. For the most part, these groupings divided “catch-all” associations such as
Ceanothus velutinus Shrubland and/or formerly under-sampled types such as non-forested wetlands.
INR dubbed these new groupings “mapping associations”.
Second, INR used an iterative cluster analysis approach that they termed “Species Cover -
Association Match” (SCAM). In this approach, they used multivariate analysis to calculate the
centroid of each Crawford et al. (2009) association based on the floristic composition of its plots,
then calculated the distance from each plot to each centroid and summarized these in ranked lists
(Institute for Natural Resources 2017). INR individually reviewed plots that were closer to the
centroid of a different association than the one assigned by the field crews. Such plots were then
reassigned to their closer SCAM-match only if they also matched the setting and structure of that
association. This whole process was then repeated iteratively, using centroids that included
association call changes arising from the previous round of SCAM. These analyses again used the
‘vegclust’ R package, with a log (+1) transformed matrix of species data. INR chose to weight trees
(3x) and shrubs (2x) in an effort to match the structural hierarchy of the USNVC (Institute for
Natural Resources, 2017). SCAM proved to be a valuable data validation mechanism, as it helped
identify outlier plots resulting from recent disturbance, human data collection error, and varying
interpretations of the association key and descriptions, etc.
After reassigning plots using the SCAM cluster analysis, INR condensed and summarized the results
by producing “similarity ratios” for each “mapping association”. These ratios were produced by
taking the average distance (in floristic space) for all plots within a given mapping association to the
centroid of an alternate (“incorrect”) association, and then dividing that by the average distance to the
assigned (“correct”) association. Note that these ratios are purely descriptive in nature and did not
factor into the creation of the mapping associations themselves, but they proved useful in illustrating
the relationships between mapping associations.
7INR also produced indicator species values (both single-class and pairwise) for each association
(Dufrêne & Legendre 1997). Single-class results measure the indicator value of a species when
comparing a given association to all other plots combined, while pairwise results measure the
indicator value of a given species in a head-to-head comparison of two associations. The statistics
calculated were: positive predictive value (having found this species, likelihood that one is in the
target association), sensitivity/constancy (likelihood that one would find this species in the target
association), and indicator value (√(Predictive Value*Sensitivity)). All values were calculated using
the function ‘multipatt’ in the R package ‘indicspecies’ (Dufrêne & Legendre 1997) and only results
with p-values < 0.05 were retained.
WNHP - USNVC Synthesis Phase
Association Review
WNHP was consulted to determine which of the new and modified types, dubbed “mapping
associations” in INR documents, fit the criteria for USNVC plant associations within a region-wide
context. These types were then moved through the peer-review process. Some types that were
lumped together for mapping purposes by INR remain ecologically distinct plant associations from a
classification perspective. These types may occur in patches that are too small to be mapped using a
modeling approach, or mapping via a modeling process might require data layers that are not
currently available (e.g. water table depth). Other types created in the INR reclustering process
represent distinct new associations arising from the vastly expanded data set. In addition, INR
proposed various association name changes and description updates that we also reviewed.
INR provided a crosswalk describing modifications made to the original Crawford et al. (2009) plant
association concepts over the course of the mapping project. WNHP reviewed this in concert with the
draft INR descriptions and original Crawford et al. (2009) descriptions. We also consulted floristic
similarity indices and ecological setting summaries provided by INR. During this initial review, we
updated the current EL code, name, and hierarchy placement for each type that already existed in the
USNVC, noted if it was an upland or wetland type, and made minor name changes to abide by
USNVC conventions.
WNHP analysis began by comparing updated INR constancy tables with those produced for
Crawford et al. (2009). We also reviewed synonymous types for regional context and descriptions
from USNVC.org and other NatureServe resources for global context on each of these types. We
used Nonmetric Multidimensional Scaling analyses (NMS) (Mather 1976; Kruskal & Wish 1978;
McCune et al. 2002; McCune & Mefford 2011) to compare each association with floristically similar
types. We ran NMS using the Sørensen (Bray-Curtis) distance measure, random starting
configurations based on the time of day, 250 runs with real data, and a stability criterion of 0.000001.
We chose the number of dimensions beyond which additional axes provided only minimal reductions
in stress and checked this using Monte Carlo tests (Metropolis & Ulam 1949). Multi-response
Permutation Procedures (MRPP) analyses were then used to confirm the degree of difference (Mielke
Jr et al. 1976; McCune et al. 2002; McCune & Mefford 2011). We used Sørensen (Bray-Curtis)
distance measures to match the ordination being assessed (McCune et al. 2002). Species cover data
were log (+1) transformed, but we also confirmed that the use of raw data or Beals smoothing (Beals
81984) did not meaningfully impact the interpretations in a selection of test cases. Plot-level data were
consulted when individual outliers arose. Lastly, we used Indicator Species Analysis (ISA) (Dufrêne
& Legendre 1997) to identify diagnostic/differential species for each association relative to other
associations within the same alliance (whether tentative, or confirmed). ISA was performed using
quantitative responses (Dufrêne & Legendre ISA eqn. 1), a randomization test, 4999 runs, and a
‘time of day’ starting seed. All WNHP statistical analyses and ordinations were done using PC-ORD
v.7.03 (McCune & Mefford 2011). The general idea of this process was to confirm that the distinct
types identified through INR’s clustering process and SCAM tool were corroborated via another
method that was already widely used and accepted.
In addition to standard environmental measures like aspect, slope, and elevation, INR calculated a
number of environmental variables in the course of their modeling process. While these were not
used in the INR analysis of the classification, WNHP fit and tested vectors for environmental
variables through the NMS plots. The environmental data proved useful in helping to interpret some
of the NMS axes and describe new associations and alliances. Environmental variables used in
analysis are described in Table 2.
Table 2. Environmental variables used in analysis. *Wetland plots only. †WNHP plots only.
Abbreviation Variable Notes
vd_river Vertical distance (m) above a river Based on hydrological flow accumulation modeled
using SAGA (http://www.saga-gis.org/en/index.html).
vd_perm Vertical distance (m) above nearest Based on hydrological flow accumulation modeled
permanent stream using SAGA (http://www.saga-gis.org/en/index.html).
tmax_jan Maximum temperature (°C) in January Based on PRISM 30 year normal. (PRISM Climate
Group, 2019)
tmax_jul Maximum temperature (°C) in July Based on PRISM 30 year normal. (PRISM Climate
Group, 2019)
ppt_jan January precipitation average (mm) Based on PRISM 30 year normal. (PRISM Climate
Group, 2019)
ppt_jul July precipitation average (mm) Based on PRISM 30 year normal. (PRISM Climate
Group, 2019)
tpp_300m/ Topographic position percentile An elevation percentile ranking relative to the area
1500m around a point (300m / 1500m radius). Range = 0 to
100.
curv_45m/ Convexity/concavity of the site A measure of curvature within 45m or 225m radius.
225m Range = -1 to 1. Positive values are convex.
dir_rad Daily direct radiation from the sun Scaled 0 (min) to 1 (max).
wetness Topographic wetness metric Scaled 0 to 1, with 1 being the wettest (along rivers)
utme UTM easting coordinate (m) Only useful for comparing associations w/i a single
park
utmn UTM northing coordinate (m) Only useful for comparing associations w/i a single
park
elev Elevation (m) Derived from USGS digital elevation model and park-
specific LiDAR
9Table 2 (continued). Environmental variables used in analysis. *Wetland plots only. †WNHP plots only.
Abbreviation Variable Notes
slope Slope (°) Derived from USGS digital elevation model and park-
specific LiDAR
eastness East-west component of aspect Scaled -1 to 1 (sin(aspect in radians), 1 = due east))
southness North-south component of aspect Scaled -1 to 1 (-cos(aspect in radians), 1 = due south))
*Wetland_type Broad wetland type Ruderal, Riparian, Aquatic, Marsh/wet meadow,
Swamp, Shrub Carr, Intermediate fen, Poor fen,
Extremely Rich Fen, Bog, Bog Woodland, Seep/Spring
†HGM Hydrogeomorphic Wetland Riverine, Depressional, Slope, Floating Mat, Organic-
Classification Flat, Freshwater-Tidal, Depressional-Interdunal
Ecoregion Ecoregion Columbia Plateau, North Cascades, Northwest Coast,
West Cascades, East Cascades, Canadian Rocky
Mountains, Okanogan, Blue Mountains, Puget Trough
*Lithology General physical characteristics of the Based on WA DNR Geology data layers —
bedrock https://www.dnr.wa.gov/geologyportal
†pH pH Acidity
†Corrected_EC Electro-conductivity Corrected for pH
Because data collection methodology evolved over the 10-year span of fieldwork, not all plots had
thorough species lists. Only plots with relatively complete species lists were used in our analyses. For
these plots, one can assume that indicator species not represented in the data are truly absent. To
avoid excluding taxa commonly recorded at the genus level, INR chose to lump certain species
together during their classification and mapping procedures (e.g. sedges occupying similar habitats).
This was also done for certain species that can be difficult to differentiate and have similar ecological
requirements, such as Arctostaphylos uva-ursi and A. nevadensis. Species were generally
“unlumped” for our review. Plants identified only to the family level or higher were removed from
the data set if a finer post hoc identification was not possible.
For certain vegetation types, we had additional plot data on hand that we included in the analysis of
NCCN mapping and classification plots. WNHP has recently conducted extensive EPA-funded
wetland classification work (e.g. Rocchio & Ramm-Granberg 2017) and those plots were included in
wetland analyses. Additional data sets and their applications are described in Table 3. All data sets
had existing plant association calls (updated to current USNVC hierarchy 36, USNVC v.2.03), full
species locations, and (in most cases) GPS locations for modeling climate and topographic data
(Figure 2). Wetland associations were rekeyed using WNHP’s statewide wetland association key
(Rocchio et al. 2020). Some plots without GPS locations were used for certain uncommon types,
such as low-elevation balds, in which case it was not possible to evaluate abiotic correlates of
floristic separation.
10Table 3. Additional vegetation plot data sets used in analysis.
Reference Vegetation types / Location Plots (Full Data Set)
Kovalchik & Clausnitzer Eastern Washington and Gifford Pinchot National Forest 2111
(2004) US Forest Service Wetland Data
WNHP plot data Statewide wetlands 620
(Rocchio / Crawford)
Houston et al. (1994) Herbaceous, dwarf-shrub, and sparse subalpine/alpine 156
vegetation at OLYM
Chappell (2006a) Lowland western Washington vegetated balds 258
Chappell (2006b) Lowland western Washington forests 701
Chappell (1999) Olympic Peninsula riparian 129
Kunze (1989, 1990, 1991, Coastal wetlands, Puget Lowland bogs, Puget Lowland 488
1994) wetlands, West Cascades wetlands
Hawk (1973) Oregon riparian forests 54
Figure 2. Map of full data set (upland and wetland plots) used in WNHP analysis.
Even with these added data sets, it is important to note that we were unable conduct a full statistical
comparison across the full geographic range of many of the associations in question, particularly
those in the Rocky Mountain Forest & Woodland Division (1.B.2.Nb). Our study area covers only
the far western margin of where this division occurs. In many cases, we relied on comparison against
summary/synoptic tables (Table 4) or association descriptions to determine if apparently new types
from the parks simply represented variation within existing associations at the edge of their ranges.
11Table 4. Classifications lacking available plot data, but used for comparison with NCCN types using
summary tables and/or descriptions.
Reference Title
Lillybridge et al. (1995) Forested plant associations of the Wenatchee National Forest
Diaz & Mellen (1996) Riparian ecological types of the Gifford Pinchot and Mt. Hood National Forests,
Columbia River Gorge National Scenic Area
Wooten & Morrison (Wooten & Classification of vascular plant communities of the North Cascades using
Morrison, 1995) discrete space boundary analysis
Williams & Lillybridge (1983) Forested plant associations of the Okanogan National Forest
John et al. (1988) Forest plant associations of the Yakima Indian Reservation
Franklin (1966) Vegetation and soils in the subalpine forests of the southern Washington
Cascade Range
Douglas & Bliss (1977) Alpine and high subalpine plant communities of the North Cascades Range,
Washington and British Columbia
del Moral (1979) High elevation vegetation of the Enchantment Lakes basin, Washington
Henderson (1973) Composition, Distribution and Succession of Subalpine Meadows in Mount
Rainier National Park
Kuramoto & Bliss (1970) Ecology of subalpine meadows in the Olympic Mountains, Washington
Wetland Group and Alliance Review
For wetland plant communities, WNHP focused analysis on group and alliance-level changes to the
USNVC, rather than proposing a suite of new plant associations. This approach was taken for several
reasons:
1) In initial analysis, we recognized that several INR wetland mapping associations were
equivalent in scale to USNVC alliances. In other words, rather than representing new
associations, they lumped together multiple associations that WNHP still recognizes as
separate units.
2) All remaining proposed mapping associations were equivalent to state types already
recognized in the Washington state wetland classification (Rocchio et al. 2020). These state
types have not been advanced through the peer-review process, but they have provisional
USNVC hierarchy placements.
3) WNHP has long recognized that many USNVC wetland alliances are overly floristic in
nature—this project provided an opportunity to identify improved alliance concepts that
better capture ecological differences observed in the field.
4) Alliances are the mapping standard for NPS projects.
WNHP first reviewed our statewide wetland classification and, for each association, assigned a
probability of that type occurring at MORA, NOCA, and/or OLYM. The following probability
categories were used: Confirmed, High, Moderate, Low, or Not Present. USNVC groups with
“confirmed” or “high” probability associations were targeted for alliance analysis. From that subset,
WNHP prioritized review of groups containing INR wetland mapping associations (Table 5).
12Table 5. Groups prioritized for alliance review. *G284 was also analyzed.
Groups (# of INR mapping
Division associations to review)
1.B.3.Nc Rocky Mountain & Great Basin Montane Flooded & Swamp G505 (1)
Forest Division
1.B.3.Ng Vancouverian Flooded & Swamp Forest Division G507 (1) G851 (6) G853 (4)
2.C.2.Na North American Bog & Fen Division* G285 (3) G610 (2)
2.C.4.Nb Western North American Freshwater Shrubland, Wet Meadow G322 (8) G517 (3) G520 (3)
& Marsh Division G521 (1) G524 (1) G527 (3)
Wetland group and alliance analysis followed the same basic methodology as the review of upland
associations. NMS was used to compare floristic similarity and ecological patterns, MRPP was used
to confirm the degree of difference between groups/alliances, and ISA (along with basic synoptic
table review) were used to find differential species.
Peer Review
The USNVC peer review process is managed by the Ecological Society of America, NatureServe,
and other NVC partners. The NVC Review Board identified regional and associate editors with
whom WNHP worked to complete peer review of all proposed classification changes. Editors were
typically regional experts from academia, government agencies, or other individuals with expert
knowledge of the types in question. NatureServe staff assisted WNHP with the logistics of the peer
review.
Proposed changes were bundled based on USNVC divisions and presented to peer-reviewers at in-
person meetings and webinars. Peer-review feedback was then incorporated into final proposals that
were submitted to the regional editors. Classification updates will now be published in the
Proceedings of the National Vegetation Classification and reflected in the USNVC hierarchy
(http://usnvc.org) and WNHP’s BIOTICS database. For more information on the peer review
process, visit http://usnvc.org/revisions/.
Updates to Key and Descriptions
Due to changes in nomenclature and the USNVC hierarchy—including changes made by WNHP
through the peer review process—the keys and descriptions for all associations in Crawford et al.
(2009) were updated. Additional floristic and environmental information was incorporated when new
patterns came to light in the compiled plot data. Many new classification comments were added to
descriptions to help differentiate associations and alliances from similar communities in the USNVC.
New associations were also incorporated into the key and descriptions. The key was further modified
based on feedback from INR and field crews.
13Results
A key to the plant associations of Mount Rainier and Olympic National Parks and the North
Cascades National Park Complex are presented in Ramm-Granberg et al. (2021a), along with revised
association descriptions for all upland plant associations. As in Crawford et al. (2009), Ramm-
Granberg et al. (2021a) includes forested wetland associations and a selection of common wet
shrubland, peatland, marsh, and wet meadow associations. The remaining wetland types are also
described at the alliance level in Ramm-Granberg et al. (2021a).
Association and alliance descriptions are based on range-wide plot data and references, with a special
focus on their characteristics in NCCN park units. Of the 375 association concepts in Crawford et al.
(2009), 171 were accepted in the USNVC as of 2019 (hierarchy 36, USNVC v2.03), while 204
remained as preliminary/provisional associations. This 2020 update to the key contains a total of 321
plant associations, with 235 of those fully described (Table 6). The remainder are described at the
alliance level in Ramm-Granberg et al. (2021a) (48 wetland alliances). While most associations are
represented by plot data from the parks, 71 associations (22%) are based on non-NPS data alone (yet
remain likely to occur within park boundaries). The vast majority of those unrepresented types (63)
are wetland associations. There were 63 provisional/preliminary associations recognized in Crawford
et al. (2009) that were not subsequently supported by additional plot data—these have been excluded
from this classification update. Many of those unsupported provisional types are mentioned as
classification comments in the descriptions for similar, retained associations. There were 25
USNVC-recognized associations included in Crawford et al. (2009) that we no longer consider as
occurring in the parks. On the other hand, there are 62 associations in this classification that were not
included in Crawford et al. (2009) (11 upland and 51 wetland associations).
Table 6. Number of plant associations at MORA, NOCA, and OLYM by USNVC division.
# of Associations
Division (USNVC and State types)
1.B.2.Nb Rocky Mountain Forest & Woodland 28
1.B.2.Nd Vancouverian Forest & Woodland 85
1.B.3.Nc Rocky Mountain-Great Basin Montane Flooded & Swamp Forest 11
1.B.3.Ng Vancouverian Flooded & Swamp Forest 36
2.B.2.Na Western North American Grassland & Shrubland 28
2.B.2.Nd Western North American Interior Chaparral 3
2.C.2.Na North American Bog & Fen 32
2.C.4.Nb Western North American Freshwater Shrubland, Wet Meadow & Marsh 56
4.B.1.Nb Western North American Alpine Tundra 27
5.B.2.Na North American Freshwater Aquatic Vegetation 15
Total 321
14A total of 54 upland associations were moved through the peer review process and are now part of
the USNVC (Table 7). Of those, 45 were originally proposed in Crawford et al. (2009), with 9
additional new associations proposed by INR. WNHP also revised the concepts of 34 associations,
wrote descriptions for 2 existing associations, eliminated 2 associations, and created 4 new upland
alliances. WNHP created 27 new USNVC wetland alliances and revised or clarified the concepts for
an additional 21 (Table 8).
Table 7. Breakdown of new, revised, and unchanged USNVC upland associations and alliances by
division.
New
(Crawford Description No New
Division 2009) New (INR) Revised Written Eliminated Change Alliances
1.B.2.Nb 10 2 7 – – 10 –
Rocky
Mountain
Forest &
Woodland
1.B.2.Nd 10 1 16 2 – 51 –
Vancouverian
Forest &
Woodland
2.B.2.Na 15 2 2 – – 7 4
Western North
American
Grassland &
Shrubland
2.B.2.Nd 0 2 1 – – – –
Western North
American
Interior
Chaparral
4.B.1.Nb 10 2 8 – 2 5 –
Western North
American
Alpine Tundra
Total 45 9 34 2 2 73 4
Table 8. Breakdown of new and revised USNVC wetland alliances by division.
Row Labels New Revised Total
1.B.3.Nc Rocky Mountain & Great Basin Montane Flooded & Swamp Forest 3 8 11
1.B.3.Ng Vancouverian Flooded & Swamp Forest Division 2 7 9
2.C.2.Na North American Bog & Fen Division 7 - 7
2.C.4.Nb Western North American Freshwater Shrubland, Wet Meadow & Marsh 15 6 21
Total 27 21 48
15A field key for identifying plant associations precedes the association descriptions in Section A of
Ramm-Granberg et al. (2021a). This key may also be used to identify wetland alliances (if the
association to which you key is not described in Section A, the key will direct you to the appropriate
alliance description in Section B. The key and descriptions include some associations/alliances that
were not sampled during map training data collection but are highly likely to occur in the parks.
These generally represent types that occur in patches too small or linear—or are too difficult to
access—to be sampled with the map training methodology. Supporting synoptic tables for
associations and alliances are presented in Ramm-Granberg et al. (2021b). Environmental summary
tables for associations and alliances may be found in Ramm-Granberg et al. (2021c). Lastly, Ramm-
Granberg et al. (2021d) presents a crosswalk from associations in Crawford et al. (2009).
16Conclusions
While expansive in its scope, Crawford et al. (2009) also identified several areas in which the initial
classification could be improved:
North Cascades Sampling
This was previously the least sampled park unit. Because it is the only NCCN park unit to span both
sides of the Cascade Crest, NOCA has far more Rocky Mountain biogeographic influence than the
other parks. NOCA was known to contain vegetation types for which the classification likely needed
further modification (such as dry shrublands of the East Cascades). The addition of 1939 plots has
largely addressed this data gap—30 of the new associations and 13 of the revised/new alliances
advanced through peer review are found primarily or only at NOCA (among the three park units).
Wetlands
The Crawford et al. (2009) association classification was created to support vegetation mapping, so
more effort was applied to sampling matrix vegetation. Minimal sampling was conducted for
relatively small-scale associations, such as those occurring in wetlands. More broadly, wetland
vegetation is generally under-sampled because of differences in sampling protocols and the need for
additional training and expertise from field staff. While Crawford et al. (2009) noted that forested
and shrub wetlands were fairly well described, the majority of herbaceous wetland communities
likely to occur in the parks were absent from their data set. Filling these data gaps is critical to
providing a comprehensive list of associations likely present in INR map classes and thus found
within the three Parks. Wetlands represent 18% of all map classes and approximately 8-14% of the
mapped area within the three parks. In addition, although wetlands are generally a small proportion
of the landscape, they have disproportionate importance for wildlife and other ecosystem processes.
For example, wetlands are estimated to represent approximately 2% of Washington’s landscape but
are utilized by over 66% of the state’s terrestrial vertebrates (Sheldon et al., 2005). Because of their
steep, narrow ecological gradients, wetlands also support a disproportionately high percentage (53%)
of all the USNVC associations documented in Washington State.
WNHP has conducted extensive wetland sampling and statewide classification updates (funded by
the EPA) in the years since Crawford et al. (2009) was published. We were able to leverage that body
of work—along with hundreds of map training plots—to greatly improve the wetland keys and
classification for the NCCN parks. We now have a more comprehensive understanding of the
diversity of vegetation patterns within the NCCN wetland map classes (and western Washington in
general). That understanding will also support more effective management of these important
habitats.
Sparsely Vegetated Alpine and Lithomorphic Communities
These were only minimally sampled during classification data collection and were represented
primarily by legacy data sets from OLYM (e.g., Houston et al. 1994). These communities are
difficult from both a sampling and classification perspective. They typically have low species
diversity, prominent nonvascular species that are difficult to identify in the field, small patch size,
and occur in heterogeneous landscapes. They are simply difficult to access, as well.
17At the conclusion of this project, 693 additional alpine and bedrock plots had been collected and 17
new associations were moved into the USNVC, filling a significant data gap. However, many of the
same challenges remain. Besides the access issue, nonvascular species were only infrequently
identified in plot data and most occurrences of these communities are simply too small to have been
documented with map training methodology. Further improvement in alpine and lithomorphic
classification requires more targeted sampling.
In addition to addressing these data gaps, this report represents the current, “best practice” taxonomic
treatment of the plant communities of MORA, OLYM, and NOCA. The community descriptions,
synoptic tables, environmental summaries, and crosswalk tables presented here ensure that park
management has the best NVC-based knowledge available with which to manage these iconic parks.
Sunset in the North Cascades (Photograph by Tynan Ramm-Granberg).
18Literature Cited
Beals, E. W. 1984. Bray-Curtis ordination: an effective strategy for analysis of multivariate
ecological data. Advances in ecological research 14:1–55.
Belsky, J., and R. del Moral. 1982. Ecology of an alpine-subalpine meadow complex in the Olympic
Mountains, Washington. Canadian Journal of Botany 60(6):779–788.
Chappell, C. B. 1999. Ecological classification of low-elevation riparian vegetation on the Olympic
Experimental State Forest: a first approximation. Washington Natural Heritage Program,
Department of Natural Resources, Olympia, WA.
Chappell, C. B. 2006a. Plant associations of balds and bluffs of western Washington. Washington
Natural Heritage Program, Department of Natural Resources, Olympia, WA. NHR-2006-02.
Chappell, C. B. 2006b. Upland plant associations of the Puget Trough ecoregion, Washington.
Washington Natural Heritage Program, Department of Natural Resources, Olympia, WA.
Crawford, R. C., C. B. Chappell, C. C. Thompson, and F. J. Rocchio. 2009. Vegetation classification
of Mount Rainier, North Cascades, and Olympic National Parks. Natural Resource Technical
Report NPS/NCCN/NRTR—2009/211. National Park Service, Fort Collins, CO.
Diaz, N. M., and T. K. Mellen. 1996. Riparian ecological types of the Gifford Pinchot and Mt. Hood
National Forests, Columbia River Gorge National Scenic Area. US Department of Agriculture,
Forest Service, Pacific Northwest Region, Portland, OR. R6-NR-TP-10–96.
Douglas, G. W., and L. C. Bliss. 1977. Alpine and high subalpine plant communities of the North
Cascades Range, Washington and British Columbia. Ecological Monographs 47(2):113–150.
Dufrêne, M., and P. Legendre. 1997. Species assemblages and indicator species: the need for a
flexible asymmetrical approach. Ecological monographs 67(3):345–366.
Faber-Langendoen, D., T. Keeler-Wolf, D. Meidinger, C. Josse, A. Weakley, D. Tart, G. Navarro, B.
Hoagland, S. Ponomarenko, G. Fults, and E. Helmer. 2016. Classification and description of
world formation types. US Department of Agriculture, Forest Service, Rocky Mountain Research
Station, Fort Collins, CO. RMRS-GTR-346.
Federal Geographic Data Committee. 2008. National Vegetation Classification Standard, Version 2.
Vegetation Subcommittee, Federal Geographic Data Committee, FGDC Secretariat, US
Department of the Interior, US Geological Survey, Reston, VA. FGDC-STD-005-2008 (Version
2).
Franklin, J. F. 1966. Vegetation and soils in the subalpine forests of the southern Washington
Cascade Range. PhD Dissertation. Washington State University, Pullman, WA.
19You can also read