Democratizing Digital Solutions to Improve Public Health and - Microsoft
←
→
Page content transcription
If your browser does not render page correctly, please read the page content below
Microsoft Urban Futures – Summer 2020

    Democratizing Digital Solutions to Improve Public Health and
                           Urban Air Quality

Contributors: Edmund Seto, Miriam Berhane Russom, Michael Mattmiller,
              Vaishnavi Ranganathan, Kate Brown, Pietro Vannucci, Alex Mariakakis,
              Eric Basha, Shahana Khurshid

   I.      Problem statement

More than half of world’s population lives in urban areas, and it is estimated that by 2030 one
in every three persons will live in cities with at least half a million inhabitants. Already, there
are 31 “megacities”, with each one home to over 10 million people [1].
As cities and their population grow across the world, various public health challenges emerge,
which are broad and all-encompassing. The World Health Organization defines Health as “a
state of complete physical, mental and social well-being and not merely the absence of disease
or infirmity. [2]” Therefore, public health improvements must consider social conditions,
environmental quality, energy, transportation and access, housing and living conditions, equity,
sustainability, safety, governance, economic opportunities, diet, exercise, stress, and other
lifestyle factors, and infectious and non-infectious diseases, injuries, and mortality – to name a
few. Many of these issues are interlinked leading to a complex set of public health challenges
that need solving. There is an ongoing need for solutions to these challenges to achieve urban
futures that proactively improve the public health of city inhabitants.
Improvements to environmental quality may play a large role in promoting better public health.
A 2009 study of environmental effects on public health identified that air pollution significantly
affects public health in cities across the world [3]. It is estimated that as much as 23% of the
global burden of disease is due to poor environmental conditions [4], and ambient air pollution
specifically is the 5th leading risk factor for death, and is responsible for 4.2 million deaths [5].
Because of the importance of ambient air to public health, it is important to have a basic
understanding of the sources of air pollution and how is it managed. Ambient air is a mixture
made up of gaseous, liquid vapor, volatiles, and particle components. While some components
of ambient air are naturally occurring, a portion is the result of pollutant emissions from
industrial, mobile (e.g., planes, trains, and automobiles), residential, and other human
activities. Air pollutants may be transported and modified in the atmosphere.
In many countries, health-protective standards exist and air quality is managed by
environmental agencies. For example, within the United States, the Environmental Protection
Agency, and related state and regional agencies regulate air quality under the Clean Air Act,
which requires National Ambient Air Quality Standards (NAQQS) to be set for air pollution. The
NAAQS specifies standard air quality levels for 6 Criteria Air Pollutants (Carbon Monoxide (CO),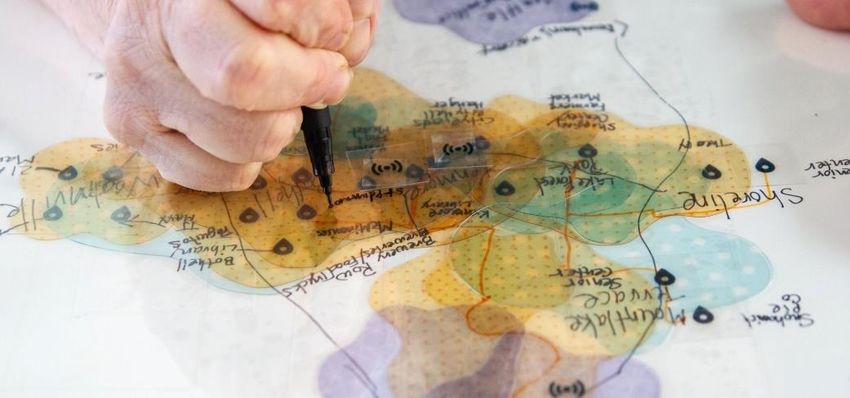
Lead (Pb), Nitrogen Dioxide (NO2), Ozone (O3), Particle Pollution (PM2.5 and PM10), and Sulfur
Dioxide (SO2) [6]. Additionally, environmental agencies can establish rules that govern or affect
pollutant emissions at their source (e.g., US CAFE standards for vehicle fuel efficiency, and the
permitting process for pollutant emissions from industrial facilities).
With the establishment of standards, there is the need to monitor air quality to determine if
the standards are being met, which again is the responsibility of governmental environmental
agencies. Conventional air quality monitoring, however tends to be quite sparse. There are
approximately 4000 sites operated by US EPA [7], and so there are many neighborhoods,
towns, and cities that do not have any governmental air quality monitoring data.
Despite the dearth of air monitoring data, there has been considerable research into the
relationship between air pollution, human health, and social and economic costs [3]. Exposure
to air pollution can cause damage to the airways through several mechanisms including
oxidative stress, airway remodeling, inflammatory pathways, and by enhancing respiratory
sensitization to allergens [8]. Exposure to pollutants such as ozone, nitrogen dioxide, and PM2.5
can induce airway inflammation. There is strong evidence for the associations between high
levels of certain pollutants and health concerns like all-cause mortality and both adverse
respiratory (bronchitis, asthma [9-11]) as well as cardiovascular health effects. For example, an
increase of 10 µg/m3 in PM2.5 has been associated with a 24% increase in the risk of a
cardiovascular event and 76% increase in the risk of death from cardiovascular disease in a
group of over 1800 women. [12] New research continues to find other potential relationships,
e.g., emerging evidence supports the associations between certain air pollution exposures and
adverse birth outcomes, obesity, cognitive disorders and metabolic disease, as well as aging
and Alzheimer’s disease [13-15]. But there is still a lot that we do not understand about the
mechanisms by which air pollution causes and exacerbates certain diseases.
Moreover, existing research has documented that air pollution disproportionately affects
certain populations within communities more than others [16]. There may be many potential
causes of this, which include structural racism, historical redlining, and other factors, which has
resulted in some communities experiencing higher levels of air pollution than others, and thus
environmental justice problems. Also, certain individuals may be more susceptible to adverse
health effects from air pollution exposures. For example, children with asthma, individuals with
chronic obstructive pulmonary disease (COPD), and individuals with cardiovascular disease are
all at higher risk of disease complications when they are exposed to air pollution. In the context
of the current COVID-19 pandemic, a study by Harvard researchers identified a strong
correlation between long-term exposure to air pollution and mortality rates. The study suggests
a 1 µg/m3 increase in PM2.5 correlates with an 8% increase in COVID-19 death rate [17]. This is
associated with the development of respiratory conditions, like COPD, which are known to
increase vulnerability in a person infected with SARS-CoV-2. Also, some may be more
vulnerable to air pollution and its health effects, such as those who lack insurance or are
underinsured, or those that also face other public health threats, including other pollution
exposures or have barriers that prevent them from adopting health lifestyles [18].
Within urban contexts, other civic agencies beside environmental agencies play an important
role in influencing air pollution. For example, land use planning agencies manage zoning and
siting decisions that potentially affect the proximity of industrial air pollution sources to
residents. Transportation agencies manage policies and plans that affect transport options,
routing, and pricing, which affect pollutant emissions. Public health agencies are responsible for
population health broadly, and thus are concerned with exposures to air pollution and their
resulting health impacts. Also, non-governmental environmental organizations play an
important role in advocating for environmental quality and justice, and often represent the
voices of community residents concerned about environmental health impacts. These are just a
few examples of some important air quality stakeholders.
As described above, urban air pollution is a complex issue. But, despite the potential for many
stakeholders to be involved in the solution, standards and other policy matters to address air
pollution problems, there still remain numerous knowledge gaps and opportunities for
information technology to play an important role in developing novel and effective solutions to
urban public health issues. We are especially interested in the emerging trend towards
democratization of air quality solutions, which involves the following:
         (1) More widespread scalable air quality data collection,
         (2) Open and easy access to data for city agencies and citizens,
         (3) New information services, and tools to collect feedback from urban inhabitants,
         (4) Engagement of urban residents and air quality stakeholders in developing equitable
         and health-promoting solutions to reduce air pollution, and
         (5) Equitable interventions and regulations from the city agencies.
The rest of this paper will elaborate on implementing strategies to achieve democratized air
quality solutions that can help address major public health concerns.

   II.      A movement towards democratized air quality: case
            studies

While the aforementioned air quality framework has existed for decades in the US since the
establishment of the Clean Air Act of 1963, in recent years, we have observed tremendous
innovation aimed at addressing the short-comings of a top-down, largely government-led and
operated effort. As described in the cases below, innovation has occurred through the nexus of
technologies, including the availability of lower-cost yet well-performing air quality sensors,
mobile technologies, Internet of Things (IoT), and cloud computing, as well as new paradigms
for collecting and acting on data, such as with Smart Cities, community-engaged research, and
citizen (or participatory) science.

Case Study 1. Smart Inhaler
Asthmatics are susceptible to air pollution exposures because they have the potential to
exacerbate respiratory symptoms. Air Louisville is a collaborative project among public, private,
and philanthropic organizations to address the high adult asthma prevalence in Louisville,
Kentucky [19]. They used an FDA-approved medication inhaler sensor developed by Propeller
Health that connects with a smartphone app to track when, where and how often users
experience asthma symptoms. The data combine with a personalized asthma management
approach to help patients better manage their symptoms. The inhaler does not include air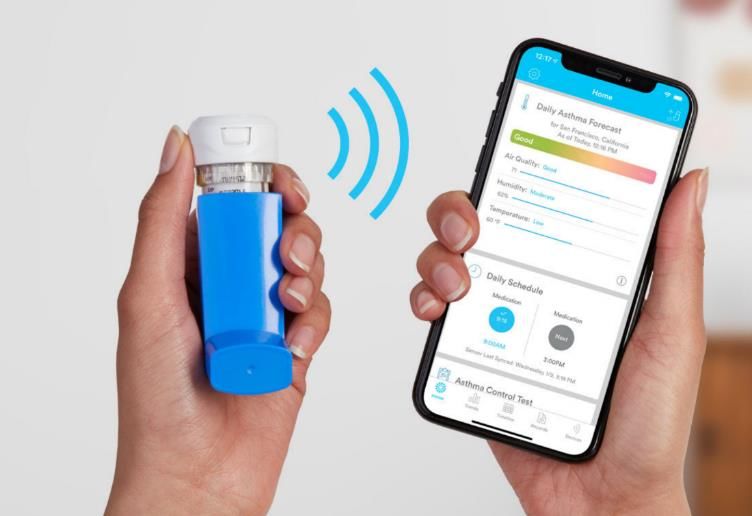
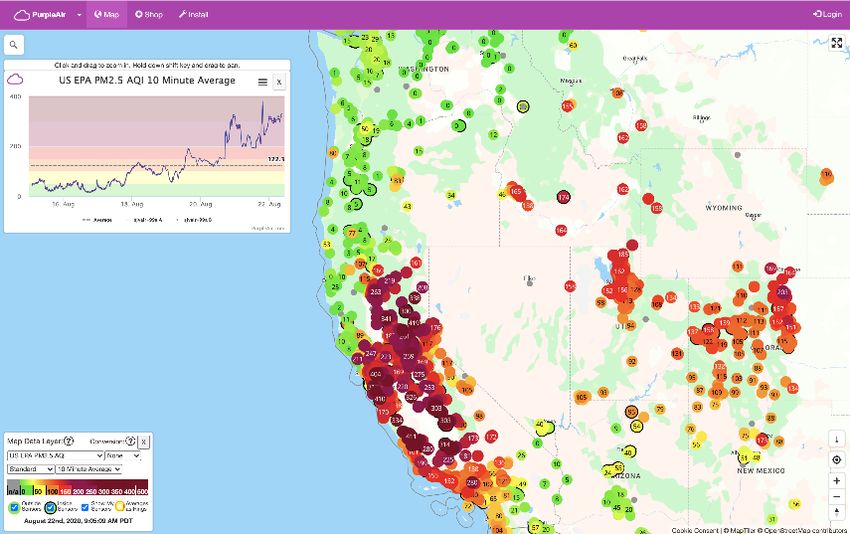
pollution sensing per se, but because use of the inhaler may be correlated with exposure to
poor air quality, the locations of inhaler use tracked by the app, may provide insights to city
leaders on air pollution issues (Figure 1).

Figure 1. Example screens from Propeller Health’s website.

Case Study 2. Purple Air and Weather Underground
What started out as a grassroots effort by an engineer who wanted to better understand his
own neighborhood air quality resulted in the development of the Purple Air sensor, a low-cost
particle sensor connected to a simple IoT-capable microcontroller that transmits particle
concentration measurements to a cloud where the data could be visualized on a map (Figure 2)
[20]. The system has become quite popular, and has been adopted by Weather Underground,
which collates weather measurements collected by citizen scientists who set up their own
weather stations [21].

Figure 2. Example of screen capture of Purple Air’s website map during the 2020 Northern California
Fire Complex, and an image of the Purple Air monitor from their website.
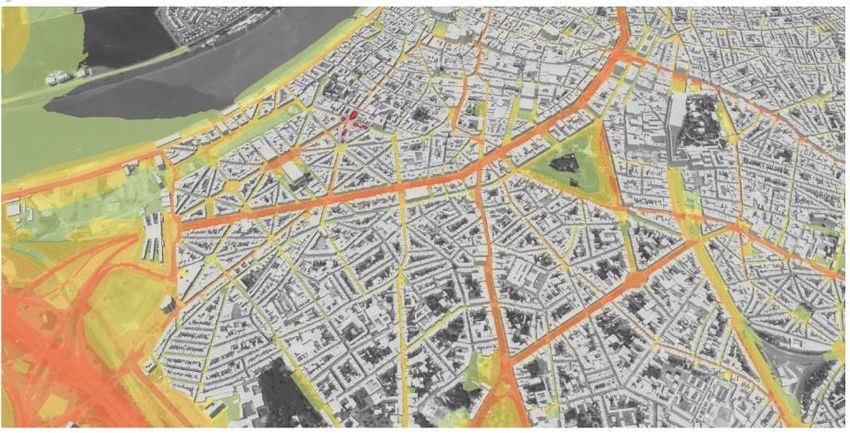
Case study 3: Local Government Initiatives
While the responsibilities related to air quality policy, enforcement, education or advocacy
varies from jurisdiction to jurisdiction, country to country, many stakeholders in the
government, academia and non-profit sectors would benefit from the ability to get more
information and insight regarding air quality. This is especially true when the enhanced air
quality data can be analyzed with other data sets that could include health, social, economic,
etc. to determine corollary or causal relationships. Examples of initiatives that have been
funded by local governmental agencies that analyze air quality include IMEC’s site for fine-
grained real-time air quality monitoring (Figure 3) [22] and The Chicago Health Atlas [23]
created by the CityTech Collaborative. These are examples of tools that enable users to analyze
datasets related to specific areas related to air quality that can lead to actionable insights.
Additional examples include the road use toll in UK and Singapore (plan for taxing detrimental
activity and rewarding beneficial activity), and congestion pricing in Seattle [24].

Figure 3. Screen capture from IMEC’s website of fine-grained real-time air quality map that acts as
a digital twin to support smart city policies.

    III. Possible New Case Studies to Explore
With the availability of granular and scalable air quality sensing enabled by IoT, the collection
and sharing of data becomes more feasible. What remains is to increase air-quality awareness
among the city residents and incentivize them to act on the knowledge. A study on coupling
measurements and experiences to create a narrative that makes the invisible air pollution
visible to people sheds light on how such awareness can be created [25]. Building awareness
needs cooperation between city agencies and its residents; where the city can make
quantitative data available to the public and educate them, and the qualitative feedback from
residents can help identify pollution sources and take actions to mitigate them. Most relevant
to public health is feedback from the public on the impacts of air pollution on their daily lives,
and especially how air pollution affects their health and well-being.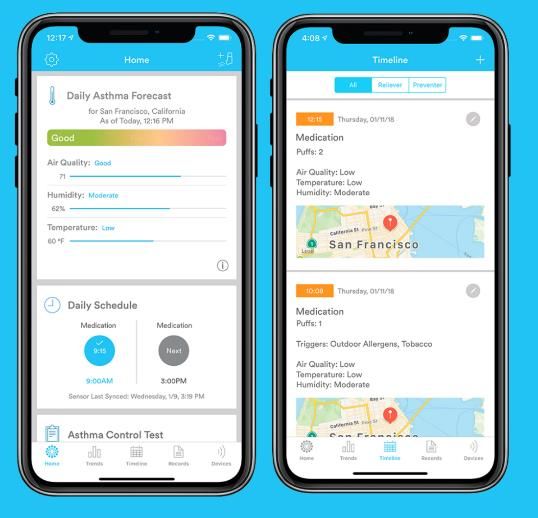
How does this improve Public Health? By enabling residents access to hyperlocal air quality
data and empowering them to voice their concerns about air pollution exposures this will drive
civic action towards reducing sources and emissions of air pollutants in the community, lead to
sharing of strategies in which people may reduce their own personal exposures, and building
awareness of air pollution related health effects and ways to avoid these health effects.
Thereby, public health may be improved at any point along the continuum:
Policy/Planning –> Pollution Sources –> Emissions –> Air Quality –> Exposures –> Health
Outcomes
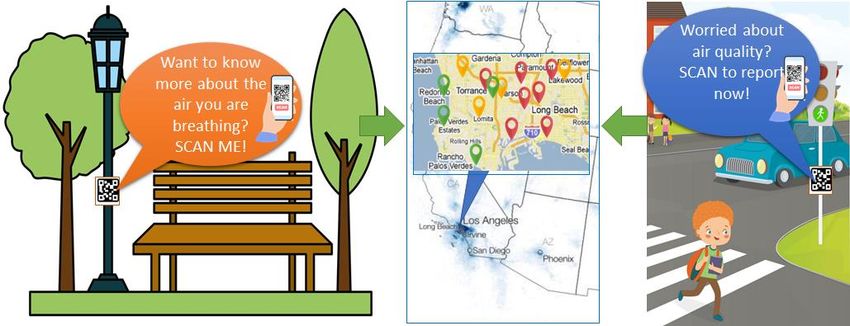
Figure 4. Workshop from Project Eclipse to study public perception of environment and air quality to
create awareness based on objective measurements and subjective experiences [25] (Top). Creating
community awareness and interactive participation: use simple technology like QR codes for citizens
to learn about air quality and contribute to creating a city-wide Air Quality perception map (Bottom).
Community Awareness and Citizen Feedback
The aforementioned case studies demonstrate that individuals are willing and able to engage in
participatory sensing provided some combination of two key characteristics of the system:
(1) the system has a low barrier to entry, or
(2) individuals are aware of the target issue and motivated enough to do something
about it.
Although there are many public sources of air quality information (e.g., websites, news
reports), people who live in communities with consistently poor air quality are more likely to be
aware of air quality issues than people in communities with generally clean air [26]. Therefore,
awareness cannot be taken for granted.
We believe that the first step needs to be a low-barrier method for providing people with
information about air quality, thereby raising awareness about air quality issues. With that in
mind, we envision a world where air quality sensors are deployed throughout a city on
everyday landmarks—lampposts, bus stops, intersections, etc. Although these sensors may be
hidden from people’s views, people would be able to “see” information derived from the
sensors through TV, radio news, or other media communications similar to how the weather is
routinely reported. Information may be provided in more of a real-time manner as well through
e.g., digital signage. Yet there are potentially more engaging ways for the public to interface
with sensor data. For example, in public places, a nearby QR code with a short message could
entice residents to engage with the sensors. The user audiences for the messaging could
include:
   •   People with respiratory issues: “Do you have respiratory issues? Scan this code to
       protect yourselves from poor air quality!”
   •   Younger students: “Want to learn more about the air around you? Scan this code to
       learn how to reduce air pollution!”
   •   Concerned citizens near local polluters: “Are you concerned about the air quality in
       your neighborhood? Scan this code to take action!”
One of the goals is to create opportunities for meaningful engagement between people and
their environmental quality, in ways that are empowering rather than disempowering. For
example, anyone who scans the QR code would instantly be taken to a website that shows the
nearby sensor’s data. The data would be summarized in a way that is easy to digest, showing
trends of the data over time and providing human-readable interpretations of the data. The site
may also allow them to voice their concerns, as well as see others’ similar concerns, and
possibly to offer potential solutions.
We believe this mode of interaction is more enticing than past suggestions for democratized
sensing—namely approaches that ask individuals to carry a sensor with them or to download an
app [27]—because QR codes are a familiar interaction that people can do with relatively minor
initial investment, though we acknowledge that not everyone has access to digital devices or
networking.
By scanning the QR code, people can begin to engage with air quality data that is more
meaningful than existing data sources because of its hyper-locality and convenience. Some
individuals may only consume the data as the complete extent of their engagement; however,
we are hopeful that a subset of individuals would be motivated enough to feel the need to
voice their concern based on their observations. For these individuals, the website would
provide a link to a brief anonymous survey. The survey could include targeted questions about
the person’s health (e.g., “Do you have a respiratory condition that you think is impacted by
this air quality?”), but would mainly provide a place for them to voice their concerns. Again, the
amount of effort required to get to this survey is very minimal since it does not require a
dedicated device, an app installation, or a login.
Social Innovation for Air Quality Reporting
With increasing attention to global climate change, health risks and their link to poor air quality,
more people across the world are becoming aware of the need for clean air. However, not
everyone is incentivized to carry a sensing device as we have seen so far. As the cities dedicate
more resources to the sensing and sharing air quality data, there comes a need to have
residents participate and play a larger role in providing appropriate feedback and adopting
measures for cleaner air. We propose leveraging crowdsourcing and social innovation as a
means to spread awareness and gather public feedback. Social approaches are often more
successful in achieving goals in a way that is beneficial to most of the stakeholders [28]. Social
cognitive studies show that social networks provide an illusion of enhanced control which is
directly related to progress, in contrast to the feeling of a lack of control when individuals act
alone towards a bigger cause [29]. We have seen analogues for such effective social innovation
with travel apps like trip advisor, Google maps, neighborhood crime watch and biodiversity
reporting apps like iNaturalist [30]. Applying this towards air quality, we propose a social app
that can be used by residents to learn and share information about the air quality and their
experiences on a regular basis. The following can be enabled for users and cities with an app:
• Individual benefit: With provisions for security and privacy-protection, a user can add
their symptom information (e.g., asthma, COPD symptoms), triggers and log areas and
times which are known to cause them distress. The app can act as an information
journal that logs air quality related health observations and help the user take
appropriate measures along the lines of a personalized environmental health assistant.
• Social benefit: A user can see shared observations from other residents with similar
health conditions and up vote/down vote the observation based on their own
experience. Frequently voted areas of distress can be flagged for a city’s attention. The
sensitive or general users can use the app to navigate their way with least distress in
terms of air quality. With a social contribution, air quality perception information can
easily become available on a global scale, so that the users are aware even while
traveling.
This qualitative data would be used to augment existing datasets that are available to local
government officials, emphasizing areas of key concern or providing additional context to the
data itself. With this combination of crowdsourced qualitative observations and granular
quantitative sensor data, cities can make learned decisions towards budgeting and prioritizing
their air quality improvement measures and help their citizens address their concerns.
Moreover, the qualitative data when assisted with additional information, such as images of the
environment or tags (like activity, traffic, idling vehicles, smoking area), can give context to the
sensor data events, which otherwise lack context and might seem noisy.
In a way, this ecosystem would also function similarly to how Yelp reviews provide additional
information to local officials about restaurants. Health inspectors review restaurants’ health
and safety practices on a yearly basis; however, individuals can voice their concerns throughout
the year through Yelp. If a particular restaurant neglects best practices and individuals
comment on those behaviors in their reviews, that can be enough impetus to have a health
inspector investigate further. Similarly, individuals can raise their concerns about the air quality
in a particular location with the context of their observations and health needs. If enough
people raise concern about how air quality is impacting their health, we believe that feedback
can expedite action from local governments.IV. Data or research needed to address the problem
We foresee that our envisioned system could incorporate data from three different sources:
(1) local quantitative sensors,
(2) public government datasets like the EPA measurements, and
(3) qualitative feedback from individuals.
We provide examples for each of these categories below:
Local Quantitative Datasets
The foundation of our system lies in the availability of hyperlocal air quality sensor data that
can be made available to individuals. We foresee that Microsoft’s Project Eclipse [31] is a prime
candidate for this purpose. The Eclipse sensor includes sensors for multiple air gases (CO, NO2,
SO2, and O3), particulate matter (PM1, PM2.5, and PM10), local weather (temperature, humidity),
and location. These sensors are free of infrastructure dependencies, operate on harvested solar
energy and talk directly to the cloud using LTE-m cellular connectivity. This makes the sensors
inexpensive and easy to deploy on structures like lampposts with a simple zip-tie, thus making
them easy for cities to adopt.
However, there are other sensor streams that could be informative to end-users. Motivated by
the rising interest in the surveillance of infectious diseases, researchers are actively developing
ambient cough and respiratory symptom monitors [32-34]. Cough monitors can be deployed on
an individual’s smartphone to track their own coughing behaviors, but they can also be
deployed within a local environment to estimate the local prevalence of respiratory issues.
Public Datasets
There is a wide assortment of public datasets that could provide context to air quality
observations. For our proposed system, we foresee three domains of particular interest:
1. Urban planning: Air quality and air pollution exposures are heavily influenced by land
zoning [35-36], so knowing the distribution of factories, businesses, and residential
areas, and locations of sensitive populations e.g., schools, throughout the city would be
particularly helpful. Populations are rarely static, so air pollution can also move
according to different modes of transportation. A bus moving past an air quality sensor
may temporarily spike a sensor’s readings, so correlating that sensor data with bus
schedules could explain such shifts in the data. Similar reasoning could be applied to
traffic data and event schedules for major venues. As people travel and congregate to a
particular location for a sports event or concert, the sudden migration of hundreds of
cars can explain drops in air quality on particular days.
2. Weather and geography: Several weather patterns can result in the deterioration of air
quality. Wind patterns can carry pollutants across a region. Topography can create
conditions that trap pollutants, with a well-known example being the various valleys inand around Los Angeles. Temperature inversion can also trap pollutants by stagnating
the potential for air flow for hours or days at a time.
3. Health: Although we may be able to have individuals self-report respiratory issues and
other ailments that could be exacerbated by poor air quality, public datasets can
provide coarser information with less threat to people’s privacy. Knowing the
prevalence of ailments in particular neighborhoods or clinics could provide clues into
where people at great risk reside. It is possible to link data from vital records (birth and
death outcomes), disease surveillance and disease registries, and hospital and pharmacy
records to air quality data, which can enable further research into the associations
between air pollution and health outcomes, as well as help cities better quantify the
health and economic burdens of air pollution.
4. Census and equity: Publicly available census datasets, such as those in the US from the
decennial census and American Communities Survey [37] are a rich source of
information for allocating resources within a city. If the air pollution mitigation steps are
to be fair and equitable, the distribution of population and their resource requirements
should be weighed in correctly. For instance, more crowded regions of a city need
better public transportation infrastructure to connect its larger populations. An example
is the Equity plan 2025 from the City of Tacoma, WA, which takes a data-driven
approach towards urbanization and resource planning based on mapped equity data
[38]. Another example of an equity tool that combines census data and air pollution
data is a state-wide Environmental Health Disparities Map produced by combining
indicators of socioeconomic conditions and environmental quality for Washington State
[39-40].
Local Qualitative Datasets
While numerous efforts have explored the combination of quantitative data from public
resources and individuals, we feel that the incorporation of qualitative feedback from
individuals has been underexplored, particularly those that allow for simultaneous visualization,
exploration and analysis, and fostering of improved understand qualitative and quantitative
data in interactive ways with others in the community. Individuals can often fill in gaps that are
overlooked by local governments, particularly neglected parts of a city that may not always get
the same attention as others. We imagine that individuals can contribute personal qualitative
data to either support or augment existing quantitative datasets by reporting local traffic
patterns and related observations. Individuals can also provide anecdotes about their
experiences pertaining to air quality as we have seen so far.
Data Security and Privacy Considerations
Datasets that are available either from public resources, or data that are self-reported by
individuals, typically contain personal identifiers or details that can lead to identity associations.
Repeated cases where such personal data has been used, without user consent, by private or
public agencies have created situations where people may be reluctant to share any
information at all. This is more so when it concerns personal health and preference data. While
most public records take steps to anonymize the datasets they hold, any other mode of
acquiring information must ensure privacy preserving policies. Privacy concern is an important
aspect to overcome to truly create a low barrier to entry and encourage participation and
contribution from individuals. Starting from the technology required to gather the individual’sdata, to storage, processing and sharing the information with the community or the public
officials, there needs to be a standard established to maintain anonymity.
Research Needs
With the development and deployment of the aforementioned social feedback app for air
quality, there are numerous research questions that could be potentially explored. Below we
list some important questions:
1. What are the best ways to encourage participation? What are the perceived
costs/benefits for those that participate?
2. What are the characteristics of participants? Is participation equitable, e.g.,
participation from all neighborhoods and people of different ages, race/ethnicities, and
income levels, and levels of digital literacy?
3. What are the benefits to different city governmental agencies? For example, how might
a transportation agency benefit from responses from residents? How might a public
health department benefit?
4. What privacy concerns are there with the system? What are best practices and
standards to address these concerns?
5. How might health researchers learn more about the many possible health effects
related to air pollution by comparing user feedback with sensor data?
6. Can we learn more about who is most vulnerable to air pollution exposures in a
community?
7. Is it possible to utilize user feedback to better manage or intervene on air pollution? For
example, can users find ways to avoid exposures? Can the city better identify air
pollution violations to reduce emissions?
8. Is it possible to model and/or simulate urban changes and their impacts on air quality
and public health?
V. Stakeholders, Services Needed and Expertise to
Analyze Data
Having so far seen how air quality relates to public health we have discussed some ways to
democratize the measurement of air quality, both qualitative and quantitative. The general
question that comes next is “How can air pollution data inform city-level interventions that
would improve health?”. Being able to transform insights into action will ultimately be the way
we can truly affect change and improve public health as it relates to air pollution.
Stakeholders
Better data quality will help stakeholders concerned with air quality affect change and drive
better environmental, health and social outcomes. While the responsibilities related to air
quality policy, enforcement, education or advocacy varies from jurisdiction to jurisdiction,
country to country—many stakeholders in the government, academia and non-profit sectors
would benefit from the ability to get more information and insight regarding air quality. This is
especially true when the hyperlocal air quality data can be analyzed with other datasetsincluding those related to health, social, or economic conditions to determine corollary or
causal relationships. We have already mentioned examples, such as efforts by IMEC and
Chicago Health Atlas and the Washington Environmental Health Disparities Map, that are
beginning to realize this vision of engaging various stakeholders around a theme of air quality
and environmental conditions generally. These are examples of tools that enable users to
analyze datasets related to specific areas related to air quality that can lead to actionable
insights.
• Governmental Public Health agencies have the mandate to promote and protect
public health for all, including pollution-related health issues. They also conduct
education and outreach to communities in their jurisdictions. Public health entities
have a lens of promoting social and health equity and educating the public they
serve. These government entities sometimes establish policy, monitor air quality, or
enforce laws related to air quality.
• Government Environmental and Ecological agencies are tasked with protecting the
environment. These government entities are most often charged with monitoring air
quality and often responsible for enforcing air quality laws and policies. As with
public health entities the specific responsibilities related to policy and enforcement
vary from region to region. They are reliant on data to carry out their mandate to
ensure air quality for their constituents.
• Academic Public Health entities are often on the cutting edge of research related to
the effects of air pollution on health. These organizations often provide the evidence
that sways public opinion and informs policy through rigorous research
methodology.
• Clean Air Advocates are almost always non-governmental organizations and can
include environmental non-profits such as the Sierra Club, health related non-profits
such as the American Lung Association or the European Federation of Clean Air and
Environmental Protection Associations (EFCA), as well as more local/regional
environmental justice organizations. These groups can mobilize their membership to
exert political pressure on elected officials and often have lobbying functions to
inform policy to promote clean air.
• Government policy makers at the local, regional or national level are typically
elected officials in executive, legislative or parliamentary roles who are chartered
with forming policies and passing laws related to air quality. Per above, the
enhanced air quality information made available directly to these government
officials combined with the outcomes and efforts from the stakeholder groups
above could have a profound impact on everything from air quality laws to urban
planning, transportation policy and areas related to everything from public health to
social equity.
• Finally, at the grassroots level, individual community leaders, active residents,
school teachers, religious leaders, and others can all play important roles in
organizing their communities to better utilize air quality information technologies.
Services needed
To enable decision making for different stakeholders we need to design for a hyper-scalable
system that is capable of hyperlocal data collection, analytics, and enable a rich ecosystem of
tools. Key services and capabilities include:• Ability to ingest data from hyperlocal low-cost air quality devices enabled through IoT.
• Data analytics and correlation with other data sources (public datasets and local
qualitative datasets), algorithms to correlate between air quality and effects on public
health.
• Digital twin representation of the spaces including “what if” simulation in support of
urban planning.
• Visualization tools to provide context driven “pane of glass” for decision making.
• Apps for public engagement both to provide insights into air quality residents are
exposed to, their neighborhood, and along their commute route, as well for community
members to contribute qualitative data.
• Open data and data sharing between different communities, cities, and regions.
The role of Digital Twins and City planning
Digital Twins technology has entered the realm of smart cities and can enable urban planners
make better decisions with the help of data integration and visualization from across the urban
space. A city digital twins would represent a digital replica of buildings, streets, parks, traffic,
noise and air quality levels and more. Urban planners have already been using 2D and 3D
models and computer aided design for years, however the integration of real time sensor data
enabled by IoT devices, location data, weather data, traffic data, people movement data is what
is a game changer for urban planning and policy making. Technologies like the Microsoft’s
Azure Digital Twins [41] enables the modeling and digital representations of connected
environments like buildings, factories, farms, energy networks, railways, stadiums and cities,
and bring these digital twins to life with a live execution environment and integration of IoT
data to ultimately unlock powerful insights. These digital representations can be utilized to
simulate the impact of any changes to the environment. For example, Digital Twins may be
used to answer:
• How does air quality change when changing a street into a pedestrian area?
• Would the air quality improve by transforming an unused urban space into a
park?
• What happens when reducing highway traffic?
• Would the air pollution simply move to another part of the city?
These are all examples of planning and policy questions and decisions that can be enabled via
digital twins, simulation, and taking into account multiple variables at play, the urban fabric and
the citizens. Moreover, digital twin analyses may be particularly powerful when driven by the
community input and feedback from the engagement app, QR codes, etc. described above.
Expertise required to analyze data
The availability of different data sources also calls for skills to correctly analyze them and draw
inferences that can address air quality issues. Tasks needed for data analysis:
• Processing air quality data – making sense of emission events and temporal/spatial
evolution of pollution
• Using Innovation and technology to relay, collect and document relevant information
to/from the people• Interpreting public sentiment/crowdsourced physical reactions and matching it with air
quality events in time and space
• Linking other data from various fields (e.g., transportation, health, etc.)
• Developing incentive structures around air quality improvement and exposure reduction
measures
• Designing and evaluating interventions for individuals as well as a city
Ethics and Air Quality Equity considerations
Given the potential for bias in AI algorithms and data sets and urban planning decision making,
and the harm and inequity which can result [42], it will be crucial to create fair algorithms and
to focus the use of data to create services which can enable a more equitable future for urban
life. To reduce the potential for biases, we propose to engage diverse publics in the
implementation of research, and especially the design of data analyses and interpretation of
the findings. Therefore, we propose to identify experts with domain knowledge needed to
effectively collect and analyze data for this research. This may include experts in air pollution
and public health sciences, sensing, systems, user interaction design, data visualization,
mapping, community-engagement, as well as local civic and community leaders and
stakeholders.
VI. Conclusion and Next Steps
There is sufficient interest to take next steps towards this research. We identified the following
next steps:
1. Develop detailed requirements necessary to address the key research needs.
2. Identify relevant expertise and form teams to contribute to specific research project
tasks.
3. Identify potential cities for pilot projects.
4. Develop specific proposals with well-defined outcomes and research goals for city pilot
projects.
5. With diverse air quality stakeholders, implement and evaluate city pilot projects.
6. Evaluate lessons learned across the pilot projects to identify opportunities/barriers to
scaling up from pilot projects to larger scale sustainable implementations.
I. References
[1] United Nations, Department of Economic and Social Affairs, Population Division, The World's Cities in 2016 - Data
Booklet (ST/ESA/SER.A/392), 2016. Available:
https://www.un.org/en/development/desa/population/publications/pdf/urbanization/the_worlds_cities_in_2016_data_
booklet.pdf[2] Preamble to the Constitution of WHO as adopted by the International Health Conference, New York, 19 June - 22 July 1946; signed on 22 July 1946 by the representatives of 61 States (Official Records of WHO, no. 2, p. 100). [3] K. Remoundou and P. Koundouri, "Environmental Effects on Public Health and Economic Perspective," Int J Environ Res Public Health, 6(8), pp. 2160-2178, 2009. [4 ] World Health Organization, Global Health Observeratory (GHO) data. Accessed on Sep 25, 2020. Available: https://www.who.int/gho/phe/en/#:~:text=Public%20health%20and%20environment&text=When%20accounting%20 for%20both%20death,if%20environmental%20risks%20were%20removed. [5] S. Tong, "Air pollution and disease burden", The Lancet Plantary Health, 3(2), E49-E50. 2019. [6] United States Environmental Protection Agency, NAAQS Table. Accessed on Sep 25, 2020. Available: https://www.epa.gov/criteria-air-pollutants/naaqs-table [7] United States Environmental Protection Agency, Outdoor Air Quality Data. Accessed Sep 25, 2020. Available: https://www.epa.gov/outdoor-air-quality-data/air-data-basic- information#:~:text=Monitoring%20Data%20%2D%20Ambient%20(outdoor),AQS%20(Air%20Quality%20System). [8] M. Guarnieri and J.R. Balmes, "Outdoor air pollution and asthma", Lancet, 383(9928): pp. 1581-1592, 2014. [9] N. Künzli, R. Kaiser, S. Medina, M. Studnicka, O. Chanel, P. Filliger, M. Herry, F. Horak Jr, V. Puybonnieux-Texier, P. Quénel, and J. Schneider, "Public-health impact of outdoor and traffic-related air pollution: a European assessment." The Lancet, 356(9232), pp.795-801, 2000. [10] J. McCreanor, P. Cullinan, M.J. Nieuwenhuijsen, J. Stewart-Evans, E. Malliarou, L. Jarup, R. Harrington, M. Svartengren, I.K. Han, P. Ohman-Strickland, and K.F. Chung. "Respiratory effects of exposure to diesel traffic in persons with asthma". New England Journal of Medicine, 357(23), pp.2348-2358. 2007. [11] M. Brauer, G. Hoek, H.A. Smit, J.C. De Jongste, J. Gerritsen, D.S. Postma, M. Kerkhof, and B. Brunekreef. "Air pollution and development of asthma, allergy and infections in a birth cohort." European Respiratory Journal, 29(5), pp.879-888, 2007. [12] K.A. Miller, D.S. Siscovick, L. Sheppard, K. Shepherd, J.H. Sullivan, G.L. Anderson, and J.D. Kaufman. "Long-term exposure to air pollution and incidence of cardiovascular events in women." New England Journal of Medicine, 356(5), pp.447-458, 2007. [13] B. Ritz, M. Wilhelm, K.J. Hoggatt, and J.K.C. Ghosh. "Ambient air pollution and preterm birth in the environment and pregnancy outcomes study at the University of California, Los Angeles." American journal of epidemiology, 166(9), pp.1045-1052, 2007. [14] N.M. Gatto, V.W. Henderson, H.N. Hodis, J.A.S. John, F. Lurmann, J.C. Chen, and W.J. Mack. "Components of air pollution and cognitive function in middle-aged and older adults in Los Angeles." Neurotoxicology, 40, pp.1-7, , 2014. [15] J. Schwartz. "Air pollution and children’s health." Pediatrics, 113(Supplement 3), pp.1037-1043, 2004. [16] M.L. Miranda, S.E. Edwards, M.H. Keating, and C.J. Paul, "Making the environmental justice grade: the relative burden of air pollution exposure in the United States." International journal of environmental research and public health, 8(6), pp.1755-1771, 2011. [17] X. Wu, R.C. Nethery, M.B. Sabath, D. Braun, and F. Dominici, "Air pollution and COVID-19 mortality in the United States: strengths and limitations of an ecological regression analysis." Science Advances (in press). [18] N.A. Ponce, K.J. Hoggatt, M. Wilhelm, and B. Ritz. "Preterm birth: the interaction of traffic-related air pollution with economic hardship in Los Angeles neighborhoods." American journal of epidemiology, 162(2), pp.140-148, 2005. [19] Air Louisville, Air Louisville, Accessed Sep 25, 2020. Available: https://airlouisville.com/ [20] PurpleAir, PurpleAir, Accessed Spe 25, 2020. Available: https://www2.purpleair.com/
[21] Weather Underground, We Need Your Help to Fight Air Pollution, Accessed Sep 25, 2020. Available:
https://www.wunderground.com/sensors/purpleair

[22] IMEC, Technology for real-time air quality monitoring, Accessed Sep 25, 2020. Available: https://www.imec-
int.com/en/sensor-networks-for-IoT/technology-for-real-time-air-quality-monitoring

[23] Chicago Health Atlas, Chicago Health Atlas - Access health data for Chicago and your community, Accessed Sep
25, 2020. Available: https://www.chicagohealthatlas.org/

[24] J. Cohen, "Tolls to drive in downtown Seattle? New study examines the good and the bad", Crosscut, 2019,
Accessed Sep 25, 2020, Available: https://crosscut.com/2019/05/tolls-drive-downtown-seattle-new-study-examines-
good-and-bad

[25] S. Liu, J. Cranshaw, A. Roseway, "Making Air Quality Data Meaningful: Coupling Objective Measurement with
Subjective Experience through Narration," DIS2020, July 6-10, 2020, Eindhoven, NL.

[26] M.C. Mirabelli, S. Ebelt, and S. A. Damon, "Air Quality Index and air quality awareness among adults in the United
States". Environmental Research, 183, p.109185, 2020.

[27] C.C. Lim, H. Kim, M.R. Vilcassim, G.D. Thurston, T. Gordon, L.C. Chen, K. Lee, M. Heimbinder, and S. Y. Kim.
"Mapping urban air quality using mobile sampling with low-cost sensors and machine learning in Seoul, South Korea."
Environment international, 131, p.105022, 2019.

[28] W. Phillips, E.A. Alexander, and H. Lee. "Going it alone won’t work! The relational imperative for social innovation
in social enterprises." Journal of Business Ethics, 156(2), pp.315-331, 2019.

[29] D.M. De Carolis, B.E. Litzky, and K.A. Eddleston, "Why networks enhance the progress of new venture creation: The
influence of social capital and cognition." Entrepreneurship theory and practice, 33(2), pp.527-545, 2009.

[30] iNaturalist, iNaturalist, Accessed Sep 25, 2020. Available: https://www.inaturalist.org/

[31] Microsoft, Project Eclipse, Accessed Sep 25, 2020, Available: https://www.microsoft.com/en-
us/research/project/project-eclipse/

[32] S. Matos, S. S. Birring, I. D. Pavord and D. H. Evans, "An Automated System for 24-h Monitoring of Cough
Frequency: The Leicester Cough Monitor," in IEEE Transactions on Biomedical Engineering, vol. 54, no. 8, pp. 1472-
1479, Aug. 2007.

[33] X. Sun, Z. Lu, W. Hu, and G. Cao. 2015. SymDetector: detecting sound-related respiratory symptoms using
smartphones. In Proceedings of the 2015 ACM International Joint Conference on Pervasive and Ubiquitous
Computing (UbiComp '15). Association for Computing Machinery, New York, NY, USA, 97–108.

[34] F. Al Hossain, A.A. Lover, G.A. Corey, N.G. Reich, and T. Rahman. 2020. FluSense: A Contactless Syndromic
Surveillance Platform for Influenza-Like Illness in Hospital Waiting Areas. Proc. ACM Interact. Mob. Wearable
Ubiquitous Technol. 4, 1, Article 1 (March 2020), 28 pages.

[35] Iowa Department of Natural Resources, "Cleaner Air Better Communities", 2012, Accessed Sep 25, 2020, Available:
https://iwrc.uni.edu/sites/default/files/Land-Use-Planning-for-Air-Quality4-17-12.pdf

[36] California Environmental Protection Agency, California Air Resources Board, "Air Quality and Land Use Handbook:
A Community Health Perspective", 2005, Accessed Sep 25, 2020, Available: https://ww3.arb.ca.gov/ch/handbook.pdf

[37] United States Census Bureau, Accessed Sep 25, 2020, Available: https://www.census.gov/

[38] City of Tacoma, Washington, "Realizing Equity in Tacoma - Equity Index," Accessed Sep 25, 2020. Available:
https://www.cityoftacoma.org/government/city_departments/equity_and_human_rights/equity_index

[39] E. Min, D. Gruen, D. Banerjee, T. Echeverria, L. Freelander, M. Schmeltz, E. Saganić, M. Piazza, V.E. Galaviz, M. Yost,
E.Y.W. Seto, "The Washington State Environmental Health Disparities Map: Development of a Community-Responsive
Cumulative Impacts Assessment Tool. "Int. J. Environ. Res. Public Health, 16(22), 4470. doi:10.3390/ijerph16224470,
2019.
[40] Washington State Department of Health, "Washington Tracking Network - A source for environmental public
health data", Accessed Sep 25, 2020, Available: https://fortress.wa.gov/doh/wtn/WTNIBL/

[41] Microsoft Azure, Azure Digital Twins, Accessed Sep 25, 2020, Available: https://azure.microsoft.com/en-
us/services/digital-twins/

[42] C. O'Neil, "Weapons of Math Destruction - How Big Data Increases Inequality and Threatens Democracy",
Penguin, 2017.
You can also read