Air quality change due to COVID-19 lockdown in India and its perception by public - Research Square
←
→
Page content transcription
If your browser does not render page correctly, please read the page content below

Air quality change due to COVID-19 lockdown in
India and its perception by public
Abinaya Sekar
National Institute of Technology Calicut https://orcid.org/0000-0002-0096-4980
Jasna R S
National Institute of Technology Calicut https://orcid.org/0000-0001-9662-1722
Binoy B V
National Institute of Technology Calicut https://orcid.org/0000-0002-6397-1096
Prem Mohan
National Institute of Technology Calicut https://orcid.org/0000-0002-8897-1340
George Kuttiparichel Varghese ( gkv@nitc.ac.in )
National Institute of Technology Calicut https://orcid.org/0000-0002-5327-2697
Research Article
Keywords: Air quality, Perceived Air Quality, COVID-19, Lockdown, Odds ratio, Air Quality Index
DOI: https://doi.org/10.21203/rs.3.rs-74610/v1
License: This work is licensed under a Creative Commons Attribution 4.0 International License.
Read Full License
Page 1/33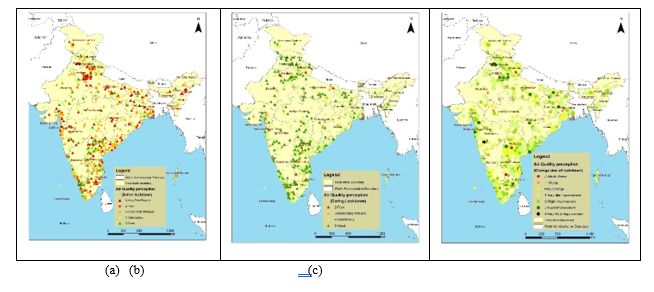
Abstract
In this study, air quality data for 100 days recorded at 193 stations distributed throughout India were
analyzed to understand the changes in air quality following the country-wide lockdown imposed from
25th March to 17th May 2020 to contain the spread of the COVID-19 pandemic. The responses from a
nationwide online survey conducted to obtain public perceptions of air quality improvement were also
analyzed. On average, an approximately 40% improvement in the air quality index was observed,
contributed by a reduction in 40% of PM10, 44% of PM2.5, 51% of NO2 and 21% of SO2. There was a
signi cant difference between the levels of all the pollutants before and after the lockdown (p
indoor air quality increases mortality in some of the major cities in India (Nagpure et al. 2014; Lelieveld et
al. 2015). Largely, air quality is associated with human activities. However, it is impossible to restrict
human activities to affect improvements in air quality, although nonessential activities can be restricted
to a certain extent (Bao and Zhang 2020). However, there can be instances when even essential activities
are restricted as a response to unusual situations.

At the end of 2019, a novel infectious disease was reported in Wuhan, China (Huang et al. 2020). Later,
this pandemic was identi ed as from the corona virus family and was named COVID-19 (Chen et al.,
2020). WHO con rmed the transmission of COVID-19 through respiratory droplets among humans (WHO,
2020). The corona virus outbreak became an international crisis with its spread to many countries,
resulting in the deaths of many and interruption of normal life. Nationwide lockdowns had to be
implemented in most of the affected countries to contain the spread of the disease. The rst con rmed
case of COVID-19 infection in India was reported from the state of Kerala on 30 January 2020. The
country observed a jump in corona virus cases by the 4th of March. On 22 March 2020, a 14-hour
voluntary public curfew was imposed in India, followed by lockdowns in some districts as well as major
cities where COVID-19 positive cases were identi ed. The Prime Minister of India ordered a nationwide
lockdown for 21 days with effect from 25th March 2020 (Ministry of Home Affairs 2020). This was
further extended up to the 3rd of May, with some conditional relaxations in areas where limited cases
were reported. Even after these restrictions, the number of COVID-19 positive cases was on the rise, and a
third phase of lockdown was implemented up to 17th May. Several countries across the world went into
lockdown due to the tremendous increase in the number of positive cases and the deaths associated with
it. As a result of the series of lockdowns in India, industrial activities, transportation by all modes, and
almost all other polluting activities decreased drastically. This had a positive impact on the environment,
with pollution levels falling signi cantly in most cities of India (Mahato et al. 2020; Sharma et al. 2020).
The same trends were reported in many other countries of the world, such as China (Bao and Zhang
2020; Muhammad et al. 2020; Wang et al. 2020b; Zambrano-monserrate et al. 2020; Zhang et al. 2020),
Italy (Cristina et al. 2020; Muhammad et al. 2020; Zambrano-monserrate et al. 2020), Spain, France
(Muhammad et al. 2020; Zambrano-monserrate et al. 2020), USA (Muhammad et al. 2020), Germany
(Zambrano-monserrate et al. 2020), Brazil (Dantas et al. 2020), Kazakhstan (Kerimray et al. 2020), etc.

The negative impact of COVID 19 was felt in the industrial, trade and commercial sectors of the country
(ICRA 2020a, b, c). It is expected that the country will go into the worst recession in recent times along
with most other countries of the world. Perhaps the only area where the shutdown had a positive impact
was the air environment. The shutdown resulted in the drastic reduction of pollutants discharged into the
air environment.

Several studies have shown the in uence of the economic activities of a society on its air quality. NASA
and the European Space Agency recently reported that there is a reduction in nitrogen-dioxide (NO2) levels
in China after the economic slowdown following complete lockdown of the country associated with
COVID-19 infections (NASA Earth observatory 2020). A similar effect was observed in history earlier

                                                    Page 3/33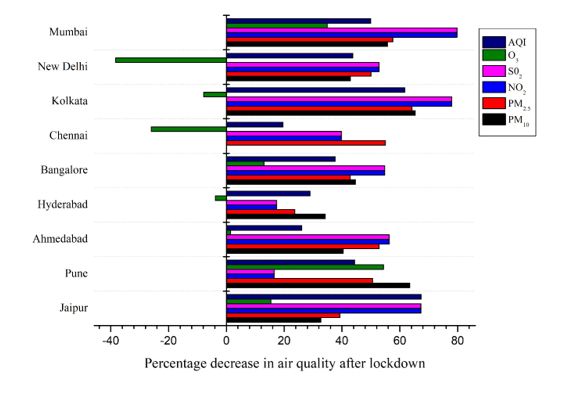
during the collapse of the Soviet Union in 1991. There was a signi cant reduction in greenhouse gases
attributed to the reduction in meat consumption following the economic slowdown (Schierhorn et al.
2019). A study from California showed that economic indicators had a statistically signi cant effect on
air pollution levels (Davis 2012). Similarly, a study conducted in New Jersey showed that economic
activity levels can be used as a potential marker for assessing exposure to tra c-related pollutants in the
absence of monitoring data (Davis et al. 2010).

The reduced tra c and restricted industrial activities have probably resulted in the reduction in PM2.5,
carbon monoxide (CO) and NO2 concentrations reported from different countries of the world during
COVID-19-induced lockdown. The control on construction-related activities could also have contributed to
the decrement observed in PM2.5 and PM10 concentrations. The decrease in ambient sulfur-di-oxide (SO2)
concentration during the control period was proportional to the decreased emission from industrial
activities (Dantas et al. 2020; Mahato et al. 2020; Wang et al. 2020b). Although there was a decrease in
air pollution in many countries of the world during lockdown, restricted anthropogenic activities were not
su cient alone to explain the reduction in the level of pollutants in air. A study from China reported that
due to the partial effect of unfavorable meteorological conditions, the reduction ratios of PM2.5
concentrations, as a result of lockdown, were smaller than the reduction ratios of precursor emissions
(Wang et al. 2020a), indicating the in uence of weather on ambient pollutant concentrations. Even
though the major air pollutants, such as PM2.5, PM10, CO, NO2, SO2 and ammonia (NH3), saw a large
reduction in their concentrations, the concentration of ozone (O3) increased during the lockdown period in
many parts of the world (Cristina et al. 2020; Dantas et al. 2020; Mahato et al. 2020; Wang et al. 2020b).
The reason behind this reverse trend of O3 concentration was identi ed as the decreased PM
concentrations. Reduced PM in air results in increased photochemical activities and thus higher O3
production by giving way for more sunlight to pass through the atmosphere (Dang and Liao 2017; Li et al.
2018). This may also be due to the favorable conditions for ozone formation, such as high temperatures
and solar radiation indices (Escudero et al. 2019; Dantas et al. 2020). The decrease in NOx concentration
in the atmosphere (Monks et al. 2015) and reduced utilization of O3 by NO were also probably the
reasons behind the increase in O3 concentrations (Gorai et al. 2017) during the control period. This also
shows that meteorological conditions are an important parameter. The simultaneous control of PM2.5
and O3 is quite di cult, and it requires measures such as proper adjustment of industrial structure and
energy structure (Zhang et al. 2020). A study from China found that the largest decrease in concentration
during the COVID-19 lockdown period was for NO2 and the least decrease was for SO2 (Wang et al.
2020b).

There are many advantages for the public’s perception of pollution being strongly correlated to actual
levels of pollution. On the one hand, it prevents people from taking unnecessary health risks and
generates public opinion against polluting emissions, forcing regulatory agencies to take corrective
measures. On the other hand, it allows industries to judiciously make use of the assimilative capacity of
the environment, resulting in net economic bene ts to society. However, there are various factors other

                                                  Page 4/33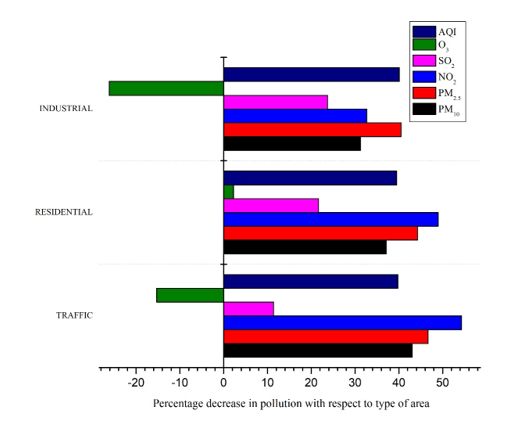
than the actual levels of pollution that shape the perception of pollution. The perception of air quality has
been found to be correlated with factors such as gender, education, age, health status, resident area, etc.
(Guo et al. 2016; Oltra and Sala 2016). Howe et al. (2003) reported that aged responders had a more
negative perception of pollution than younger responders, attributable, possibly, to their bad
environmental experience during their younger ages. In another study, subjects older than 40 years, living
in an urban area, having a college-level education and poor child health conditions perceived the air
quality around the area as worse (Guo et al. 2016). The gender of the subjects considered was found to
be associated with perception by Elliott et al. (1999). They found that most of the women reported that
poor air quality will lead to adverse health effects compared to the men respondents. The respondents
with respiratory indications (nocturnal shortness of breath, phlegm, rhinitis, etc.) reported higher levels of
annoyance for degraded air quality (Sunyer et al. 2007). Factors such as health status, smoking status,
and exposure time were also reported to have a signi cant impact on air quality perception (Pantavou et
al. 2018).

However, in general, there is a strong correlation between perceived and actual air quality, although the
perception varies with respect to age, gender, residence type, education, income, health condition and
indoor house environment (Guo et al. 2016). Residents living in the proximity of industries and heavy
tra c regions had negative perceptions of the air quality and health risks associated with it (Howel et al.
2003; Brody et al. 2004; Kohlhuber et al. 2006). Nikolopoulou et al. (2009) observed a good correlation
between perceived air quality and PM concentrations in the study area. As the PM concentration
increased, there was an increase in the number of ‘poor air quality’ votes and a decrease in the number of
‘good air quality’ votes. In another study, the public could truly perceive the most in uencing factors in a
neighborhood’s air quality (Mally 2016).

As far as human health is concerned, proper perception of pollution has signi cant advantages. Studies
have shown that perceived air pollution and perceived health risk play a prominent role in the
manifestation of health symptoms and contribute to ailments (Lloyd et al. 2005; Brosschot et al. 2006).
In many cases, these health symptoms act as protective mechanisms against the severe consequences
of pollution (Engen 1991). Often, the sources of pollutants may be identi ed based on olfactory
sensations (pleasant or unpleasant). If the source is perceived to be unpleasant, it is more likely to have a
negative impact on human health (Sucker et al. 2008). In addition to the olfactory systems, the trigeminal
sensory system, which is activated by both vaporous substances and particles, also plays an important
role in such perceptions. The sensation generated by trigeminal chemoreception includes pungency and
irritation, where the re ex action prevents the inhalation of hazardous substances. The warning features
of this defense re ex include sweating, coughing, mucus release, tearing and salivary ow (Silver 1991).

Perception studies on air quality have a signi cant role in creating awareness among people on the
importance of having clean air (Evans et al. 1988; Liu et al. 2017). It was found that a signi cant
proportion of the population was ready to take actions for the reduction of air pollution, as they perceived
the air quality to be poor (Semenza et al. 2008; Li et al. 2016). Perception studies have been useful in
providing suggestions to the government for improving air quality (Lan et al. 2016; Li et al. 2016). Wang
                                                   Page 5/33
et al. (2015) found that 90% of the respondents from Shanghai, China agreed that air quality
improvement is the responsibility of government and the individual citizens of the country.
In the context of the importance of public perception in air pollution management, this study analyzes the
change in air quality following the COVID-19 lockdown in India and its perception by the general public.
Extensive data on actual air quality from 193 monitoring stations covering the whole country were taken
from the repository of the regulatory agency. The public perception of air quality was obtained through an
online questionnaire survey conducted among the general public answered by 1750 respondents. The
data obtained were analyzed to obtain quantitative estimates of improvements in air quality and the
relationship between actual and perceived air quality. The analysis results were used to arrive at
conclusions regarding factors that were most in uential in shaping perception.
Methodology
Air quality data
Geographic and demographic diversity is perhaps the most striking feature of India, the second most populous
country in the world. From the Himalayan Mountains in the north to the Kanyakumari cape in the south and from
the Thar Desert and salt marshes of the west to the humid forests of the northeast, the Indian main land covers
an area of 3,278,982 sq.km. The tropic of cancer divides the country roughly into two equal halves. The southern
part of the country, being a peninsula, experiences milder variations in temperature, whereas the northern
region experiences extremes in temperature (R.B. Singh 2016).
Currently, there are approximately 231 continuous air monitoring stations in the country. These are connected to
the web-based system, and the data are open to access for the public (CPCB 2020a). These monitoring stations
are maintained by the respective state pollution control boards. Considering the size of the country, the number
of air quality monitoring stations is insufficient. The government has plans to strengthen the network in major
cities in a phased manner (CPCB 2020b). For this study, the air quality data for a total of 100 days (from 7-02-
2020 to 16-05-2020) recorded at 193 air quality monitoring stations were downloaded from the Central Pollution
Control Board (CPCB) website (https://app.cpcbccr.com/ccr/#/caaqm-dashboard-all/caaqm-landing). The
pollutants considered in this study include PM10, PM2.5, SO2, NO2 and O3. Furthermore, the air quality index
(AQI), as calculated by CPCB, was also considered in this study (CPCB 2014). The period from 7-02-2020 to 22-
03-2020 is considered the pre-lockdown period, and the period from 23-03-2020 to 16-05-2020 is considered the
lockdown period in this study. The collected data were subjected to analysis for 1) changes in the concentration
of air pollutants with respect to different zones/states, 2) the number of days the pollution level exceeded the
Page 6/33permissible levels before and during lockdown, and 3) changes in the pollution level before and during lockdown
with respect to the type of locality (residential, traffic and industrial) and major cities (based on the population).
The type of locality was decided based on the location of the monitoring station, whether in residential areas
with minimum traffic, near major roads and traffic intersections or in industrial areas.
Multivariate statistical analysis was conducted using Pearson’s correlation coefficients. The correlation
coefficient is often used to determine the extent of the relationship between the variables when it is compared in
pairs. There are various types of correlation coefficients (Núñez-Alonso et al. 2019), in which Pearson’s
correlation is the most commonly used method in linear regression. In this study, it is used to measure the
strength of the relationship between the selected pollutants before and after the lockdown period.
GIS analysis
To estimate the spatial variation of air quality across the country, interpolation of the air quality data from
monitoring stations was carried out. The most commonly used interpolation techniques for air pollution studies
include inverse distance weighting (IDW), kriging and splining (Kumar Jha et al. 2011). Of this, kriging is a
powerful statistical tool where the interpolated values are modeled by a Gaussian process governed by prior
covariances. The mathematical equation used in the ArcGIS platform is shown in equation (1) (Environmental
Systems Research Institute 2016).
λi- unknown weight for the value measured at the ith location (this value depends on the distance to the location
predicted and the spatial relationships among the measured values around the predicted location)
N - number of the measured values
Perception Survey
Page 7/33Residents from all across the country were asked to complete the questionnaire (n=1750). The survey was conducted between 17-4-2020 and 27-5-2020. A total of 16 survey questions were asked. The entire survey was divided into three sections: 1) location details, 2) perception of improvement of air quality, visibility, health effects and sources, and 3) willingness to maintain air quality. Survey questions in sections 2 and 3 were asked on the rating scale and Likert scale. For example, “Rate the air quality in your locality before the lock-down period?” 1= Poor to 5= Good. “Is there improvement in visibility in your locality?” No improvement, Slight improvement, Moderate improvement, Significant improvement and Don't know. “I will actively be involved in maintaining the current status of the environment” Strongly agree, Agree, Undecided, Disagree and Strongly Disagree. The questionnaire for the online survey is generated and circulated through Google forms (included as supplementary material). The questionnaire had the option of collecting the Geolocations of responders with their permission for plotting the results easily in ArcGIS. All statistical analyses were performed using SPSS 2.0. Descriptive statistics were used to present the respondents’ demographics and the response to the questionnaire. Independent sample non-parametric tests were conducted to understand the difference in opinion of the respondents belonging to different categories. Test of significance was performed using Chi-square ( 2) and t-tests. Statistical significance was considered at p
The perception of air quality is often influenced by the media (Murukutla et al. 2019). To find the effect of media

on air quality perception, an analysis was conducted using “Google trends”. Keywords such as “Air Quality”, “Air

Quality Index” “AQI” and “Air Pollution” were used to analyze the frequency of discussions on air quality by the

media. Frequent discussions on the topic by media may unduly affect the perception.

Qualitative response analysis

The question asked in the qualitative survey part is “Please give your suggestions for maintaining the air quality

after the lock-down period”. Qualitative response analysis was conducted by the process of identification,

examination and finally interpreting the frequently repeated keywords in the textual data and based on the

frequency of repetition of the keywords. Based on this analysis, suggestions are given to maintain the air quality

after the lockdown period.

Relationship between AAQ and PAQ

The perception of air quality was collected on a rating scale from 1 to 5. Similarly, the AQI and the

concentrations of the individual pollutants were also converted to rating scales as per breakpoint scales

proposed by CPCB (CPCB 2014) given in Table 1. Both values were subjected to a test of significance using

SPSS 2.0 to establish the relationship between PAQ and AAQ.

                           Table 1 Breakpoints for AQI Scale 0-500 (all units are in µg/m3)

 AQI Category                       PM10         PM2.5          NO2         SO2               O3          Rating

                                    24 hr        24 hr          24 hr       24 hr             8 hr        scale

 Good (0-50)                        0-50         0-30           0-40        0-40              0-50        5

 Satisfactory (51-100)              51-100       31-60          41-80       41-80             51-100      4

 Moderately     Polluted    (101-   101-250      61-90          81-180      81-380            101-168     3

 250)

 Poor (201-300)                     251-350      91-120         181-280     381-800           169-208     2

 Very Poor & Severe (301-           351-430 &    121-250 &      280-400 &   801-1600 &        209-748 &   1

 400) & (401-500)                   430 +        250 +          400 +       1600 +            748 +

Furthermore, the odds ratio (OR) was also used to express the strength of the association between AAQ and

PAQ. The odds ratio is a statistic that is used to measure the association between the exposure and the outcome

                                                        Page 9/33
(Szumilas 2010). The responses of people from two states, one where there was significant improvement in air quality (Delhi) and the other with nominal improvement in air quality (Telangana), were used to calculate the odds ratio. The odds ratio was calculated as in equation (2): where, Npi- Number of people who perceived significant improvement in air quality from an area (Delhi) where there was significant improvement in actual air quality Nni- Number of people who perceived no/slight improvement in air quality from an area (Delhi) where there was significant improvement in actual air quality Npn- Number of people who perceived significant improvement in air quality from an area (Telangana) where there was only nominal improvement in actual air quality Nnn- Number of people who perceived no/slight improvement in air quality from an area (Telangana) where there was only nominal improvement in actual air quality When OR is >1, it indicates that the perception is dependent on improvement in the air quality. The higher the value of OR, the stronger the dependence. Results And Discussion Actual Air Quality The overall country averages for PM10 calculated using the interpolated values were 116 µg/m3 and 70 µg/m3 before and after lockdown, respectively. Statistical analysis using a t-test showed that there was a significant difference in PM10 levels before and after lockdown, with p
with p 0.5 in North East states such as Arunachal Pradesh and Meghalaya, which shows that a

major portion of PM10 was PM2.5. The North East states are less industrialized and scarcely populated, and this

observation points to the long-distance transport of PM2.5 from other places. The country-wide average reduction

percentages for PM10 (44%) and PM2.5 (51%) were significantly different (p
were noticed in the high traffic zones of Noida, Greater Noida and Ghaziabad (52-74%), Haryana (74%), Kanpur

(54-66%), Chennai (67%), Udaipur (68%), Kota (57%), Jodhpur (55%), Jaipur (66%), Mizoram (74%), Mumbai

(67-88%), Nagpur (60%), Navi Mumbai (85%), Tirupati (76%), and Thiruvananthapuram (65%). Reductions were

also observed in traffic zones of Delhi (50 to 75%), Madhya Pradesh (60 to 70%), and Bangalore (58-80%).

Among petrol and diesel vehicles, a higher contribution of NO2 is from diesel vehicles (European Union 2019).

The fact that a major portion of the vehicles registered in the country are diesel vehicles (Government of India

2015) could also have contributed to the higher reduction of NO2. In Delhi, compressed natural gas (CNG)

vehicles constitute a significant portion of the vehicles on the road. Studies have confirmed that although CNG

vehicles emit fewer pollutants than petrol and diesel vehicles with respect to PM10, PM2.5 and SO2, there is not

much reduction in NO2 emissions (Narain and Krupnick 2011).

The overall country averages using the interpolated value for SO2 were 14 µg/m3 and 11 µg/m3 before and after

lockdown, respectively. Statistical analysis using a t-test showed that there was a significant difference in SO2

levels before and after lockdown with p0.05. Fig 1 (m-o)

shows O3 levels before and after lockdown and improvement in O3 levels during lockdown. The highest average

O3 concentration before lockdown was observed in some areas of Rajasthan and Madhya Pradesh. During the

                                                    Page 12/33
lockdown period, a decrease in O3 concentration was observed in the southern, some parts of the western, and
some northeastern states. At the same time, Madhya Pradesh, some areas of Rajasthan, a few Northern states,
and West Bengal showed slight increases in O3 concentration levels. The highest increase was observed in the
eastern regions and in the northern states of Delhi, Uttaranchal, Haryana, and Uttar Pradesh, where the PM10
concentrations were higher before the lockdown period.
The country experienced an overall increase in AQI levels, as shown in Fig 1(p). The highest improvement in AQI
was seen in West Bengal (61.89%), followed by Arunachal Pradesh (47.80%) and Meghalaya (47.58%). The least
change was observed in Orissa (3.55%). The AQI values in Orissa before and after lockdown were 132.49 and
127.78, respectively. Even before lockdown, the AQI in the southern states was in the satisfactory range. Among
the major cities, the highest percentage reduction in AQI was in Jaipur, followed by Kolkata, Mumbai, Pune and
New Delhi. The lowest reduction was observed in Chennai. The other major cities, such as Bangalore,
Hyderabad and Ahmedabad, had intermediate percentage reductions in AQI values. Although the lowest AQI
value before lockdown was observed in Chennai, the lowest value after lockdown was found in Jaipur.
Additionally, the highest value before and after lockdown was observed in New Delhi.
The interpolated values of pollutant concentrations were compared with NAAQS to determine the number of
days when it exceeded the permissible limits (Fig 2(a & b)). It was observed that gaseous pollutants (NO2, SO2
and O3) were within the permissible limits before and after lockdown. In the case of West Bengal, Telangana,
Meghalaya, Maharashtra, Kerala, Karnataka, Chandigarh and Andhra Pradesh, there was no day when the state
average value exceeded the permissible limits as prescribed by CPCB in the case of PM10 after the
implementation of lockdown. The percentage reduction of pollution in all three categories of areas (traffic,
residential, and industrial) was approximately 40% after the implementation of COVID-19 lockdown, as shown in
Fig. 3. As per the 2011 census data, the most populated cities in India are Mumbai, Delhi, Bangalore, Hyderabad,
Ahmedabad, Chennai, Kolkata, Surat, Pune and Jaipur. Except for Surat, data were available for all these cities.
For PM2.5, most of the cities showed a more than 50% reduction in concentration after the start of lockdown, as
shown in Fig. 4. In all the cities, the mean concentration values came below the CPCB standards for ambient air,
and the daily average values stayed within limits for approximately 95% of days. Similar observations were also
observed in the case of PM10. Its mean concentration fell to within the CPCB limits in all cities except Delhi,
Page 13/33where it just crossed the limit. The concentration decreased by approximately 47% in these cities, and the values remained within the limit for approximately 91% of the days. In the case of NO2 and SO2, the ambient air concentrations were within the limits in all these cities even before lockdown. The lockdown further reduced their concentrations by 30.45 µg/m3 to 14.64 µg/m3 for NO2 and 14 µg/m3 to 11 µg/m3 for SO2. Their values exceeded the permissible limits (80 µg/m3) for a very few days (
PM10 PM2.5 NO2 SO2 O3
PM10 1
PM2.5 .880**1 1
.746**2
NO2 .473**1 .555** 1
.341**2 .342**
SO2 .212**1 .228** .107 1
.346**2 .360** .138
O3 -.0571 -.061 .002 .043 1
.247**2 .214** .003 0.860
**- correlation is significant at the 0.01 level (2-tailed), BL- Before lockdown, AL- After lockdown.
Perceived air quality
2
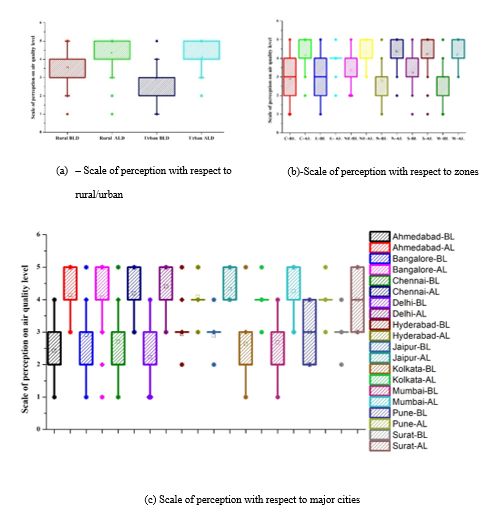
On conducting tests on the responses obtained from rural and urban populations, a significant difference in
opinion was noticed between them; 2 (2, N= 1750) = 43.99, p < 0.05. Urban responders felt higher improvement
in air quality during the lockdown (64% to 49%). The observed effect size was Cramer’s V = 0.2, indicating a
small effect size in the difference in perception. This shows that although there is a significant difference in the
opinion, the people in both rural and urban environments have perceived improvement in air quality. Considering
the different types of locality (residential, traffic, industrial), a significant difference in opinion was observed, 2
(2, N= 1395) = 18.987, p Near to traffic
junctions > Residential > Near to hospital, as shown in fig 5. Nearness to hospital was considered a separate
category expecting more traffic near hospitals due to the pandemic situation. More than half of the respondents
in all major cities perceived improvement in air quality: Delhi (100%), Ahmedabad (85%), Chennai (83%),
Mumbai (80%), Bangalore (65%), Jaipur (66%) and Hyderabad (54%).
A nonparametric (independent sample Kruskalwallis) test was conducted to establish differences in opinion
among different zones in India. In the case of visibility, the opinion on improvement was found to be similar on
pairwise comparison across all the zones in the country, except in the case of Southern zonal council vs.
Northern zonal council and Southern zonal council vs. Central zonal council, with p value of < 0.05. Similarly, in
the case of perception on improvement of health, significant differences in responses were obtained from the
North Eastern vs. Central and Western zonal council and Northern vs. Central zonal council, with a p value ofand southern zonal council, as in the case of visibility. The mean rating (on a five-point scale) of air quality
perception in the case of rural areas increased from 3.5 to 4.3, whereas in the case of urban areas, it increased
from 2.9 to 4.12. The improvement in the perception of air quality is shown in Fig. 6 (a). In a zone-wise
comparison, people from all zones felt air quality to be ‘excellent’ after lockdown, as shown in Fig. 6 (b).
Responses from major cities in India were analyzed separately, and it was found that the mean perception of
Ahmedabad changed from 2.4 to 4.1, Bangalore and Hyderabad changed from 2.92 to 4, Chennai changed from
2.7 to 4.2, Delhi changed from 2.2 to 4.5, Jaipur changed from 2.8 to 4.3, Kolkata and Mumbai changed from 2.6
to 4.2, and Pune and Surat changed from 3 to 4, as represented in fig 6 (c). This indicates that respondents from
major cities across India perceived improvement in air quality during this lockdown period. The obtained
perception scales and geolocations were directly subjected to geo-spatial analysis using ArcGIS. The maps in
Fig. 7 (a-c) indicate the perception before and after lockdown and the change in perception due to the lockdown.
Most people perceived the air as moderately polluted before lockdown. From the plots obtained for perception of
air quality after lockdown, it is clear that most people perceived air quality as satisfactory or good. Therefore, it
can be interpreted that the lockdown has created a positive feeling among people regarding the air quality in the
country.
The major sources of pollution as perceived by the respondents before lockdown were Vehicular Pollution >
Road dust > Construction works > Industries > Road side burning > Burning of agricultural waste >Power plant.
However, after lockdown, the order was Household emissions> Solid waste burnings > Traffic > None
>Industrial activities> others. Other factors included burning of crackers, spraying of disinfectant chemicals and
smoking. The perception of sources among different localities and zonal councils is given as supplementary
material.
The results from Google Trend Analysis (https://trends.google.com/trends/?geo=US) showed that terms related
to air pollution (‘air quality’, ‘air quality index’, ‘air pollution’, ‘AQI’) were trending from October to December
2019, as shown in Fig. 8. As per the Google Trend Analysis, maximum searches occurred in North Indian states
such as Delhi, Haryana, Uttar Pradesh, Punjab, Uttarakhand, and Himachal Pradesh. October to December is the
time period every year North and North West India face severe air pollution due to stubble burning compounded
by meteorological conditions (Rizwan et al. 2013; Patel 2019). The trend that declined drastically after the
annual pollution episode continued decreasing to the lockdown period, albeit at a smaller rate, except for a small
spike on 22/03/2020, the day when the Janata curfew was implemented. This trend can be interpreted as a lack
Page 16/33of influence of media on the perception of air quality by the public. Similar inferences were made by Searle et
al., (2020) and Szmuda et al.,(2020).
Relationship between PAQ and AAQ
Our perception survey showed that approximately 60% of the respondents perceived improvement in air quality
during the COVID-19 lockdown compared to the pre-lockdown period. The analysis of the air quality monitoring
data showed that from the pre-lockdown to lockdown period, the AQI improved by 40% in the country. To have a
quantitative comparison, the perceived air quality was obtained on a rating scale from 1 to 5 (Poor to Good). The
pollutant concentrations were converted to the same rating scale (1 to 5) as per the break points proposed by
CPCB. The results from the paired t-test showed that there was a significant difference (p0.05) between air quality perception and PM10 level, but there was a significant difference between the
perception and levels of SO2, NO2 and O3 (P=0.00). This shows that among various pollutants, PM influenced
perception most, possibly because of its contribution to visibility. Several studies have shown a clear association
between PM10 levels and visibility, with an increase in PM10 levels resulting in lower visibility (Zhao et al. 2013;
Huang et al. 2016). In earlier days, before the invention of air quality monitoring instruments, visibility was the
parameter that was used to assess the air quality. Visibility impairment is caused by scattering and absorption of
visible light by the suspended particulates and gaseous pollutants present in the atmosphere (Hyslop 2009; Lee
et al. 2015; Majewski et al. 2015). In urban environments, visibility impairment is closely associated with
pollutants emitted from anthropogenic sources such as automobile exhaust, combustion of fuel, emission from
industries, etc. (Tsai et al. 2007; Deng et al. 2008; Majewski et al. 2015). It was also observed that this visibility
impairment is mainly due to airborne particulate matter (Malm and Day 2001; Tsai et al. 2003).
Table 3 Results of paired sample t-test
Page 17/33Paired Differences t Sig.
Mean Std. Std. Error 95% Confidence Interval of (2-
Deviation Mean the Difference tailed)
Lower Upper
AQ BL– AQ AL -.80952 1.32737 .28966 -1.41373 -.20531 -2.795 .011
AP BL– APAL -.95238 .58959 .12866 -1.22076 -.68400 -7.402 .000
APBL– AQ BL 0.00000 .94868 .20702 -.43184 .43184 0.000 1.000*
AP AL- AQ AL .14286 .91026 .19863 -.27149 .55720 .719 .480*
AP BL - PM10 -.09524 .62488 .13636 -.37968 .18920 -.698 .493*
BL
AP AL - PM10 .14286 .65465 .14286 -.15514 .44085 1.000 .329*
AL
AP BL – PM2.5 -.33333 .73030 .15936 -.66576 -.00091 -2.092 .049
BL
AP AL – PM2.5 -.33333 .65828 .14365 -.63298 -.03369 -2.320 .031
AL
AP BL - NO2 -1.71429 .46291 .10102 -1.92500 -1.50357 -16.971 .000
BL
AP AL - NO2 AL -.85714 .35857 .07825 -1.02036 -.69392 -10.954 .000
APBL - SO2 BL -1.80952 .40237 .08781 -1.99268 -1.62637 -20.608 .000
AP AL - SO2 AL -.85714 .35857 .07825 -1.02036 -.69392 -10.954 .000
AP BL - O3 BL -1.80952 .40237 .08781 -1.99268 -1.62637 -20.608 .000
Page 18/33AP AL - O3 AL -.80952 .40237 .08781 -.99268 -.62637 -9.220 .000
PM10 BL - -.71429 .56061 .12234 -.96947 -.45910 -5.839 .000
PM10 AL
PM 2. 5 BL – -.95238 .58959 .12866 -1.22076 -.68400 -7.402 .000
PM2.5 AL
NO2 BL - NO2 -.09524 .30079 .06564 -.23216 .04168 -1.451 .162*
AL
O3 BL- O3 AL .04762 .21822 .04762 -.05171 .14695 1.000 .329*
*p>0.05 – There is no significant difference between the pairs: AQ – Actual air quality, AP – Air quality
perception, BL- Before lockdown, AL- After lockdown.
The odds ratio (OR), often used in medical statistics, represents the odds that an outcome will occur given a
particular exposure compared to the odds of the outcome occurring in the absence of that exposure (Szumilas
2010). It is extensively used to analyze the relationship between exposure to pollutants and its health impacts
(Baxter et al. 2010; Lee et al. 2014; Yorifuji et al. 2014; Klompmaker et al. 2019). It is also used in air quality
perception studies (Malenka et al. 1993; VanderWeele and Vansteelandt 2010; Voda et al. 2020). To quantify
how the change in air quality actually changed the perception, responses from a city with one of the highest
reductions of pollution (Delhi -72 responses) and an area where there was only a small reduction in pollution
after lockdown (Rural Telangana -39 responses) were used to calculate the odds ratio. The details of the
responses are given in Table 4.
Table 4 Inputs for the determination of odds ratio
Delhi Rural Telangana
No of respondents perceived significant improvement in air quality 57(Npi) 7 (Npn)
No of respondents perceived no improvement in air quality 15 (Nni) 32 (Nnn)
Page 19/33The OR obtained is 17, which indicates that the perception improvement in air quality is highly dependent on the
actual improvement in the air quality. Higher odds ratios indicate higher dependence between PAQ and AAQ.
Qualitative interpretation of the suggestions
The words were decoded from the suggestions based on the frequency of appearance. The suggestions given by
the respondents were to lift the lockdown scientifically, to implement strict regulations with respect to traffic,
industries, vehicular emissions and trash burning on road margins, living in harmony with nature, strengthening
public transportation and adoption of carpooling systems, promotion of E-vehicles and bio-fuels, plantation of
trees, installation of air quality monitors across the country and creating awareness among the public about the
improvement in air quality levels and maintenance of the same.
Conclusion
From this study, it is evident that there is signi cant improvement in the actual and perceived air quality in
India after the COVID-19-induced lockdown. Approximately 60% of the respondents perceived
improvement in air quality, and there was approximately 40% improvement in the monitored air quality
across the country. It is evident that the respondents perceived improvement in air quality without the
in uence of media. The reduction in air pollution was investigated with respect to three different zones.
Major tra c zones across the country have experienced signi cant improvement in the NO2 level due to
the decrease in vehicular load. Similarly, a signi cant reduction in SO2 levels was observed in industrial
belts and coal mines. The correlation matrix developed gave a clear association between the pollutants
and the possible sources. During the lockdown period, an increased photochemical reaction was
observed, which led to an increase in the levels of ozone at many locations. Along with improvements in
air quality, signi cant improvements in visibility, indoor air quality and health were perceived by the
respondents. The perception of improvement in air quality was in uenced mainly by the reduction in
particulate matter. The odds ratio showed a very strong dependence of perception on actual air quality.
Suggestions by the public for maintaining air quality even after lifting the COVID-19 lockdown are also
given in this study.
Declarations
Funding: No funds received
Con icts of interest/Competing interests: The authors declare that they have no known competing
interests.
Availability of data and material: Added as supplementary material
Code availability: Not applicable
Page 20/33Authors' contributions: Abinaya Sekar: Conceptualization, Methodology, Writing - Original Draft,
Visualization, Formal Analysis. Jasna R S: Writing - Original Draft, Formal Analysis. Binoy B V:
Visualization. Prem Mohan: Formal Analysis, Investigation. George K. Varghese: Conceptualization,
Methodology, Validation, Writing - Review & Editing, Supervision.
The study involved analysis of perception of the general public on improvement in air quality during
COVID 19 lockdown. No approval is required from any committee to conduct such studies in India. No
personal information was collected from any responders during our perception study that would reveal
the identity of the respondent. Further, no individual responses are presented in the manuscript, but only
results of aggregate analysis.
References
Bao R, Zhang A (2020) Jo ur na l P. Sci Total Environ 139052. doi: 10.1016/j.scitotenv.2020.139052
Baxter LK, Wright RJ, Paciorek CJ, et al (2010) Effects of exposure measurement error in the analysis of
health effects from tra c-related air pollution. J Expo Sci Environ Epidemiol 20:101–111. doi:
10.1038/jes.2009.5
Binaku K, Schmeling M (2017) Multivariate statistical analyses of air pollutants and meteorology in
Chicago during summers 2010-2012. Air Qual Atmos Heal 10:1227–1236. doi: 10.1007/s11869-017-
0507-7
Brandt EB, Biagini JM, Ryan PH (2015) Air pollution and allergic diseases. 27:724–735. doi:
10.1097/MOP.0000000000000286
Brody SD, Peck BM, High eld WE (2004) Examining localized patterns of air quality perception in Texas: A
spatial and statistical analysis. Risk Anal 24:1561–1574. doi: 10.1111/j.0272-4332.2004.00550.x
Brosschot JF, Gerin W, Thayer JF (2006) The perseverative cognition hypothesis: A review of worry,
prolonged stress-related physiological activation, and health. J Psychosom Res 60:113–124. doi:
10.1016/j.jpsychores.2005.06.074
Chen H, Guo J, Wang C, et al Clinical characteristics and intrauterine vertical transmission potential of
COVID-19 infection in nine pregnant women : a retrospective review of medical records. Lancet 395:809–
815. doi: 10.1016/S0140-6736(20)30360-3
Costa LG, Cole TB, Dao K, et al (2020) Pharmacology & Therapeutics Effects of air pollution on the
nervous system and its possible role in neurodevelopmental and neurodegenerative disorders. Pharmacol
Ther 107523. doi: 10.1016/j.pharmthera.2020.107523
Page 21/33CPCB (2020a) Central Control Room for Air Quality Management - All India.
https://app.cpcbccr.com/ccr/#/caaqm-dashboard-all/caaqm-landing. Accessed 8 Apr 2020
CPCB (2020b) National Network. https://app.cpcbccr.com/ccr_docs/National_Network.pdf
CPCB (2014) National Air Quality Index
Cristina M, Abbà A, Bertanza G, et al (2020) Science of the Total Environment Lockdown for CoViD-2019
in Milan : What are the effects on air quality ? Sci Total Environ 732:139280. doi:
10.1016/j.scitotenv.2020.139280
Dang R, Liao H (2017) Radiative forcing and health impact of aerosols and ozone in China as the
consequence of clean air actions over 2012-2017. 0–2. doi: 10.1029/2019GL084605
Dantas G, Siciliano B, Boscaro B, et al (2020) The impact of COVID-19 partial lockdown on the air quality
of the city of Rio de Janeiro , Brazil. Sci Total Environ 729:139085. doi: 10.1016/j.scitotenv.2020.139085
Davis ME (2012) Recessions and health: The impact of economic trends on air pollution in California. Am
J Public Health 102:1951–1956. doi: 10.2105/AJPH.2012.300658
Davis ME, Laden F, Hart JE, et al (2010) Economic activity and trends in ambient air pollution. Environ
Health Perspect 118:614–619. doi: 10.1289/ehp.0901145
Deng X, Tie X, Wu D, et al (2008) Long-term trend of visibility and its characterizations in the Pearl River
Delta (PRD) region, China. Atmos Environ 42:1424–1435. doi: 10.1016/j.atmosenv.2007.11.025
Ebqa’ai M, Ibrahim B (2017) Application of multivariate statistical analysis in the pollution and health risk
of tra c-related heavy metals. Environ Geochem Health 39:1441–1456. doi: 10.1007/s10653-017-9930-9
Elliott SJ, Cole DC, Krueger P, et al (1999) The Power of Perception : Health Risk Attributed to Air Pollution
in an Urban Industrial Neighbourhood. 19:
Engen T (1991) Odor sensation and memory. New York: Praeger
Environmental Systems Research Institute (2016) How Kriging works. In: ESRI.
https://desktop.arcgis.com/en/arcmap/10.3/tools/3d-analyst-toolbox/how-kriging-
works.htm#:~:text=The kriging formula,-Kriging is similar&text=Thus%2C in ordinary kriging%2C
the,values around the prediction location. Accessed 8 Apr 2020
Escudero M, Segers A, Kranenburg R, et al (2019) Analysis of summer O 3 in the Madrid air basin with the
LOTOS-EUROS chemical transport model. 14211–14232
European Union (2019) Air quality: tra c measures could effectively reduce NO2 concentrations by 40%
in Europe’s cities. https://ec.europa.eu/jrc/en/news/air-quality-tra c-measures-could-effectively-reduce-
no2-concentrations-40-europe-s-cities. Accessed 8 Oct 2020
Page 22/33Evans GW, Colome SD, Shearer DF (1988) Psychological Reactions to Air Pollution. 15:
Gorai AK, Tchounwou PB, Mitra G (2017) HHS Public Access. 17:951–964. doi:
10.4209/aaqr.2016.08.0374.Spatial
Government of India (2019) Zonal Council. In: Minist. Home Aff. https://www.mha.gov.in/zonal-council.
Accessed 8 May 2020
Government of India (2015) Total Number of Registered Motor Vehicles in India.
https://data.gov.in/catalog/total-number-registered-motor-vehicles-india?
lters%5B eld_catalog_reference%5D=92126&format=json&offset=0&limit=6&sort%5Bcreated%5D=desc.
Accessed 8 Oct 2020
Guo Y, Liu F, Lu Y, et al (2016) Factors Affecting Parent ’ s Perception on Air Quality — From the Individual
to the Community Level. Int J Environ Res Public Health 13:1–14. doi: 10.3390/ijerph13050493
Gurjar BR, Ravindra K, Nagpure AS (2016) Air pollution trends over Indian megacities and their local-to-
global implications. Atmos Environ. doi: 10.1016/j.atmosenv.2016.06.030
Guttikunda SK, Nishadh KA, Jawahar P (2019) Air pollution knowledge assessments (APnA) for 20 Indian
cities. Urban Clim 27:124–141. doi: 10.1016/j.uclim.2018.11.005
Howel D, Moffatt S, Bush J, et al (2003) Public views on the links between air pollution and health in
Northeast England. 91:163–171. doi: 10.1016/S0013-9351(02)00037-3
Huang C, Wang Y, Li X, et al (2020) Articles Clinical features of patients infected with 2019 novel
coronavirus in Wuhan , China. 6736:1–10. doi: 10.1016/S0140-6736(20)30183-5
Huang L, Chen M, Hu J (2016) Twelve-Year Trends of PM10 and Visibility in the Hefei Metropolitan Area
of China. Adv Meteorol 2016:25–27. doi: 10.1155/2016/4810796
Hyslop NP (2009) Impaired visibility: the air pollution people see. Atmos Environ 43:182–195. doi:
10.1016/j.atmosenv.2008.09.067
ICRA (2020a) Covid-19 Impact: Short-term negative impact on the Healthcare sector
ICRA (2020b) Ripple effect of COVID outbreak to impact India Inc
ICRA (2020c) Indian Port Sector: Global impact of the corona virus a negative for exim volumes at Indian
ports - Trends & Outlook
Kerimray A, Baimatova N, Ibragimova OP, et al (2020) Science of the Total Environment Assessing air
quality changes in large cities during COVID-19 lockdowns : The impacts of traf c-free urban conditions
in Almaty , Kazakhstan. Sci Total Environ 730:139179. doi: 10.1016/j.scitotenv.2020.139179
Page 23/33Klompmaker JO, Janssen NAH, Bloemsma LD, et al (2019) Associations of combined exposures to
surrounding green, air pollution, and road tra c noise with cardiometabolic diseases. Environ Health
Perspect 127:1–15. doi: 10.1289/EHP3857
Kohlhuber M, Mielck A, Weiland SK, Bolte G (2006) Social inequality in perceived environmental
exposures in relation to housing conditions in Germany. Environ Res 101:246–255. doi:
10.1016/j.envres.2005.09.008
Kumar Jha D, Sabesan M, Das A, et al (2011) Evaluation of Interpolation Technique for Air Quality
Parameters in Port Blair, India. Univers J Environ Res Technol 1:301–310
Lan G, Yuan Z, Maddock JE, et al (2016) Public perception of air pollution and health effects in Nanchang
, China. doi: 10.1007/s11869-016-0397-0
Landrigan PJ, Fuller R, Acosta NJR, et al (2017) The Lancet Commissions The Lancet Commission on
pollution and health. 6736:. doi: 10.1016/S0140-6736(17)32345-0
Lee JY, Jo WK, Chun HH (2015) Long-term trends in visibility and its relationship with mortality, air-quality
index, and meteorological factors in selected areas of Korea. Aerosol Air Qual Res 15:673–681. doi:
10.4209/aaqr.2014.02.0036
Lee JY, Lee SB, Bae GN (2014) A review of the association between air pollutant exposure and allergic
diseases in children. Atmos Pollut Res 5:616–629. doi: 10.5094/APR.2014.071
Lelieveld J, Evans JS, Fnais M, et al (2015) The contribution of outdoor air pollution sources to premature
mortality on a global scale. doi: 10.1038/nature15371
Li K, Jacob DJ, Liao H, et al (2018) Anthropogenic drivers of 2013 – 2017 trends in summer surface
ozone in China. 1–6. doi: 10.1073/pnas.1812168116
Li Z, Folmer H, Xue J (2016) Perception of Air Pollution in the Jinchuan Mining Area , China : A Structural
Equation Modeling Approach. Int J Environ Res 13:1–18. doi: 10.3390/ijerph13070735
Liu H, Kobernus M, Liu H (2017) Public Perception Survey Study on Air Quality Issues in Wuhan , China.
1194–1218. doi: 10.4236/jep.2017.810075
Lloyd C, Smith J, Weinger K (2005) Stress and iabetes: A review of the links. Diabetes Spectr 18:121–127.
doi: 10.2337/diaspect.18.2.121
Mahato S, Pal S, Ghosh KG (2020) Effect of lockdown amid COVID-19 pandemic on air quality of the
megacity Delhi , India. Sci Total Environ 730:139086. doi: 10.1016/j.scitotenv.2020.139086
Majewski G, Rogula-Kozlowska W, Czechowski PO, et al (2015) The impact of selected parameters on
visibility: First results from a long-term campaign in Warsaw, Poland. Atmosphere (Basel) 6:1154–1174.
Page 24/33doi: 10.3390/atmos6081154
Malenka DJ, Baron JA, Johansen S, et al (1993) The framing effect of relative and absolute risk. J Gen
Intern Med 8:543–548. doi: 10.1007/BF02599636
Mally KV (2016) Perceptions of air quality in Ljubljana. Dela 2016:77–88. doi: 10.4312/dela.46.3.67-88
Malm WC, Day DE (2001) Estimates of aerosol species scattering characteristics as a function of relative
humidity. Atmos Environ 35:2845–2860. doi: 10.1016/S1352-2310(01)00077-2
Mangia C, Cervino M, Gianicolo EAL (2015) Secondary particulate matter originating from an industrial
source and its impact on population health. Int J Environ Res Public Health 12:7667–7681. doi:
10.3390/ijerph120707667
Ministry of Home Affairs (2020) Government of India issues Orders prescribing lockdown for
containment of COVID-19 Epidemic in the country. In: Press Inf. Bur. Gov. India.
https://pib.gov.in/newsite/PrintRelease.aspx?relid=200655
Monks PS, Archibald AT, Colette A, et al (2015) Tropospheric ozone and its precursors from the urban to
the global scale from air quality to short-lived climate forcer. 8889–8973. doi: 10.5194/acp-15-8889-2015
MORTH (2019) Road Transport Year Book (2016-17)
Muhammad S, Long X, Salman M (2020) Science of the Total Environment COVID-19 pandemic and
environmental pollution : A blessing in disguise ? Sci Total Environ 728:138820. doi:
10.1016/j.scitotenv.2020.138820
Murukutla N, Kumar N, Mullin S (2019) A review of media effects: implications for media coverage of air
pollution and cancer. Ann Cancer Epidemiol 3:3–3. doi: 10.21037/ace.2019.07.03
Nagpure AS, Gurjar BR, Martel J (2014) A tm spheric P ollution pollution. 5:371–380. doi:
10.5094/APR.2014.043
Narain U, Krupnick A (2011) The Impact of Delhi’s CNG Program on Air Quality. SSRN Electron J. doi:
10.2139/ssrn.969727
NASA Earth observatory (2020) Airborne Nitrogen Dioxide Plummets Over China.
https://earthobservatory.nasa.gov/images/146362/airborne-nitrogen-dioxide-plummets-over-china
Nikolopoulou M, Kleissl J, Linden PF (2009) Perception Of Air Pollution And Comfort In The Urban
Environment
Norbäck D, Lu C, Zhang Y, et al (2019) Sources of indoor particulate matter ( PM ) and outdoor air
pollution in China in relation to asthma , wheeze , rhinitis and eczema among pre-school children :
Page 25/33Synergistic e ff ects between antibiotics use and PM 10 and second hand smoke. Environ Int 125:252–
260. doi: 10.1016/j.envint.2019.01.036
North Earth Observatory (2003) Chemistry in the Sunlight.
https://earthobservatory.nasa.gov/features/ChemistrySunlight/chemistry_sunlight3.php
Núñez-Alonso D, Pérez-Arribas LV, Manzoor S, Cáceres JO (2019) Statistical Tools for Air Pollution
Assessment: Multivariate and Spatial Analysis Studies in the Madrid Region. J Anal Methods Chem
2019:. doi: 10.1155/2019/9753927
Oltra C, Sala R (2016) Perception of risk from air pollution and reported behaviors : a cross-sectional
survey study in four cities cross-sectional survey study in four cities. J Risk Res 9877:1–16. doi:
10.1080/13669877.2016.1264446
Pantavou K, Psiloglou B, Lykoudis S, et al (2018) Perceived air quality and particulate matter pollution
based on eld survey data during a winter period. Int J Biometeorol 62:2139–2150. doi: 10.1007/s00484-
018-1614-3
Patel P (2019) Tackling Delhi’s Air Pollution Problem. ACS Cent Sci 5:3–6. doi:
10.1021/acscentsci.9b00009
R.B. Singh (2016) Progress in Indian Geography
Ramachandran A, Jain NK, Sharma SA, Pallipad J (2013) Recent trends in tropospheric NO2 over India
observed by SCIAMACHY: Identi cation of hot spots. Atmos Pollut Res 4:354–361. doi:
10.5094/APR.2013.040
Rizwan SA, Nongkynrih B, Gupta SK (2013) Air pollution in Delhi: Its Magnitude and Effects on Health.
Indian J Community Med 38:4–8. doi: 10.4103/0970-0218.106617
Schierhorn F, Kastner T, Kuemmerle T, et al (2019) Large greenhouse gas savings due to changes in the
post-Soviet food systems. Environ Res Lett 14:. doi: 10.1088/1748-9326/ab1cf1
Searle TN, Al-Niaimi F, Ali FR (2020) Dermatological insights from Google Trends: what does the public
think is important during COVID-19 lockdown? Clin Exp Dermatol 0–2. doi: 10.1111/ced.14319
Semenza JC, Wilson DJ, Parra J, et al (2008) Public perception and behavior change in relationship to hot
weather and air pollution $. 107:401–411. doi: 10.1016/j.envres.2008.03.005
Shagun Kapil (2019) Maharashtra, Gujarat top sulphur dioxide polluters in India. In: Down To Earth.
https://www.downtoearth.org.in/news/air/maharashtra-gujarat-top-sulphur-dioxide-polluters-in-india-
66250. Accessed 8 Dec 2020
Page 26/33Sharma S, Zhang M, Gao J, et al (2020) Science of the Total Environment Effect of restricted emissions
during COVID-19 on air quality in India. Sci Total Environ 728:138878. doi:
10.1016/j.scitotenv.2020.138878
Silver W (1991) Physiological factors in nasal trigeminal chemoreception. In: Green BG, Mason JR, Kare
MR, editors. Chemical senses, vol2, Irritation. Marcel Dekker, New York
Sucker K, Both R, Bischoff M, et al (2008) Odor frequency and odor annoyance. Part I: Assessment of
frequency, intensity and hedonic tone of environmental odors in the eld. Int Arch Occup Environ Health
81:671–682. doi: 10.1007/s00420-007-0259-z
Sullivan GM, Feinn R (2012) Using Effect Size—or Why the P Value Is Not Enough . J Grad Med Educ
4:279–282. doi: 10.4300/jgme-d-12-00156.1
Sunyer J, Forsberg B, Go T, et al (2007) Annoyance due to air pollution in Europe. doi:
10.1093/ije/dym042
Szmuda T, Ali S, Hetzger TV, et al (2020) Are online searches for the novel coronavirus (COVID-19) related
to media or epidemiology? A cross-sectional study. Int J Infect Dis 97:386–390. doi:
10.1016/j.ijid.2020.06.028
Szumilas M (2010) Explaining Odds Ratios. J Can Acad Child Adolesc Psychiatry 19:227–229. doi:
10.1136/bmj.c4414
Tsai YI, Kuo SC, Lee WJ, et al (2007) Long-term visibility trends in one highly urbanized, one highly
industrialized, and two Rural areas of Taiwan. Sci Total Environ 382:324–341. doi:
10.1016/j.scitotenv.2007.04.048
Tsai YI, Lin YH, Lee SZ (2003) Visibility variation with air qualities in the metropolitan area in southern
Taiwan. Water Air Soil Pollut 144:19–40. doi: 10.1023/A:1022901808656
US EPA (2019) Nitrogen Dioxide (NO2) Pollution. https://www.epa.gov/no2-pollution/basic-information-
about-no2#What is NO2. Accessed 8 Jun 2020
VanderWeele TJ, Vansteelandt S (2010) Odds ratios for mediation analysis for a dichotomous outcome.
Am J Epidemiol 172:1339–1348. doi: 10.1093/aje/kwq332
Voda AI, Butnaru GI, Butnaru RC (2020) Enablers of entrepreneurial activity across the european union-an
analysis using GEM individual data. Sustain 12:. doi: 10.3390/su12031022
Wang P, Chen K, Zhu S, et al (2020a) Resources , Conservation & Recycling Severe air pollution events not
avoided by reduced anthropogenic activities during COVID-19 outbreak. Resour Conserv Recycl
158:104814. doi: 10.1016/j.resconrec.2020.104814
Page 27/33You can also read