Long-Term Water Quality Patterns of a Flow Regulated Tropical Lowland River - MDPI
←
→
Page content transcription
If your browser does not render page correctly, please read the page content below
water
Article
Long-Term Water Quality Patterns of a Flow
Regulated Tropical Lowland River
Lizaan de Necker 1, * , Tinyiko Neswiswi 2 , Richard Greenfield 2 , Johan van Vuren 1 ,
Luc Brendonck 1,3 , Victor Wepener 1 and Nico Smit 1
 1   Water Research Group, Unit for Environmental Sciences and Management, North-West University,
     Private Bag X6001, Potchefstroom 2520, South Africa; jjvvuren@gmail.com (J.v.V.);
     luc.brendonck@kuleuven.be (L.B.); victor.wepener@nwu.ac.za (V.W.); nico.smit@nwu.ac.za (N.S.)
 2   Department of Zoology, University of Johannesburg, Auckland Park 2006, South Africa;
     MpeteT@dws.gov.za (T.N.); rgreenfield@uj.ac.za (R.G.)
 3   Animal Ecology, Global Change and Sustainable Development, Department of Biology,
     University of Leuven, 32 Charles Deberiotstraat, 3000 Leuven, Belgium
 *   Correspondence: lizaan.denecker@gmail.com

 Received: 4 November 2019; Accepted: 13 December 2019; Published: 20 December 2019

 Abstract: Floodplain ecosystems in Africa are under threat due to direct anthropogenic pressure and
 climate change. The lower Phongolo River and associated floodplain is South Africa’s largest inland
 floodplain ecosystem and has been regulated by the Pongolapoort Dam since the 1970s. The last
 controlled flood release from the dam occurred in December 2014, after which a severe drought
 occurred and only a base flow was released. The central aims of this study were to determine the
 historic and present water quality state of the middle and lower Phongolo River and assess the
 possible effects of the most recent drought may have had. Historic water quality data (1970s to present)
 were obtained from monitoring stations within the Phongolo River catchment to assess the long-term
 water quality patterns. Using multivariate statistical analyses as well as the Physicochemical Driver
 Assessment Index (PAI), a water quality index developed for South African riverine ecosystems,
 various in situ and chemical water variables were analysed. Key findings included that the water
 quality of the middle and lower Phongolo River has degraded since the 1970s, due to increased salinity
 and nutrient inputs from surrounding irrigation schemes. The Pongolapoort Dam appears to be
 trapping nutrient-rich sediments leading to nutrient-depleted water entering the lower Phongolo River.
 The nutrient levels increase again as the river flows through the downstream floodplain through
 input from nutrient rich soils and fertilizers. The drought did not have any significant effect on water
 quality as the PAI remained similar to pre-drought conditions.

 Keywords: anthropogenic effects; drought; dams; floodplain system; sediment retention; salinization;
 Southern Africa; South Africa

1. Introduction
     Numerous causes exist that may change or degrade river water quality [1]. These include natural
processes such as natural high and low flows and weathering of soils and rock, and/or human activities
such as the construction of dams and the discharge of industrial and domestic wastewater, as well
as agricultural drainage [2–4]. These phenomena can be exacerbated by climatic conditions such as
drought, one of the most prominent effects of which is reduced flow, which places additional stress on
freshwater ecosystems already impacted by human activities [5,6].
     Although the construction of dams is a necessity that supplies water for agricultural, industrial
and domestic use, it is well documented that dams have the potential to cause severe negative

Water 2020, 12, 37; doi:10.3390/w12010037                                      www.mdpi.com/journal/water
Water 2020, 12, 37 2 of 22
impacts on the environment, as well as on the biophysical characteristics of a river both downstream
and upstream of the impoundments [7–10]. Effects include altering the magnitude and velocity of
floods and river flows either upstream or downstream of the dam [11], sediment trapping within
the impoundment [10,12,13], loss of fertile topsoil downstream of the dam [8,14], nutrient retention
within the impoundment [13], nutrient loading downstream of the dam and loss of biodiversity,
particularly fish and macroinvertebrates [9,15,16]. The type and magnitude of these effects may differ
between systems and is highly dependent on the size of the dam, whether hyper- or hypolimnetic
discharge occurs, the purpose for which it was built, the type of river it is located on and the natural
variability and function of rivers [12,17,18]. Through controlled flooding regimes, water may be
released from an impoundment in a variety of patterns that differ from the natural hydrological regime
of a river and thus impacts on the downstream ecosystem [12,19–21], the most prominent impact being
reduced downstream flow [8,22]. Reduced river discharge may result in a reduced flooding area and
environmental flow, leading to variation in natural abiotic and biotic processes [23] such as nutrient
cycling and the migration and spawning of fish [8,24].
Low-flow drought disturbances are either seasonal or supra-seasonal [25] and may further
exacerbate the effects already present in regulated and anthropogenically utilised rivers.
Seasonal droughts are disturbances in the environment that occur on a regular, predictable basis and,
when accompanied by regular floods, have been proven to enhance the productivity of an ecosystem
(e.g., the Flood-Pulse concept formulated by Junk et al. [26,27]. Conversely, supra-seasonal droughts are
thought of as ramps in nature (disturbances that increase in strength and spatial extent over time) and
are the result of declined rainfall over an extended period, usually several seasons [28,29]. These types
of drought have already increased in frequency and intensity in many regions worldwide, most
prominently in semi-arid countries such as Australia and southern Africa [30–32]. Most current
knowledge regarding the effects of and biotic responses to drought arise from studies in temporary
wetlands and predictable seasonal droughts, while less has been accomplished on the effects that an
unpredictable supra-seasonal drought may have on ecosystems associated with regulated rivers [25,33].
When combined with human activities such as the overexploitation of resources, water pollution,
habitat destruction, water abstraction, dams and regulated discharge, the impact of drought and the
potential ecological changes thereof become more uncertain [25,30]. In addition to these issues and a
lack of knowledge, a review by Mosley [32] revealed that very little published information is available
regarding the impact of drought on water quality in Africa.
Agriculture has both direct and indirect effects not only on surface but also groundwater quality
and is one of the principal causes of water quality degradation, particularly in rural areas [1,34].
Sources of pollution associated with agriculture (agro-pollutants) include livestock, nitrate- and
phosphate-rich fertilizers, metals, pathogens, pesticides, irrigation and the removal of natural habitats
for farms and plantations [1,34]. Agro-pollutants may cause both acute and long-term degradation
and change in water quality and the aquatic community [34]. South Africa has a well-developed
commercial agricultural industry, as well as subsistence agricultural activities predominantly in rural
areas [34], and many of these occur in close proximity to rivers and dams. The Phongolo River is a
prime example of this, as the largest part of its catchment is covered by forestry plantations, commercial
and subsistence farming [35] as well as pivot irrigation (water sprinkler irrigation with a central pivot
system; [36]). The Phongolo River is also a cross-border river, as it is shared with Mozambique, and
is important to both countries [35]. Careful monitoring of water quality over long-and short-term
periods of such cross-border systems is not only ecologically but also politically important [37].
For efficient management, and to minimize impacts on downstream water quality and ecological
functions and services (which may support both environmental and human health and wellbeing),
it is important to maintain the ecological integrity of an ecosystem [4,8,38]. An aspect of ecological
integrity assessment includes the monitoring and analysis of spatio-temporal patterns in the abiotic and
biotic water quality of a river. Traditionally, this has been accomplished based on spot water samples
and a comparison with existing experimentally determined guidelines [39] such as the Target WaterWater 2020, 12, 37 3 of 22
Quality Guidelines (TWQG) created by the Department of Water Affairs and Forestry (DWAF) for
South African aquatic ecosystems [40]. Although useful, spot water samples only provide a momentary
indication of water quality with no clear long-term trends or changes in chemical concentrations [41].
Experimentally determined guidelines also do not provide a holistic view of the spatial, seasonal or
historic trends or variations in the studied waterbody [42]. Long-term data are therefore essential to
establish a baseline of water quality and to evaluate the effects of natural and anthropogenic induced
changes in water resources [38]. Such data sets also indicate long-term changes in catchment responses
and may contain evidence of rare events (e.g., severe droughts or floods) or rapid shifts in the system’s
behaviour [43–45]. Globally, studies have made use of long-term data in order to assess changes in river
water quality including nitrate fluxes [46], hydrology [38], the effects of agriculture [47], the impact
of reservoir construction on downstream flow regime [9] and the effects of land use changes [48].
In addition, the use of multivariate approaches and water quality indices, such as the Physicochemical
Driver Assessment Index (PAI), allows for the interpretation of complex data sets in order to better
understand the quality and ecological status of a studied ecosystem [3]. Multivariate analysis enables
the discovery of possible drivers that may be influencing water quality and easily identifies and
interprets water trends [49,50]. Simultaneously, water quality indices ascribe a unitless qualitative
value to an aggregate set of measured variables and is based on a set of scientifically determined
criteria [50]. The PAI is a water quality index developed for South African riverine ecosystems in
order to determine the state of the physical and chemical water quality for a resource unit or a specific
site [51–53].
In riverine systems associated with floodplains, increased water usage for irrigation reduces
the total water supply and groundwater recharge further downstream. This may lead to a drop in
the water table, diminishing the extent of the active floodplain, causing salinization and potentially
invasion by exotic species [8]. Salinization may be further exacerbated through decreased natural
flow and drought, which increases the total dissolved solids (TDS) and conductivity and changes
the ionic composition [54–56]. Many large floodplain systems in Africa are still unstudied and in a
relatively natural state, but due to water management strategies such as the construction of dams,
irrigation schemes and improperly managed flood release, these systems are under severe pressure [23].
This is certainly the case for the Phongolo floodplain. This is South Africa’s largest inland floodplain
system, and it is under threat due to land use, water abstraction [57] and, more recently, a severe
supra-seasonal drought [58,59]. The floodplain is dependent on water from annual controlled flood
releases from the Pongolapoort Dam, completed in 1973, located upstream of the floodplain [20].
Although guidelines suggesting the volume, frequency, duration and timing of the flood were proposed
in the 1970s–1980s [60,61], these have not been implemented. In addition, at the time of the present
study between 2016 and 2017, South Africa was in the grips of the most severe supra-seasonal drought
the country had experienced in 23 years [59], and therefore no floods had been released from the
Pongolapoort Dam for two years.
Water quality data have been collected across South Africa since the early 1970s. A substantial
amount of analytical data are available for the for the Phongolo River in northern KwaZulu-Natal
dating back to the early 1970s, due to regular assessments of monitoring stations and the completion of a
water quality study on the system [62]. Possible impacts of the agricultural developments surrounding
Pongolapoort Dam and the upper Phongolo River have been mentioned in previous assessments of the
area (e.g., [35,63–65]). However, these studies largely focused on the middle and upper reaches of the
catchment and there is still a lack of summarizing studies considering long-term analysis of the river
itself, particularly in its downstream region. This includes determining the possible long-term effects of
the dam and agricultural activities, assessing potential changes as a result of increased human activity,
and the effects of drought on this ecologically and economically important river. This information is
critical for determining sustainability and biodiversity conservation within the ecosystem. Concerns have
also been raised regarding not only the effect of the flood releases on the downstream ecosystem, whichWater 2020, 12, 37 4 of 22
is still poorly understood, but also the human activities occurring on the floodplain and in the upper
reaches of the river’s catchment.
The central aim of this study was to assess the historical water quality of the middle and lower
Phongolo River and determine the trends and potential changes in water quality variables from the
1970s to 2017. A second aim was to determine whether the Pongolapoort Dam has had any effect on
water quality of the lower Phongolo River. The final aim was to ascertain whether the most recent
severe supra-seasonal drought experienced from 2015 to 2017 led to changes in the water quality of the
Phongolo River. These aims were achieved by assessing chemical water quality variables collected from
the Department of Water and Sanitation’s monitoring stations along the middle and lower Phongolo
River from 1972 to 2017. Multivariate statistical analyses and PAI were used to compare collected water
quality variables above and below the Pongolapoort Dam as well as between historic, pre-drought
and drought conditions. Four hypotheses were tested as part of this study: (1) Water quality of the
middle and lower Phongolo River has deteriorated since the 1970s due to increased anthropogenic
stressors and will be represented by changes in the studied water quality variables and a corresponding
decrease in the PAI score of all sites. (2) Owing to historic overuse, the quality of water entering
the Pongolapoort Dam from the middle Phongolo River is in a poor state and will be represented
by a low PAI score. (3) The Pongolapoort Dam has reduced the quality of water entering the lower
Phongolo River and this will be reflected by a lower PAI score below the dam than above the dam.
(4) The supra-seasonal drought experienced between 2015 and 2017 negatively affected water quality of
the middle and lower Phongolo rivers and caused a further decline in the PAI scores from pre-drought
to drought conditions.
2. Materials and Methods
2.1. Study Area
The upper Phongolo River originates in Mpumalanga, South Africa, flowing towards the eastern
part of the country where it is joined by the Bivane River before flowing through the Lebombo and
Ubombo mountain ranges into northern KwaZulu-Natal [63,65,66]. Hereafter, the middle Phongolo
River flows through the town of Pongola, where it widens into the intensely cultivated Lowveld area,
finally flowing into the Pongolapoort Dam ([65,67], Figure 1). The Pongolapoort Dam, completed in
1973, was built with the key purpose of supplying enough water to irrigate 40,000 to 50,000 ha of
cultivated land (mostly sugarcane) in the highly fertile area adjacent to the Phongolo floodplain [68].
Before the construction of the Pongolapoort Dam, summer flooding inundated the floodplain, creating
a mosaic of environments for the aquatic biota of the area and provided a source of protein to the
local people in the form of fish. The possible effects and recommended flood release strategies were
researched before the construction of the Pongolapoort Dam (e.g., [63,69–71]) and by the time the
dam was completed, a detailed flooding regime had been determined that would mimic the natural
floods, sustain the ecological integrity of the floodplain and continue to provide services to the people
in the region with minimal effects on the irrigation schemes [68] (see [60,61] for a full description).
However, due to unforeseen circumstances such as the drought of 1981 to 1983 (indicated by arrows
in Figure 2) and the Domoina cyclone of 1984 (see [64]), the proposed flooding regime was difficult
to implement. More than 40 years later, there is still no proper management of the dam and its release.
The lower Phongolo River and the associated floodplain starts below the Pongolapoort Dam,
stretching approximately 80 km downstream to the confluence of the Phongolo and Usuthu rivers at the
international border with Mozambique within the conservation area of Ndumo Game Reserve (NGR).
It is South Africa’s largest riverine floodplain, with an area of 120 km2 [66,72]. Approximately 40% of
the floodplain lies in South Africa, while the remaining 60% is found in Mozambique, forming part
of the Rio Maputa River floodplain [20,73,74]. Ndumo Game Reserve is the only protected region
of the Phongolo River and floodplain. Many endangered, rare and endemic species are found in
the floodplain area, most of which are highly dependent on the river and the numerous temporary,from the dam, the largest of which generally occurs in October, while a smaller release occurs around
July (Figure 2). The main goal of this flooding regime is to meet socio-economic demands [58,61].
Three droughts have occurred in South Africa between 1972 and 2017. The first took place in 1983
[64], the second from 1991 to 1993 [76,77] and the most recent from 2015 to 2017 [59] (Figure 2). During
these periods, the flow of the Phongolo River was greatly reduced and, in the cases of the droughts
Water 198312,
of 2020, and37 2015–2017, no flood releases occurred from the Pongolapoort Dam. The drought of 1983 5 of 22
ended when a severe cyclone (cyclone Domoina) caused the biggest flood ever recorded in the
Phongolo River between 29 January and 2 February 1984 [64]. During the drought of 1991 to 1993,
permanent and floodplain associated wetlands [61,75]. Even though NGR is considered such an
normal flood releases still took place. The most recent drought from 2015 onwards is considered the
ecologically
worst thatimportant region,
South Africa it is severely
has experienced in under threat,
23 years, caused as it
byisasurrounded by both
combined effect subsistence
of a drought and and
a
commercial
strong El Niño event [59] and the country is still experiencing the effects thereof. The last controlled in
agriculture. A large agricultural irrigation scheme also operates upstream of the reserve
its flood
catchment
releasearea
from[74].
the The eastern part
Pongolapoort Dam of took
the reserve
place inisDecember
also utilized
2014.byHowever,
the localthe
community as a
system still
farming area and local people fish in the river within NGR and actively abstract water
receives a monthly baseflow that is continuously released as a result of the “compensation flows” from the river
foragreement
their cropswith
as well (pers. observation;
Mozambique [66], Figure
and is intended to be no1).less than 5 m3s−1 [60].
Figure 1. Map of the Pongolapoort Dam and lower Phongolo region indicating various irrigation
schemes and farms located along the middle and lower Phongolo River as well as the three Department
of Water and Sanitation (DWS) monitoring stations located on the Phongolo River above (Upstream)
and below (Downstream 1 and Downstream 2) Pongolapoort Dam.
Although the lower Phongolo has largely been utilised by small scale subsistence farms for
the past few hundred years [65,68], larger irrigation schemes have developed in recent years ([57],
Figure 1). Threats to the upper reaches of the Phongolo River include abandoned coal mines in the
Paulpietersburg area where the Bivane River originates, and an estimated 199 km2 and 480 km2 of
irrigated and afforested area respectively [65]. The middle reaches of the Phongolo River are utilised by
some 16,000 ha of sugarcane and 1000 ha of citrus, mango and vegetable farms. Water from the upper
Phongolo River is reserved for these various land uses as well as for the Impala Irrigation Scheme
in the middle Phongolo [65]. In addition, the Bivane Dam, located on the Bivane River upstream of
its confluence with the Phongolo River, was completed in 1995 to provide additional irrigation water
to the surrounding sugarcane farms and has also decreased the water inflow into the Pongolapoort
Dam [61]. Presently, under normal circumstances, two controlled floods are released from the dam, the
largest of which generally occurs in October, while a smaller release occurs around July (Figure 2).
The main goal of this flooding regime is to meet socio-economic demands [58,61]. Three droughts have
occurred in South Africa between 1972 and 2017. The first took place in 1983 [64], the second from 1991
to 1993 [76,77] and the most recent from 2015 to 2017 [59] (Figure 2). During these periods, the flow
of the Phongolo River was greatly reduced and, in the cases of the droughts of 1983 and 2015–2017,Water 2020, 12, 37 6 of 22
no flood releases occurred from the Pongolapoort Dam. The drought of 1983 ended when a severe
cyclone (cyclone Domoina) caused the biggest flood ever recorded in the Phongolo River between
29 January and 2 February 1984 [64]. During the drought of 1991 to 1993, normal flood releases still
took 2019,
Water place.
11, The
x FORmost
PEER recent
REVIEWdrought from 2015 onwards is considered the worst that South Africa 6 of 22
has experienced in 23 years, caused by a combined effect of a drought and a strong El Niño event [59]
and the country
Figure 1. Mapisofstill
theexperiencing
Pongolapoort the
Dameffects thereof.
and lower The last
Phongolo controlled
region indicatingflood release
various from the
irrigation
schemes and
Pongolapoort Damfarms located
took place in along the middle
December and lower
2014. However, thePhongolo River
system still as well
receives as the three
a monthly baseflow
Department of Water and Sanitation (DWS) monitoring stations located on the Phongolo
that is continuously released as a result of the “compensation flows” agreement with Mozambique andRiver above
(Upstream)
is intended to beand
nobelow 5 m3 s−1 [60].
(Downstream
less than 1 and Downstream 2) Pongolapoort Dam.
Figure 2.
Figure Annual peak
2. Annual peak flows
flows of
of Phongolo
Phongolo River
River downstream
downstream of of dam
dam measured
measured from
from 1983
1983 to
to 2018.
2018.
Arrows indicate peak years of severe droughts in 1983, 1993 and 2016 (available
Arrows indicate peak years of severe droughts in 1983, 1993 and 2016 (available fromfrom https://www.
dwaf.gov.za/Hydrology/Verified/hymain.aspx. Accessed on 4Accessed
https://www.dwaf.gov.za/Hydrology/Verified/hymain.aspx. June 2019).
on 4 June 2019).
2.2. Data Collection
2.2. Data Collection
Historical data from three South African Department of Water and Sanitation (DWS) monitoring
Historical data from three South African Department of Water and Sanitation (DWS) monitoring
stations within the Phongolo River catchment were obtained from the DWS National Chemical
stations within the Phongolo River catchment were obtained from the DWS National Chemical
Monitoring Programme. The first of these selected monitoring stations, W4H006, Phongolo River
Monitoring Programme. The first of these selected monitoring stations, W4H006, Phongolo River
(Upstream) is located upstream of Pongolapoort Dam, and the remaining two are located downstream
(Upstream) is located upstream of Pongolapoort Dam, and the remaining two are located
of the dam. Station W4H013 (Downstream 1) is located below the dam wall and the final monitoring
downstream of the dam. Station W4H013 (Downstream 1) is located below the dam wall and the final
station (W4H009, Downstream 2) is located 80 km downstream of the dam within Ndumo Game Reserve
monitoring station (W4H009, Downstream 2) is located 80 km downstream of the dam within Ndumo
(NGR) (Figure 1; Table 1). The water quality data collected and analysed from the monitoring stations
Game Reserve (NGR) (Figure 1; Table 1). The water quality data collected and analysed from the
included calcium (Ca), chloride (Cl− ), conductivity (µS cm−1 ), potassium (K), magnesium (Mg+ ),
monitoring stations included calcium (Ca), chloride (Cl−), conductivity (µS cm−1), potassium (K),
sodium (Na), ammonium nitrogen (NH4 + -N), nitrate nitrogen/nitrite nitrogen (NO3 − -N/NO2 − -N), pH,
+ +
magnesium
orthophosphate (Mg(PO ), sodium
3− (Na), ammonium 2− nitrogen (NH4 -N), nitratefrom
nitrogen/nitrite nitrogen
4 ) and sulphates (SO4 ). Historical data collected the DWS database for
(NO 3
−
the three-N/NO
sites
2
− -N),
are pH,
indicatedorthophosphate
in Table 1, (PO
along 3−
with
4 ) and
the sulphates
years for (SO
which 42− ).
data Historical
were data
available,collected
and from
included
years
the DWS during whichfor
database severe droughts
the three sitesoccurred (1983, in
are indicated 1991 and1,2015–2016).
Table along withThe the monthly
years foraverage flow
which data
data (measured 3 −1
in mincluded
s ) wereyears
also obtained from Downstream 1 foroccurred
the years(1983,
1985–2017.
were available, and during which severe droughts 1991 and 2015–
2016). The monthly average flow data (measured in m3s−1) were also obtained from Downstream 1
Table 1. Department of Water and Sanitation (DWS) monitoring station numbers, names, locations,
for the years 1985–2017.
and years for which water quality data are available for the Phongolo River. All water quality variables
for each
Table 1. monitoring
Departmentstation are and
of Water presented as Supplementary
Sanitation Information
(DWS) monitoring station (Tables
numbers,S1–S3).
names, locations,
and years for which water quality data are available for the Phongolo River. Years All water
for Which quality
Historical Data
River Region DWS Monitoring Station Number and Location
Are Available
variables for each monitoring station are presented as supplementary information (Tables S1–S3).
Upstream (Middle Phongolo River) W4H006 (Upstream, Phongolo River at Makanes Drift) 1972–2017
W4H013 (Downstream 1, Phongolo River immediately below Years for which
1983–2017
Downstream (Lower
River Phongolo River)
Region DWSPongolapoort
Monitoring Dam)Station
W4H009 (Downstream
Number and 2, Phongolo River
Location Historical Data Are
1980–2017
within Ndumo Game Reserve)
Available
Upstream (Middle W4H006 (Upstream, Phongolo River at Makanes
1972–2017
Phongolo River) Drift)
W4H013 (Downstream 1, Phongolo River
Downstream
immediately below Pongolapoort Dam) W4H009 1983–2017
(Lower Phongolo
(Downstream 2, Phongolo River within Ndumo 1980–2017
River)
Game Reserve)Water 2020, 12, 37 7 of 22
2.3. Statistical Analysis
The PAI, a water quality index developed for the South African eco-classification determination
process, was applied to determine the present water quality status of the study area. The PAI is a
tool used to determine the state of the physical and chemical water quality for a resource unit or a
specific site. The PAI makes use of a Microsoft Excel-based weighting, ranking and rating framework
that allows for the assessment of individual variables, the integration of the variable outcomes and then
of the integrated overall water quality state [51]. This is based on a multi-criteria decision analysis that
considers a range of water quality variables. These include pH, salts, temperature (◦ C), turbidity/clarity,
dissolved oxygen (mg L−1 ) and various toxicants [52]. Ranking (1–4) and weighting (0–100%) relates to
the state of water quality under natural conditions. The importance of each of the variables (where 1 is
least and 4 most important) is determined by whether the river is perennial or not, average width
of the river and geomorphic zone [53]. The PAI compares each water quality variable to reference
conditions in order to determine the degree to which each variable has changed, and this is rated
from 0–5 (where 0 is no change and 5 is extreme change) based on the degree with which water
quality variables have changed from the reference conditions as well as the importance of each variable
in relation to the possible biotic responses it may cause. The result is that each site is assigned an
ecological category, ranging from A to F and a score ranging from 0 to 100 (Table 2) [52]. Weighting and
ranking of the physicochemical variables for the Phongolo River was based on characteristics that
are important for lowland rivers [53]. In lowland rivers, the order of metrics from most to least
important are toxicants, nutrients, dissolved oxygen, temperature, pH, salts and water clarity [53]. This
analysis was applied to determine the PAI of each of the three sample sites (Upstream, Downstream 1
and Downstream 2 respectively). In order to determine the possible changes in water quality, first
a historic PAI was calculated to assess the initial state of the river. Data from 1972 to 1976 from
upstream of the impoundment were used to calculate the historic Upstream and Downstream 1 PAI.
Recordings for Downstream 1 only started in 1984 and it is likely that water quality had already
changed after the drought of 1983 and cyclone of 1984. However, even though the Pongolapoort Dam
had been completed by 1973, flow was not yet regulated during this period and water flowed through
unrestricted [78]. Water quality immediately below the impoundment would therefore have been
similar to upstream of the impoundment. The historic water quality of Upstream were therefore used
as a proxy for historic conditions at Downstream 1. Data from 1980 to 1982 were used to calculate
the historic Downstream 2 PAI. More years could not be included due to the drought of 1983 and
cyclone of 1984. Then, using data from 2009 to 2014, a PAI of pre-drought conditions was calculated to
determine the water quality before the recent severe drought of 2015–2017. Using data from 2015 to
2017, a final PAI was calculated to determine whether water quality had changed during the severe
supra-seasonal drought.
A time series assessment of the chemical water quality of the Phongolo River was performed.
The water quality data obtained from the DWS database comprised of recordings taken once a month
between 1972 and 2017, although data were not available for every month. Available data for each
variable were averaged to annual records to determine trends in water quality at all sites from 1972
to 2017. Line graphs of the mean (±SD) of each variable were created to visually assess the general trends
and possible changes in water quality from 1972 to 2017 of all three data sets (Upstream, Downstream 1
and Downstream 2). In order to assess the possible influence of flow on the various water quality
variables downstream of the dam (Downstream 1), regression analysis was performed on data from
1983 to 2017 as these were the only years that flow data were available for. Since autocorrelation
(serial correlation) is a common occurrence in time-series data [79,80], each dataset was tested for
autocorrelation prior to regression analysis using the Durbin–Watson test. Linear regressions were
then performed on those variables that were not autocorrelated and generalised least squares (gls)
analysis applied on those that were autocorrelated. The Shapiro–Wilk test for normality was utilized
to test whether data had a parametric distribution. The data distribution was not parametric and
the Kruskal–Wallis H test for nonparametric data was therefore used to assess potential significantWater 2020, 12, 37 8 of 22
differences in water quality variables from 1972 to 2017 at each site and between the three sites. The
Kruskal–Wallis H test was also used to assess water quality variables between the three categories
created for PAI (historic, pre-drought and drought). Dunn’s post-hoc test was then used to determine
specific significant pairwise differences. To control for inflated false discovery rates, a Bonferroni
correction was used.
To determine the potential effects of the Pongolapoort Dam, the upstream dataset (Upstream)
was compared with the dataset immediately downstream of the dam (Downstream 1) using Principal
Component Analysis (PCA) created in Canoco v5. Then, to compare whether water quality differed
between the river outside and within NGR, a second PCA was created to compare the downstream water
quality data outside NGR (Downstream 1) with the water quality data within NGR (Downstream 2).
Each dataset was tested for multicollinearity using the variance inflation factor (vif) collinearity
diagnostic test prior to PCA analysis. If the “vif” is >10, severe multicollinearity is present and
variables causing this need to be excluded from multivariate analyses [81]. Variables with severe
multicollinearity were excluded from further analysis. All water quality variables, with the exception
of pH, were then standardized by way of log transformation [y = log (x + 1)] in order to reduce
the distribution of skewness [82,83]. The gls analysis was performed in the ”nlme” package in R
(reference) while all other abovementioned tests were performed in IBM SPSS Statistics 23 (IBM Corp.
Released 2015. IBM SPSS Statistics for Windows, Version 23.0., Armonk, NY, USA: IBM Corp.).
Due to multicollinearity, Na, Mg+ and conductivity were excluded from the Upstream dataset,
Na and conductivity were excluded from the Downstream 1 dataset and Cl-, was excluded from the
Downstream 2 datasets for PCA analysis. Principle component analysis has similarly been utilized in
other manuscripts assessing temporal and seasonal changes in water quality of rivers (e.g., [84–86]).
A PCA is based on a linear response model which relates a single variable (e.g., water data) to
a particular site (or survey). A diagram of the assessed sites is visualized on a two-dimensional
basis. Placement of the sites on the diagram signifies either similarities or dissimilarities between the
measured variable and sites based on the angle of the variables to one another. Variables at ≤90◦ are
positively correlated while variables >90◦ are negatively correlated [87].
Table 2. Rating and ecological categories used for implementation of the Physicochemical Driver
Assessment Index (PAI) scores [88].
Ecological Category Description Score (Percentage of Total)
A Unmodified, natural. 90–100
Largely natural with few modifications. A small change in
B natural habitats and biota may have taken place, but the 80–89
ecosystem functions are essentially unchanged.
Moderately modified. Loss and change of natural habitat and
C biota have occurred, but the basic ecosystem functions are still 60–79
predominantly unchanged.
Largely modified. A large loss of natural habitat, biota and
D 40–59
basic ecosystem functions has occurred.
Seriously modified. Extensive loss of natural habitat, biota
E 20–39
and basic ecosystem functions.
Critically/Extremely modified. Modifications have reached a
critical level and the system has been modified completely,
F with an almost complete loss of natural habitat and biota. In 0–19
the worst instances the basic ecosystem functions have been
destroyed and the changes are irreversible.
3. Results
The data are reported as an annual average per year for each site. Historical data sets obtained
from the DWS monitoring stations comprised incomplete monthly records as they were not collected
consistently for the same months of each year at each site. The data were thus highly variable, making
direct comparisons between sites difficult. To make the data more comparable they were aggregatedWater 2019,12,
Water 2020, 11,37
x FOR PEER REVIEW 99 of
of 22
22
in an unmodified, natural state (A rating) both above and below the Pongolapoort Dam (Figure 3;
to represent annual records. The historic water quality of the middle and lower Phongolo River was
Table S4). The PAI% indicated that Downstream 2 was in the most unmodified state (96.56%) while
in an unmodified, natural state (A rating) both above and below the Pongolapoort Dam (Figure 3;
Upstream and Downstream 1 had a lower score (88.39%). From 2009 to 2014 (pre-drought) the river
Table S4). The PAI% indicated that Downstream 2 was in the most unmodified state (96.56%) while
ecological category of all three sites declined to a moderately modified state (C rating) and a PAI% of
Upstream and Downstream 1 had a lower score (88.39%). From 2009 to 2014 (pre-drought) the river
76.24%. This was driven by an increase in all assessed variables at all three sites, with the exception
ecological category of all three sites declined to a moderately modified state (C rating) and a PAI% of
of nutrients upstream of the dam which decreased (see Table 3). The river ecological category of all
76.24%. This was driven by an increase in all assessed variables at all three sites, with the exception of
three sites remained in a moderately modified state during the drought (2015–2017) (Table 3-5).
nutrients upstream of the dam which decreased (see Table 3). The river ecological category of all three
However, there was a further decline in the PAI% of Upstream and Downstream 2 and this was
sites remained in a moderately modified state during the drought (2015–2017) (Tables 3–5). However,
driven by an increase in pH and salts at the Upstream site and an increase in salts and nutrients at
there was a further decline in the PAI% of Upstream and Downstream 2 and this was driven by an
Downstream 2 (see Tables 3 and 5). During the drought, Downstream 2 was in the most modified
increase in pH and salts at the Upstream site and an increase in salts and nutrients at Downstream 2
state of the three sites (70.43%) followed by Upstream (71.51%) while Downstream 1 was the least
(see Tables 3 and 5). During the drought, Downstream 2 was in the most modified state of the three
modified (76.24%).
sites (70.43%) followed by Upstream (71.51%) while Downstream 1 was the least modified (76.24%).
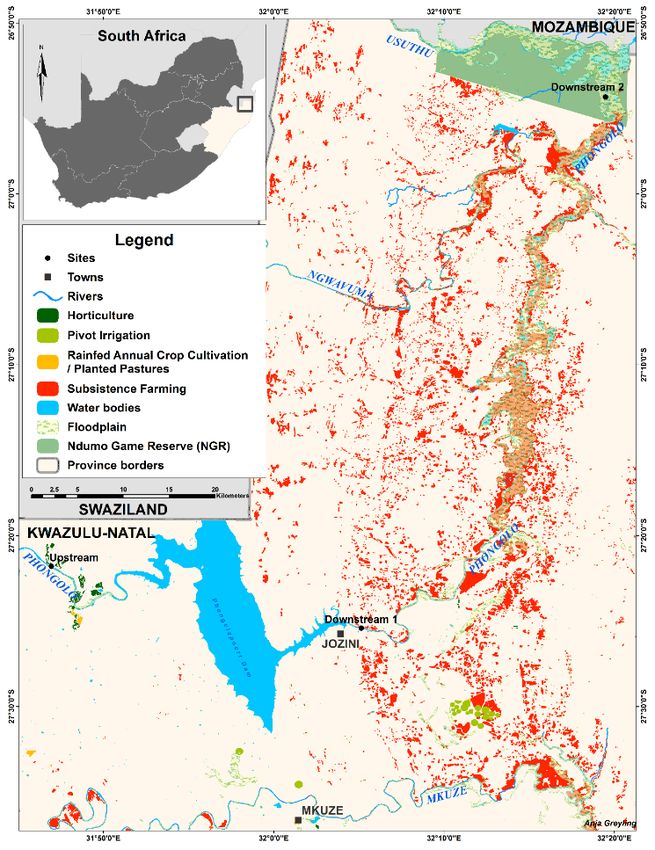
Figure
Figure 3. Physicochemical Driver
3. Physicochemical Driver Assessment
Assessment Index
Index (PAI)
(PAI) scores
scores with
with associated
associated river
river ecological
ecological
category derived from the three monitoring stations located above and below Pongolapoort
category derived from the three monitoring stations located above and below Pongolapoort Dam. Dam.
Upstream—Monitoring station located above the dam; Downstream 1 (Down 1)—Monitoring
Upstream—Monitoring station located above the dam; Downstream 1 (Down 1)—Monitoring station station
located below dam
located below damwall.
wall.Downstream
Downstream 2 (Down
2 (Down 2)—Monitoring
2)—Monitoring station
station located
located withinwithin
Ndumo Ndumo
Game
Game Reserve.
Reserve.
Linear and generalised least squares regression analyses were used to predict changes in water
Linear and generalised least squares regression analyses were used to predict changes in water
quality variables based on changes in flow downstream of the Pongolapoort Dam (Table S5). The annual
quality variables based on changes in flow downstream of the Pongolapoort Dam (Table S5). The
flow was found to have a significant effect on only two variables downstream of the Pongolapoort
annual flow was found to have a significant effect on only two variables downstream of the
Dam, as the analyses revealed a significant linear effect of flow on pH (p = 0.0006; F1 ,366 = 7.66) and
Pongolapoort Dam, as the analyses revealed a significant linear effect of flow on pH (p = 0.0006; F1,366
Mg+ , (p < 0.001; F1,366 = 14.43) at Downstream 1.
+
= 7.66) and Mg
Several , (p < 0.001;
fluctuations F1,366evident
were = 14.43)inatthe Downstream
water quality1. variables both upstream and downstream
Several fluctuations were evident in the
of the Pongolapoort Dam during all sampling years (Figures water quality variables both upstream and
4–6). Kruskal–Wallis downstream
H tests revealed
of the Pongolapoort Dam during all sampling years (Figures 4–6). Kruskal–Wallis
significant changes in these variables at all monitoring stations. An abrupt, significant increase H tests revealedin
pH occurred between 1988 and 1991 where pH increased from approximately 7.5 between 1972inand
significant changes in these variables at all monitoring stations. An abrupt, significant increase pH
occurred
1988 between
to above 8 from 1988 andonwards
1991 1991 where at all pH increased from
monitoring approximately
stations. 7.5 between
Salinity (including 1972 and 1988
conductivity, Cl− ,
to above
Mg+, 8Kfrom 1991NOonwards at− all monitoring stations. Salinity (including conductivity, Cl , Ca,
−
3 /NO2 and PO4
Ca, and Na), − 3− significantly increased during the severe droughts of
1983+
Mg ,toK1984,
and Na),
1991NO 3 /NO
−
to 1993 2 and
−
and 2015POto4 2017 at all sites (p < 0.05). During these periods, conductivity
3− significantly increased during the severe droughts of 1983 to
ranged fromto500
1984, 1991 cm−1
µSand
1993 to above
2015 1000
to 2017 cm−1(p
µS sites
at all while decreasing
< 0.05). During to below
these cm−1 in otherranged
500 µSconductivity
periods, years.
+
3 /NO2 , to
Upstream of the − − 3−
from 500 µS cmPongolapoort
−1 to above 1000Dam,
µS nutrients
cm−1 while(NO
decreasing NHbelow
4 and500
PO4µS )cmfluctuated between
−1 in other years.
Upstream of the Pongolapoort Dam, nutrients (NO3 /NO2 , NH4 and PO4 ) fluctuated between years
− − + 3−Water 2020, 12, 37 10 of 22 years as well, particularly NO3 − /NO2 − . This variable increased significantly from 0.18 mg L−1 in 1972 to above 1 mg L−1 in 1984 and 1989 to 1995 and decreased significantly to approximately 0.45 mg L−1 in 1985 to 1989 and 0.7 mg L−1 in 1996 to 2017. Post-hoc analyses further revealed significant increases in conductivity (p = 0.046), pH (p < 0.0001), Mg+ (p = 0.003), Ca (p = 0.002), SO4 2− (p < 0.0001) and K (p < 0.0001) and significant decreases in NO3 − /NO2 - (p < 0.0001) and NH4 + (p < 0.0001) from historic to pre-drought conditions (Table S6). From pre-drought to drought conditions post-hoc analysis indicated significant increases in conductivity (p = 0.002), pH (p = 0.049), Na (p = 0.003), Mg+ (p = 0.005), Cl− (p = 0.0008), SO4 2− (p = 0.02) and NH4 + (p < 0.0001). Nutrients decreased significantly from 1984 to 2017 immediately below the impoundment (Downstream 1) (p < 0.05), as NO3 − /NO2 − decreased from 0.3 mg L−1 in 1984 to
Water 2020, 12, 37                                                                                                        11 of 22

      Table 4. Non-parametric Kruskal–Wallis H test results comparing historic, pre-drought (2009–2014)
      and drought (2015–2017) chemical water nutrient variables measured at the Department of Water
      and Sanitation (DWS) monitoring station located below the Pongolapoort Dam wall (Downstream 1).
      Mean ± SD; range in parentheses.

             Variable                Historic           Pre-Drought            Drought               Significance
                                                ab     286.4 ± 21.22 a                    b
                                 503.6 ± 343.5                              336.4 ± 51.11
      Conductivity (µS cm−1 )                                                                    p < 0.0001; χ2 = 22.83
                                     (91–1840)          (254.4–353.5)         (281.4–504)
                                  7.83 ± 0.58 ab          8.3 ± 0.16 a       8.36 ± 0.15 b
                pH                                                                               p < 0.0001; χ2 = 36.02
                                    (6.08–8.97)           (7.71–8.51)             (8–8.6)
                                 63.98 ± 49.80 a       29.85 ± 2.88 b       37.62 ± 8.08 ab
           Na (mg L−1 )                                                                          p < 0.0001; χ2 = 38.68
                                     (8.1–227)          (25.98–34.48)         (27.26–62.5)
                                 18.60 ± 15.97 a         10.2 ± 1.64 a        12.32 ± 2.27
          Mg+ (mg L−1 )                                                                          p < 0.0003; χ2 = 16.29
                                    (2.8–88.10)          (8.25–16.78)           (9.62–20)
                                  16.86 ± 9.92 a        12.82 ± 1.04 a         15.9 ± 3.44
            Ca (mg L−1 )                                                                          p < 0.016 χ2 = 8.27
                                     (2.9–60.9)          (9.92–15.12)           (10.8–23)
                                 47.01 ± 34.53 a        20.28 ± 2.15 a        29 ± 10.14 b
           Cl− (mg L−1 )                                                                         p < 0.0001; χ2 = 33.12
                                     (5–203.6)              (17.28-)          (19.65–63.4)
                                  0.55 ± 0.61 a           0.22 ± 0.4 a         0.33 ± 0.72
       NO− /NO2 − (mg L−1 )                                                                       p < 0.007; χ2 = 9.92
                                       (0–3.1)           (0.005–2.02)           (0.05–3.6)
                                   13.04 ± 11 a        11.37 ± 1.17 b       14.83 ± 3.49 ab
          SO4 2− (mg L−1 )                                                                        p < 0.005; χ2 = 10.64
                                     (0–104.6)           (9.25–14.18)          (7.93–23.2)
                                    0.02 ± 0.04         0.009 ± 0.008         0.01 ± 0.003
          PO4 3− (mg L−1 )                                                                        p = 0.1410; χ2 = 3.92
                                      (0–0.37)           (0.005–0.05)          (0.01–0.05)
                                   1.25 ± 0.62 a        2.69 ± 0.57 b        2.73 ± 0.71 ab
            K (mg L−1 )                                                                          p < 0.0001; χ2 = 38.98
                                    (0.22–4.89)              (1–3.8)           (1.13–4.49)
                                   0.07 ± 0.12 a        0.04 ± 0.01 b          0.05 ± 0 ab
          NH4 + (mg L−1 )                                                                        p = 0.0015; χ2 = 12.97
                                        (0–1)             (0.03–0.07)          (0.05–0.05)
      Common superscripts within rows indicate significant differences (p < 0.05). See Supplementary Table S7 for exact
      p-values.

      Table 5. Non-parametric Kruskal–Wallis H test results comparing historic, pre-drought (2009–2014)
      and drought (2015–2017) chemical water nutrient variables measured at the Department of Water
      and Sanitation (DWS) monitoring station located within Ndumo Game Reserve (Downstream 2).
      Mean ± SD; range in parentheses.

             Variable                Historic           Pre-Drought            Drought               Significance
                                   544.4 ± 292.7        482.5 ± 97.26        422.3 ± 199.2
      Conductivity (µS cm−1 )                                                                      p = 0.57; χ2 = 1.14
                                     (188–1166)          (306.9–647)           (176–679)
                                   7.05 ± 0.34 a         8.26 ± 0.21 a         8.13 ± 0.33
                pH                                                                               p < 0.0001; χ2 = 75.41
                                     (6.31–7.86)          (7.64–8.59)          (7.5–8.56)
                                    63.3 ± 35.52         56.98 ± 11.5        39.05 ± 25.98
           Na (mg L−1 )                                                                           p = 0.009; χ2 = 9.47
                                    (19.8–140.8)        (35.15–73.45)        (17.2–80.15)
                                    17.13 ± 9.62         16.88 ± 7.31         15.27 ± 6.31
          Mg+ (mg L−1 )                                                                            p = 0.29; χ2 = 2.46
                                      (6.7–38.1)        (10.28–46.34)         (5.6–26.21)
                                   22.09 ± 10.36         18.88 ± 6.26         15.42 ± 5.85
            Ca (mg L−1 )                                                                           p = 0.45; χ2 = 1.62
                                      (7.9–45.4)         (12.02–48.7)          (6.3–20.7)
                                   80.49 ± 65.07         56.42 ± 18.4        50.18 ± 31.92
           Cl− (mg L−1 )                                                                           p = 0.52; χ2 = 1.31
                                    (14.5–214.5)        (28.44–104.3)        (14.4–95.43)
                                     0.19 ± 0.21          0.12 ± 0.08          0.31 ± 0.51
       NO− /NO2 − (mg L−1 )                                                                        p = 0.46; χ2 = 1.57
                                       (0–0.92)           (0.03–0.28)         (0.05–1.39)
                                   18.27 ± 16.69        20.35 ± 14.52         12.48 ± 5.55
          SO4 2− (mg L−1 )                                                                         p = 0.09; χ2 = 4.88
                                      (4.7–96.8)        (10.24–102.2)           (6–21.31)
                                     0.01 ± 0.02          0.02 ± 0.05        0.02 ± 0.0.02
          PO4 3− (mg L−1 )                                                                         p = 0.02; χ2 = 8.28
                                       (0–0.08)           (0.01–0.29)         (0.01–0.05)
                                     2.22 ± 1.01           3.2 ± 0.62          3.44 ± 1.08
            K (mg L−1 )                                                                            p = 0.52; χ2 = 1.31
                                     (1.26–6.87)            (1–4.2)             (2.3–4.9)
                                   0.04 ± 0.03 ab        0.04 ± 0.02 a          0.05 ± 0 b
          NH4 + (mg L−1 )                                                                         p = 0.003; χ2 = 11.54
                                       (0–0.14)           (0.03–0.11)         (0.05–0.05)
      Common superscripts within rows indicate significant differences (p < 0.05). See Supplementary Table S8 for exact
      p-values.
Water 2019, 11, x FOR PEER REVIEW 11 of 22
Water 2020, 12, 37 12 of 22
Water 2019, 11, x FOR PEER REVIEW 11 of 22
Figure 4. Line graphs indicating mean (±SD) trends in conductivity (a), chlorides (b), calcium (c) and
Figure 4. Line graphs indicating meanto(±SD) trends in conductivityof (a), chlorides (b), calcium (c)
Figure 4. Line(d)
magnesium measured
graphs frommean
indicating 1972 (±SD)2017 at the
trends Department
in conductivity (a), Water and(b),
chlorides Sanitation (DWS)
calcium (c) and
and magnesium (d)
monitoring stations measured
locatedfrom from
above1972 1972
and to to
below 2017 at the Department of Water and Sanitation (DWS)
magnesium (d) measured 2017the at Pongolapoort
the Department Dam.of Arrows
Water and indicate peak years
Sanitation (DWS) of
monitoring
severe stations
drought. locatedflow
Annual aboveforand below
each the Pongolapoort
available year is Dam. Arrows
indicated by the indicate
blue peak
line. years of
Upstream—
monitoring stations located above and below the Pongolapoort Dam. Arrows indicate peak years of
severe drought.
Monitoring Annual
station flow for
located eachthe
above available
dam; year is indicated
Downstream by the blue line. Upstream—Monitoring
severe drought. Annual flow for each available year is1—Monitoring
indicated by the station
bluelocated below dam
line. Upstream—
station
wall. located
Downstreamabove the dam;
2—Monitoring Downstream
station 1—Monitoring
located within station
Ndumo located
Game below dam
Reserve. wall.
Significant
Monitoring station located above the dam; Downstream 1—Monitoring station located below dam
Downstream
differences 2—Monitoring
between years station located
and sites are within
indicated Ndumo
in thewithin Game Reserve. Significant
text. Ndumo Game Reserve. Significant differences
wall. Downstream 2—Monitoring station located
between years and sites are indicated in the text.
differences between years and sites are indicated in the text.
Figure 5. Line graphs indicating mean (±SD) trends in sodium (a), potassium (b), sulphates (c) and pH
Figure
(d) 5. Line
measured graphs
from 1972indicating mean
to 2017 at the (±SD) trends
Department in sodium
of Water (a), potassium
and Sanitation (DWS)(b), sulphatesstations
monitoring (c) and
pH (d)above
Figure
located measured
5. Lineand fromindicating
graphs
below 1972Pongolapoort
the to 2017
mean at (±SD)
the Department
Dam. trends
Arrows of Water
in indicate
sodium (a),and
peak Sanitation
potassium
years (b),(DWS)
of severe monitoring
sulphates
drought. (c) and
Annual
stations
flow
pH (d) located
for measured above
each available
fromyearand
1972 below
is to the
indicated
2017 atby Pongolapoort
theblue Dam. Arrows
line. Upstream—Monitoring
Department indicate peak years
station(DWS)
of Water and Sanitation of severe
locatedmonitoring
above the
drought.
dam;
stations Annualabove
Downstream
located flow for each
1—Monitoring
and available
belowstation year is indicated
located
the Pongolapoortbelow dam bywall.
Dam. blue line. Upstream—Monitoring
Downstream
Arrows indicate 2—Monitoring station
peak years of station
severe
locatedwithin
located
drought. above
Annualtheflow
Ndumo dam;
for Downstream
GameeachReserve. 1—Monitoring
Significant
available station
differences
year is indicated located
between
by blue belowand
years dam wall.
sites areDownstream
line. Upstream—Monitoring indicated in
station
2—Monitoring
the text. station located within Ndumo Game Reserve. Significant
located above the dam; Downstream 1—Monitoring station located below dam wall. Downstreamdifferences between years
and sites are indicated
2—Monitoring in the text.
station located within Ndumo Game Reserve. Significant differences between years
and sites are indicated in the text.Water 2020, 12, 37 13 of 22
Water 2019, 11, x FOR PEER REVIEW 12 of 22
Figure 6. Line graphs indicating mean (±SD) trends in ammonium (a), nitrates/nitrites (b), and
Figure 6. Line graphs
orthophosphates indicating
(c) measured mean
from (±SD)
1972 trends
to 2017 at in
theammonium
Department (a),ofnitrates/nitrites (b), and
Water and Sanitation
orthophosphates
(DWS) monitoring(c)stations
measured from 1972
located abovetoand
2017below
at the the
Department of Water
Pongolapoort Dam.and Sanitation (DWS)
Arrows indicate
monitoring stations located above and below the Pongolapoort Dam. Arrows indicate
peak years of severe drought. Annual flow for each available year is indicated by blue line. peak years of
severe drought. Annual flow for each available year is indicated by blue line. Upstream—Monitoring
Upstream—Monitoring station located above the dam; Downstream 1—Monitoring station located
stationdam
below located above the dam;
wall. Downstream Downstream
2—Monitoring 1—Monitoring
station located withinstation
Ndumolocated below Significant
Game Reserve. dam wall.
Downstream
differences 2—Monitoring
between years and station
sites arelocated within
indicated in theNdumo
text. Game Reserve. Significant differences
between years and sites are indicated in the text.Water 2020, 12, 37 14 of 22
Spatial separation was evident in the PCA comparing the Upstream and Downstream 1 sites
between 1972 and 2017 (explaining a total of 57.34% of data variation), as upstream survey years
separated distinctly from downstream survey years along Axis 1 (explaining 39.19% of data variation)
(Figure S1). Post-hoc analysis revealed this to be driven largely by significantly lower salts (in
the form of Cl- , Ca and SO4 2− ) and nutrients (in the form of NO3 − /NO2 − and PO4 3− ) immediately
downstream of the Pongolapoort Dam compared to upstream of the dam from 1984 onwards (p < 0.05;
Tables S2 and S3). Separation along Axis 2 (explaining 18.15% of data variation) was largely driven
by higher values of NH4 + in 1984 downstream of the dam compared to upstream. Separation along
this axis was also driven by temporal variation in pH which increased significantly from the 1990s
onwards at both sites. Spatial separation was also evident on the PCA comparing the two downstream
sampling sites (Downstream 1 and 2) (explaining 58.08% of data variation) (Figure S2). Survey years
from Downstream 1 and 2 separated distinctly from one another along Axis 1 (explaining 34.07% of
data variation) and post-hoc analysis indicated this was mainly driven by significantly higher Ca,
SO4 2− and Cl− at Downstream 2 compared to Downstream 1, particularly in 2010 and 2016 (p < 0.05).
Separation along Axis 2 (explaining 24.01% of data variation) was largely attributed to temporal
variation in pH and NH4 + . While pH was significantly lower in the 1980s and increased from the
1990s onwards at both downstream sites (p < 0.05), NH4 + was much higher in 1984 at Downstream 1
compared to any other sites.
4. Discussion
The aims of this study were to assess the historical water quality of the middle and lower Phongolo
River, determine whether Pongolapoort Dam has had any effect on water quality of the lower Phongolo
River and ascertain whether the most recent severe supra-seasonal drought experienced from 2015
to 2017 led to changes in water quality of the Phongolo River. The main findings of the study were
that the quality of water in the middle and lower Phongolo River has decreased from historic to
present condition, largely as a result of continued increases in salinity, both above and below the dam.
A significant decrease in nutrients and salts immediately below the dam suggests the Pongolapoort
Dam is trapping nutrient-rich sediments, although no severe long-term adverse effects on water
quality were apparent below the impoundment. Conversely, water quality further downstream of
the impoundment, within NGR, had degraded the most of the three studied sites. Finally, the recent
drought (from 2015 to 2017) did not appear to affect water quality of the Phongolo River severely, as
there was little change water quality from pre-drought to drought conditions.
The middle and lower Phongolo River has seen a decrease in its river ecological category and
PAI% from the 1970s to the present along with a steady increase in pH and salinity and changes in
organic and inorganic nutrients. Nutrients have significantly decreased above the Pongolapoort Dam
from historic to pre-drought conditions, particularly after 1995, while further below the impoundment,
within NGR, nutrients have increased since the 1980s. Immediately below the Pongolapoort Dam, the
river has historically been poorer in nutrients than either assessed site above the dam or within NGR.
Since Pongolapoort Dam was completed, there has been an increase in the number of irrigation schemes
and farms, as well as a substantial population growth both above and below the dam. An influx
of various constituents through return flows from mines and agricultural activities surrounding the
Phongolo River are the most likely sources for these significant changes in water chemistry of the
Phongolo River. The upper and middle reaches of the Phongolo River have been subjected to a myriad
of anthropogenic inputs since the 1960s [69] and this was reflected by an historically lower PAI%
than below the Pongolapoort Dam. These changes to the land surrounding the middle and lower
reaches of the Phongolo River have resulted in an increased use of pesticides, organic and inorganic
fertilizers [58,62,65,66] as well as DDT use for malaria vector control, as the lower Phongolo River lies
in a low-risk malaria region [57]. The upper reaches are exposed to both functioning and abandoned
coal mines near Paulpietersburg, as well as by commercial forestry developments on both the Phongolo
and Bivane rivers [62]. In the middle reaches, there are approximately 199 km2 of mostly sugarcaneYou can also read