IOT CATALOGUE 2021 PART B FOR REAL-TIME CONTINUOUS MONITORING OF: NATURAL, BUILT & AGRICULTURAL ENVIRONMENTS - ICT INTERNATIONAL
←
→
Page content transcription
If your browser does not render page correctly, please read the page content below
IoT Catalogue 2021
                   Part B
                   For Real-Time Continuous Monitoring of:
                   Natural, Built & Agricultural Environments

Plant Monitoring (pp. 18-43) and IoT Sensing Networks (pp. 70-79)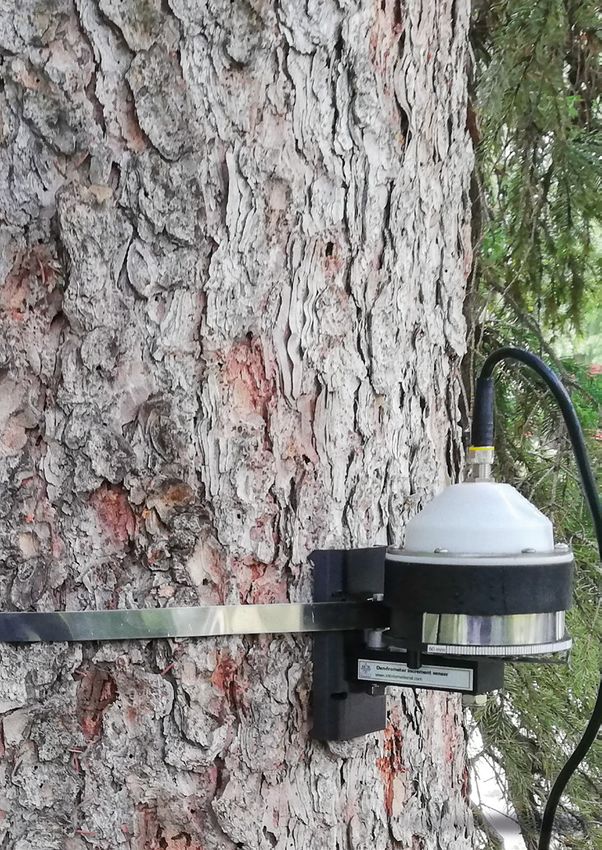
Contents

                           Soil Monitoring ������������������������������������������������������������������������������� 4
                              Soil Moisture & Water Use of Coffee in Vietnam ���������������������������������� 5
                              Soil Moisture: ADR and TDR ������������������������������������������������������������������ 6
                              Soil Moisture: TDT ��������������������������������������������������������������������������������� 8
                              Soil Moisture: Capacitance �������������������������������������������������������������������� 9
                              Smart Parks Irrigation Project ������������������������������������������������������������� 10
                              Soil Tension, Suction & Matric Potential ��������������������������������������������� 12
                              Soil Heat Flux & Temperature ������������������������������������������������������������� 14
                              Soil Oxygen ������������������������������������������������������������������������������������������� 15
                              Soil Nutrient Drainage Monitoring ������������������������������������������������������ 16

                           Plant Monitoring ������������������������������������������������������������������������� 18
                              Green Asset Management in Urban Environment ����������������������������� 19
                              Plant Monitoring: Returns on Investment ������������������������������������������� 20
                              Plant Water Relations: Sap Flow ��������������������������������������������������������� 22
                              Macadamia Sap Flow Monitoring & Irrigation Management������������ 23
                              Scientific Paper: New Zealand Kauri Trees Sharing Water������������������ 26
                              Plant Water Potential: Stem, Leaf and Root Psychrometry ��������������� 27
                              Plant Water Relations: Dendrometry �������������������������������������������������� 28
                              LoRaWAN Avocado Crop Monitoring �������������������������������������������������� 30
                              Plant Light Relations: PAR �������������������������������������������������������������������� 32
                              Plant Light Relations: Controlled Environments ��������������������������������� 33
                              Plant Light Relations: Canopy Light Interception ������������������������������� 34
                              Vegetation Indices & Disease Monitoring ������������������������������������������ 36
                              Infrared Canopy Temperature ������������������������������������������������������������� 38
                              Leaf & Bud Temperature ��������������������������������������������������������������������� 39
                              Weighing Scales For Plant Monitoring ������������������������������������������������ 40
                              Weighing Scales For Bee Hive Monitoring ������������������������������������������ 41
                              Further Custom SNiPs for Plant Irrigation Applications ��������������������� 42
                              Monitoring Plant Water Use in Urban Ornamental Nursery ������������� 43

                           Meteorological Monitoring �������������������������������������������������� 44
                              Rainfall Monitoring������������������������������������������������������������������������������� 45
                              Weather Stations ��������������������������������������������������������������������������������� 46
                              Customised Weather Stations ������������������������������������������������������������� 48
                              Fire Load & Fire Hazard Weather Stations ������������������������������������������ 49

2      ICT INTERNATIONAL       Soil 4-17 Plant 18-43 Meteorological 44-55 Hydrological 56-63 Urban & Industrial 64-69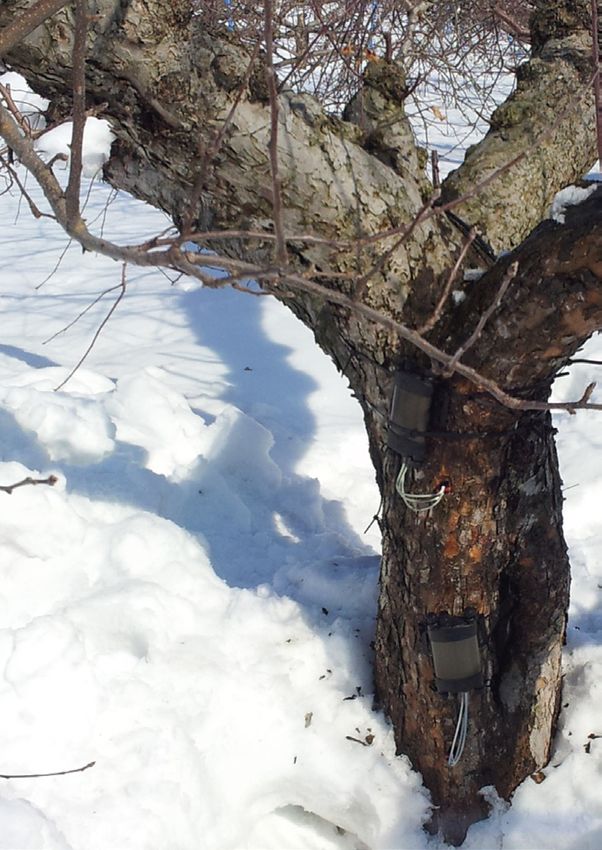
Microclimate Systems - Temperature ������������������������������������������������� 50
                                                Microclimate Temperature Profiling & Spray Drift������������������������������ 51
                                                Microclimate Systems - Temperature & Humidity ����������������������������� 52
                                                Light & Radiation System ��������������������������������������������������������������������� 54

                                             Hydrological Monitoring �������������������������������������������������������� 56
                                                Monitoring Water Quality in Aquaculture Systems ���������������������������� 57
                                                Water Quality Monitoring ������������������������������������������������������������������� 58
                                                Data Buoys ������������������������������������������������������������������������������������������� 59
                                                Water Level Monitoring ���������������������������������������������������������������������� 60
                                                Runoff Monitoring and Sampling �������������������������������������������������������� 62

                                             Urban & Industrial Monitoring ������������������������������������������ 64
                                                Air Quality Monitoring: Particle Size & Noise ������������������������������������� 65
                                                Air Quality Monitoring: CO2 & Oxygen������������������������������������������������ 66
                                                Urban/Industrial Temperature Monitoring ���������������������������������������� 67
                                                Examining Thermal Efficiency in Housing ������������������������������������������� 69

                                             Understanding IoT Sensing Networks ��������������������������� 70
                                                Sensor-Node IoT Packages (SNiPs) ������������������������������������������������������ 72
                                                Example SNiP Setups for Fruit Crop Applications ������������������������������� 73
                                                Understanding IoT Nodes �������������������������������������������������������������������� 74
                                                LoRaWAN Gateways: The Nexus 8 & Nexus Core ������������������������������� 80

                                             Our Capability Statement ������������������������������������������������������ 83

Enabling better global research outcomes in soil, plant & environmental monitoring                         ICT INTERNATIONAL                                 3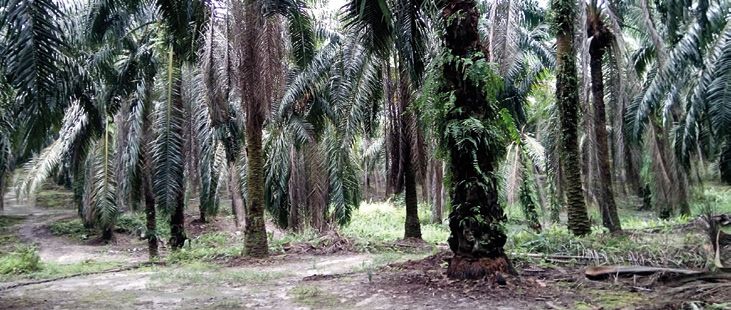
Plant Monitoring

 The plant itself is a very sophisticated transducer or “sensor.”
 Using every leaf in the plants canopy, radiation, temperature,
 humidity and wind speed are measured and processed. The                             Open Format Data Compatible
 large, dynamic root system of the plant extensively senses                            with Flexible Connectivity
 and processes large volumes of soil for water and nutrition.                                  (pg. 74-75)

 The plant then integrates all of these sensed inputs into
 a single measurable output that describes its ability to
 photosynthesise and grow.

 This single integrated output is the Sap Flow (Litres/Hour)
 or Plant Water Use (Litres/Day).

 IoT (Internet of Things) technology increases
 the speed, consistency, and convenience of
 data collection and application management.
 ICT International's modular range of SNiPs
 (Sensor-Node IoT Packages) enable real-
 time accurate measurements for continuous
 plant monitoring. See pages 70-81 for more
 information.
                                                               SFM1x (LoRaWAN)
                                                                 Sap Flow Meter                                 ATH-2S
                                                                                                              Air Temp
 SNiPs reduce the cost of getting a fuller                                pg. 22
                                                                                                              Humidity    MFR
 picture on the application, replacing                                                 DBV60                     pg. 52   NODE
 traditional loggers for each sensor or                                                Band Dendrometer                   pg. 76
                                                                                       Tree Swelling pg. 28
 additional parameter.

                                                                                           MP406
                                                                                        Soil Moisture
                                                                                        Probes pg. 6-7
                    Sensor-Node Integrated Package (SNiP)
                         for Avocado Irrigation Monitoring

18       ICT INTERNATIONAL                    Soil 4-17 Plant 18-43 Meteorological 44-55 Hydrological 56-63 Urban & Industrial 64-69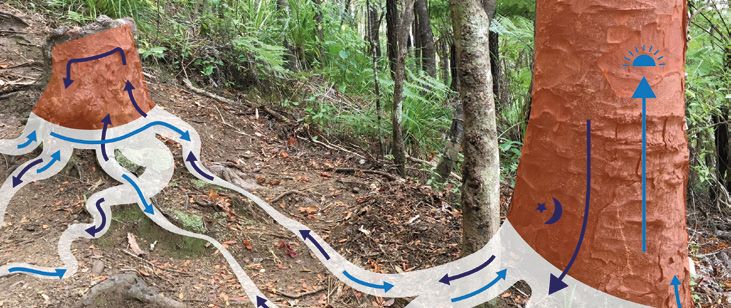
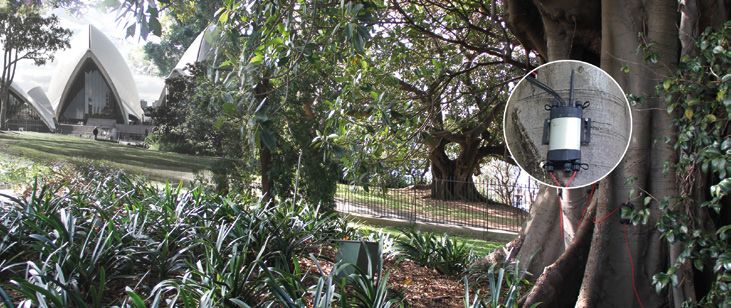
Green Asset Management in Urban Environment
Thresholds to Measure Urban Tree Health

Monitoring urban tree water-use enables the
establishment of an upper and lower threshold for
optimum water use and tree health, enabling arborists
to measure tree health and make confident decisions
in the irrigation management of any Urban Forest.

Tree water use is highly variable from day to day, and
seasonally. If a tree begins to experience water stress
it becomes more susceptible to attack from pests
and disease, creating a higher risk of limbfall and
insurance payout.

SFM1 Continuously Monitored The Water Use of Heritage Trees in Sydney, Australia

Near the Opera House, Sydney, Australia, a Moreton                      Over 30 days, from April 9th to May 8th the water use
Bay Fig was installed with SFM1 Sap Flow Meters.                        progressively declined by 30%. This reduction was due
The graph above (and right) focuses on 7 days of                        to reduced solar radiation and ambient temperature
this tree's water use. From hot days in April the tree                  as early autumn transitions towards winter. The graph
water use was as much as 360 L/day and on rainy                         below demonstrates how peak water use is declining
days it was as little as 44 L/day.                                      from 360 L/hr to 240 L/hr.

Enabling better global research outcomes in soil, plant & environmental monitoring           ICT INTERNATIONAL              19
Plant Monitoring: Returns on Investment
 Fertiliser Decisions, Cumulative Water Use and Crop Yield
 There is a close relationship between cumulative water use (CWU) of a crop and final yield. CWU indicates
 photosynthetic activity, dry matter accumulation and hence yield. As the season progresses measurement
 of sap flow will enable the CWU to be determined and how far the actual CWU is less than potential CWU.

 This measured CWU will
 determine fertiliser need
 and irrigation requirement.

 In situations where there
 is possible drainage of
 irrigation    water       and
 hence fertiliser below the
 rootzone, the fertiliser
 program can be planned
 from the measured CWU.
 Monitoring of drainage
 water will indicate losses
 of water and fertiliser out
 of the cropping system,
 potentially to the water
 table. These can all be easily
 and continually monitored.

                                            Cumulative water use (measured by Sap Flow Meter SFM1x) enables fertiliser applications in relation to
                                                                                                     actual plant growth/plant fertiliser uptake

     Continuous Sap Flow of Oil Palm for 62 days Enables Calculation of Actual Yield

 Yield Index: Scale up Frond 17 to whole Palm Tree and Water Use/ha

20         ICT INTERNATIONAL                       Soil 4-17 Plant 18-43 Meteorological 44-55 Hydrological 56-63 Urban & Industrial 64-69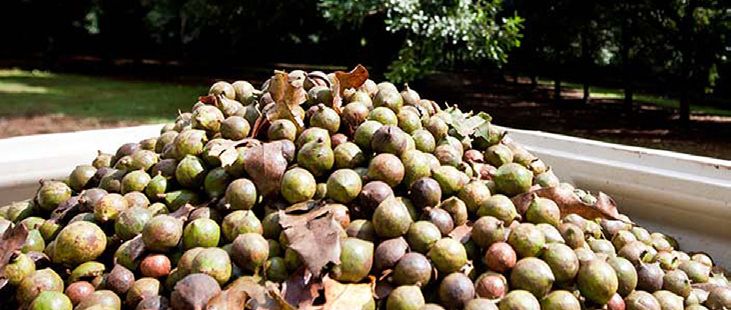
Irrigation & Fertiliser Drainage, Root Activity & Soil Water Extraction
A common problem encountered when irrigating              The depth of root extraction of water and fertiliser
light textured soils is deep drainage. This problem       is determined by regular measurement of changes
is often undetected and the soil water content must       in soil moisture at multiple depths over time during
be measured at a number of depths over a short            a drying cycle.
time periods before the problem can be properly
addressed.

                                                                       Right Graph: Drainage - Water Movement Down;
                                                                     Left Graph: Crop Water Use - Water Movement Up.

    Extended Sensor-Node Integrated Package (SNiP) for Oil Palm Irrigation Monitoring

                                                                                                          Rain
                                                                                                          Gauge
                                                                                                          PRP-02
                                                                                              ICT         pg. 45
                                                                                       MFR-NODE
                                                                                           pg. 76
                           ICT
                    MFR-NODE
                        pg. 76
                                                              SFM1x (LoRaWAN)
                                       ATH-2S
                                                              Sap Flow Meter
                                       Air Temp
                                                              pg. 22
                                       Humidity pg. 52

                                                                                                     Gee
                                                                                                     Lysimeter
                                                                                                     pg. 16

                                         MP406 Soil
                                        Moisture Probes
                                            pg. 6-7
   SFM1 Sap Flow Meter
   on Frond 17 pg. 22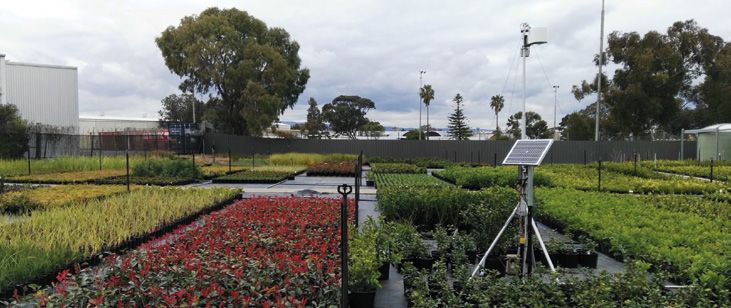
Plant Water Relations: Sap Flow

 SFM1x Sap Flow Meter
 The SFM1x Sap Flow Meter enables individual tree water use           applications. The SFM1x features an UCM
 and health to be monitored in real time. This is because the         (Universal Communications Module) that
 SFM has integrated data transmission direct to cloud using           enables a customer to choose from:
 IoT/LTE-M Cat-M1. The SFM1x Sap Flow Meter is a discrete
 standalone instrument based upon the Heat Ratio Method.              □ Non-IoT – Data Downloaded via Bluetooth/USB;
 This measurement principle has proven to be a robust and             □ LoRaWAN™ – Low-Power Long-Range
 flexible technique to measure plant water use; being able to           connectivity;
 measure high, low, zero and reverse flows in a large range of        □ LTE Cat M1/Cat NB1/EGPRS – Utilising
 plant anatomies & species from herbaceous to woody, and                existing mobile networks.
 stem sizes > 10 mm in diameter. The theoretical basis and
 ratiometric design of the Heat Ratio Method makes possible           ICT LoRaWAN and LTE Cat M1/Cat NB1/EGPRS
 the measurement of high, low, zero and reverse flows.                provide data which is open-format and free from
                                                                      proprietary formatting or decoding. This provides
 The SFM1x Sap Flow Meter consists of two temperature                 full control of data from the point of sensing and
 sensing needles arranged equidistance above and below a              allows the end user full flexibility in how they
 central heater. These needles are inserted into the water            collect, store and view data.
 conducting tissue of the plant by drilling 3 small parallel
 holes. Heat is then pulsed every 10 minutes into the water
 conducting tissue of the plant. The heat is used as a tracer         SFM1x Sap Flow Meter
 to directly measure the velocity of water movement in the            Needle Diameter/Length           1.3 mm / 35mm
 plant stem.                                                          2 Measurement                  7.5 mm and 22.5 mm
                                                                      Spacings per Needle           from the needle tip
 The SFM1x Sap Flow Meter is a dedicated self-contained               Output Options              Raw Temperatures: °C
                                                                                               Heat Pulse Velocity: cm hr-1
 data logger, with a heater and two temperature sensing
                                                                                                  Sap Velocity: cm hr-1
 needles, that provides power to the heater and logs sap                                          Sap Flow: Litres hr-1
 flow in litres per hour of water used by the plant. This is          Range                      Approx. -70 ~ +70 cm hr-1
 the water actually used by the plant in litres, completely
                                                                      Resolution /                     0.01 cm hr-1 /
 independent of any water that may have been lost to                  Accuracy                          0.5 cm hr-1
 evaporation from bare soil, run off or through drainage.             Measurement Duration               120 seconds
                                                                      Heat Pulse                     20 Joules typical
 The SFM1x has been designed to provide flexible                      Default (User              Equivalent to 2.5 second
 communication. With an onboard SD-Card, it provides                  Adjustable)                  heat pulse duration,
 stand-alone data logging capabilities and full data                                                   auto scaling
 redundancy in the event of temporary loss of                         Adjustable Logging
                                                                                                     Minimum: 10 mins
 communications or dropped packets – ideal for research               Interval

22       ICT INTERNATIONAL                Soil 4-17 Plant 18-43 Meteorological 44-55 Hydrological 56-63 Urban & Industrial 64-69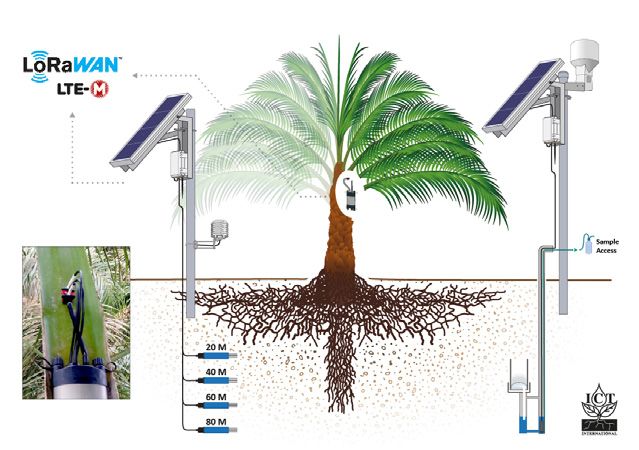
Macadamia Sap Flow Monitoring & Irrigation Management
The search for more precise water monitoring technologies
Australian macadamia growers, like many orchardists, have focused on indirect indications of plant water
use by using soil moisture sensors to help schedule irrigation events. Irrespective of the soil moisture sensor
technology, relying on very small (millimetres) samples of soil and expecting a meaningful or representative
response across a large area (hectares) has always been problematic for precision agriculture.

Australia macadamia growers are now seeking more precise monitoring technologies that can directly
measure the plant and its water use. The way of doing this is by using the plant itself as a sensor by measuring
sap flow. By directly and continuously monitoring the whole plant, which uses its root system to sample a
large volume (cubic metres) of soil, a very accurate and representative recording of water use and water
status through the orchard can be made. Real-time information about a plant’s water requirement as it
interacts with its ever-changing environment throughout the day and night helps growers better determine
crop water requirements and hence to improve irrigation practices.

                                                     Listening to the tree with Sap Flow
                                                     In the past, managers have had access to pump and flow
                                                     meter data to estimate volumes of applied water with
                                                     each irrigation event, but the fate of the applied water
                                                     was mostly unknown and difficult to determine.

                                                     The new approach in irrigation management begins
                                                     from understanding and measuring the volume of water
                                                     moving through tree stems in the orchard system. Daily
                                                     water-use patterns measured by sap flow meters and
                                                     water stress measured by stem psychrometers allow
                                                     growers to see when their trees are active (day or night)
                                                     and to more closely match the total applied irrigation
                                                     water to tree water use at exactly the right time.

                                                     Identifying the seasonal differences in macadamia
                                                     water use and linking these changing demands with...

                                                                                ICT INTERNATIONAL              23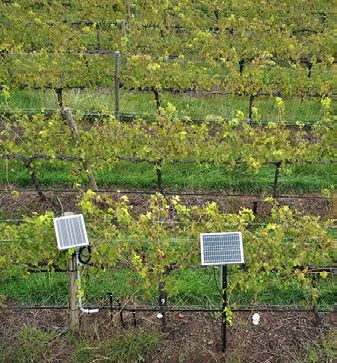
...key phenological stages of the tree’s yearly cycle will be the key to the foundation for sound and effective
 irrigation management. Below is water use using data for the cv816 tree over the observed 37-day period (27
 August to 2 October 2018). This is the critical flowering period.
     Tree Water Usage (L/Day)

                                                                                                    Flowering

     Total Individual                       Average Daily          Max. Daily            Water Use          Water Use For          Max. Daily Water
      Tree Water Use                       Tree Water Use        Tree Water Use         Per Hectare        The 6.2ha block          Use Per Hectare
                                                                     64.7 L                                                        18.1 kL/1.81 mm
                        1.73 kL                 46.8 L                                   484.6 kL               3.0 mL
                                                                  (17-09-2018)                                                       (17-09-2018)

 Full Article: Manson, D., & Downey, A. (2018). Sap flow monitoring a new frontier in irrigation management.
 AMS News Bulletin, Summer 2018. https://australianmacadamias.org/industry/resources/sap-flow-
 monitoring-a-new-frontier-in-irrigation-management

 Tree Monitoring Proves Itself on Australian Macadamia Farm
                                                                                 A grower who manages more than 120 ha of mature
                                                                                 macadamia orchards in the Bundaberg region achieved
                                                                                 between 15-20% reduction in applied water during
                                                                                 winter and early spring compared to the same period in
                                                                                 the prior year by using sap flow monitoring (accounting
                                                                                 for rainfall pattern difference between years). This grower
                                                                                 is confident all the trees’ water requirements are being
                                                                                 met with the improved irrigation schedule, which was
                                       Sap Flow Needles in Macadamia Tree
                                                                                 developed by closely observing the constant feedback
                                                                                 from sap flow sensors.

 An added benefit is that maintaining reduced soil moisture levels has also reduced soil pathogen pressure and
 resulted in healthier trees, especially on the heavier soils. The lower operating soil moisture levels created by
 the improved scheduling have also increased the residual buffering capacity of the soil profile against over-
 saturation during heavy rainfall events, substantially aiding in erosion control and vigour management.

24                              ICT INTERNATIONAL                       Enabling better global research outcomes in soil, plant & environmental monitoring
Timing the Irrigation Using Sap Flow Measurement – An Example
Macadamia flowering in Southern Queensland
Australia, commences around September 1st
lasting approx. one month. It is important to
maintain high water use and low water stress
during flowering to maximise potential yield.
Interpretation of the sap flow and water SFM1x
potential data during the last week of August ICT
(LoRaWAN) pg. 22
MFR-NODE
indicated the commencement of water stress DBV60 Band ATH-2S
Air Temp pg. 76
as the sap flow rate steadily dropped from Dendrometer
pg. 28 Humidity pg. 52
approx. 20L to 12L/day.
Irrigation was applied on September 2nd and
MP406 Soil Moisture Probes
water use or sap flow increased from approx. pg. 6-7 pg. 74-75
12 L/day to approx. 24 L/day. Flexible Connectivity
24L/day
20L/day
Irrigation
12L/day
Time series overlay of sap velocity (Inner & Outer) 7 days prior to irrigation showing a steady reduction in sap velocity.
20L/day
12L/day
Changes in Plant Water Use 7 days prior to Irrigation.
ICT INTERNATIONAL 25Scientific Paper: New Zealand Forestry Kauri Trees Sharing Water
How does a tree without green foliage keep itself alive?
Dr Martin Bader and Assoc. Prof. Sebastian Leuzinger
from Auckland University of Technology have found
that when two trees of the same species are close to
one another, they are able to undertake Hydraulic
Coupling – that is share water, carbon, minerals and
microorganisms.
To prove this, they attached ICT International SFM1 Sap
Flow Meters and PSY1 Stem Psychrometers to a Kauri
Tree and an adjacent stump with no leaves (figure right).
From the data that these instruments captured, Bader
and Leuzinger were able to observe the movement of
the sap between the stump and the tree.
The SFM1 Sap Flow Meter can measure very low sap
flow and reverse sap flow. This enabled measurement
of sap flow toward the tree in day time and reversal
of flow toward the stump at night. The hydraulic
gradient as measured by the PSY1 Stem Psychrometer Figure (above, right) shows SFM1 Sap Flow Meters monitoring
reversed from day to night and hence the direction of sap flow through the stump at different times of day. (Supplied
by Assoc. Prof. Sebastian Leuzinger)
flow reversed from day to night in relationship to this
measured hydraulic gradient.
Figure (above, top) is a combined diagram of Daytime &
Nightime Shared Sap Flow, Based on the Scientific Paper's
Full Reference: Diagrams (Original Photo Supplied: Assoc. Prof. Sebastian
Leuzinger).
Bader, M. K.-F., & Leuzinger, S. (2019). Hydraulic
Coupling of a Leafless Kauri Tree Remnant to
Conspecific Hosts. iScience, 19, 1238–1247.
https://doi.org/10.1016/j.isci.2019.05.009
26 ICT INTERNATIONAL Enabling better global research outcomes in soil, plant & environmental monitoringPlant Water Potential: Stem, Leaf and Root Psychrometry
The PSY1 Plant Psychrometer
The PSY1 Plant Psychrometer integrates all the ambient
environmental parameters acting upon the plant such
as solar radiation, temperature, humidity, wind speed
and soil water availability into a single continuously
measurable variable. It is a stand-alone instrument
for the measurement of plant water potential. It
can continuously log changes in plant water status/
potential, which directly reflect the energy required
to access water or the stress the plant is under. Plant
stems or leaves can be measured using this instrument.
The measurement of water potential in-situ has been
corrected for temperature gradients and calibrated
against the Scholander pressure chamber.
The Psychrometer consists of two chromel-constantan
thermocouples encased in a chromium-plated brass
chamber acting as thermal mass. One thermocouple
is in contact with the sample (sapwood in stems or
substomatal cavity in leaves) and the other thermocouple
simultaneously measures the chamber air temperature
and subsequent to a Peltier cooling pulse, the wet bulb
depression. A third copper-constantan thermocouple
situated in the chamber body measures instrument PSY1 Psychrometer
temperature for correction. All these measurements
Units MPa
allow for precise and repeatable measurements of plant
water potential in MPa units at defined intervals. Range -0.1 MPa to -10 MPa
Resolution 0.01 MPa (0.1 Bar)
The PSY1 has been used in with many plants – forestry
Accuracy ±0.1 MPa (1 Bar)
(banksia, eucalypts, sandal wood, dalbergia, Thuja sp.,
Acer sp.), ornamental nursery (Metasequoia, Syringa),
field crops (sugar cane, wheat, rice, maize, palm oil,
grapes citrus, mango, coffee, avocado) and greenhouse
crops (capsicum, cucumber, tomato, almond).
Enabling better global research outcomes in soil, plant & environmental monitoring ICT INTERNATIONAL 27Plant Water Relations: Dendrometry
Band Dendrometer
Dendrometer bands are a long accepted
and widely used method of measuring tree
circumference and can provide changes in
tree diameter at breast height (DBH), basal
area, and basal area increment. The DBS60
Band Dendrometer is a high resolution (1μm
[0.001mm]), non-invasive sensor capable
of measuring a wide range of diameters
(50mm>). The stainless-steel band has a
very low linear thermal co-efficient. Thermal
variations caused by daily or seasonal changes
Realtime Dendrometry Data in temperature have no measurable impact on
the measurement accuracy. The DBS60 is IP66
Stem diameter is one of the most commonly measured rated and is designed to be installed in the
attributes of trees. Dendrometers are used to measure harshest field conditions for years at a time.
the diameter of fruits, plants and trees. High resolution
dendrometers are used to monitor the diurnal swelling
and shrinkage of stems. During the day stems “shrink” Pivot Dendrometer
as stomata open and the tree transpires. At night the
stem “swells” due to cessation of transpiration and trunk Pivot dendrometers are designed for simple,
refilling of moisture. error free installation, being fastened on
the stem by a spring-based lever clamp.
Maximum Daily trunk Shrinkage (MDS), the calculated Adherence pressure is set as a compromise
difference in daily minimum and maximum stem between the influence on plant tissues and
diameter, is a commonly used parameter in irrigation installation stability. The DPS40 Pivot Stem
scheduling. Significant crop research has been Dendrometer is a high-resolution pivot-based
undertaken in this field to explore the correlation of sensor for measurement of small stems, from
MDS to physiological and abiotic parameters including 5mm to 40mm, the bearing of the position
soil moisture and water potential, vapor pressure deficit sensor is carefully shaped for minimal effect of
(VPD) and stem water potential. temperature and axial forces.
Seasonal datasets can be used to compare fertilisation
treatments, pruning, thinning or drought treatments.
In forestry dendrometers are used for long term
data collection in the study of growth dynamics,
biomass allocation and carbon uptake. In horticulture
Dendrometers are used to monitor MDS for irrigation
management.
Figure shows Maximum Daily Shrinkage i.e. The maximum
daily stem diameter minus the minimum daily stem diameter.
28 ICT INTERNATIONAL Soil 4-17 Plant 18-43 Meteorological 44-55 Hydrological 56-63 Urban & Industrial 64-69Dendrometry SNiPs SNiP-DPS SNiP-DBS4 SNiP-DBS6
Tree/Stem Tree/Stem Tree/Stem
SNiP Measures Circ. (mm) Circ. (mm) Circ. (mm)
/ Temperature / Temperature / Temperature
DBS60 with
Core Sensor/Device DPS40 modified fixing DBS60
plate
UOM mm / °C mm / °C mm / °C
Increment Range 35mm of 60 mm of 60 mm of
circ. circ. circ.
Minimum Trunk Diameter 5mm 40mm 60mm
Maximum Trunk Diameter 40mm 80mm No maximum
Resolution 0.001 mm 0.001 mm 0.001 mm
SNiP Node S-NODE
Sensors SNiP Supports Up to 4
Mounting / Power SPLM7 / SP10 SPLM7, DBTAPE / SP10
Figure shows 12 months of a data set from an Acacia implexa
growing near Armidale, NSW, Australia. The DBL60 is
manufactured from UV Resistant plastic for many years of data
collection.
ICT INTERNATIONAL 29LoRaWAN Avocado Crop Monitoring
In late 2018, ICT International installed a monitoring program in an avocado orchard with the specific
objective to reduce rates of fruit drop (abscission), hence yield loss, by improved irrigation scheduling.
The Site Project Background
The farm, located on the Mid-North Coast of Avocado trees are particularly sensitive to heat (and thus
NSW Australia, had previously suffered crop water stress) at the time of flowering and fruit set. Water
losses caused by water stress during flowering stress can result in flower and fruit drop, thereby reducing
and fruit set. Seeking a solution to better yield. By forecasting the risk factors which contribute to
detect this risk required real time monitoring plant water stress, notably low soil moisture and high
to enable pro-active management of irrigation Vapour Pressure Deficit (VPD), management decisions
and canopy humidity. can be implemented to minimise the risk of fruit drop.
The Solution: Crop Monitoring Sensors
• Weather station
• Soil Moisture Sensors
• Temperature Sensors
• High Resolution Dendrometers measuring avocado
tree trunk diameter
• Micro-climate sensors outside and within the canopy
measuring temperature, relative humidity and
calculated VPD.
Dendrometer
Integrated Into a LoRaWAN Network
Data from the sensors is transmitted over a private
LoRaWAN network to a Gateway utilising a fixed-point
network connection. Eagle.io is used for data storage
/ visualisation and alarming of soil moisture, VPD and
Maximum Daily trunk Contraction (MDC).
The system notifies operators (via SMS and email) when
irrigation is necessary to avoid plant water stress and
potential fruit drop, hence crop loss.
30 ICT INTERNATIONAL Enabling better global research outcomes in soil, plant & environmental monitoringSNiP-SPW1 SNiP-SPW2 SNiP-SPW3
Soil Moisture, Multi-Point Soil Moisture Soil Moisture /
SNiP
Temperature and EC / & Temperature / Tree Circumference
Measures
Tree Circ. / VPD * Tree Circ. / VPD * / VPD *
SMT-100 / EP100GL-04 / MP406 /
Core Sensor/Device
DBS60 / ATH-2S DBS60 / ATH-2S DBS60 / ATH-2S
SNiP Node S-NODE S-NODE MFR-NODE
Mounting / Power SPLM7, DBTAPE / SP10
Optional Extensions: Solar Radiation
*VPD is derived from measure of ambient temperature and relative humidity
The Outcome
The sensor network was installed in December 2018, prior to a month
of extreme heat which occurred during flowering and fruit set. Over
January, during fruit set, the sensor network detected two significant
plant water stress events, with local VPD levels rising above 5kPa.
Low soil moisture during the second event resulted in severe plant
water stress, reflected by higher levels of MDC of the trunk. Managers
Gateway
observed high numbers of fruit drop coinciding with the second event.
Dashboard View of Past & Realtime Data
VPD above 5kPa
High Trunk
Contraction
Low Soil
Moisture
Remotely controllable irrigation systems are currently being installed. The monitoring system will provide
property owners the information required to remotely control irrigation to reduce plant water stress events.
Enabling better global research outcomes in soil, plant & environmental monitoring ICT INTERNATIONAL 31Plant Light Relations: PAR
Photosynthetically Active Radiation (PAR)
Light intercepted by a leaf may be absorbed, reflected, No quantum sensor can perfectly match the
or transmitted; the fraction absorbed depends on the ideal quantum response, which is defined as
spectral content of the radiation and the absorption an equal response to all wavelengths of light
spectrum of the leaf. between 400 and 700 nm.
Photosynthetically active radiation (PAR) is light of The Apogee SQ-500 Full Spectrum Quantum
wavelengths 400-700 nm and is the portion of the Sensor (389-692nm) has a response closer to
light spectrum utilised by plants for photosynthesis. that of an ideal quantum sensor than the SQ-
Photosynthetic photon flux density (PPFD) is defined as 110. The SQ-110 Quantum sensor (410-605nm)
the photon flux density or PAR. If PAR is low plant growth is used when focusing the PAR measurements
and carbon assimilation is limited, while too much PAR in the green portion of visible light.
may damage the photosynthetic apparatus.
Plant Light SNiPs SNiP-SQS SNiP-SQE SNiP-SQF SNiP-PFR SNiP-RFR
SNiP Measures PAR PAR PAR PAR/FAR Red Red/FAR Red
Core Sensor/Device SQ-110 SQ-120 SQ-521 SQ-521,S2-441 S2-431
0 to 4000 μmol
0 to 4000 0 to 4000 m-² s-¹ (PAR) 0 to 400 μmol
Measurement Range
μmol m-² s-¹ μmol m-² s-¹ 0 to 1000 μmol m-² s-¹
m-² s-¹ (Far Red)
389 to 692 nm 389 to 692 nm 645 to 665 nm
±5 nm ±5nm (PAR) ±5nm (Red)
Wavelength Ranges 410 nm to 655 nm
700 to 760 nm 720 to 740 nm
±5nm (Far Red) ±5nm (Far Red)
Sensor IP Rating IP68 - Sensor can be submerged in water to 1m depth
SNiP Node AD-NODE S-NODE S-NODE S-NODE
Mounting / Power AL-120
Optional SNiP Precipitation,
Soil Moisture, Microclimate
Extensions: Soil Moisture
32 ICT INTERNATIONAL Soil 4-17 Plant 18-43 Meteorological 44-55 Hydrological 56-63 Urban & Industrial 64-69Plant Light Relations: Controlled Environments PAR, Deep Red and Far-Red Light - Impacts on Plant Growth Photosynthetically Active Radiation (PAR) has been measured for many years as an important input to photosynthesis, plant growth and crop yield. In recent times with the advancement of LED manufacturing & light measurement technologies, it is now being understood that the extension of PAR measurement into the Red and Far-Red light range can explain much about plant height, leaf expansion and morphogenic processes of plants. This can be used to advantage with indoor plant production systems and controlled environments. The plant canopy selectively absorbs Deep Red wavelengths (approximately 660 nm) more than Far- Red wavelengths (approximately 730 nm) resulting in a decrease in the Red:Far-Red ratio of light toward the base of the canopy, such changes in light quality result in photomorphogenic changes in plant growth. In agricultural production systems an understanding of these responses is central to optimising planting density and canopy management. ICT International has a range of IoT packages available to connect with Apogee sensors and send data via LoRaWAN or LTE Cat M1/Cat NB1/EGPRS to the cloud for real-time monitoring and control of greenhouse production systems and light interception of field crops. Enabling better global research outcomes in soil, plant & environmental monitoring ICT INTERNATIONAL 33
Plant Light Relations: Canopy Light Interception

                                                                                           Quantum PAR
                                                                                           SQ-110 pg. 32
                                                                                                                ICT
                                                                                                                MFR-NODE
                                                                                                                pg. 76

 Canopy Light Interception
 Plant light interception efficiency is a key determinant
 of carbon uptake by plants; plant productivity over
 seasonal time-scales is approximately proportional to
 intercepted light. Canopy architecture, leaf area, leaf
 angle distribution, and leaf dispersion are determinants
                                                                                    LINPAR
 in the light distribution and interception within the                               pg. 34
 canopy. In horticultural crops pruning strategies can
 optimise tree structure and drive higher productivity
 and increase plant health and longevity.

 The measurement of fraction of intercepted PAR (f) is
 an indicator of a plant’s light use efficiency or its ability
 to convert sunlight into biomass. The simple method
 requires at least one PAR sensor above the canopy to
 measure direct beam and one or more PAR arrays
 beneath the canopy.

 A PAR array is necessary beneath or within a canopy
 because it samples a larger area and considers sunlight
 variability caused by the canopy. Plotting f over a growing
 season against some measure of yield or biomass
 indicates the light use efficiency of crops.

 The MFR-NODE and AD-NODE can be configured with
 LINPAR and PAR sensors to measure, monitor and calculate
 intercepted PAR (f), and hence biomass and yield.

34       ICT INTERNATIONAL                Soil 4-17 Plant 18-43 Meteorological 44-55 Hydrological 56-63 Urban & Industrial 64-69
PAR Array SNiPs SNiP-SQ3 SNiP-SQ6 SNiP-SQ10 SNiP-LPAR
SNiP Measures Photosynthetically Active Radiation (PAR)
Core Sensor/Device SQ-313 SQ-316 SQ-311 LINPAR
(No. of Sensing Points) (3) (6) (10) (33)
0 to 2000
Measurement Range 0 to 4000 μmol m-² s-¹
μmol m-² s-¹
Wavelength Ranges 410-655nm 350-680nm
Sensor IP Rating IP68 IP65
SNiP Node AD-NODE AD-NODE
Optional SNiP Extensions Precipitation,
of Parameters: Soil Moisture
Canopy Light SNiP-CLI SNiP-CLI2
Interception SNiPs
SNiP Measures Canopy Light Interception
Core Sensor/Device SQ-110 (1) + SQ-110 (1) +
(No. of Sensing Points) SQ-311 (10) LINPAR (33)
SNiP Node MFR-NODE
Mounting / Power SPLM7 / SP10
Optional SNiP
Microclimate
Extensions:
ICT INTERNATIONAL 35Vegetation Indices & Disease Monitoring
Rain Gauge
PRP-02 pg. 45
ICT
S-NODE
pg. 77
ICT-LWS
Leaf Wetness & Disease Monitoring pg. 36
Leaf wetness refers to the presence of free water on
the canopy, and is caused by intercepted rainfall, dew,
or guttation. The duration of the time period during ATH-2S
which the leaves are wet is generally referred to as Air Temp
Humidity pg. 52
leaf wetness duration (LWD). Leaf wetness is a concern
for the development of disease and the dispersal of
pathogens; LWD is an important input (along with
temperature) in many crop disease models which are
used for determining the appropriate time for the use
of preventative measures, such as fungicide application.
Leaf Wetness SNiP SNiP-LWS
Core Sensor/Device ICT-LWS
Wetness Range 0-100%
Temperature Range -40 to 80°C
UOM mA
Measurement Range 4 to 20 mA
SNiP Node AD-NODE
Tipping Bucket
SNiP Sensor Extensions Rain Gauge
Ambient Temperature
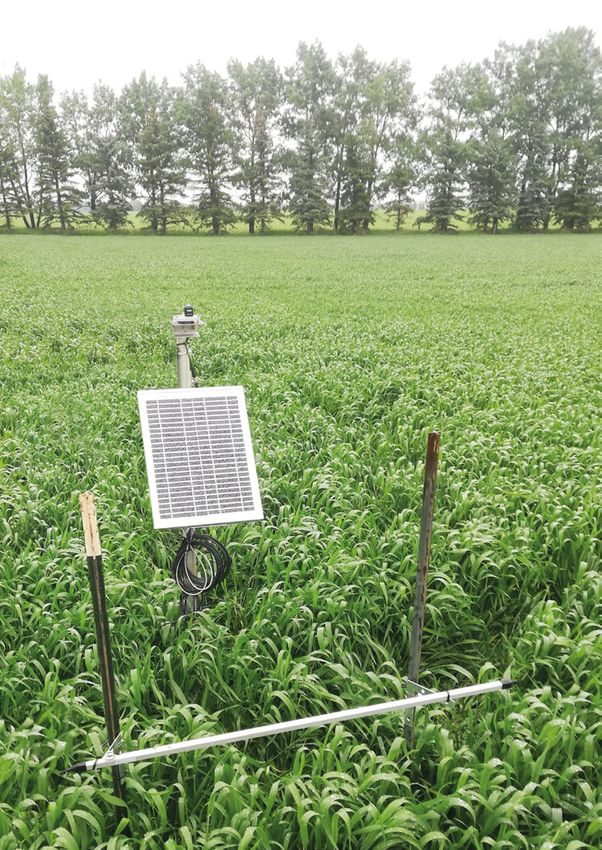
Vineyard Installation - MP406 Sensors Augered
36 ICT INTERNATIONAL Soil 4-17 Plant 18-43 Meteorological 44-55 Hydrological 56-63 Urban & Industrial 64-69Plant Reflection of Light
NDVI (Normalized Difference Vegetation Index) is
calculated from measurements of electromagnetic
radiation reflected from plant canopy surfaces.
NDVI is a standardized index use to measure the state
of plant health. Leaf chlorophyll absorbs red light
(approximately 680mm), and the cellular structure of the
leaves strongly reflect near-infrared light, approximately Absorbance and Reflectance of Near Infrared and Visible Red
730mm. When the plant is water stressed or diseased
the spongy layer deteriorates and the plant absorbs
more of the near-infrared light (NIR), rather than
Rain
reflecting it. By observing how NIR changes compared to Gauge
red light provides an accurate indication of the presence PRP-02
of chlorophyll, which correlates with plant health. pg. 45
Vegetation Indices SNiP-NDVI
SNiP Measures NDVI Index
S2-411-SS (Looks Upward)
Core Sensors
S2-412-SS (Looks Downward)
ICT
Wavelength Red detector: 650nm with 10nm* S-NODE
NIR detector: 810nm with 10nm* pg. 77
Ranges *Full-Width Half-Maximum
180° (Upward-Looking Device) & 40°
Field of View
(Downward-Looking Device)
Measurement
2x Full Sunlight
Range
Calibration
±5 %
Uncertainty
MP406 Soil Moisture
IP Rating IP68 Probes pg. 6-7
SNiP Node S-NODE
Mount / Power AM-400, AL-120
This extended SNiP-NDVI (above) is being used to monitor
Optional Capacity for an additional pasture growth and soil moisture for grazing management of
Extensions 2x S2-412-SS sheep & cattle in Northern Tablelands of NSW, Australia.
Enabling better global research outcomes in soil, plant & environmental monitoring ICT INTERNATIONAL 37Infrared Canopy Temperature
Infrared Radiometry - Canopy Temperature
An infrared thermometer measures radiant energy. This
radiation is simply “light” that is slightly outside the
human eye’s sensitive range. All objects radiate infrared
energy. The intensity of infrared radiation is proportional
to the absolute temperature (°K Kelvin) of the object.
Infrared thermometers produce no “intrusion error.” A
CWSI and Rainfall being recorded in Cotton and transmitted
hot object “target” is radiating its infrared radiation in by LTE Cat M1/Cat NB1/EGPRS system - Narromine NSW
all directions. The object’s radiation characteristics, and
hence its temperature, are not disturbed by the presence
of the infrared thermometer.
Canopy Temperature &
Crop Water Stress Index SNiPs
The infrared thermometer optics collect a sample of
infrared radiation from the hot object (soil & plant) being Canopy SNiPs SNiP-SI41* SNiP-CWSI
measured and focus it on the tiny infrared detector. SNiP Measures
Canopy Crop Water
Temperature Stress Index
The detector, in turn, converts it to a proportional
Core Sensors/ Apogee SI-400 Apogee SIL-411
electrical signal, which is the exact electrical analog Devices Series* ATH-2S
of the incoming infrared radiation, and hence the hot
Measurement
object’s temperature. This minute electrical signal is Uncertainty
0.2°C 0.5°C
then amplified, converted to a digital signal, and digitally SNiP Node S-NODE MFR-NODE
linearized and the resultant temperature either displayed Sensors SNiP
or data logged. Low temperature infrared thermometry Supports
Up to 4 Total Up to 4 Total
(IRT) is technically quite difficult especially when Mounting / SPLM7, AM-220 SPLM7, AM-250
measuring temperatures of crop canopies which have Power / SP10 / SP10
a very weak infrared signal and temperatures are Solar
Optional SNiP
needed to be resolved to 0.1 Deg C to make meaningful Extensions:
Radiation, Rain Gauge
Soil Moisture,
irrigation and management decisions. Continuous
measurement of the transducer temperature and sky
reflectance of infrared light must be undertaken. SNiP Core Sensors* Field of Views
SNiP-SIL4 Apogee SIL-411 Standard 22°
Accurate measurements of plant canopy temperature, SNiP-SI41* Apogee SI-411 Standard 22°
which, along with other environmental variables, allows SNiP-SI42 Apogee SI-421 Narrow 18°
estimation of canopy transpiration and crop stress using
SNiP-SI43 Apogee SI-431 Ultra Narrow 14°
a calculation such as Crop Water Stress Index (CWSI).
Horizontal 32°
SNiP-SI4H Apogee SI-4H1
Vertical 13°
(half angles)
38 ICT INTERNATIONAL Soil 4-17 Plant 18-43 Meteorological 44-55 Hydrological 56-63 Urban & Industrial 64-69Leaf & Bud Temperature
ICT
S-NODE
Leaf Temperature pg. 77
The THERM-MICRO Leaf Temperature Sensor is a very
small thermistor that can be adhered to a leaf surface for
the measurement of absolute temperature of the leaf
at the surface. The THERM-MICRO’s small size means
that it has almost no thermal mass, resulting in minimal Leaf & Bud
Temperature
boundary layer influence and measurements which are SF-421 pg. 39
highly responsive to changes in leaf temperature.
Applications
• Transpiration Studies;
• Photosynthesis Rates;
• Leaf Energy Balance Studies;
• Viticulture - Leaf & Branch Disease;
• Bud Dormancy and Floral Initiation.
Frost (Leaf & Bud Temperature)
Leaf & Bud Temperature SNiPs Frost damage to plants can have large impacts
on crop yield and quality. The SF-421-SS is
a combination of two temperature sensors
(precision thermistors) designed to mimic a
Leaf SNiPs SNiP-LFT SNiP-LBT plant leaf and the other a flower bud. Protection
Leaf
Leaf & Bud of crops during frost events is dependent on
SNiP Measures Temperature the accuracy of plant temperature predictions.
Temperature
(Detect Frost)
Core Sensors THERM-MICRO SF-421
Quite often, air temperature is not a reliable
Measurement
Range
*-40°C~125°C *-50°C~70°C predictor of timing, duration and severity of
frost events because plant canopy temperatures
±0.2°C ±0.1°C (from 0~70°C)
Accuracy
(from 0°C~+70°C) ±0.2°C (from -25~0°C) can be significantly different than air temperature
SNiP Node AD-NODE S-NODE under certain environmental conditions. On
Sensors SNiP
clear, calm nights, plant leaf and flower bud
Up to 2 Total Up to 4 Total temperatures can drop below freezing even if air
Supports
Mounting/Power SPLM7, AM-220 / SP10 temperature remains above 0°C. This is called a
Ambient Ambient Temperature, radiation frost and is due to the lack of air mixing
Optional SNiP
Extensions:
Temperature, Soil Moisture, (wind) near the surface, and a negative net
Solar Radiation Solar Radiation longwave radiation balance at the surface.
Enabling better global research outcomes in soil, plant & environmental monitoring ICT INTERNATIONAL 39Weighing Scales For Plant Monitoring
Plant Weight SNiPs SNiP-PWS
SNiP Measures Plant Weight
Core Sensors PlantScale-100
Measurement Range 0~100Kg *----~~`*****
Accuracy TBA
SNiP Node MFR-NODE
SNiP Supports Up to 4x PS-100-SDI
Mounting / Power SPLM7 / SP10
Optional SNiP Rainfall,
Extensions: Soil Moisture, VPD
Measure Potted Irrigation and Transpiration Applications:
The SNiP-PWS Weigh Scale continuously measures applied □ Transpiration Rates of Plants;
irrigation quantities or rates of transpiration in small to □ Calibration of Sap Flow Meters;
medium size potted plants. Plants are placed on the scale □ Gravimetric weight monitoring;
and the weight is logged and transmitted continuously at □ Pressure Volume Curves;
user defined intervals. The amount of weight over time is a
□ Irrigation Monitoring.
direct measure of water applied to, or loss from the plant.
The ICT PlantScale incorporates an NTEP approved, high
performance, IP66 rated single point load cell with rated
capacity options of 50kg, 100kg and 150kg maximum
ranges; special humidity resistant protective load cell
coating assures long term stability over the entire
compensated temperature range. Providing serial SDI-12
output, multiple PlantScales can be easily bussed together
and connected to a common datalogger or IoT node.
The SNiP-PWS supports up to four PlantScales and can be
powered in the laboratory by a 240/110V to 24V CH24
power supply or in the field via an external solar panel.
Cumulative Comparison of Gravimetric
Water Loss to Sap Flow
Cumulative heat pulse velocity
Cumulative water loss (Litres)
(cm h-1)
*Options for 50,75,100,150, 200kg available
40 ICT INTERNATIONAL Soil 4-17 Plant 18-43 Meteorological 44-55 Hydrological 56-63 Urban & Industrial 64-69Weighing Scales For Bee Hive Monitoring
Bee Hive SNiPs SNiP-BHMS
Hive Weight,
SNiP Measures
Internal Hive Temperature
Core Sensors BeeScale-100 THERM-EP
Measurement Range 0~100Kg -40°C~80°C ----~~`
Accuracy TBA ±0.5°C at 25°C
SNiP Node MFR-NODE
Sensors SNiP Up to 2x WS-120-SDI
Supports Up to 4x THERM-EP
Mounting / Power SPLM7 / SP10
Ambient Temperature, Solar
Optional SNiP
Radiation,
Extensions:
Humidity, Rainfall
SNiP-BHMS Precision Apiculture
Precision apiculture with the SNiP-BHMS provides high incidence of shrivelled wings, and leg
apiarists and researchers with an advanced insight into and abdomen malformations, while adults
the health and productivity of a bee colony, and the may display behavioural abnormalities. A
environmental influences on such. Hive weight change relative humidity of below 50% in the brood
indicates the beginning and end of the nectar flow; cells causes a significant reduction in brood
when the honey supers are full; when winter feeding reproductive rates, conversely high humidity
is required; the occurrence of swarming and robbing has been shown to increase the percentage of
event; and changes in colony strength and productivity. brood mummification caused by chalk brood.
Using the BeeScale, the SNiP-BHMS monitors
Healthy honey bee colonies maintain a stable internal diurnal variations in hive weight, daily weight
hive environment. The stenothermic nature of the gains and losses as well as seasonal production
honey bee brood requires strict thermoregulation of gains. Hive thermoregulation is monitored
the hive within the range of 32–36°C. Pupae exposed using internal and external measurement of
to prolonged temperatures below 32°C will show brood temperature.
ICT
MFR-NODE
pg. 76
ATH-2S
Air Temp
BeeScale-100 Humidity
pg. 41 pg. 52
Enabling better global research outcomes in soil, plant & environmental monitoring ICT INTERNATIONAL 41Further Custom SNiPs for Plant Irrigation Applications
Sensor-Node Integrated Packages (SNiPs)
for Greenhouse Monitoring Quantum
PAR SQ-500 pg. 32
ICT S-NODE pg. 77
Ambient
Temperature
& Humidity
pg. 52-53
ICT
LVL-NODE pg. 79
THERM-SS
Temp pg. 14
SMT-100 Soil PlantScale-100
Moisture pg. 40
pg. 8
EC Salinity
ICT ICT
Water Level pg. 58
S-NODE S-NODE
pg. 60
pg. 77 pg. 77
Sensor-Node Integrated Packages (SNiPs) for Broad AWS200 Sonic
Acre Crop Cotton Irrigation & Fertiliser Management Anemometer
Weather Station
pg. 46
Apogee SIL-411 Delta-T
AWS Automatic Weather Station Inversion
for ETo Evapotranspiration Calculation Canopy
Temperature Layer for
for Crop Water Spray
Stress pg. 38 Monitoring
AWS500 Multiparameter
Rain pg. 51
Weather Station pg. 46
Gauge
PRP-02
pg. 45 SP-100
Available Light
pg. 54-55
ICT MFR-NODE
pg. 76 ICT S-NODE
pg. 77
Multidepth EnviroPro VWC % Temperature pg. 9Monitoring Plant Water Use in Urban Ornamental Nursery
Project background Monitoring and Network solution
Water is among the three biggest operating costs of In the Urban Ornamental Nursery, the following
commercial ornamental nurseries in urban settings. sensors and instruments were installed:
Furthermore, Australian nursery operators are
often restricted with strict water access regulations. • Soil moisture probes in pots – allowing the
Nevertheless, nursery managers must ensure that monitoring of pot soil moisture;
potted ornamental plants are grown to optimum • Weather station – monitoring of temperature,
marketable value. By carefully measuring plant- humidity & VPD extremes, as well as everyday
water relations combined with on-site weather weather events;
conditions, ornamental nursery managers can • SFM1 Sap flow meter on key potted plants.
manage water use whilst ensuring the supply of
quality planting materials. With a network solution the nursery manager was
enabled to monitor the water use of the plants and
The key parameters a nursery manager periodically the extremes of weather that influence the plant, as
checks typically through manual inspection are: this was connected to the internet. There was:
• Pot soil moisture; • The 4G Telemetry system – communicating
• VPD (vapour pressure deficit calculated from the sensor data to the cloud;
temperature & humidity); • ICT Dataview – the data storage and
• Leaf temperature (to avoid frost during winter visualisation platform;
and sun burn during summer). • Data redundancy for soil moisture, vapour
pressure deficit, weather parameters, and
sap flow for future analysis.
Outcomes
• Informed decisions on timing and lengths of
overhead/drip irrigation;
• Water usage quantification of potted plants;
• Seasonal and Daily variation - quantification;
• Ability to provide exact data for regulatory
water audits.
Enabling better global research outcomes in soil, plant & environmental monitoring ICT INTERNATIONAL 43Understanding IoT Sensing Networks
IoT (Internet of Things) provides near real-time The IoT technology used for data delivery will vary
data from sensors deployed to monitor the physical between site and sensing requirements; there is no
environment. Sensing requirements and the one technology which will best suit every application.
applications are broad. Examples can range from a
geotechnical engineer monitoring soil drainage on ICT International’s focus is always on the sensing,
a landfill site to a forester looking at rates of carbon our approach to IoT is agnostic; providing a suite of
sequestration in a native plantation. IoT Nodes which will support the most appropriate
sensors for the application while also providing the
Real time data collection provides information best form of connectivity for the installation site
for real time asset management, offsets labour- and monitoring network.
intensive data collection, and provides surety of
data collection for research applications.
Satellite
Environmental
MetOne Weather Station
Monitoring pg. 48 Pyranometer
Research Solar Radiation
pg. 54
LTE-M
Forestry Cat-M1/
Management Cat NB1
Horticulture
Agriculture ICT ICT Gateway
SFM1x (LoRaWAN) NODE LoRaWAN
Sap Flow Meter
pg. 22
pg. 74-79 pg. 80-81
Mining, Landfill
& Geotechnical DBV60 Band
Dendrometer
Tree Swelling
pg. 28
Open Format Data
Green Building
Management
Compatible With
MP406 Soil Moisture Probe
pg. 6-7
Water Catchment,
Level & Flow Flexible Connectivity pg. 74-77
70 ICT INTERNATIONAL Soil 4-17 Plant 18-43 Meteorological 44-55 Hydrological 56-63 Urban & Industrial 64-69Planning Node & Gateway Locations For A LoRaWAN Network
LoRaWan Test Kit - USB Radio with LoRa® P2P
ICT International’s LoRa Survey Kit is the ideal tool for
determining LoRaWAN network range, infrastructure
requirements and identifying site constraints, prior to
gateway installation. The LoRa Survey Test Kit contains paired
LoRa transceiver and receiver USB dongles, antennas and a
power bank; it works out-of-the-box for Windows 10, Linux,
and MacOS (with drivers available for Windows 8). The built-
in AT command allows the user to configure the radios.
Key Features:
□ LoRaWAN™ low-power long-range client
□ LoRa® Peer-to-Peer (P2P) connectivity
□ AT command set
□ The built-in AT command allows to
user to configure the radios.
Enabling better global research outcomes in soil, plant & environmental monitoring ICT INTERNATIONAL 71Sensor-Node IoT Packages (SNiPs)
ICT International’s integrated Sensor Node IoT The SNiP can be expanded to incorporate multiples
Packages (SNiP) provide off-the-shelf pre-configured of the base sensor or customised to include other
monitoring solutions. The range of Base SNiPs compatible sensors and accessories. Contact ICT
provided within this catalogue includes sensor(s), International to discuss the best SNiP and IoT
node, power and mounting accessories. system for your application.
Base SNiP: SNiP-MP4 pg. 6-7
1x MFR-NODE pg. 76
1x MP406 Sensor
With Power
& Frequency
Calibrations pg.
74-75
1x Solar Panel
+ Rechargable Li-ion Battery
1x Solar Panel/Node Mounting Frame
SNiP Extensions
2x MP406 Sensor
pg. 4-7
1x Rain Gauge Sensor
pg. 45
Notes
72 ICT INTERNATIONAL Soil 4-17 Plant 18-43 Meteorological 44-55 Hydrological 56-63 Urban & Industrial 64-69Example SNiP Setups for Fruit Crop Applications
Sensor-Node Integrated Package (SNiP) for Citrus Irrigation Monitoring
ICT
MFR-NODE
SFM1x (LoRaWAN) pg. 76
ATH-2S
Sap Flow Meter
Air Temp
pg. 22
Humidity pg. 52
DBS60 Band
Dendrometer pg. 28
Sap Flow Meter on Citrus Tree pg. 22 MP406 Soil Moisture
Probes pg. 6-7
Sensor-Node Integrated Package (SNiP) for Banana Irrigation Monitoring
A custom SNiP
setup with sensors
that cover the Soil-
Plant-Atmosphere
Continuum to
monitor and manage
irrigation and fertiliser ICT
in response to the MFR-NODE
ATH-2S pg. 76
conditions placed on
Air Temp
theBanana crop. Humidity
pg. 52
SFM1x (LoRaWAN)
Sap Flow Meter
pg. 22
MP406 Soil Moisture
Probes pg. 6-7
Sap Flow Meter on Young Banana Corm
Enabling better global research outcomes in soil, plant & environmental monitoring ICT INTERNATIONAL 73Understanding IoT Nodes
IoT Nodes for researchers, agriculturalists, horticulturalists,
foresters, geotechnical engineers, miners, utilities and asset
managers.
ICT International’s implementation of IoT is guided by over 30
years’ experience in environmental sensing. ICT International
IoT Nodes are designed specifically to measure key soil, plant
and environmental parameters, and encapsulate all the
important features in a sensing communication:
Specific Sensor Inputs
ICT International IoT Nodes support the output signals used in
environmental sensing: SDI-12, and high-resolution analogue
and digital. For highly specialised monitoring, such as Sap
Flow, we engineer custom built and scientifically validated
stand-alone products.
Flexible Connectivity
ICT International’s push towards an agnostic connectivity
platform is a recognition that the most appropriate from of
connectivity will vary between monitoring sites and networks.
The IoT platform provides exchangeable LPWAN solutions
with options for satellite coming soon.
Open Format Data
ICT International's LoRaWAN and LTE-M Cat-M1/Cat NB1
Nodes provide data which is open-format and free from
proprietary formatting or decoding. This provides the end
user full control of data from the point of sensing, and allows
flexibility in the collection, storage and viewing of data.
Adaptable Power System
Not all environmental sensors are designed for low power IoT
applications. ICT International’s IoT Nodes provide flexible
power options, including options for external 12 - 24VDC
supply, rechargable 6.5Ah or 13Ah Lithium-Ion batteries or a
non-rechargable Lithium battery pack.
Environmentally Sealed
ICT International’s IoT Nodes are IP65 rated and have
IP65 been demonstrated to operate in extreme environmental
RATED conditions, from hot Australian deserts to tropical Indonesian
rainforests to the Arctic Tundra.
74 ICT INTERNATIONAL Enabling better global research outcomes in soil, plant & environmental monitoringLoRaWAN Nodes MFR S AD EF LVL
Radios LoRa, LoRaWAN, FSK
Multi-Constellation GNSS
LTE-M Cat-M1
LoRaWAN AS923 (Asia)
Frequency AU915 (Australia)
Bands US915 (United States)
EU863-870 (Europe)
CN470-510 (China)
IN865-867 (India)
Sensor Inputs SDI-12
1x 24-Bit Analogue
4x 24-bit Analogue
4x Dry Contact Digital Inputs
RTD/Thermistor (2x Precision 24-Bit)
4-20mA
Frequency 0-100kHz
RF Noise Detection
0-10m or 0-5m Ultrasonic Level Sensor
Interfaces USB Serial Console
LoRaWAN Downlink Config
Features Periodic Reporting
Threshold-Based Alarm
SD Card (Data Storage)
SNiP (Sensor Node IoT Pack)
3-Axis Accelerometer
Power Non-Rechargable Lithium
Rechargable Lithium
External DC Solar Input
External DC Supply
Enclosure IP65 Polycarbonate
Custom
Hardware Ready | Product Variants
ICT INTERNATIONAL 75ICT International IoT Nodes
MFR-NODE: Multifunction Research Node Key Features:
The MFR-NODE has been designed to provide □ LoRaWAN™ low-power long-range
flexible communication, sensor and power
MFR
connectivity;
options. □ LTE-M Cat-M1;
The MFR-NODE supports SDI-12, four □ SD Card for data storage in csv format;
32-bit dry-contact counting digital □ SDI-12;
inputs and four single-ended (two differential) □ 4 x 32-bit dry-contact counting digital
0 - 3V analogue inputs, with selectable 12V, 5V inputs;
or 3V excitation and a 0-100khz frequency input.
□ 24-bit ADC for 2x differential / 4x
With an onboard SD-Card, the MFR-NODE provides single ended sensor, selectable 3V, 5V
stand-alone data logging capabilities and full data or 12V excitation;
redundancy in the event of temporary loss of communications □ 0-100khz frequency input;
or dropped packets – ideal for research applications. Data is □ Solar rechargable 6.5Ah or 13Ah
stored in csv format for ease of use. Lithium-ion or external DC power;
The MFR-NODE supports sensors with higher power □ MQTT and MQTT(S);
requirements; a solar panel can charge either the internal □ Microsoft Azure IoT Hub support.
lithium-ion battery or both the node and sensor can be powered
by an external DC power system (e.g. battery or mains source).
LTE Cat M1/Cat NB1/EGPRS provides the option for remote
installation in areas outside the range of LoRaWAN networks.
Fully encrypted data communications, with JSON or csv files
transmitted over MQTT(S) to a user-defined broker with
dedicated MQTT support Microsoft Azure Iot Hub.
76 ICT INTERNATIONAL Soil 4-17 Plant 18-43 Meteorological 44-55 Hydrological 56-63 Urban & Industrial 64-69You can also read