ASSESSING FIREFIGHTING WATER SUPPLIES - University of Canterbury
←
→
Page content transcription
If your browser does not render page correctly, please read the page content below
ASSESSING FIREFIGHTING
 WATER SUPPLIES
 University of Canterbury January 2020

The aim of this research was to develop a
framework for estimating the energy release rate
from developing building fires to provide evidence to
support development of the new code of practice for
firefighting water supplies.
Fire and Emergency New Zealand Research Report Number 175

 ISBN Number 978-1-92-728738-5
 ISSN Number 2703-1705
 © Copyright Fire and Emergency New Zealand

University of Canterbury, Department of Civil and Natural Resources Engineering (2020). Estimating energy
release rate from real fires for use in Assessing Firefighting Water Supplies (Report No. 175). University of
Canterbury, Christchurch, NZ: Fire and Emergency New Zealand.

This research was commissioned by Fire and Emergency New Zealand and undertaken by independent researchers.
Publication does not indicate Fire and Emergency New Zealand’s endorsement of the findings or recommendations.

Copyright ©. Except for the Fire and Emergency New Zealand emblem, this copyright work is licensed under the Creative
Commons Attribution 3.0 New Zealand licence. In essence, you are free to copy, distribute and adapt the work, as long
as you attribute the work to Fire and Emergency New Zealand and abide by the other licence terms. To view a copy of this
licence, visit http://creativecommons.org/licenses/by/3.0/nz/. Please note that the Fire and Emergency New Zealand
emblem must not be used in any way which infringes any provision of the Flags, Emblems, and Names Protection Act 1981
or would infringe such provision if the relevant use occurred within New Zealand. Attribution to the Fire and Emergency
New Zealand should be in written form and not by reproduction of the Fire and Emergency New Zealand emblem.
Estimating Energy Release Rate from Real Fires for use in Assessing
 Firefighting Water Supplies
 C M Fleischmann, V Ye, and J Spinks
 University of Canterbury
 Department of Civil and Natural Resources Engineering

1. INTRODUCTION

Water is the single most common fire suppression agent used throughout the world. As a
suppression agent, water extinguishes a fire by cooling, removing oxygen, etc. For major fire
incidences, large quantities of water may also be necessary for protecting the adjacent
properties that are exposed to significant thermal radiation. At major fires, the total amount of
water required can be millions of litres that must be supplied at rates greater than a 1000’s of
lpm (litres per minute). Fire and Emergency New Zealand (FENZ) has a critical need for large
quantities of water in order to meet their statutory requirements. However, such flow rate
requirements are rarely needed, and often municipal water supply design is governed by the
required fire flow.

In New Zealand, with its large rural and geographically diverse population, large fire flow
requirements can be even more onerous on rural building owners and small communities. There
is a responsibility on the part of all regulators to develop regulations that are appropriate to the
hazard but not excessively onerous. In addition, any regulation should provide an evidence base
to support methodologies used in the regulation. NZS4509:2008 New Zealand Fire Service
firefighting water supplies code of practice1, currently sets requirements for water supplies for
buildings in New Zealand. NZS 4509:2008 New Zealand Fire Service firefighting water supplies
code of practice is the current methodology used for calculating the required fire flows in New
Zealand. The code of practice uses a scientific basis for the firefighting water supplies but is
limited by the existing information on accurate estimates of the energy release rate of real fires.
Thus, NZS4509 may not be accurately estimating the water storage requirements.

The aim of this research is to develop a framework for estimating the energy release rate from
developing building fires to provide evidence in support the firefighting water supplies published
in NZS4509:2008 New Zealand Fire Service Firefighting Water Supplies Code of Practice. The
objective is to apply fundamental concepts of compartment fire dynamics along with post fire
investigation data and video observations to estimate the energy release rate from building fires.
This report is divided into two main parts:
 1. A review the existing methods for calculating the required fire flows for both New Zealand
 and internationally to better understand the currently available knowledge and
 techniques available.
 2. The application of compartment fire dynamics for calculating the energy release week in
 building fires.

In the application of fire dynamics section is further divided into three sections:

 1
1. Zero-order approximations –relies on vary little understanding fire dynamics and
 requires a minimum amount of training to be implemented.
 2. First order approximations – relies on a basic understanding of compartment fire
 dynamics and would require a trained and experienced fire investigator.
 3. Second order approximations – relies on an advanced understanding of compartment fire
 dynamics, advanced algebra, and estimated 16 hours of additional training.

The report has been setup in this way in order to provide FENZ with options to consider when
choosing a strategy for estimating the heat release rate from compartment fires. As the level of
analysis increase in complexity, so does the time and resources required to implement the
strategy. In some cases, the increased level of complexity and resources, may not give a sufficient
increase in the accuracy of the analysis to justify the expense.

2. EXISTING METHODS FOR CALCULATING FIRE FLOWS

NZS4509 was largely based on the research by Davis2 and was developed to apply the best
available information at the time of its development. When NZS4509 was written, there was a
comprehensive review of the existing methodology both domestically and internationally
reported by Davis2. Subsequent to the Davis report, there have been a comprehensive review by
the Fire Protection Research Foundation (FPRF) titled Evaluation of Fire Flow Methodologies,
released in January 20143. Also, noteworthy, is the research in this area by Grimwood4 et al
reviewing more than 5000 urban and rural fires that is also been reviewed as part of this report.
Below is a review of the 17 international methodologies for estimating fire flows. Each method is
briefly outlined, and appropriate references are supplied if the reader would like a more detailed
information. Methodologies that have been applied in New Zealand, have been included in a
separate section below.

2.1 International Methods

2.1.1 Insurance Services Office (ISO) Method5

The ISO method is widely applied in the USA. It contains a mathematical model to estimate the
required fire flow for extinguishment by considering the factors including construction types,
building area, combustibility of the building occupancy, inter-building fire exposure,
communication between buildings and the presence of fire protection measures6 (Myburgh,
2012). The required fire flow for an individual, non-sprinklered building fires calculated using
Equation 1 (ISO Properties., 2012).

 NFF = ( )( )[1.0 + ( + ) ] (1)

where NFF is the Needed Fire Flow) in GPM (gallons per minute) Ci, Oi, X and P are factors which
represents construction type, occupancy type, exposure condition, as well as communication
between buildings.

Based on a field database, the ISO method also suggests some general durations of firefighting
suppression for different types of occupancy (Insurance Services Office, 2012), including:

 2
The fire-flow duration for commercial properties is 2 hours for Needed Fire Flows (NFF) up to
2,500 GPM (160 L/s) and 3 hours for Needed Fire Flows of 3,000 (190 L/s) and 3,500 GPM (220
L/s).

 • The fire-flow duration for 1- and 2-family dwellings with an effective area in excess of
 4,800 square feet is 2 hours for Needed Fire Flows (NFF) up to 2,500 GPM (160 L/s) and
 3 hours for Needed Fire Flows of 3,000 and 3,500 GPM (190 to 220 L/s).
 • The fire-flow duration for 1- and 2-family dwellings with an Effective Area of 4,800
 square feet (450 m2) or less is 1 hour.

Hence, the total water volume demand is estimated by multiplying the required fire flow rate
with the application durations. However, the application of this method also contained some
uncertainties. According to Torvi et. al.7, the theories behind the mathematical models are not
explained well as it did not give any assumptions that were made in the creation of this model
and the method does not consider the available ventilation in the methodology.

2.1.2 International Fire Code (IFC) Method8

The International Fire Code (IFC) method is built up by using a list of tabulated needed fire flow
(NFF) values, which were derived through a simplified ISO method. Compared to the ISO
method, the IFC method is more focused around the factors of construction types as well as the
installation of sprinkler system. The example reference tables for the required fire flows are
shown in Figure 1, below. However, the source of data was not clearly identified. Thus, the
validity and accuracy of the method is not available.

 3
Figure 1 - The reference tables of required fire flows from the IFC method (International Fire
Codes, 2018)

2.1.3 National Fire Protection Association (NFPA) 1142 - Water Supplies for Suburban and
 Rural Fire Fighting Method 9

Chapter 4 of the document outlines the method for calculating the minimum water supply for
basic structural firefighting. This method assumes the fire flow is proportional to the volume of
the fire cell and it is designed to be used for firefighting suppression only3. The estimation is
based on arbitrary values for Construction Class (0.5 to 1.5) and Occupancy Classification (1 to 7,
1 is most hazardous) and any exposure hazards. The detailed relationship between these
variables are shown equation 2 & 3 below.

 (2)
 WS =
 × CC for structure without exposure hazards

 4
 (3)
 WS = 1.5 ×
 × CC for structure with exposure hazards

where WS stands for minimum water requirement (gallons), VStotal is the total volume of
structure (m3), OHC is the occupancy hazard classification number and CC is the construction
classification number.

Noted in the document is the minimum required water supply for structures without exposure
hazards is 2,000 gal (7,600 L) and the minimum quantity for structures with exposure hazards is
3,000 gal (11,400 L). The total firefighting water usage under each standardized fire flow rate
can be approximated using Table 1.

 Table 1 - The NFPA 1142 estimation method7

 Total Water Required (L) Fire flow rate (L/s)

 < 9500 16

 9500 – 38000 32

 38000– 76000 47

 >= 76000 63

The recent study from NFPA Fire Protection Research Foundation3 noted that by using a GAP
analysis, it was found that the total water required for the 1- and 2- family dwellings by NFPA
1142 was less than the estimated total water usage at the real fire scenes. For example, for a
designed fire scenario in a 3-storey residential building with the total floor area of 975 m2, the
actual applied fire flow was found as 110 L/s which was significantly higher than that required
by NFPA 1142 (i.e. around 47 to 63 L/s). However, since the actual field data are still quite
limited at this stage, a further study is expected.

2.1.4 The International Wildland-Urban Interface Code (IWUIC) Method10

This method is only applicable to wildland-urban interface (WUI) communities and it must be
approved by authorities having jurisdiction (AHJ) (International Code Council, 2012). The
method was developed for specific fire zones and considered more viable than for typical urban
building fires. In order to simplify the design and deliver a conservative estimation, it was
decided to assume that the rate of firefighting water suppression is only related to the type and
floor area of the building. For example, for one- and two-family dwellings, with floor area is less
than 3,60m2 square feet (3600 ft2), the required fire flow rate is 1,000 GPM (63 LPS) for 30
minutes. For floor areas greater than 360 m2, a 95 L/s (63 lps) fire flow rate must be provided
for 30 minutes, floor areas10.

 5

2.1.5 Ontario Building Code (OBC) Method11

The Ontario Building Code Method is designed for estimating the required quantity of water as
well as the related flow rate for firefighting in non-sprinklered buildings (Ministry of Municipal
Affairs and Housing, 2005). The minimum quantity of water required (Q in gal) is calculated
using the following equation:

 Q = (0.00749) × × × [1.0 + ( 1 + 2 + ⋯ + )] (4)

where K represents a water supply coefficient which ranges from 10 to 53 based on the
construction types of the building, V is the total volume of building in a unit of ft3 and Sside is the
individual spatial coefficient from property line exposures on all sides of the building. The code
noted that the maximum fire flow for any water supply is retricted to 2,400 GPM (150 L/s), the
individual spatial coefficients shall be less than or equal to 0.5 and sum of all spatial coeffecients
[i.e. 1.0 + ( 1 + 2 + ⋯ + ))has a maximum value of 2.0.

Nevertheless, as per the SFPE (NZ) Technical Publication TP 2007/131, this estimated fire flow
rate is assumed to be limited between 30 and 150 L/s. Hence, this method might not be suitable
for large firecells.

2.1.6 FIERA system Water Requirements Model7

The Fire Evaluation and Risk Assessment system (FIERAsystem) is a numerical system which
used for modelling light industrial fire scenarios developed by the Canadian National Research
Council. The model considers the factors which include geometry of the building, possible fire
scenarios, sensitivity of fire detectors, suppression systems, adjacent buildings, response time,
combined heat release rate (HRR) of all fires in the building, cooling capacity of firefighting
water and working efficiency of intervention by fire departments. It needs to be noted that
compared to the above methodologies, only this method considers the possible impacts of fire
control. However, in the limited literature review we were unable to find any case studies
applying the FIERA model.

2.1.7 French D9 Technical Document Method12

The French D9 Technical Document contains a number of tabulated minimum fire flow
requirements for home, office, public assess buildings and industrial buildings. The detailed
information about those reference tables can be found in ref [12]. It needs to be highlighted that
for the industrial risk design, more complex estimates should be consider the influence of risk
categories, storage arrangement (e.g. divided buildings) and internal intervention (e.g. fire safety
systems). The minimum fire flow rate is 264 GPM (17 lps) and the minimum operational
duration for flows of industrial building fires is generally set to be 2 hours, except in special fire
circumstances.

2.1.8 UK National Guidance Document on the Provision of Water for Firefighting Method13

The method which explained in the UK National Guidance Document is very similar to the IFC
method and French D9 Technical Document method, provides a list of fire flow values for

 6

different occupancy. Guidelines for flow requirements are included in Appendix 5 of the
document: National guidance document on the provision of water for firefighting (3rd edition)13:

 • Housing:
 (1) No more than 2 floors: a minimum of 8 L/s through any single hydrant
 (2) More than 2 floors (multi-occupied): a minimum of 20 to 35 L/s through any single
 hydrant
 • Industry:
 (1) Up to one hectare: 20 L/s.
 (2) One to two hectares: 35 L/s.
 (3) Two to three hectares: 50 L/s.
 (4) Over three hectares: 75 L/s.
 • Shopping, offices, recreation and tourism: a minimum flow of 20 to 75 L/s to the
 development site
 • Education, health and community facilities:
 (1) Villages: >= 15 L/s per hydrant
 (2) Primary schools and single storey health centres: >= 20 L/s per hydrant
 (3) Secondary schools, colleges, large health and community facilities: >= 35 L/s per hydrant

2.1.9 Iowa State University Method (ISU) 14

The ISU method was developed from hundreds of fire tests conducted by Iowa State University
in the 1950s. The method considers oxygen depletion and was designed based on the heat
absorption capability of water, the heat production from the volume of air in a given open area
as well as the steam generation which is required to displace air in a given volume. The required
flow given in Equation 5 is expressed in GPM where V is the volume of firecell in the unit of ft3:

.

 (5)
 RFF =
 100

The flow requirement only relates to the size of fire room and it is assumed that the total volume
of the building can be filled with steam. Royer14, who used to work for the Iowa State University,
wrote in Fire Engineering Magazine that the application of this method was often misunderstood
in following perspectives.

 • The formula should not be altered regardless of the fuel load or type. This does not apply
 to the application stage. There is a difference between planning and application.
 • Only the largest single open area of the structure should be used. The method does not
 take into account other water that may be needed for other parts of the structure or for
 exposures.
 • Do not use this model in tactical sense. This method can work if fire is only in closed
 compartments.
 • Do not underestimate the role of steam.

 7
This approach has significant limitations as highlighted in ref[7] that showed that the ISU
method may ‘predict unrealistically high-water flow rates for large fires’ due to the great room
volume.

2.1.10 Thomas15, and Baldwin16, and Särdqvist17, Methods

A continuous developing model had been used by three researchers Särdqvist, Thomas and
Baldwin. The simple approach assumes that the fire flow is only a function of the horizontal fire
area (A) in square feet. Although each researcher analysed multiple fires, the factor and power
on the horizontal areas are different, as shown in Table 2.

Table 2 - Flow equations for Thomas, Baldwin and Särdqvist simple power law relationship.
 Number of Fire Tested Fire Covered Fire Flow Fire Flow
 Researchers
 Analysed Area, A [ft2] Estimations [GPM] Estimations [L/s]

 Thomas14 48 2,150 to 650,000 24.2 × A0.5 1.53A0.5

 Baldwin16 134 214 to 130,000 4.09 × A0.66 0.258A0.66

 Särdqvist17 307
2.1.12 National Fire Academy Method (NFA)21

The NFA method is modified from the previous ISU method by considering the possible impacts
of fire floors (e.g. accumulated heat effects from different level of floors). The mathematical
expression of NFA method is given as Equation 8 below

 × (8)
 NFF = ( + ℎ [ : 25% )
 3
 ×

where NFF standards for needed fire flow [GPM], L (ft) and W (ft) represent length and width of
the involved floor respectively.

However, according to the related research NFPA Fire Protection Research3 the application of
NFA method could be only reliable if four or fewer floors are involved by fire.

2.1.13 The Grimwood Method4,22,23

The most comprehensive research in the UK has been done by Grimwood and is reported in ref
4. Grimwood et. al. has developed and refined the 'tactical flow-rate (TFR)' for estimating the
fire flow which providing the smallest total water volume if possible. In the report Fire-fighting
Flow-rate22, their analysis of the effects of hoseline size, phases of fire (e.g. gaseous vs fuel-
phase), cooling efficiency of streams, latent heat of vaporization and other parameters have been
taken into account in the estimating the firefighting water requirement. Based on this analysis,
the firefighting water demand can be calculated using:

 • large compartment: minimum tactical flow (i.e. 6.67 L/s) should overcome the fire-front
 even as the fire is developing. If the fire has spread to involve structural components;
 walls; beams; floors; roofs, breaching compartmental boundaries etc, the higher flow of
 600GPM may be needed
 • Small compartment: The required fire flow rate [L/s] = 0.066667*floor area. However,
 this formula was only verified for room size within 50m2 and 600m2 and with 2.5m high
 ceilings

This works has been further developed in ref 23 published in 2014, that states 'once a fire
reaches a 20-30 MW level of heat release (depending on accessibility to the fire and resource
availability), a minimum flow-rate of 8.33 to 12.5 L/s must be delivered directly onto the fire
before it spreads beyond control' and the water application must be operated in the first 20
minutes. The most comprehensive, statistical study on fire flows reported in 2015, analysed of
5,401 UK building fires between 2009 to 2012. Grimwood developed the methodology to
estimate the fire flow rate demand (L/s) for additional occupancy types as shown below, where
the fire area is in unit of m2.

 9
Table 3 - Grimwood method

 Occupancy Fire Flow Estimations [L/s]

 Dwellings 4.732 × 0.44

 Industrial 8.265 × 0.51

 Public infrastructure (school, hospital) 3.849 × 0.57

However, its limitations of this method are also discussed in the SFPE (NZ) TP2007/124, which it
is only ‘valid for fire covered area from 50 to 600 m2. The flow formula is for suppression only
and does not include any allowance for exposure external to the burning firecell’.

2.1.14 The Fire Underwriters Survey (FUS)25 Method

The Fire Underwriters Survey method is the most popular estimate method in Canada. The
method is based on research and empirical fire protection experience. It determines the
required fire flow (RFF) as a function of the building characteristics, that considers the
construction type, floor area, number of storeys, occupancy, level of exposure risk,
combustibility of the building and the presence of fire protections (i.e. sprinklers). The primary
fire flow design (F) is expressed as:

 F [ / ] = 220 × × ̅̅̅̅̅̅̅̅̅̅̅̅̅
 √∑ (9)

where A is the total floor area for all levels and C is a coefficient which represents different
building materials (e.g. 1.5 for wood frame constructions, 1.0 for ordinary constructions, 0.8 for
non-combustible constructions and 0.6 for fire-resistant constructions). The method also
bounds the fire flow not to exceed 756.7 L/s nor be less than 33.3 L/s.

2.1.15 The Integrated Uncertainty Analysis Method26

The National Taipei University of Technology and Taoyuan County Fire Department conducted a
fire flow study by using an integrated uncertainty analysis. This study was designed to develop
a simple assessment model to utilise the heat release rate ( ̇ ) of building fires for estimating the
related water requirements for firefighting purpose. The theoretical water demand is calculated
using the following relationship:

 ̇ (10)
 m = ×∆
 = 3.3 × 10⁻⁴ × × ( )2 ×

where Cp represents the specific heat of water, ∆T is the change of temperature (kelvin), tin is the
approximate duration of fire department intervention, α is the fire growth coefficient for various
building classification, ts is the total suppression period and mc is the water required for
firefighting (kg). Oher factors that can affect the fire flow that were not incorporated in the
analysis include:

 10
• Building usage
 • Number of building stories
 • Floor area and volume of a building
 • Exposures
 • Fire station location

The authors summarize their findings from the one hundred of random case studies:

 • 'the largest (water) volume required was 234 metric tons
 • the least volume 3 metric tons
 • most common water demand for water suppression was 18 metric tons, which occurred
 18 times
 • in 80% of the cases, firefighting water volume was less than 68 metric tons of water'

2.1.16 Carleton University Method20

The methodology was developed by assuming that the water supply quantity for offensive and
defensive firefighting operations are different (Hadjisophocleous & Richardson, 2005). The total
flow required is the sum of the flow required during both offensive and defensive tactics. During
the offensive operation, they stated the required water flow rate could be estimated as

 60 × 0.058 × ′′ × √
 = = (11)
 2.6 × 0 0

where HRR is the heat release rate of fire area, 0 represents the cooling efficiency of water for
offensive operation, w'' represents fire load density for various occupancy and Af represents fire
area.

While for the defensive operation, the required water flow is calculated based on a radiation
exposure by considering a view factor in the calculations as shown below.

 ∑ ,
 = × (0.005 × ′′ × √ ) (12)

where represents the cooling efficiency of water for defensive operation and ∑ , is the
sum of view factors for four exposing building faces.

The cooling efficiency of water (η)is usually selected in a range of 0.3 to 0.6 for different types of
nozzle applied. The detailed guidance for determining this factor can be found in the document
of An Engineering Approach to Fire-Fighting Tactics from Lund University17.

The authors also compared their method with ISO5 and OBC11 methods in many case study
evaluations. However, as explained by the authors, ‘it is difficult to undertake a meaningful
comparison, due to the different objectives of the three methodologies. The new methodology
appears to provide results that are consistent with the OBC and ISO methods, given their

 11
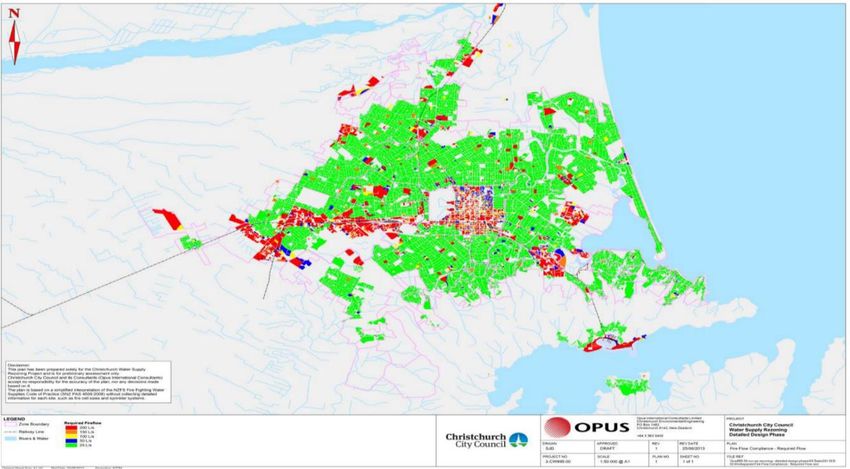
objectives. The new methodology is not, however, intended for use for special occupancy
hazards such as high rack storage and flammable liquids facilities.

2.2 New Zealand Methods

2.2.1 The GIS Method27

This research used an interesting application of Geographic Information System (GIS) and
hydraulic modelling system to assess fire flow requirements and the possible impact on
sprinkler system. The project was supported by the Christchurch City Council.

According to the current New Zealand fire design code SNZ PAS 4509:2008 (Standards New
Zealand, 2008), the required firefighting flows are set as ‘from 12.5 L/s for sprinklered family
homes, to 200 L/s for large or high-risk industrial buildings. Particularly high-risk structures
may require a calculation to estimate the required firefighting flow, which could potentially
exceed 200 L/s. However, after applying GIS to the provided land zoning and building area
information database (note: consider sprinkler installations as well), the results showed a
number of buildings in suburban Christchurch might need higher fire flows, especially for
schools, hospitals or rest home facilities. The detailed mapping of fire flow demands is presented
below, where the red zone represents the areas where the fire flow is required to be 200 L/s and
the green area requires 25 L/s. Moreover, the author also explained that 'due to the
uncertainties in assessing both required and available fire flow, a pass was recognized where
available flow was 120% of the required flow or greater'.

 Figure 2 - - The fire flow rate estimations for regions in Christchurch, NZ25

 12
2.2.2 New Zealand Society of Fire Protection Engineers (SFPE) Method28,29

The SFPE (NZ) method is described in technical publications TP 2004/128 and TP 2005/229. TP
2004/1 shows the estimation of the water flow requirements during firefighting operations and
TP 2005/2 is used to calculate the water storage criteria for firefighting purposes. As stated in
TP2004/1 (Society of Fire Protection Engineers, 2004), the required fire flow demand (F) is
modelled by applying the following general equation:

 × (13)
 F [ / ] = ×
 ≈ 6.1 ×

where kF and kW represents the heating efficiency of fire and cooling efficiency of water
suppression (Note: both estimated to be 0.5). Qmax is the peak heat release rate of fire (MW) and
Qw is the absorptive capacity of water at 100°C which is set as a constant value of 2.6 MW/L/s.
Based on this model, a further study found that fire flow requirement could also be influenced by
the fire-covered floor area. The relationship could be plotted as shown in Figure 3. Thus,
Equation 13 was modified to account for the floor area as shown Equation 14:

 0.666 (14)
 F [ / ] = 0.00741 × ( × )

where is the fire load energy density and Af is the floor area of the fire room. In this model, the
floor areas ranged from 100 to 5,000 m² and the fire load energy density that was selected to be
400, 800 and 1200 MJ/m2 as shown in Figure 3.

Figure 3 – Plot of fire flow rate versus fuel load energy density (MJ/m2) using TP2004/1 method
for predicting the firefighting water flow requirements assuming a heat of combustion to be 18
MJ/kg.

In the document of TP2005/2 (Society of Fire Protection Engineers, 2005), the firefighting water
storage required with the corresponding time of flow are estimated by three different methods,
which include Arbitrary Time Method, Arbitrary Fire Intensity Method and Firecell Volume
Method. Due to this research project focuses more on the practical demand of firefighting water

 13
application, the detailed information about the related water storage could be found from the
original TP2005/2 document.

2.2.3 New Zealand Fire Engineering Design Guide Method (FEDG)30

The FEDG method is very similar to the above SFPE (NZ) method, which the required fire flow is
related to the theoretical heat absorbing capacity of water and steam. However, in the FEDG
method, the cooling efficiency of the water is no longer assumed to be constant but could also be
varied under different temperatures as shown figure shown below (Fire Engineering Design
Guide, 2001).

 Figure 4 - Plot of the cooling efficiency of water as a function of temperature.

The FEDG suggested that the actual requirement of firefighting water demand could be well
predicted if the following factors were known,

 • The expected fire growth rate curve;
 • The fire intensity at the time the fire is attacked;
 • The expected duration of the fire and the peak fire intensity;
 • The water supply required to match the peak fire intensity; and
 • The ratio of applied water to required water for the intended firefighting water
 application system.

An international study published as a technical publication from SFPE (NZ) in 200731 suggested
the use of FEDG method is ‘only [applicable] to small firecells. This is because in the FEDG
design, the model of burning rate estimation was developed through testing small firecells which
the floor area was of the order of 10 m2. Therefore, the model might not able to predict the
scenarios in large firecells, especially for those floor areas which exceed 500 m2.

2.2.4 SNZ PAS 4509 Methods1

NZS 4509:2008 New Zealand Fire Service firefighting water supplies code of practice (Standards
New Zealand, 2008) is the most common methodology that has been applied in New Zealand. In
this methodology, the total water quantity considers both firefighting and exposure protection.

 14
As given in Appendix J of NZS4509, the procedures for determining the water flow
requirements:

 1. Estimate the maximum heat release rate (Qmax) as described in Appendix H that includes
 the effects of ventilation factor.
 2. Calculate water flow rate required for firefighting (Mwater = 0.58* Qmax)
 3. Calculate the exposure protection, Mexp by using the total exposure area and water
 wetting rate
 4. Calculate total water flow rate required, Mtotal = Mwater + Mexp
 5. Assess the adequacy of the available firefighting water

Once the required fire flow rate has been determined, the burning duration is estimated using
the general equation from the Appendix J8:

 Δ × (15)
 t [ ] =

Where tfire is the burning duration (s), Δ is the heat of combustion, is the mass of fuel in
firecell and is the maximum heat release rate of fires.

 15
2.3 Comparison between Common International Methods

Comparisons between different methodologies for calculating fire flow requirements can be
challenging because of the significant differences in the frameworks. Some methods rely on the
fire dynamics where other depend on historic statistical data and others are of unknown origin.
In many cases, the methods may approach the problem from fundamentally different
perspectives, one being a city planning perspective where the details of the building are
unknown. Another approach relies on the expected hazard based on zoning restrictions and
even another approach looks at the details of the building even going as far as considering the
details of the ventilation openings. Regardless of the various perspectives, Table 4 does provide
a useful comparison of all the methodologies discussed in this report. The rows give the name
associated with methodology and the columns give the parameters that are used to determine
the fire flows. Another difficulty in interpreting/comparing methods are the interdependent
nature of some of the parameters such as some methods require the FLED where other use
occupancy type which often defines the FLED. Reviewing Table 4 it can be seen that there
commonalities between many methods, yet there is no wide spread agreement on the
parameters that should be included when estimating the required fire flows.

Table 4 - Comparison of parameters used in determining the fire flow requirements for different
methodologies outlined in this report.

 Parameters

 Duration of fire department intervention

 Firefighting Equipment inside building
 Effectivenss of fire service operation

 Absorptive Capacity of Water
 Cooling Efficiency of Water
 Heating Efficiency of Fire
 Fuel load energy density

 Proximity to fire station
 Location (Rural/Urban)
 Compartment Volume

 Geometry of Building
 Storage arrangement

 Suppression System

 Building Materials
 Fire Alarm System

 Construction type

 Adjacent building
 Heat release rate
 Response time
 Ventilation
 Occupancy
 Floor area

 Exposure

Tools/organization/
SNZ PAS 4509
New Zealand Society of Fire Protection Engineers (SFPE)
New Zealand Fire Engineering Design Guide (FEDG)

Insurance Services Office (ISO)
International Fire Code (IFC)
National Fire Protection Association (NFPA) 1142
The International Wildland-Urban Interface Code (IWUIC)
Ontario Building Code (OBC)
FIERA system Water Requirements
French D9 Technical Document Method
UK National Guidance Document on the Provision of Water for Firefighting
Iowa State University Method (ISU)
Särdqvist, Thomas, and Baldwin Methods
Illinois Institute of Technology Method (IIT)
National Fire Academy Method (NFA)
The Grimwood Method
The Fire Underwriters Survey (FUS)
The Integrated Uncertainty Analysis Method
Carleton University

Although the comparison between the different methodologies is challenging and can vary
significantly depending on the assumptions made about the specific building used for
comparison, it is still useful to show some comparison of the methods. Because the focus of this
study is not solely on the topic of required fire flows, this report will rely on the available
comparison in the recent literature. The most comprehensive and recent comparison is
reported in the NFPA Fire Protection Research Foundation (FPRF) report by Benfer & Scheffey,
20143. In the FPRF report, the authors apply 18 different methods, including NZS4509, to a 140

 16
m2 & 325 m2 single family home for both the sprinklered and unsprinklered cases. In the FPRF
report they draw the distinction between the methods that are developed for building planning
and the on-scene methods that rely on firefighting experience or statistical fire incident data.

The results are shown in Figure 5 & 5 and demonstrate that there can be more than an order of
magnitude difference in the results of the various methods.

Figure 5 - Fire flow calculation results for a 325 m2 single-family home in presence/absence of a
sprinkler system3.

Figure 6 - Fire flow calculation results for a 140 m2 single-family home in presence/absence of a
sprinkler system3.

2.4 Conclusion - Existing Methods for Calculating Fire Flows

The existing methods of calculating fire flows, can be divided in two approaches as highlighted in
the FPRF report. The building planning methods that typically rely on multiple parameters

 17
relating to the building, occupancy & fire safety features and on scene methods that only use the
building or firecell area. The results of this review show that there is no commonly accepted
method for calculating fire flow requirements and there is a little agreement in the methods or
results of the existing methods.

FPRF report has suggested that the National Fire Incident Reporting System (NIFRS) could be
used estimate the actual fire flow used in the fire incident. In fact, much information required
about the incident and building are included in the database structure. However, it has been the
experience of this author, that the data is often not reported or includes obvious inconsistencies
in specific records. In addition, the current NFIRS structure does not include the details about
the fire flows used at an incident. Changes to the NFIRS data structure include:

 • Total flow use
 • Amount of water used in suppression activities
 • Amount of water used in other activities (overhaul etc)
 • Duration of fire suppression operation
 • Duration of other operations
 • Maximum flow rate used in the incident

Using such information would represent a significant improvement to the current data that is
collected and would allow for significantly improved statistical analysis of fire incident data.
Such data would allow for improved evidence-based methods for calculating the required fire
flow. However, the collection of this level of detail is not currently possible and would require
the following changes within FNZE:

 1. Changes to the to the NFIRS database structure.
 2. Modification to fire apparatus to measure and record as a function of time, the water
 flow used at fire incidents.
 3. Additional training to the users for the equipment and data collection personnel.

3. ESTIMATING THE HEAT RELEASE RATE FROM REAL FIRES

It is clear from the review of current methodologies for calculating required fire flows for
buildings, that there is no consistent approach to the problem and little evidence base for
existing methods. Although the FPRF report recommends an evidence-based approach through
the changes in the information collected in the NFIRS system. They do not give any guidance on
collecting better information about the magnitude of the fire beyond the assignment of the FLED
to the specific occupancy. The remainder of this report explores the idea of collecting and
processing of post fire information so that the heat release rate can be estimated from actual fire
incidence.

Previous work on estimating the heat release rate from actual building fires has been limited.
Even for planned fire experiments such as the Underwriters Laboratories Firefighters Safety
Research Institute (ULFSRI) the most active large-scale fire research organization burning actual
buildings, heat release rate data is limited to gas burner experiments or single residential scale

 18
rooms under calorimeters. Studies that full scale one and two- story houses in their lab and
onsite studies in building due for demolition do not allow for measuring the building heat
release rate. Therefore, any full-scale building heat release rate studies rely on estimates based
on expert judgement not measurements and typically not even analysis.

The remainder of this report focuses on a framework for estimating the heat release rate for
analysing fires in real building. The methodologies are described based on the level of
approximation from zero to second order approximation. In the zero-order approximation, the
analysis requires very little information apart from the building/fire area and the use of the
building. No detail about the fire or fire compartment is required. Very little knowledge would
be required by the individual caring out the analysis. First order approximation requires
understanding of the building area and a limited fire investigation to gauge the extent of damage,
amount of fuel involved, and the approximate burn time. This would require a limited amount of
additional training and could be carried out by a fire investigator. In the second order
approximation, detailed fire dynamics analysis may be undertaken to estimate the heat release
rate and would likely require a fire engineer or a trained investigator. However, in some of the
techniques mentioned in this report still require additional research in order to develop existing
methods for application to real fires. The order assigned is in no way critical of the researcher
identified in this report but points that the limitation that the researchers were constrained by
in their work. The accuracy of any research is only as good as the data available for analysis.
Thus, the research is considered to have been conducted using the best available knowledge and
understanding at the time.

3.1 Zero order approximation

Unfortunately, there have been few studies that have attempted in a systematic way to estimate
the heat release rate from building fires. Traditionally, fire investigations have focused on
finding the cause of the fire. If the fire is not suspicious in nature and relatively minor in
damage, the incident may only be investigated by the officer in charge. In the case large or
suspicious fires, a more formal investigation may be carried out by a fire safety officer with the
specific fire investigation training and the incident may be referred to the police if the fire is
suspicious. Typically, if a fire is not suspicious the investigation will stop once the cause of the
fire has been determined to a reasonable degree of confidence by the investigator/fire office. In
some cases, it may not be possible to determine the cause of the fire and the fire may be
classified as “undetermined”. Rarely, are the fire growth and development investigated in any
detail beyond the normal origin and cause investigation.

A review of the fire investigation research reveals that there have been few studies that have
attempted to estimate the energy release rate from fires. Studies such as Grimwood4 relied
largely on UK Fire and Rescue National Incident Reporting to estimate the heat release rate . Fire
incident data provides only limited information that can be used for estimating the energy
release rate from a fire. In Grimwood’s study, more than 5000 working building fires were
analysed. This included more than 4000 urban and 1000 rural fires. Although the fire service
collects data on all emergency responses this research specifically focused on fires and did not
include derelict buildings, exterior roof fires, or chimney fires. The data specifically targeted
internal fire damage and where water was deployed by a hose reel or main fire stream/monitor.

 19
However, in the analysis the authors had to make some simplifying assumptions. Fires were
classified as private dwelling or “all other building”. The area of the building was divided in
various classification such as 50-100m2 and then an average value was assumed, in this case
75m2. The authors then estimated the fire size assuming a 7% opening factor which gives a heat
release rate per unit area, often symbolically referred to as (q”), as q”= 200-250 kW/m2 floor
area. The precise value used were not reported so a range is inferred by back calculating from
value given for the fire size and areas. The value of 200-250 kW/m2 assumes a fully involved
space with stoichiometric burning and 7% of the floor area as ventilation area. Note that this
estimate is considered to be a peak value for the burning and does not include water required
for exposure protection or the impact of compartment enhancement nor reduction due to
limited ventilation.

To apply this approach to crudely estimate the heat release rate for an area/firecell involved, the
area of burning would need to be estimated either by direct measurement, fire incident data
collected for fire area, or area categories such as Grimwood et. al. had done. The accuracy of this
method would be greatly improved by direct measurement of the area burned in the fire by the
investigator. The method could also be improved by refining the q” based on the fuel involved
and/or property use of the building. This method assumes the fire is post- flashover although
the area times heat release rate per unit area (HRRPUA) approach could be used for pre-
flashover fires but burning area would require direct measurement by the investigator and the
fuel involved would also be required to improve the accuracy.

 Results from the zero-order analysis is only able to provide the maximum heat release rate
within the building and would not be able to estimate the growth rate nor the heat release rate
that may occur outside the compartment such as external fire plumes from a window.
Uncertainty of applying this zero-order approximation is considered to be quite high and may be
as high as several times the calculated value. When using this value, the researcher should
provide an estimate of the uncertainty based on their understanding of the fire dynamics,
assumptions they have to make for the specific analysis, and their confidence in the accuracy of
the area measurements.

3.2 First order approximation

The first order analysis requires significantly more detail about the building involved and the
specific event timing, and the observations made by the person that discovered the fire. This
methodology is based on the research by Holborn et. al.32, “An analysis of fire sizes, fire growth
rates and times between events using data from fire investigations”. The research relied on
London’s “Real Fire Library”. The data used had been input by fire investigators, not operational
personnel and had some level of filtering. The data incorporated 5 years data from 2000-2004
and include 2044 residential homes and 464 other building fires. Data used in the analysis
include:

 a) Event times:
 i) time of ignition of the fire,
 ii) time the fire was discovered,
 iii) time the fire brigade was first called out,

 20
iv) time of fire brigade arrival at the scene of the fire. b) Fire areas: i) area of the fire at the time of discovery, ii) fire area when the fire brigade arrived at the scene of the fire, iii) final fire damaged area. c) Type of occupancy in which the fire occurred. d) Ignition source. e) First material involved in the fire. f) Any first-aid fire-fighting actions taken by the occupants Not all of the required data was recorded for every fire, so not all incidents could be used in the analysis. In the case of fire growth estimates, 481 residential dwellings and 164 “other buildings” were analyzed. The data was analyzed to estimate the fire growth rate33 using the commonly used engineering approximation: q = t 2 (16) where: q- fire heat release rate (kW) α- fire growth constant (kW/s2) t – time (s) In engineering terms, the value is categorized into one of 4 fire growth rates34 based on the value derived in oxygen depletion calorimetry experiments where critical time (tc) is the time for the fire to reach 1055 kW. Ultra-fast =0.188, tc=75s Fast =0.0469, tc=150s Medium =0.0117, tc=300s Slow =0.00293, tc=600s 21
In Holborn, et. al. they defined ranges centered around the original classification and defined a new fire growth rate as “very slow” fires. The definitions used by Holborn et al is given in Table 5 Table 5 - Fire growth parameters used for classification used in Holborn et. al. The α value was estimated from the data collected by the fire investigators as defined in the following relationship: q ( A1t12 + A2t22 ) = (17) t14 + t24 Where: q - is the average rate of heat release per unit area of the fire (kW/m2); A1 - area of the fire when it was first discovered (m2); A2 - the area of the fire when the fire brigade arrived (m2); t1 - the time interval between ignition and discovery of the fire (s) t2 - the time interval between ignition and fire brigade arrival (s) 22
The q was taken as 250kW/m2 for all buildings except retail (500kW/m2) and warehouse/storage (1000kW/m2). The q values shows the authors recognized that certain building uses, i.e. retail and warehouse/storage are likely to be more severe fire than other property uses. This is an improvement on the zero-order approximation above. The results from the 481 residential dwellings that included all of the required data for analysis are shown in Table 6. The results demonstrate how relatively rare, rapidly developing fires are in residential building were
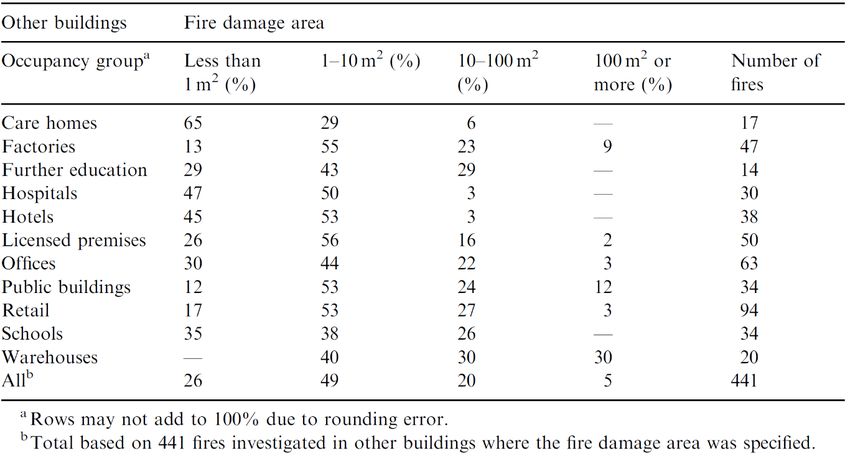
Beyond the growth phase, Holborn et al also reported the final fire damaged area for “other
buildings” as shown in Table 8. Unlike Table 6 & Table 7 which reported number of fires out of
the 441 fires and 164, respectively. Table 8 gives % of fires that exceeds defined areas including
0-1 m2, 1-10 m2, 10-100 m2, and >100 m2. A similar table was not reported for dwelling fires
but can be inferred from Figure 7 which show the complimentary cumulative distribution
function versus fire damage area.

 24
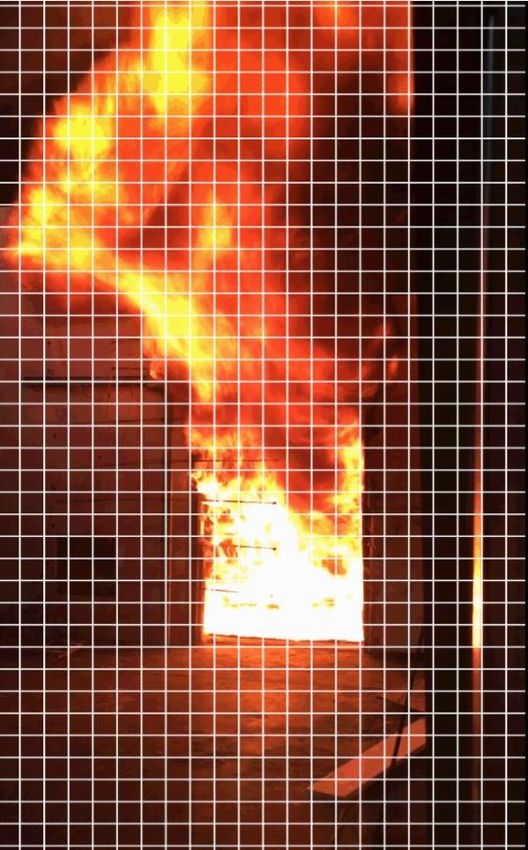
Table 8 – Percentage of fires in other building to each fire damage size group by occupancy type

Figure 7 – Complimentary Cumulative Distribution Function for fire damage area for the
samples of fires investigated in both residential dwellings and other buildings.32

 25
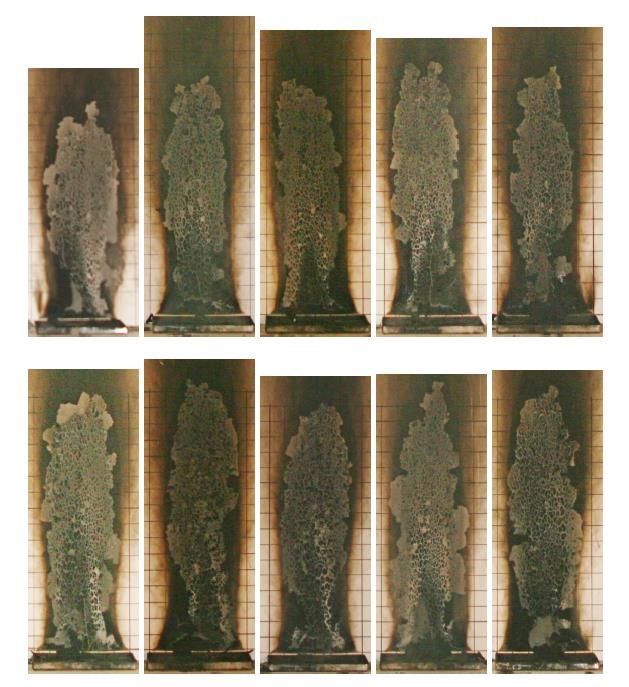
The first order analysis would be expected to be a significant improvement over the zero-order
method. However, would require significantly more data from each fire and would require
special training for the investigators. A full set of data that is required complete level of analysis
for the fire growth rate and maximum fire size, would only be available for a limited number of
fires where there is reliable eyewitness observation for estimating the time of discovery and fire
area at discovery. Information from eyewitnesses would require additional time for the
investigator to conduct detailed interviews. To conduct such detail in fire investigation would
require additional training and commitment of the fire investigators.

3.3 Second Order Approximation of Heat Release Rate

The second order approximation relies on both a through understanding of fire investigations
and detailed understanding of fire dynamics. Unlike the previous methods discussed above, the
second order approximation is most likely suited to a degreed fire engineer or a highly trained
fire investigator with a detailed understanding of fire dynamics.

This method is broken down into parts: 1) techniques that can be applied using our current
understanding, and 2) techniques that are understood but lack the validation to be applied at the
time this report was written. The techniques discussed in part 2 apply the current level of fire
dynamics estimate the heat release rate and burning duration. The techniques have not yet been
adequately researched to assess their application and determine their uncertainty methods.
Future research will be required to truly validate these methods.

Currently, the UL Firefighter Safety Rescue Institute (FSRI) is undergoing unprecedented growth
and expansion of their research capabilities that will include fire investigations. FSRI has
recently released a report titled: “Impact of Fixed Ventilation on Fire Damage Patterns in Full-
Scale Structures“35 . In this report the authors demonstrate the impact of ventilation can have on
the fire development and damage patterns left behind. However, they stop short of developing
the tools necessary to estimate how long the fire had been burning from the severity damage
patterns. As FSRI expands their research focus beyond firefighter safety, they will work to
provide more tools for fire investigation, and it is hoped that some of the techniques discussed
here will be included in their future research.

3.3.1 Information required for a second order analysis

In order to apply any of the techniques described in this section, detailed information will need
to be collected during the fire investigation process. This information is not included in the
NFIRS reporting and would require trained fire investigator or fire engineer to collect the data.
All of the information that would need to be collected is listed here in one place. Not all
techniques discussed below require all of the information listed here but it is preferred to have
all of the data gathering detail in one place for the second order approximation. The intention
here is not to define the information required in a fire investigation. For information on
conducting a fire investigation the reader should consult NFPA92136 or any number of textbooks

 26
on the topic. The intention here, is to highlight the additional information that may need to be
collected and may not be reported in a standard investigation fire report.

 a. Sketch of Building dimension
 i. Length
 ii. Width
 iii. Height
 iv. Number of stories
 b. Compartment(s) involved in the fire dimensions
 i. Length
 ii. Width
 iii. Height
 iv. Vent sizes window, door, roof, etc
 1. Width
 2. Height
 3. Sill height
 c. Char pattern sketch on each surface
 d. Depth damage map (char, calcination, etc)
 e. Estimate FLED available
 f. Estimate FLED consumed
 g. Estimate of Q” for space or item ignited
 h. Extent of exposure protection required
 i. Dimensions of large fuel packages in fire compartment(s)

 B) Photos
 a. Exterior of all sides of the building labelled north, etc
 b. Photos of each wall where fire was present labelled north, etc
 c. Photo of ceiling labelled with north arrow
 d. Photos of floor labelled with north arrow
 e. Photos of damage patterns of interest
 f. Photos of major packages involved in the fire

Consideration should be given to using a 360 camera that allows the full damage pattern to be
visualized. A 360 camera is no substitute for a high-resolution camera and good lighting, a 360
camera can make the piecing together of photographs easier and allows the investigator to
easily observe the room and then seek details in other high-resolution images.

Beyond the information given above, interviews with eyewitnesses should also be obtained
where possible. As in the first approximation, obtaining evidence on the size of the fire when
discovered and when the firefighters arrived are vital to estimating the fire development
especially in the pre-flashover stage. Without eyewitness accounts, some of the desired
estimates may not be able to be achieved.

 27
3.3.2 Applying Expert Judgement to Estimate Heat Release Rate per Unit Area ( q ) Applying the Heat Release Rate per Unit Area (HRRPUA) is same technique that was used in the first order analysis except that engineer/investigator is expected to apply expert judgement when chose q (kW/m2) and not simply taking an average for the class of the building. In spaces with several prominent fuel packages multiple q may be used along with the floor area occupied by the specific fuel package Table 9 provides some exemplar values for individual palletized commodities from the SFPE Handbook of Fire Protection Engineering39. The q should not be confused with q which is symbolic for the FLED or fuel load energy density (MJ/m2). In this case the q should be taken from the literature on full scale experiments of fuel items. Although, q is report in the cone calorimeter test, the cone experiments should be considered a material value and used for comparative purposes. A UK perspective on q can found in the recent paper in Fire Technology titled: “A Review of Design Values Adopted for Heat Release Rate Per Unit Area”37 The values in ref [37] are for a particular property use. 28
Table 10 provides a q taken from the literature and summarized in ref [37]. A range of values for each property use is provide from the literature. These values are considered to be design values which are often taken at the 80-90% values for the range. Data on sets for q are often limited in such studies and may not be statistically significant to be representative of the “real world”. If this methodology is to be adopted by FENZ , then they should consider developing their own q database for postfire analysis that is developed over time and is based on their experience as it evolves. Table 9 - Heat release rate per unit area ( q ) for palletised storage38. Storage Peak HRR Height (kW/m2) Commodity (m) Wood pallets, stacked (6-12% moisture) 0.46 m 1248 Wood pallets, stacked (6-12% moisture) 1.52 3745 Wood pallets, stacked (6-12% moisture) 3.05 6810 Wood pallets, stacked (6-12% moisture) 4.88 10214 Mail bags, filled, stored 1.52 400 Cartons, compartmented 4.57 2270 PE trash barrels in CB cartons 4.57 28,900 PS foam insulation 4.21 26,000 PS jars in compartmented CB cartons 4.11 16,600 PS foam meat trays, wrapped in paper, in CB cartons 4.9 11,700 PS foam meat trays, wrapped in PVC film, in CB cartons 4.88 10,900 PVC bottles in compartmented CB cartons 4.63 8,510 PS cups in compartmented CB cartons 5.94 8,030 PS cups in compartmented CB cartons 4.42 6,580 PS tubs in CB cartons 4.17 6,440 PP tubs in compartmented CB cartons 4.26 5,870 PE botlies in compartmented CB cartons 4.2 5,330 PS toy parts in CB cartons 4.48 5,210 PE botlies in CB cartons 4.41 4,810 PS cups in compartmented CB cartons 2.9 4,420 PS cups in compartmented CB cartons 2.9 4,420 PS cups In compartmented CB cartons 2.9 4,420 CB cartons, double tri-wall, metal liner 5.99 3,260 CB cartons, double tri,wall, metal liner 4.47 2,520 Compartmented CB cartons, empty 4.51 2,470 CB cartons, double tri-wall, metal liner 4.47 2,250 CB cartons, double tri-wall, metal liner 2.95 1,680 CB cartons, double tri-wall, CB cartons, double tri-wall, metal liner 2.95 1,680 CB cartons, double tri-wall, metal liner 2.95 1,490 PU rigid foam insulation 4.57 1,320 Fiberglass (polyester)shower stall in carton 4.6 1400 PE letter trays filled, stacked on cart 1.5 8500 PE and PP film in rolls 4.1 6200 CB- cardboard, PE-Polyeythylene, PP-polypropylene, PU-polyurethane 29
You can also read