Nitrogen and Phosphorus Loads from Groundwater to Lake Spokane, Spokane, Washington, October 2016-October 2019
←
→
Page content transcription
If your browser does not render page correctly, please read the page content below
Prepared in cooperation with Stevens County Conservation District and
Spokane County Conservation District

Nitrogen and Phosphorus Loads from Groundwater to Lake
Spokane, Spokane, Washington, October 2016–October 2019

Scientific Investigations Report 2021–5023

U.S. Department of the Interior
U.S. Geological Survey
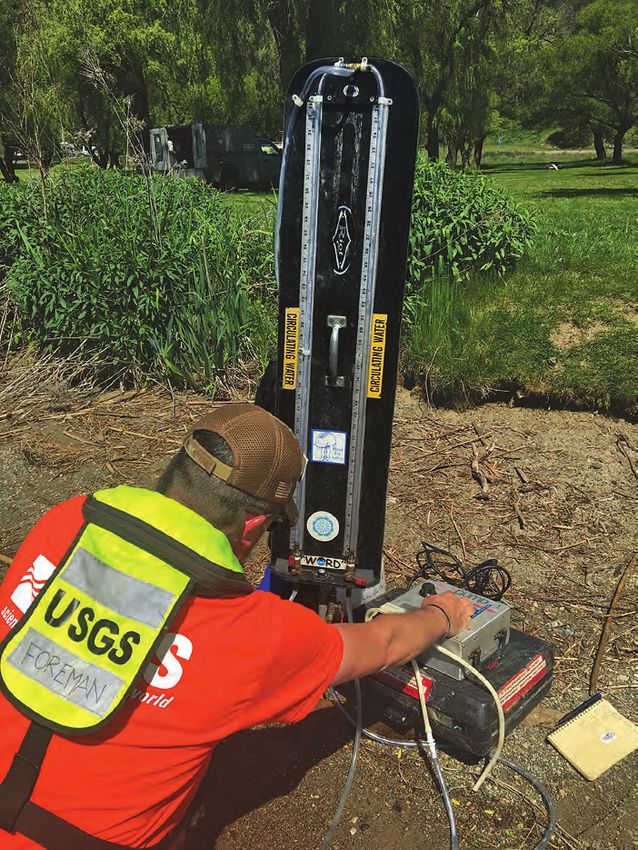
Cover: U.S Geological Survey hydrologist measuring field parameters from shallow
groundwater near Suncrest. Photograph by James Foreman, U.S Geological Survey.
Back Cover: U.S Geological Survey hydrologic technician taking a field measurement
of vertical hydraulic gradient. Photograph by Rich Sheibley, U.S Geological Survey.
Nitrogen and Phosphorus Loads from
Groundwater to Lake Spokane, Spokane,
Washington, October 2016–October 2019

By Richard W. Sheibley and James R. Foreman

Prepared in cooperation with Stevens County Conservation District and Spokane
County Conservation District

Scientific Investigations Report 2021–5023

U.S. Department of the Interior
U.S. Geological Survey
U.S. Geological Survey, Reston, Virginia: 2021

For more information on the USGS—the Federal source for science about the Earth, its natural and living resources,
natural hazards, and the environment—visit https://www.usgs.gov or call 1–888–ASK–USGS.
For an overview of USGS information products, including maps, imagery, and publications, visit
https://store.usgs.gov/.

Any use of trade, firm, or product names is for descriptive purposes only and does not imply endorsement by the U.S.
Government.
Although this information product, for the most part, is in the public domain, it also may contain copyrighted materials
as noted in the text. Permission to reproduce copyrighted items must be secured from the copyright owner.

Suggested citation:
Sheibley, R.W., and Foreman, J.R., 2021, Nitrogen and phosphorus loads from groundwater to Lake Spokane,
Spokane, Washington, October 2016–October 2019: U.S. Geological Survey Scientific Investigations Report
2021–5023, 34 p., https://doi.org/10.3133/sir20215023.

Associated data for this publication:
Foreman, J.R., and Sheibley, R.W., 2021, Water quality and seepage estimates collected at Lake Spokane,
Washington, 2016–19: U. S. Geological Survey data release, https://doi.org/10.5066/P95IQ8HH.

ISSN 2328-0328 (online)
iii
Contents
Abstract�����������������������������������������������������������������������������������������������������������������������������������������������������������1
Introduction����������������������������������������������������������������������������������������������������������������������������������������������������1
Purpose and Scope������������������������������������������������������������������������������������������������������������������������������3
Study Area���������������������������������������������������������������������������������������������������������������������������������������������3
Methods of Investigation������������������������������������������������������������������������������������������������������������������������������5
Description of Sample Locations�������������������������������������������������������������������������������������������������������5
Shallow Nearshore Groundwater Data Collection�������������������������������������������������������������������������5
Surface Water and Regional Groundwater Data Collection�������������������������������������������������������10
Estimating Groundwater Discharge in the Nearshore�����������������������������������������������������������������11
Calculating Nutrient Load from Groundwater��������������������������������������������������������������������������������11
Methods of Data Analysis�����������������������������������������������������������������������������������������������������������������13
Analysis of Data Quality������������������������������������������������������������������������������������������������������������������������������13
Results�����������������������������������������������������������������������������������������������������������������������������������������������������������16
Seasonality of Nearshore Groundwater Data�������������������������������������������������������������������������������17
Comparison of Nearshore Groundwater Data Across Site Types����������������������������������������������22
Sources of Nearshore Groundwater�����������������������������������������������������������������������������������������������25
Nearshore Groundwater Flow����������������������������������������������������������������������������������������������������������25
Nutrient Load Estimates��������������������������������������������������������������������������������������������������������������������25
Discussion�����������������������������������������������������������������������������������������������������������������������������������������������������29
Summary�������������������������������������������������������������������������������������������������������������������������������������������������������32
Acknowledgments���������������������������������������������������������������������������������������������������������������������������������������32
References Cited�����������������������������������������������������������������������������������������������������������������������������������������32
Figures
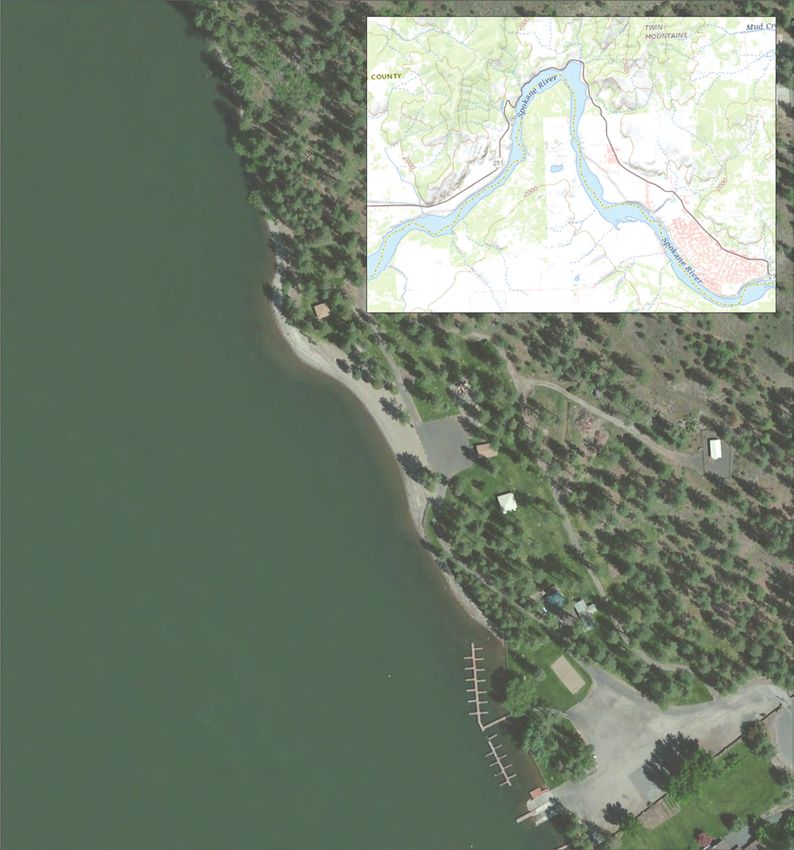
1. Map showing locations of U.S. Geological Survey streamgages used in this
study and nearby unincorporated communities of interest, Lake Spokane,
Spokane, Washington������������������������������������������������������������������������������������������������������������������2
2. Graph showing Lake Spokane surface elevation at U.S. Geological Survey
streamgage 12432500 (Long Lake at Long Lake, WA), Spokane, Washington,
October 2016–October 2019��������������������������������������������������������������������������������������������������������4
3. Maps showing locations of all sites sampled for nitrogen, phosphorus, and
other select constituents, Lake Spokane, Spokane, Washington����������������������������������������8
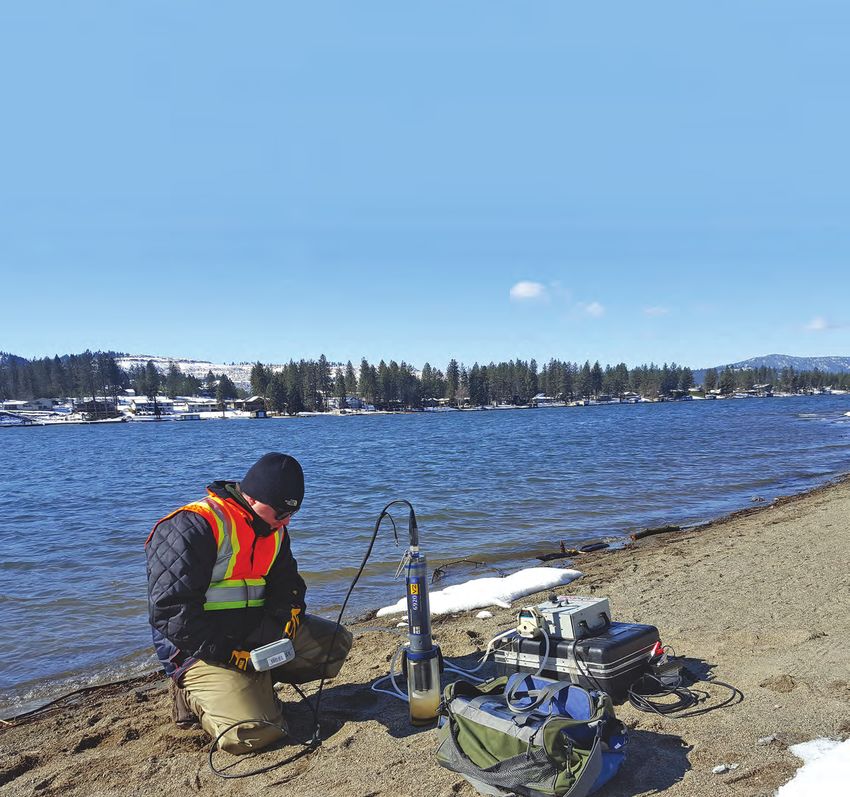
4. Photographs showing components and installation of sampler used to collect
shallow nearshore groundwater, Lake Spokane, Spokane, Washington���������������������������9
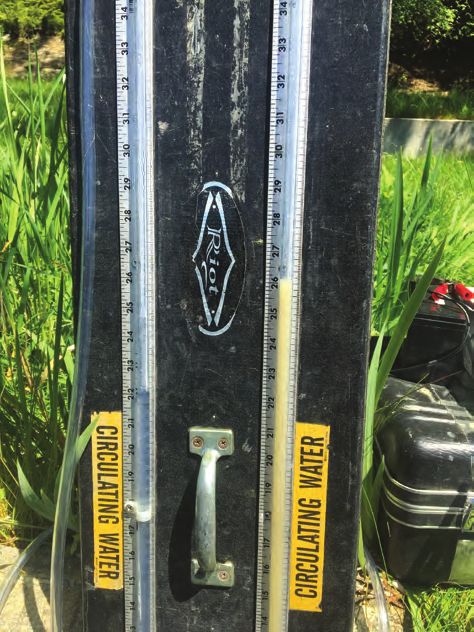
5. Diagram of a field manometer used to determine vertical hydraulic gradients in
the nearshore of Lake Spokane and photograph of manometer at a study site��������������10
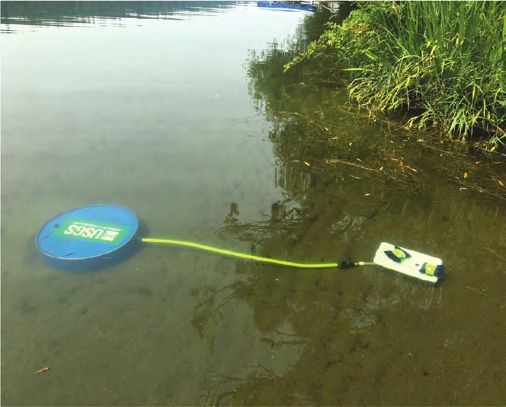
6. Cross-section and photograph of a seepage meter placed in a lake��������������������������������11
7. Map showing the 50-foot-wide buffer at the Suncrest west primary site, Lake
Spokane, Spokane, Washington����������������������������������������������������������������������������������������������12
8. Boxpolots showing seasonal variation of nitrate plus nitrite concentrations
by season across all six primary sites, Lake Spokane, Spokane, Washington,
October 2016–October 2019������������������������������������������������������������������������������������������������������19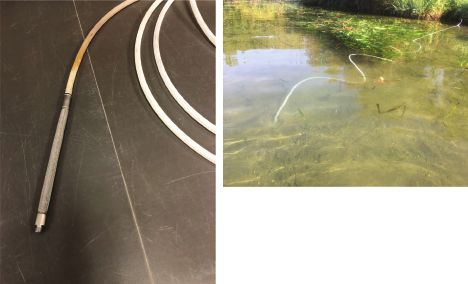
iv

         9.   Boxplots showing seasonal variation of orthophosphate concentrations by
              season across all six primary sites, Lake Spokane, Spokane, Washington,
              October 2016–October 2019������������������������������������������������������������������������������������������������������20
        10.   Seasonal variation of dissolved boron concentrations by season across all six
              primary sites, Lake Spokane, Spokane, Washington, October 2016–October 2019��������21
        11.   Boxplots showing overall comparison of nitrate plus nitrite concentrations
              across all six primary sites and Suncrest Middle and across all site groups,
              Lake Spokane, Spokane, Washington, October 2016–October 2019���������������������������������22
        12.   Boxplots showing overall comparison of orthophosphate concentrations
              across all six primary sites and Suncrest Middle and across all site groups,
              Lake Spokane, Spokane, Washington, October 2016–October 2019���������������������������������23
        13.   Overall comparison of dissolved boron concentrations across all six primary
              sites and Suncrest Middle and across all site groups, Lake Spokane, Spokane,
              Washington, October 2016–October 2019������������������������������������������������������������������������������24
        14.   Graph showng nitrogen stable isotope data for the six primary sites and middle
              Suncrest, Lake Spokane, Spokane, Washington, October 2016–October 2019���������������25
        15.   Graphs shownig nitrogen stable isotope data grouped by land use adjacent to
              samples Lake Spokane, Spokane, Washington, October 2016–October 2019�����������������26
        16.   Graphs showing seasonal comparison of nearshore groundwater flux
              determined using seepage meters at the six primary locations, Lake Spokane,
              Spokane, Washington, October 2016–October 2019�������������������������������������������������������������27
        17.   Graph showing comparison of nearshore groundwater flux determined using
              seepage meters across the six primary locations, Lake Spokane, Spokane,
              Washington, October 2016–October 2019������������������������������������������������������������������������������28
        18.   Graph showing comparison of total phosphorus and orthophosphate in
              drinking-water wells, Lake Spokane, Spokane, Washington, October 2018��������������������30

     Tables
         1.   Summary of sample sites from shallow groundwater piezometers along the
              nearshore of Lake Spokane, Spokane, Washington, October 2016–October 2019�����������6
         2.   Summary of selected constituent data in field blanks collected from
              October 2016 to October 2019 from shallow groundwater piezometers along the
              nearshore of Lake Spokane, Spokane, Washington�������������������������������������������������������������14
         3.   Summary of field replicate data for sampled constituents from October 2016 to
              October 2019 from shallow groundwater piezometers along the nearshore of
              Lake Spokane, Spokane, Washington�������������������������������������������������������������������������������������14
         4.   Summary of analysis of stable isotopes ratios from Washington State University
              stable isotope laboratory for standard reference materials for delta 15N and
              delta 18O of nitrate, Lake Spokane, Spokane, Washington��������������������������������������������������15
         5.   Summary statistics across sites for nitrate plus nitrite in milligrams of nitrogen
              per liter, Lake Spokane, Spokane, Washington, October 2016–October 2019������������������16
         6.   Summary statistics across sites for orthophosphate in milligrams of
              phosphorus per liter, October 2016–October 2019, Lake Spokane, Spokane,
              Washington����������������������������������������������������������������������������������������������������������������������������������17
         7.   Summary statistics across sites for dissolved boron in micrograms per liter,
              October 2016–October 2019������������������������������������������������������������������������������������������������������18
         8.   Summary statistics for nearshore groundwater seepage across the six primary
              sites, Lake Spokane, Spokane, Washington, October 2016–October 2019�����������������������28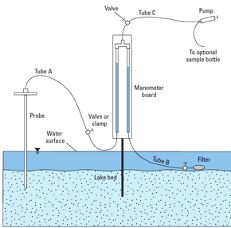
v

        9.
         Nutrient load estimates from groundwater along the north and south shores
         of Lake Spokane using the median seepage flux, Spokane, Washington,
         October 2016–October 2019������������������������������������������������������������������������������������������������������28
     10. Nutrient load estimates from groundwater along the north and south shores
         of Lake Spokane using the maximum seepage flux, Spokane, Washington,
         October 2016–October 2019������������������������������������������������������������������������������������������������������29
     11. Comparison of groundwater nutrient loads across studies, Lake Spokane,
         Spokane, Washington����������������������������������������������������������������������������������������������������������������31

Conversion Factors
U.S. customary units to International System of Units

                        Multiply                                   By                                   To obtain
                                                                  Length
 inch (in.)                                                 2.54                centimeter (cm)
 inch (in.)                                                 25.4                millimeter (mm)
 foot (ft)                                                  0.3048              meter (m)
                                                                   Area
 acre                                                       4,047               square meter (m2)
 acre                                                       0.004047            square kilometer (km2)
 square foot    (ft2)                                       0.09290             square meter (m2)
 square mile (mi2)                                          2.590               square kilometer (km2)
                                                                 Volume
 gallon (gal)                                               3.785               liter (L)
 gallon (gal)                                               0.003785            cubic meter (m3)
 cubic foot   (ft3)                                         0.02832             cubic meter (m3)
                                                                Flow rate
 acre-foot per day (acre-ft/d)                              0.01427             cubic meter per second (m3/s)
 foot per second (ft/s)                                     0.3048              meter per second (m/s)
 cubic foot per second (ft3/s)                              0.02832             cubic meter per second (m3/s)
                                                                   Mass
 ounce, avoirdupois (oz)                                    28.35               gram (g)
 pound, avoirdupois (lb)                                    0.4536              kilogram (kg)
                                                       Hydraulic conductivity
 foot per day (ft/d)                                        0.3048              meter per day (m/d)
                                                          Hydraulic gradient
 foot per mile (ft/mi)                                      0.1894              meter per kilometer (m/km)
vi
International System of Units to U.S. customary units
Multiply By To obtain
Length
centimeter (cm) 0.3937 inch (in.)
meter (m) 3.281 foot (ft)
kilometer (km) 0.6214 mile (mi)
Area
square meter (m2) 0.0002471 acre
square kilometer (km2) 247.1 acre
hectare (ha) 0.003861 square mile (mi2)
square kilometer (km2) 0.3861 square mile (mi2)
Volume
cubic meter (m3) 264.2 gallon (gal)
cubic centimeter (cm3) 0.06102 cubic inch (in3)
liter (L) 61.02 cubic inch (in3)
Flow rate
meter per second (m/s) 3.281 foot per second (ft/s)
cubic meter per second (m3/s) 35.31 cubic foot per second (ft3/s)
Mass
gram (g) 0.03527 ounce, avoirdupois (oz)
milligram ounce, avoirdupois (oz)
kilogram (kg) 2.205 pound avoirdupois (lb)
Datums
Vertical coordinate information is referenced to the North American Vertical Datum of 1988
(NAVD 88).
Horizontal coordinate information is referenced to the North American Datum of 1983 (NAD 83).
Elevation, as used in this report, refers to distance above the vertical datum.
Supplemental Information
Specific conductance is given in microsiemens per centimeter at 25 degrees Celsius
(µS/cm at 25 °C).
Concentrations of chemical constituents in water are given in either milligrams per liter
(mg/L) or micrograms per liter (µg/L).vii Abbreviations AGR agriculture site or agricultural land use DO dissolved oxygen GIS Geographic Information System LRP Lake Ridge Park LSC Lake Spokane Campground NMF Nine Mile Falls NSD nearshore developed NWIS National Water Information System QA quality assurance QC quality control RSIL Reston Stable Isotope Laboratory SCM Suncrest middle SCW Suncrest west SRM standard reference material TMDL total maximum daily load TRD terraced residential development UND undeveloped USGS U.S. Geological Survey VHG vertical hydraulic gradient WBR Willow Bay Resort WSU Washington State University
Nitrogen and Phosphorus Loads from Groundwater to
Lake Spokane, Spokane, Washington, October 2016–
October 2019

By Richard W. Sheibley and James R. Foreman

                                                                        Nutrient loads were determined from the product of
Abstract                                                          groundwater flow and a representative nutrient concentration.
                                                                  Using the median seepage flux of 1.9 ft3/s, the orthophosphate
      Shallow nearshore groundwater and estimates of ground-      load ranged from 0.7 to 3.8 pounds of phosphorus per day
water seepage were collected at 21 locations along the north      based on the median and maximum orthophosphate concentra-
and south shores of Lake Spokane beginning in October 2016        tions, respectively. For nitrate plus nitrite, loads ranged from
and ending in October 2019. Nitrate plus nitrite concentrations   5.8 to 76.6 pounds of nitrogen per day. Using the maximum
in nearshore groundwater ranged from
2 Nitrogen and Phosphorus Loads from Groundwater to Lake Spokane, Washington
117°50' 117°40' 117°30'
EXPLANATION
12426000 U.S. Geological Survey (USGS)
streamgage
Suncrest
Unincorporated communities
47°
55'
Tumtum
e
an
12433000 pok
Long Lake Dam k eS
47° La
50'
Suncrest
12426000 kane
Little Spo
Nine Mile Falls
Ri
12431500
ve
Nine Mile Dam
r
47°
45' WASHINGTON
Spokane
Study
Area
Map image is the intellectual property of Esri and is used herein under license. 0 1 2 3 4 5 MILES
Copyright © 2020 Esri and its licensors. All rights reserved.
0 1 2 3 4 5 KILOMETERS
Figure 1. U.S. Geological Survey streamgages used in this study and nearby unincorporated communities of interest, Lake Spokane,
Spokane, Washington.Introduction 3
A series of reports characterizing Lake Spokane water values of shallow groundwater orthophosphate were 44 micro-
quality were published in 1970s and 1980s, spanning a time grams of phosphours per liter (µg P/L), higher than the esti-
when advanced measures were installed at the Spokane mates used in the current DO TMDL. Gendaszek and others
wastewater-treatment plant. The reports documented a large (2016) provided some important background data on shallow
reduction of phosphorus loading from the Spokane River groundwater nutrient concentrations; however, they did not
to Lake Spokane, which resulted in an improvement in the quantify groundwater flux (flow) into the lake from the near-
trophic status of the lake (Soltero and others, 1981). Despite shore areas where these samples were collected. Additionally,
the reductions in phosphorus loading from upstream, low DO because samples were collected during a single season (spring
conditions in the lake persisted. In response, the Washington 2015), temporal variability in shallow groundwater concen-
State Department of Ecology (hereinafter “Ecology”) put Lake trations was unknown. The temporal variability in nearshore
Spokane on the 303(d) list of impaired water bodies for low groundwater nutrients was further explored by sampling a
DO levels and developed a total maximum daily load (TMDL) subset of wells from the USGS study (Gendaszek and oth-
for phosphorus in 1992. The TMDL was revised in 2010 ers, 2016) from March through August 2015 (Plastino, 2016).
because of continued algal blooms and water-quality concerns Plastino (2016) concluded that seasonal variability across the
(Moore and Ross, 2010). study (March–August) was not statistically significant.
Recently, it has been suggested that phosphorus loading This report builds on the work of Gendaszek and others
from groundwater could be more important than previously (2016) and Plastino (2016) by expanding the spatial and tem-
thought and further study of groundwater phosphorus deliv- poral scope of nutrient sampling and by including estimates
ery to the lake was warranted (GeoEngineers, Inc., 2011). of groundwater flow into the lake to calculate groundwater
Phosphorus in groundwater is partially retained by natural nutrient loads to Lake Spokane. Direct estimates of nutrient
soils and soil media beneath septic system drain-fields via loading to Lake Spokane from discharging groundwater have
sorption and may be further attenuated by sorption along not been determined to date but are needed to inform manage-
groundwater-flow paths toward the lake. However, there is a ment decisions for the reduction of sources of phosphorus to
growing concern that the retention capacity of sediments in the lake and its biota.
residential areas of Lake Spokane to bind phosphorus over
time has been exceeded, allowing phosphorus in regional
groundwater and septic system effluent to migrate greater Purpose and Scope
distances along groundwater-flow paths and potentially
The objective of this study was to improve understand-
discharge to the lake (HDR, 2007; GeoEngineers, Inc., 2009,
ing of nutrient loading by estimating the groundwater input
2010, and 2011). As a result, groundwater has been identified
of nitrogen and phosphorus to Lake Spokane, measure the
as a potential and possibly substantial source of phosphorus
concentration of these nutrients in shallow groundwater near
to Lake Spokane based on the coarse sediments (low sorption
the lakeshore, and estimate groundwater discharge (seepage)
capacity) in the area and the high density of septic system use
fluxes. Groundwater nutrient concentrations and seepage flux
in some areas.
estimates were measured quarterly for 2 years to estimate
Soltero and others (1992) calculated some of the first
seasonal variations in nutrient loading along the north shore
estimates of groundwater phosphorus delivery to the lake
of Lake Spokane. This work was followed by a smaller-
and showed it comprised 1–5 percent of the annual load-
scale study on the south side of the lake where groundwater
ing to the lake with a range in soluble reactive phosphorus
sampling and discharge estimates were made in summer and
concentrations in nearby wells from 6 to 650 micrograms per
autumn 2019.
liter (µg/L). Ecology used estimates of regional groundwa-
ter phosphorus concentrations to derive their groundwater
allocation for total phosphorus of 25 µg/L to the lake for their Study Area
DO TMDL model (Moore and Ross, 2010). To date, the only
detailed study of shallow groundwater nutrient chemistry at The impoundment of the Spokane River at Long Lake
Lake Spokane was completed by the U.S. Geological Survey Dam forms a 24-mile-long, 5,000-acre reservoir called Lake
(USGS) in 2015 (Gendaszek and others, 2016). In that study Spokane (also known as Long Lake) with 243,000 acre-feet of
by Gendaszek and others, shallow groundwater was sampled water and 54 mi of shoreline (fig. 1). Above Nine Mile Dam,
in March and April 2015 from 30 piezometers driven into the which is immediately upstream of Lake Spokane, the Spokane
nearshore (“nearshore” was defined as the area within 50 feet River drains 5,220 square miles of northeastern Washington
of shore) of Lake Spokane and focused around the Suncrest and northern Idaho including the cities of Spokane and Coeur
residential area on the north shore. Nitrate plus nitrite concen- d’Alene, Idaho. Mean monthly discharge into Lake Spokane
trations in groundwater downgradient of undeveloped areas from water year 1947 to 2019 at the Spokane River below
were significantly lower than those measured downgradient of Nine Mile Dam at Spokane, Washington (USGS streamgage
both nearshore and terrace residential development. However, station 12426000), ranged from a high of 26,600 cubic feet
orthophosphate concentrations in groundwater were not sig- per second (ft3/s) in May during snowmelt to a low of 1,200
nificantly different with respect to upgradient land use. Median ft3/s in August during summer baseflow. Several unregulated4 Nitrogen and Phosphorus Loads from Groundwater to Lake Spokane, Washington
1,538
EXPLANATION
Lake elevation above the National Geodetic Vertical Datum of 1929, in feet
Lake elevation
1,536 Sample dates
1,534
1,532
1,530
1,528
1,526
1,524
1,522
1,520
09/27/2016 04/15/2017 11/01/2017 05/20/2018 12/06/2018 06/24/2019
Figure 2. Lake Spokane surface elevation at U.S. Geological Survey streamgage 12432500 (Long Lake at Long Lake,
WA), Spokane, Washington, October 2016–October 2019. Individual points represent days that shallow groundwater and
groundwater flux were measured.
tributaries flow into Lake Spokane, the largest of which is is shallowest at the outlet of Nine Mile Dam and is deeper
the Little Spokane River, which enters Lake Spokane about 2 towards Long Lake Dam, where maximum water depths
miles downstream of Nine Mile Dam. Mean monthly dis- approach 180 ft. For the study summarized in this report, most
charge from water years 1947 to 2019 at the Little Spokane sample events took place when the lake was near the maxi-
River near Dartford, Washington (USGS streamgage station mum stage (fig. 2).
12431500), ranged from 1,050 ft3/s in May to a low of 382 The predominant land covers surrounding Lake Spokane
ft3/s in August and September. Discharge of the Spokane River are undeveloped ponderosa pine (Pinus ponderosa) forest,
is regulated at Long Lake Dam, which was completed in 1915 farmland, and rural residential development within the three
for hydroelectric power generation by Avista Utilities. From unincorporated communities of Nine Mile Falls, Suncrest, and
water years 1938 to 2019, mean monthly discharge of the TumTum (fig. 1), Washington. Residential development near
Spokane River at Long Lake, Washington (USGS streamgage Lake Spokane occurs along the shoreline of Lake Spokane and
12433000) ranged from a high of 18,700 ft3/s in May to a low on 300-foot-high terraces created during large outburst floods
of 1,760 ft3/s in August. of Glacial Lake Missoula at the end of the Pleistocene Epoch.
The pool elevation of Lake Spokane is held at approxi- The resulting aquifer is low in fine-grained sediment, which
mately 1,535 feet (ft) above mean sea level for most of the can result in less sorption of phosphorus during groundwater
year except for short periods of winter drawdown intended transport to the lake. Sewage from houses and businesses is
to increase storage capacity during the wet season and to typically managed by on-site septic systems throughout the
manage pervasive aquatic plants by exposing them to freez- area surrounding Lake Spokane.
ing conditions in shallow margins of the lake. Lake SpokaneMethods of Investigation 5
Methods of Investigation of the summer resort and downgradient of the resort’s rest-
room and shower facility. Suncrest west (SCW) was sampled
Field data were collected in two phases beginning in along the swimming beach and east towards the boat launch of
October 2016 and ending in October 2019. During phase Suncrest Park, a private park available exclusively to Suncrest
one, shallow nearshore groundwater and estimates of ground- residents The site was characterized by high summer use and
water discharge were collected along the north shore of located near the restroom upgradient of the swimming beach.
Lake Spokane in Stevens County. Sampling during phase Although this site was actively used during the study, the
one took place quarterly for 2 years (November 2016 to residential development upgradient of the park was consid-
September 2018). During phase two, a smaller-scale field ered low density. Lake Ridge Park (LRP) was a private park
data collection effort took place focused on the south shore of located at the eastern end of the unincorporated community
the lake in Spokane County. Sampling of shallow nearshore of Suncrest. Sampling took place along the swimming beach
groundwater and discharge in phase two took place two times, and the vicinity of their boat docks. Upgradient of LRP, land
once in August 2019 and once in October 2019. use was high-density residential. On the south side of the lake,
nearshore sampling took place from Nine Mile Falls camp-
ground (NMF) along the swimming beach and picnic area and
Description of Sample Locations a site adjacent to an irrigated agricultural field (AGR).
In order to compare data across sites with similar land
Groundwater samples were collected from shallow (less use, each of the primary and secondary sites were classified
than 1-meter below the lakebed), temporary piezometers into agricultural land (AGR), NSD, and terraced residential
installed within 50 ft of the lake shoreline. During phase one, development (TRD) groups. The TRD sites, first described by
20–30 samples of shallow nearshore groundwater were col- Gendaszek and others (2016), were located along the lake and
lected quarterly from autumn 2016 until autumn 2018 from 15 below high terraces where residential dwellings were located.
sites the north shore. For phase two, 10–15 nearshore ground- In addition to the nearshore sample locations, surface
water samples were collected in August and October 2019 water (lake) samples were collected at each primary site
from 6 sites the south shore. Sample locations were chosen to during each visit, and a one-time sample of 15 nearby drink-
span a range of upland land uses, from higher-density, near- ing water wells was collected. This allowed for comparisons
shore residential sites to sites adjacent to agricultural fields to between nearshore groundwater, deep regional groundwater,
sites in undeveloped areas. and the lake.
Primary sites and secondary sites were sampled in this
study. Primary sites were areas where both shallow ground-
water samples were collected and groundwater seepage was Shallow Nearshore Groundwater Data
measured using manual seepage meters. Secondary sites were Collection
locations where just shallow groundwater was collected. At
the primary sites, three to five groundwater samples were col- Samples were taken with piezometers, which consisted of
lected within 100 ft of each other along the shoreline, whereas 5- to 6-foot-long rigid lengths of polypropylene tubing with a
the secondary sites only included a single point sample. This 6-inch-long sample tips made of a rigid stainless steel screen
approach provided estimates of site variability in groundwater (0.0057-inch [in.] mesh) (fig. 4a). At each sample location, a
chemistry at the primary locations where seepage numbers solid steel three-fourth-in. diameter rod was hammered into
were measured, whereas the secondary sites allowed a greater the lakebed to make a pilot hole for the sampler. A 3-foot-
spatial coverage of the nearshore to be characterized. In total, long section of hollow three-fourth-in. diameter pipe with a
6 primary sites and 15 secondary sites were sampled for this loose-fitted bolt on one end was inserted into the pilot hole.
project (fig. 3; table 1). This hollow pipe was then tapped into the lakebed until it was
The six primary sites spanned a range of land use adja- secure (typically about 2–3 ft below the lakebed). Once in
cent to their nearshore sampling locations: one non-irrigated place, the sample tube with attached sample tip was inserted
undeveloped site (UND), one irrigated agricultural site (AGR), into the hollow section of pipe and the pipe was removed,
and four nearshore developed sites (NSD) that included both leaving the sampler in place in the lakebed and the bolt left in
year-round occupancy and summertime-only use. The Lake the subsurface and not recovered. A section of the sample tub-
Spokane Campground (LSC) site was just east of the swim- ing remained above the surface of the lake in order to extract
ming beach surrounded by undeveloped land upgradient of the the shallow groundwater sample (fig. 4b).
study area. Willow Bay Resort (WBR) was located within the
camping area of the recreational vehicle and tent camping areaTable 1. Summary of sample sites from shallow groundwater piezometers along the nearshore of Lake Spokane, Spokane, Washington, October 2016–October 2019.
[Abbreviations: AGR, agricultural site; LRP, Lake Ridge Park; LSC, Lake Spokane Campground; NMF, Nine Mile Falls; WBR, Willow Bay Resort; NSD, Nearshore Developed; TRD, terraced residential
development; UND, undeveloped; SCW, Suncrest west; SCM, suncrest middle; USGS, U.S. Geological Survey]
Site
USGS station no. USGS station name Site type Short name Shore Sample medium
group
474944117374401 TEMP PIEZO NR NW SHORE RD Primary AGR AGR South Shallow, nearshore groundwater
474755117351801 TEMP PIEZO NR LAKE RIDGE PARK Primary NSD LRP North Shallow, nearshore groundwater
475004117453001 TEMP PIEZO NR LK SPOKANE CAMPGROUND Primary UND LSC North Shallow, nearshore groundwater
475259117410101 SOUTH SHORE TEMP PIEZO MCA001 Secondary UND MCA001 South Shallow, nearshore groundwater
475301117405201 SOUTH SHORE TEMP PIEZO MCA002 Secondary UND MCA002 South Shallow, nearshore groundwater
475311117401901 SOUTH SHORE TEMP PIEZO MCA003 Secondary UND MCA003 South Shallow, nearshore groundwater
475257117400501 SOUTH SHORE TEMP PIEZO MCA004 Secondary UND MCA004 South Shallow, nearshore groundwater
474736117340701 TEMP PIEZO NR NINE MILE FALLS Primary NSD NMF South Shallow, nearshore groundwater
475215117394901 NORTH SHORE TEMP PIEZO NS001 Secondary TRD NS001 North Shallow, nearshore groundwater
475010117380302 NORTH SHORE TEMP PIEZO NS002 Secondary TRD NS002 North Shallow, nearshore groundwater
474959117373402 NORTH SHORE TEMP PIEZO NS003 Secondary TRD NS003 North Shallow, nearshore groundwater
474947117371501 NORTH SHORE TEMP PIEZO NS004 Secondary TRD NS004 North Shallow, nearshore groundwater
474933117365901 NORTH SHORE TEMP PIEZO NS005 Secondary TRD NS005 North Shallow, nearshore groundwater
474806117353901 TEMP PIEZO MIDDLE SUNCREST Secondary NSD SCM North Shallow, nearshore groundwater
474852117363001 TEMP PIEZO NR SUNCREST PARK Primary NSD SCW North Shallow, nearshore groundwater
474806117335501 NORTH SHORE TEMP PIEZO TRD01 Secondary TRD TRD04 North Shallow, nearshore groundwater
474800117341401 NORTH SHORE TEMP PIEZO TRD02 Secondary TRD TRD03 North Shallow, nearshore groundwater
474750117342501 NORTH SHORE TEMP PIEZO TRD03 Secondary TRD TRD02 North Shallow, nearshore groundwater
474747117344701 NORTH SHORE TEMP PIEZO TRD04 Secondary TRD TRD01 North Shallow, nearshore groundwater
6 Nitrogen and Phosphorus Loads from Groundwater to Lake Spokane, Washington
475338117395301 TEMP PIEZO EAST TUM TUM Secondary NSD TUM North Shallow, nearshore groundwater
475252117393201 TEMP PIEZO NR WILLOW BAY Primary NSD WBR North Shallow, nearshore groundwater
474740117322501 27N/42E-31H03 Well Well 31H03 South Deep, regional groundwater
474740117362801 27N/42E-31H04 Well Well 31H04 South Deep, regional groundwater
474746117313001 27N/42E-32G01 Well Well 32G01 North Deep, regional groundwater
474802117350701 27N/41E-35A01 Well Well 35A01 North Deep, regional groundwater
474811117353601 27N/41E-26Q02 Well Well 26Q02 North Deep, regional groundwater
474821117354401 27N/41E-26L01 Well Well 26L01 North Deep, regional groundwater
474823117353201 27N/41E-26K01 Well Well 26K01 North Deep, regional groundwater
474828117372001 27N/41E-27M01 Well Well 27M01 South Deep, regional groundwater
474836117365801 27N/41E-27F01 Well Well 27F01 South Deep, regional groundwater
474855117362001 27N/41E-27A01 Well Well 27A01 North Deep, regional groundwaterTable 1. Summary of sample sites from shallow groundwater piezometers along the nearshore of Lake Spokane, Spokane, Washington, October 2016–October 2019.—
Continued
[Abbreviations: AGR, agricultural site; LRP, Lake Ridge Park; LSC, Lake Spokane Campground; NMF, Nine Mile Falls; WBR, Willow Bay Resort; NSD, Nearshore Developed; TRD, terraced residential
development; UND, undeveloped; SCW, Suncrest west; SCM, suncrest middle; USGS, U.S. Geological Survey]
Site
USGS station no. USGS station name Site type Short name Shore Sample medium
group
474906117362201 27N/41E-22R01 Well Well 22R01 North Deep, regional groundwater
475018117383201 27N/41E-16M01 Well Well 16M01 North Deep, regional groundwater
475051117385601 27N/41E-08R02 Well Well 08R02 North Deep, regional groundwater
475118117403501 27N/41E-07G01 Well Well 07G01 South Deep, regional groundwater
475128117394301 27N/41E-08C01 Well Well 08C01 North Deep, regional groundwater
475252117393200 LK SPOKANE NR WILLOW BAY Lake Lake WBR Lake North Surface water
474755117351800 LK SPOKANE NR LAKE RIDGE PARK Lake Lake LRP Lake North Surface water
475004117453000 LK SPOKANE NR LK SPOKANE CAMPGROUND Lake Lake LSC Lake North Surface water
474852117363000 LK SPOKANE NR SUNCREST PARK Lake Lake SCW Lake North Surface water
474944117374400 LK SPOKANE NR NW SHORE RD Lake Lake AGR Lake South Surface water
474736117340700 LK SPOKANE NR NINE MILE FALLS Lake Lake NMF Lake South Surface water
Methods of Investigation 78 Nitrogen and Phosphorus Loads from Groundwater to Lake Spokane, Washington
117°50' 117°40' 117°30'
A Tumtum
" TUM EXPLANATION
Site type
MCA002 MCA003 WBR Primary
MCA001 NS001 Secondary
MCA004 WBR
NS001
NS002
NS003
LSC NS004
47° ke
La kane AGR NS005
50' p o
S
SCW Suncrest
TRD02
" TRD01
SCM
TRD03
LRP
TRD04
NMF
Nine Mile Falls "
117°50' 117°40' 117°30'
Tumtum
B " EXPLANATION
Site type
WBR Lake WBR Lake Lake
08C01 Well
08C01
07G01
08R02
16M01
LSC Lake AGR Lake
47° ke
La kane
50' o
Sp 22R01
SCW Lake 27A01
27F01 Suncrest
26L01 26K01
"
27M01 26Q02 35A01 32G01
LRP Lake 31H04
31H03
NMF Lake
Nine Mile Falls
"
Map image is the intellectual property of Esri and is used herein under license. 0 1 2 3 4 5 MILES
Copyright © 2020 Esri and its licensors. All rights reserved.
0 1 2 3 4 5 KILOMETERS
Figure 3. Locations of all sites sampled for nitrogen, phosphorus, and other select constituents, Lake Spokane, Spokane, Washington.
(A) Primary and secondary sites, sampled approximately quarterly from October 2016 to October 2019. (B) Lake and well sample
locations; lake sites were sampled during each site visit, and well sites were sampled a single time in October 2019.Methods of Investigation 9
A B
Figure 4. Components and installation of sampler used to collect shallow nearshore groundwater, Lake Spokane, Spokane,
Washington. (A) Polypropylene tubing with stainless steel sample tip. (B) Final installation of the sample tip in the lakebed
with sample tubing sticking out of the lakebed and towards the shore for pumping. All photos taken by Rich Sheibley, U.S.
Geological Survey.
After installation, water was pumped out of the sample moves conservatively during transport in groundwater (Bussey
piezometer at a slow rate (less than 100 milliliters per min- and Walter, 1996; Senior and Cinotto, 2007). Therefore, high
ute) to minimize air bubbles in the line and to ensure sample values of dissolved boron (usually greater than 1520 µg/L;
water was being collected from the vicinity of the screened Senior and Cinotto, 2007) imply that the water being sampled
sample tip and not being drawn down from the lake surface. is from a household source. Additionally, the relative abun-
Field readings of temperature, DO, pH, and specific conduc- dance of 15N and 18O of the nitrate ion can indicate the general
tivity of the shallow groundwater were determined using a source of water being collected. The ratio of nitrogen isotopes
field multimeter (YSI EXO2 or InSitu Aqua Troll 600) with 15N to 14N is commonly expressed as δ15N (delta nitrogen-15)
a flow-through chamber. Field parameters were recorded and reported in units of parts per thousand, or per mil (‰).
after at least three well volumes were removed and readings Mathematically, δ15N = [(Rsample – Rreference)/Rreference]
had stabilized. Field parameters were used to ensure that the × 1,000, where R is 15N/14N and reference is atmospheric N2
water being sampled was not lake water because lake water (Sulzman, 2007). For δ 18O, the same formula holds, but R
and groundwater typically unique values of DO and specific is 18O/16O and reference is from the Vienna Standard Mean
conductance. After recording field parameters, samples for dis- Ocean Water (Sulzman, 2007). The source of nitrate in water
solved nutrients were collected by filtering the water through can be determined by plotting δ 18O and δ 15N of the nitrate
a 0.45-micron disk filter. All bottles were triple rinsed with ion against each other and comparing the data to published
filtrate before sample collection. Nutrient parameters included rages of these isotope ratios from sources such as the atmo-
ammonia (NH3), as N; nitrite (NO2), as N; nitrite plus nitrate sphere, precipitation, soils, fertilizers, and human and ani-
(NO2+NO3), as N; and orthophosphate (PO4), as P. mal wastes (Kendall, 1998). Generally, this is an empirical
To identify the source of nutrients in the water being approach, and if data fall within one of these known source
collected, samples were also analyzed for dissolved boron “boxes,” the water probably originated from that source.
and stable isotope ratios of nitrogen and oxygen of nitrate ion.
Boron indicates the presence of washing detergent, which10 Nitrogen and Phosphorus Loads from Groundwater to Lake Spokane, Washington
Samples for nutrients and boron were sent on ice over-
night to the USGS National Water Quality Lab in Lakewood, A
Colorado, and nitrate isotope samples were shipped frozen
to the Washington State University (WSU) stable isotope
lab in Pullman, Washington; all laboratory analysis followed
standard procedures (Fishman, 1993; Patton and Kryskalla,
2011; Coplen and others, 2012). During each sample trip, at
least one field replicate and one field blank were collected to
assess data quality and variability of the data by sampling for
all parameters measured at the laboratory.
After collecting water-quality samples, an estimate of
vertical hydraulic gradient (VHG) was determined using a
field manometer (fig. 5) following the procedures of LaBaugh
and Rosenberry (2008). The VHG provides an estimate of the
potential direction and magnitude of groundwater flow in the
vicinity of the well screen where the samples were collected.
A positive value of VHG indicates that the head pressure is
greater at depth than in the surface and that vertical flow direc-
tion is from the subsurface into the lake. A negative value for
VHG indicates that the head pressure is lower at depth and
that vertical flow direction is from the lake to the subsurface.
A neutral VHG indicates that there is no vertical flow in the B
vicinity of the well screen.
To estimate the VHG, the groundwater sample tubing was
connected to one side of the manometer board, and the other
side of the manometer was connected to tubing submersed in
the lake. Water was drawn into the manometer from each side
using a field peristaltic pump to remove air bubbles and sealed
to allow the groundwater and lake to come to equilibrium with
each other (fig. 5). A single VHG estimate would last from 5
to 30 minutes with several measurements of head difference Groundwater
recorded until the system came to equilibrium.
Surface Water and Regional Groundwater Data
Collection Lake water
A limited set of surface water and regional groundwater
samples were collected during the study in order to compare
shallow groundwater chemistry to lake chemistry and nearby
drinking water wells. Surface water samples were collected
from each primary sample site each site visit. Lake water
was collected directly from the surface using a field peristal-
tic pump and analyzed for nutrients, boron, and 15N and 18O
isotope ratios, following the same procedures as the shal-
low groundwater samples. A one-time sample of 15 regional
drinking water wells was conducted near the end of the study.
Wells were sampled using standard USGS protocols (Kozar Figure 5. (A) Diagram of a field manometer used to
and Kahle, 2013; U.S. Geological Survey, 2006) and analyzed determine vertical hydraulic gradients in the nearshore of
for dissolved nutrients, total phosphorus, and 15N and 18O Lake Spokane (from LaBaugh and Rosenberry, 2008) and
isotope ratios. (B) photograph of manometer at a study site. Photograph by
Rich Sheibley, U.S. Geological Survey.Methods of Investigation 11
Estimating Groundwater Discharge in the and others (2008) and Sheibley and others (2014). Briefly, a
50-foot-wide buffer area was delineated along the entire length
Nearshore
of the north and south shore of the lake by copying the shore-
At primary sample sites, groundwater seepage rates (flux) line shapefile and offsetting it into the lake by 50 ft (fig. 7).
were determined using manual seepage meters (Rosenberry This buffer was extended along the entire north and south
and LaBaugh, 2008). Seepage meters are devices that isolate shore but did not include either of the dams. Multiple widths
a small area of the lakebed and measure the flow of water were used to determine the most representative distance from
across that area (fig. 6). A known volume of water is put into the shoreline by comparing the shaded buffer area to aerial
a flexible volume capture bag, which is housed in a small images of the primary sample locations. From this process, it
plastic container to minimize errors from wind and waves. was determined that a 50-foot-wide buffer was most inclusive
This capture bag is attached to the end of a 6-ft-long section of of all the locations sampled for this project. Furthermore,
garden hose that is attached to the seepage meter and a valve groundwater seepage primarily occurs near the shoreline and
opened to begin recording seepage rates. By keeping the col- tends to decrease with distance from shoreline (McBride and
lection bag in a plastic container and away from the seepage Pfannkuch, 1975; Pfannkuch and Winter, 1984), so maintain-
meter, errors from wave action and people walking too close ing a 50-foot buffer of the shoreline was warranted.
to the seepage meter are reduced (Rosenberry and others,
2020). The volume capture bag is left to sit for the collection
time (15 minutes to 2 hours) and a final volume recorded. The
change in volume over time is calculated and represents the
net groundwater flux across the sediment-water interface. At
A
each primary site, three to five seepage meters were installed
and measured to assess site variability in groundwater flux
during each site visit.
Seepage meters underestimate the actual flux across the
sediment-water interface due to frictional flow loss within
the meter, restrictions of flow through fittings, resistance
from movement of the capture bags, and from people walk-
ing nearby (Rosenberry and LaBaugh, 2008). As a result, a
correction factor can be applied to the measured seepage flux
to better approximate actual flow conditions. For this study,
we used a correction factor of 1.05, which was determined
by Rosenberry (2005) for the same seepage meter setup that
we used. Namely, a thin-walled capture bag, large-diameter
tubing and fittings, extended-length hoses that minimize
the presence of people walking nearby, and a capture-bag B
enclosure that reduces pressure waves from the surrounding
water. All the original and corrected seepage flux data for this
project is provided in a companion data release (Foreman and
Sheibley, 2021).
Calculating Nutrient Load from Groundwater
Nutrient loads (measured in mass per time) were deter-
mined by multiplying the measured nutrient concentration
and estimated groundwater seepage flux at each primary site.
These site-level loads were scaled up using a representative
area of groundwater discharge to determine areal nutrient
fluxes along the length of Lake Spokane using geographi-
cal information system (GIS) methods similar to Simonds
Figure 6. (A) Cross-section (from Rosenberry and LaBaugh,
2008) and (B) photograph of a seepage meter placed in a lake.
Photograph by Rich Sheibley, U.S. Geological Survey.12 Nitrogen and Phosphorus Loads from Groundwater to Lake Spokane, Washington
117°36'40" 117°36'32" 117°36'24"
117°40'
Tumtum
"
e)
ak
ngL
o
47° e (L
47° an
49' ok
50' Sp
La k SCW
e
! Suncrest
"
La
ke
Spo
kan
e(
Lo
ng
La
!
ke)
SCW
47°
48'
55"
SUNCREST PARK
47° EXPLANATION
48'
50" 50-foot shoreline buffer area
SCW Primary site
Map image is the intellectual property of Esri and is used herein under license. 0 3 6 MILES
Copyright © 2020 Esri and its licensors. All rights reserved.
0 3 6 KILOMETERS
Figure 7. Shaded area showing the 50-foot-wide buffer at the Suncrest west (SCW) primary site, Lake Spokane, Spokane, Washington.
Inset map shows the buffer (thin blue line) along the entire lake.Analysis of Data Quality 13
Methods of Data Analysis methods followed standard procedures for the analysis of
nutrients, boron, and nitrate isotopes (Fishman and others,
Nutrient and seepage flux data were compared across 1993; Patton and Kryskalla, 2011; Coplen and others, 2012).
seasons, site types (primary, secondary, lake, and well), and Quality-control samples taken to assess possible contami-
site groups (UND, NSD, TRD, AGR, Lake, and Well) using a nation and bias and to assess the variability during collection
non-parametric Kruskal-Wallis test for the analysis of variance of field samples was measured using field blanks, field repli-
across each treatment. These comparisons were combined with cates, and standard reference materials. Blanks are samples
a post hoc Friedman’s least significant difference test to test prepared with water that is free of measurable concentra-
what treatment categories were statistically different from each tions of the analytes that will be analyzed by the laboratory.
other (at a p-value of 0.05). The same statistical tests were They are used to measure bias caused by contamination, the
used to determine if the direction of the vertical hydraulic gra- unintentional introduction of target analyte into the sample.
dient (VHG) from field manometer measurements influenced Field blanks are done in the field and are used to assess pos-
nutrient concentrations. All statistical analysis was performed sible contamination from sources through the whole process
using R (version 3.6.1) and RStudio (version 1.2.1335). of sample collection, processing, shipping, and laboratory
analysis. Field blanks were collected during each sample trip
for this study using lab-certified inorganic blank water sourced
from the USGS National Water Quality Laboratory. For each
Analysis of Data Quality field blank, the same sampling setup (rigid tubing with screen
mesh sample tip) that was used in the shallow piezometers
When evaluating the data quality of a project, there are was inserted into a freshly opened bottle of blank water and
three aspects to consider: (1) quality assurance (QA) elements, pumped through the tubing filtered and processed identical to
(2) quality control (QC) data, and (3) overall quality assess- environmental samples. A total of eight field blanks were col-
ment (Mueller and others, 2015). The QA elements refer to the lected for dissolved constituents over the course of this project
procedures used to sample; for example, sampling the correct (table 2), and not a single detection was recorded. This gives
time and place, using established collection and analysis meth- a high degree of confidence that contamination is less than the
ods, and using the proper equipment for the samples being reporting levels and that all parameter detections in environ-
collected. The QC data are those generated from the collec- mental samples are free of contamination bias.
tion and analysis of QC samples (blanks, replicates, reference Field replicates were also collected approximately once
materials) used to assess the error and variability of collected per field visit for a total of sevent to eight replicates analyzed
samples. Lastly, quality assessment is the overall evaluation of for each parameter throughout the project. A field replicate is a
data quality based on the QA and QC elements of the project. set of two samples that are collected, processed, and analyzed
Quality assurance was achieved by following established such that they are considered to be the same sample and to
USGS protocols for the preparation, collection, and process- measure the variability of the whole sample collection and
ing of samples for water-quality investigations published analysis life cycle. Field replicates collected for this project
in the National Field Manual (U.S. Geological Survey, were sequential replicates, meaning they were collected one
2018). Additionally, procedures in the QA plan of the USGS after another and therefore included sources of variability
Washington Water Science Center were followed (Conn and from sample collection and processing as well as any possible
others, 2017). Conn and others (2017) outline details for proj- temporal changes in the shallow groundwater environment
ect management, periodic project reviews, data management (Mueller and others, 2015). A statistical evaluation of replicate
and archiving, as well as methods for collecting and analyzing variability was determined based on the standard deviation of
water-quality samples. For non-routine sample data collection, replicate pairs. For each replicate pair, the standard deviation
previously established methods were followed for the col- was determined, and an average value for each parameter over
lection of shallow groundwater using temporary piezometers the duration of the project was calculated. This average stan-
(Simonds and others, 2008; Moran and others, 2012; Sheibley dard deviation was then used to determine an upper and lower
and others, 2014) and methods for determining groundwa- confidence limit based on methods of Mueller and others
ter flux through the sediment water interface using seepage (2015). The 90th percentile confidence interval for all param-
meters (Rosenberry and LaBaugh, 2008). Lastly, all laboratory eters was low, indicating an overall low amount of variability
in the environmental data that was collected (table 3).14 Nitrogen and Phosphorus Loads from Groundwater to Lake Spokane, Washington
Table 2. Summary of selected constituent data in field blanks collected from October 2016 to October 2019 from shallow groundwater
piezometers along the nearshore of Lake Spokane, Spokane, Washington.
[Abbreviations: mg/L, milligrams per liter; N, nitrogen; P, phosphorus; ug/L, micrograms per liter]
Number of Number of Percent of
Constituent Units Reporting level
field blanks quantified values detections
Ammonia as N mg/L 0.01 8 0 0
Nitrate plus Nitrite as N mg/L 0.04 8 0 0
Nitrite as N mg/L 0.001 8 0 0
Orthophosphate as P mg/L 0.004 8 0 0
Boron ug/L 2 8 0 0
Table 3. Summary of field replicate data for sampled constituents from October 2016 to October 2019 from shallow groundwater
piezometers along the nearshore of Lake Spokane, Spokane, Washington.
[Abbreviations: mg/L, milligrams per liter; N, nitrogen; P, phosphours; per mil, parts per thousand relative to known standard; ug/L, micrograms per liter]
Number of Range of replicate 90th percentile confidence
Units
replicates concertation interval
Ammonia as N mg/L 8Analysis of Data Quality 15
Table 4. Summary of analysis of stable isotopes ratios from Washington State University stable isotope laboratory for
standard reference materials for delta 15N and delta 18O of nitrate, Lake Spokane, Spokane, Washington.
[Values for 15N and 18O for USGS34 are 1.8 per mil and 27.8 per mil, respectively. Values for 15N and 18O for USGS35 are 2.7 per mil and
57.5 per mil, respectively. Abbreviations: mg/L as N, milligrams per liter as nitrogen; δ, delta]
Expected nitrate
Reference material δ N15 δO18
Analysis date concentration
identifier (per mil) (per mil)
(mg/L as N)
USGS34 July 2017 0.5 -2.57 -28.57
USGS34 July 2017 0.5 -2.63 -28.66
USGS34 July 2017 0.5 -2.64 -28.77
USGS34 July 2017 1.0 -2.72 -29.19
USGS34 July 2017 1.0 -2.79 -29.37
USGS34 July 2017 1.0 -2.78 -28.82
USGS34 July 2017 2.0 -2.63 -29.62
USGS34 July 2017 2.0 -2.61 -29.62
USGS34 July 2017 2.0 -2.76 -29.64
Average -2.68 -29.14
Standard deviation 0.08 0.44
USGS34 January 2020 0.5 -3.56 -28.58
USGS34 January 2020 0.5 -3.15 -28.18
USGS34 January 2020 0.5 -3.17 -28.22
USGS34 January 2020 2 -3.08 -29.63
USGS34 January 2020 2 -2.71 -29.62
USGS34 January 2020 2 -3.24 -29.19
Average -3.15 -28.90
Standard deviation 0.27 0.67
USGS35 January 2020 0.5 2.63 56.36
USGS35 January 2020 0.5 2.61 56.5
USGS35 January 2020 0.5 2.62 56.52
USGS35 January 2020 2 2.56 56.79
USGS35 January 2020 2 2.58 56.62
USGS35 January 2020 2 2.63 56.67
Average 2.61 56.58
Standard deviation 0.03 0.15
Reston Stable Isotope Laboratory results
USGS34 January 2020 0.5 -1.91 -28.03
USGS35 January 2020 0.5 3.7 57.5816 Nitrogen and Phosphorus Loads from Groundwater to Lake Spokane, Washington
Results of ammonia, which showed up below the laboratory reporting
limit of 0.01 milligrams of nitrogen per liter in 73 percent of
All original data (field parameters, nutrients, boron, and samples. Therefore, ammonia data are not discussed further in
nitrate isotopes) are stored in the National Water Information this report. A total of 96 independent measurements of vertical
System (NWIS) database (U.S. Geological Survey, 2021). The hydraulic gradient (VHG) were determined in this study. Of
final dataset, which includes all water-quality data, seepage these, 62 had positive values indicating upwelling of ground-
meter measurements, and values of VHG used in this report, water, 27 had negative values indicating downwelling, and 7
is available as a companion data release in ScienceBase were neutral. There was no significant difference in median
(Foreman and Sheibley, 2021). values for nitrite, orthophosphate, and boron when compared
Overall, a total of 197 samples were collected for this across the direction of the VHG measurement. Therefore, all
project across 21 different nearshore groundwater loca- the data were treated the same for the remainder of the analy-
tions, 6 lake locations, and 15 nearby drinking water wells. ses in this report.
Nutrients were detected in most samples, with the exception
Table 5. Summary statistics across sites for nitrate plus nitrite in milligrams of nitrogen per liter, Lake Spokane, Spokane, Washington,
October 2016–October 2019.
[Field identification: AGR, agricultural site; LRP, Lake Ridge Park; LSC, Lake Spokane Campground; MCA, McLellan Conservation Area; NA, not applicable;
NMF, Nine Mile Falls; NS, north shore; WBR, Willow Bay Resort; NSD, Nearshore Developed; TRD, terraced residential development; UND, undeveloped;
SCW, Suncrest west; SCM, suncrest middle; TUM, Tumtum. Symbol:You can also read