Drought response strategies and hydraulic traits contribute to mechanistic understanding of plant dry-down to hydraulic failure - Sylvain Delzon
←
→
Page content transcription
If your browser does not render page correctly, please read the page content below

Downloaded from https://academic.oup.com/treephys/advance-article-abstract/doi/10.1093/treephys/tpz016/5379221 by INRA (Institut National de la Recherche Agronomique) user on 02 April 2019
Tree Physiology 00, 1–15
doi:10.1093/treephys/tpz016

Research paper

Drought response strategies and hydraulic traits contribute to
mechanistic understanding of plant dry-down to hydraulic failure
Chris J. Blackman1,7, Danielle Creek1, Chelsea Maier1, Michael J. Aspinwall 1,2, John E. Drake1,3,
Sebastian Pfautsch 1,4, Anthony O’Grady5, Sylvain Delzon6, Belinda E. Medlyn1, David T. Tissue                                                                            1

and Brendan Choat 1

1
 Hawkesbury Institute for the Environment, Western Sydney University, Locked Bag 1797, Penrith NSW 2751, Australia; 2Department of Biology, University of North Florida, 1 UNF
Drive, Jacksonville, FL 32224, USA; 3Forest and Natural Resources Management, SUNY-ESF, 1 Forestry Drive, Syracuse, NY 13210, USA; 4School of Social Science and Psychology
(Urban Studies), Western Sydney University, Locked Bag 1797, Penrith, NSW 2751, Australia; 5CSIRO Land and Water, Hobart TAS 7001, Australia; 6BIOGECO, INRA, Univ. Bordeaux,
33615 Pessac, France; 7Corresponding author (c.blackman@westernsydney.edu.au)

Received October 10, 2018; accepted 0, 0; handling Editor Frederick Meinzer

Drought-induced tree mortality alters forest structure and function, yet our ability to predict when and how different species die
during drought remains limited. Here, we explore how stomatal control and drought tolerance traits influence the duration of
drought stress leading to critical levels of hydraulic failure. We examined the growth and physiological responses of four woody
plant species (three angiosperms and one conifer) representing a range of water-use and drought tolerance traits over the course
of two controlled drought–recovery cycles followed by an extended dry-down. At the end of the final dry-down phase, we mea-
sured changes in biomass ratios and leaf carbohydrates. During the first and second drought phases, plants of all species closed
their stomata in response to decreasing water potential, but only the conifer species avoided water potentials associated with
xylem embolism as a result of early stomatal closure relative to thresholds of hydraulic dysfunction. The time it took plants to
reach critical levels of water stress during the final dry-down was similar among the angiosperms (ranging from 39 to 57 days to
stemP88) and longer in the conifer (156 days to stemP50). Plant dry-down time was influenced by a number of factors including
species stomatal-hydraulic safety margin (gsP90 – stemP50), as well as leaf succulence and minimum stomatal conductance. Leaf
carbohydrate reserves (starch) were not depleted at the end of the final dry-down in any species, irrespective of the duration of
drought. These findings highlight the need to consider multiple structural and functional traits when predicting the timing of
hydraulic failure in plants.

    Keywords: drought, eucalyptus, hydraulics, mortality, NSCs, Pinus, rainfall exclusion, rainout shelter, recovery.

Introduction
                                                                                           2010, Duke et al. 2017). However, in many instances, the rate
Regional-scale forest dieback resulting from severe and pro-                               and/or extent of mortality varies, even among co-occurring spe-
longed drought has profound effects on community composition                                cies, suggesting species vary strongly in traits that define differ-
and species interactions, with feedbacks to surface hydrology                              ent drought response strategies and that influence drought
and ecosystem carbon balance (Breda et al. 2006, Reichstein                                survivorship thresholds (Breshears et al. 2005, Engelbrecht
et al. 2013, Clark et al. 2016). Drought-induced tree mortality                            et al. 2007, Fensham and Fairfax 2007, Poot and Veneklaas
events at local and/or large scales are now well documented in                             2013, Johnson et al. 2018). Given that the frequency and inten-
nearly all forested biomes across the globe (Fensham and                                   sity of drought are projected to increase with rising temperature
Holman 1999, Breda et al. 2006, Allen et al. 2010, Phillips et al.                         under climate change (Engelbrecht 2012, Allen et al. 2015),

© The Author(s) 2019. Published by Oxford University Press. All rights reserved. For Permissions, please email: journals.permissions@oup.com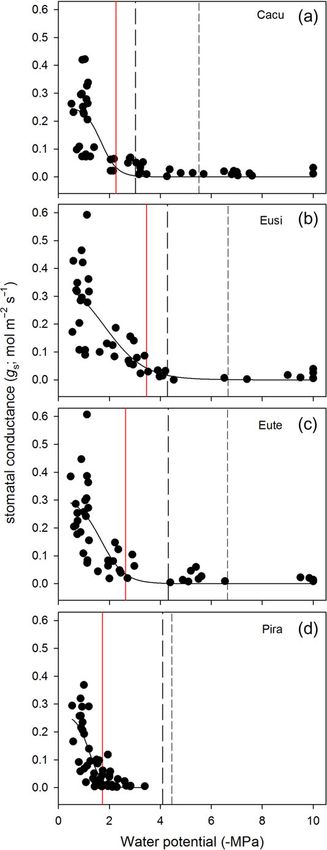
2 Blackman et al.

                                                                                                                                               Downloaded from https://academic.oup.com/treephys/advance-article-abstract/doi/10.1093/treephys/tpz016/5379221 by INRA (Institut National de la Recherche Agronomique) user on 02 April 2019
there is an urgent need to better understand how contrasting          few studies have examined multiple traits that contribute to
drought response strategies and different plant traits influence        determining plant dry-down times to Ψcrit and tested whether
the timing and mechanisms of drought mortality (Choat et al.          the duration of drought stress influences levels of carbohydrate
2018).                                                                depletion.
   The risk of death during drought is broadly determined by the         In this study, we examined growth and physiological responses
capacity of plants to minimize their exposure to lethal thresholds    of saplings of four tree species to a series of drought and recovery
of carbon depletion and/or hydraulic failure due to drought-          cycles, followed by an extended period of soil drying to complete
induced cavitation (McDowell et al. 2008, Sala et al. 2012,           canopy browning. The four species included three angiosperms
Choat 2013). Species that maintain plant water status at rela-        with different eco-hydrological niches and one conifer. The species
tively safe levels via stringent stomatal control may be vulnerable   were chosen to represent a range of growth, water-use and
to carbon depletion, especially under chronic drought conditions,     drought tolerance traits, and thus were expected to exhibit different
while species that maintain open stomata and allow water poten-       growth and drought response strategies that would influence the
tials to drop close to critical thresholds of xylem cavitation may    timing and mechanism of mortality during extended drought. For
be more vulnerable to desiccation and catastrophic hydraulic fail-    each species, we characterized a range of traits linked to drought
ure. While this relatively simple conceptual framework has been       tolerance, including stem hydraulic vulnerability, stomatal regulation
useful in generating hypotheses about mechanisms of drought           and leaf pressure–volume dynamics. At the end of the final dry-
mortality, recent empirical work predominantly links mortality to     down period, we tested for changes in whole-plant biomass ratios
hydraulic failure and is so far ambiguous regarding carbon star-      and leaf non-structural carbohydrates (NSCs). We anticipated that
vation (Anderegg et al. 2012, Mitchell et al. 2013, Duan et al.       longer dry-down times to critical levels of drought stress (Ψcrit)
2014, 2015, Adams et al. 2017, Choat et al. 2018).                    would be linked to traits associated with high drought tolerance
Nevertheless, the dynamics of water loss and carbon depletion         either via drought avoidance (e.g., early stomatal closure or high
leading to mortality during drought are complex, with the relative    hydraulic capacitance) or drought resistance (e.g., low hydraulic
influence of carbon and hydraulic mechanisms of mortality being        vulnerability to embolism). In either case, we hypothesized that in
dependent on a range of plant traits and environmental condi-         delaying the onset of Ψcrit, species with longer dry-down times
tions (Nardini et al. 2016, Adams et al. 2013, 2017, Duan et al.      would show higher levels of depletion of carbohydrate reserves.
2018).
   Trade-offs between carbon and hydraulic traits that influence        Materials and methods
water-use, growth and drought response strategies are also
likely to influence the duration of drought stress and thus the        Study site
possible mechanism of mortality (Martinez-Vilalta and Garcia-         The study took place at the rainout shelters at the Hawkesbury
Forner 2017, Martin-StPaul et al. 2017). For example, fast-           Institute for the Environment in Western Sydney (Australia)
growing tree species with high rates of photosynthesis and high       (33.61° S, 150.74° E) at elevation 25 m above sea level. The
rates of hydraulic conductance (see Markesteijn et al. 2011,          local climate is warm-temperate, with a mean annual tempera-
Reich 2014, Bourne et al. 2017) tend to be susceptible to             ture of 17 °C and a mean annual rainfall of 730 mm (Bureau of
drought-induced hydraulic failure in accordance with the widely       Meteorology, station 067105, 5 km away). The experimental
reported trade-off between high levels of hydraulic efficiency           set up included six rainout shelters designed to contain plants
and high levels of cavitation resistance (Gleason et al. 2016).       up to 6 m tall. The shelter was constructed of steel/metal frame
However, species with low drought tolerance also tend to exhibit      (12 m long × 8 m wide × 6 m height) with a roof pitch of 30°.
stringent stomatal control (Bartlett et al. 2016, Fu and Meinzer      The roof curtains of the shelters are made of Svennson LS solar-
2018) and thus are not necessarily more at risk of rapid dehy-        woven ultra™ on a roll-up system and the side curtains are
dration during drought. In contrast, cavitation-resistant species     made of Svennson QLS ABRI™ on a concertina system. Sides
tend to be slow growing, with xylem anatomical traits such as         remain open when there is no rain to allow the continuous flow
high xylem cell-wall reinforcement (Hacke et al. 2001) and high       of air and minimize variation from ambient outside temperature
fibre-wall area (Jacobsen et al. 2005) that also contribute to         and humidity. The roof and side curtains deploy when rain is
high wood density. Consequently, they also tend to show low           detected by a rain sensor measuring the resistance between two
levels of hydraulic capacitance (Scholz et al. 2011), which is        electrodes. Natural rain is collected in 50,000 l tanks that retain
regarded as a drought avoidance trait (Barnard et al. 2011), and      the chemical properties of precipitation, which was supplemen-
thus may have a limited capacity to buffer decreases in water          tally re-applied to the pots when required.
potential during drought. While many of these traits have been
incorporated into hydraulic models of the time it takes plants to     Species
reach critical levels of drought stress (Ψcrit) (Gleason et al.       Three angiosperms (Casuarina cunninghamiana Miq., Eucalyptus
2014, Blackman et al. 2016, Martin-StPaul et al. 2017), very          sideroxylon A.cunn. ex Woolls and Eucalyptus teriticornis Sm.,

Tree Physiology Volume 00, 2019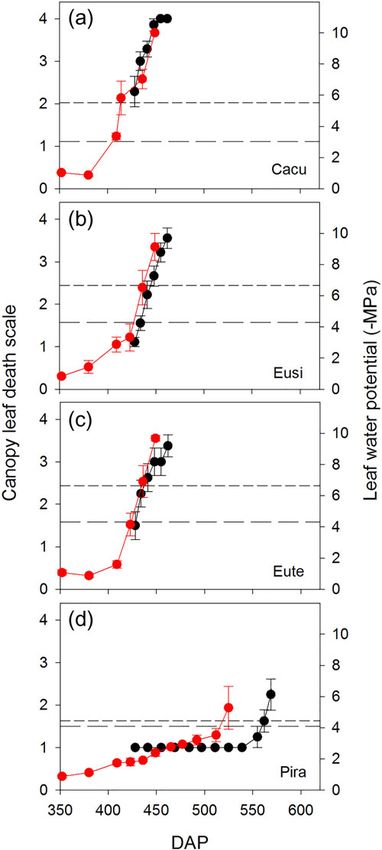
Physiology of drought-induced mortality       3

                                                                                                                                               Downloaded from https://academic.oup.com/treephys/advance-article-abstract/doi/10.1093/treephys/tpz016/5379221 by INRA (Institut National de la Recherche Agronomique) user on 02 April 2019
hereafter referred to as Cacu, Eusi and Eute, respectively) and          plants were well-watered. (iii) Second drought–recovery cycle:
one gymnosperm (Pinus radiata D.Don, hereafter referred to as            from 25 November 2012 a second 4-week long dry-down was
Pira) were chosen for this experiment. Given its occurrence in ripar-    imposed, with the same specifications as the first, followed by a
ian habitats, we anticipated Cacu would exhibit traits associated        4-week well-watered recovery period. (iv) Final dry-down: an
with high rates of water-use and low drought tolerance. Eute is          extended and extreme drought was initiated on 26 January
widespread along coastal eastern Australia with populations that         2013 and progressed with an initial controlled step-down
extend inland and are more exposed to drought. Eusi is a compo-          drought over 6 weeks to a target VWC of 0.06 m3 m−3, after
nent of dry sclerophyll forest occurring further inland in south-        which water was completely withheld. At the start of this final
eastern Australia, extending into sites that receive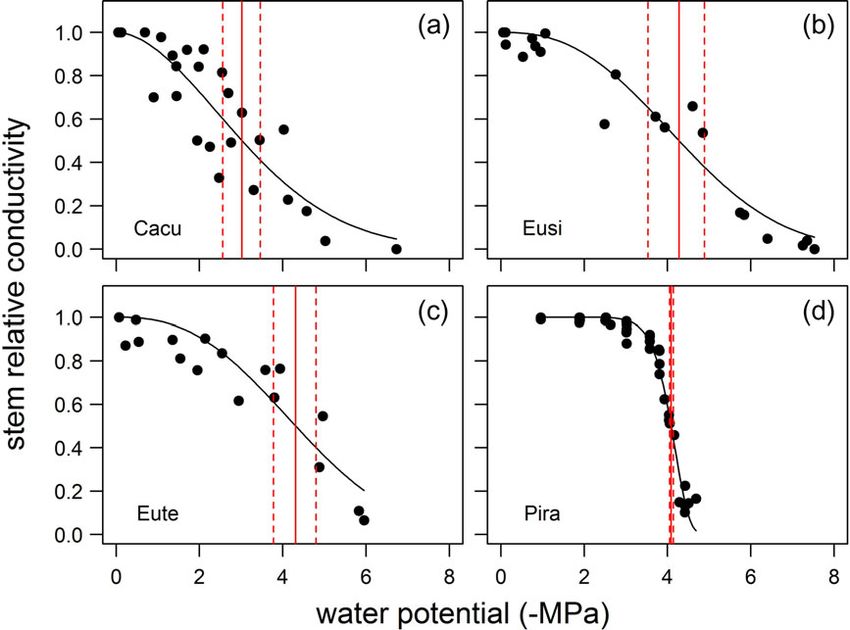
4 Blackman et al.

                                                                                                                                             Downloaded from https://academic.oup.com/treephys/advance-article-abstract/doi/10.1093/treephys/tpz016/5379221 by INRA (Institut National de la Recherche Agronomique) user on 02 April 2019
taken on the penultimate measurement date of each species           morning and trimmed to 400 mm in length. Stems were
respective final dry-down.                                           wrapped in moist paper towel and plastic and immediately
                                                                    shipped to France. Samples arrived 2 days after shipping and
Hydraulic vulnerability                                             were immediately refrigerated at 5 °C. Within 2 weeks after
Stem hydraulic vulnerability curves were generated for each of      receipt of the samples, vulnerability curves were assessed with
the three angiosperm species using bench dehydration (Sperry        the cavitron. Before measurement, all branches were cut under
et al. 1988), and for the conifer Pira using a cavitron (Cochard    water to a standard length of 270 mm. Centrifugal force was
et al. 2005). The cavitron was not suitable to measure hydraulic    used to generate negative pressure in the xylem and to provoke
vulnerability in the three angiosperm species because of their      water stress-induced cavitation using a custom rotor mounted
long vessel length (Choat et al. 2010, Torres-Ruiz et al. 2014).    on a ‘late’ centrifuge (HS18; MSE Scientific, London, UK). Xylem
However, numerous studies have demonstrated that the cavitron       conductance was measured under negative pressure using a ref-
technique provides accurate estimates of hydraulic vulnerability    erence ionic solution of 10 mmol l−1 KCl and 1 mmol l−1 CaCl2
for conifer species (Cochard et al. 2005, 2010, Choat et al.        in deionized water. Xylem pressure (P in MPa) was first set to a
2016). Thus, estimates of vulnerability derived from the two        reference pressure (−1 MPa) and the maximal hydraulic con-
measurement techniques are valid for the species to which they      ductivity (Kmax in m2 MPa−1 s−1) was determined. The xylem
were applied and are directly comparable (Cochard et al. 2013).     pressure was then set to a more negative pressure by steps of
For all species, the entire above-ground component of four to six   1 MPa and the hydraulic conductivity K was determined. Data
well-watered plants, each from a different shelter, was excised      acquisition and processing were performed using the Cavisoft
during early morning in February 2013. For the three angios-        software (Cavisoft v1.5, University of Bordeaux, Bordeaux,
perms, main stems (>1 m) were sufficiently long to avoid open         France).
vessels in the upper canopy where smaller diameter stem seg-
ments were sampled for hydraulics measurements. Following           Pressure–volume analyses
excision, whole branches were transported to the lab in humidi-     A terminal branch (from the upper canopy) was excised from each
fied plastic bags and their bases immediately re-cut under water.    of four to six well-watered individuals and immediately re-cut under
The cut end of each branch was kept submerged for a minimum         water. The newly re-cut end of the branch was placed in water and
of 2 h to ensure water potentials were relaxed within the stem      the entire branch with leaves was covered in black plastic bags to
and avoid possible excision artefacts (Wheeler et al. 2013,         ensure full rehydration. Following rehydration overnight, one
Torres-Ruiz et al. 2015). After stem xylem tension was deter-       mature fully expanded leaf per branch was excised and weighed
mined to be close to zero, by measuring water potentials in two     using a high precision balance. Immediately afterwards, the water
leaves that had been covered in aluminium foil, each branch was     potential of the leaf was measured using the pressure chamber.
placed on the bench and a small diameter stem, approximately        This process was repeated several times until at least five points
10 cm in length, was sampled by cutting back from the distal        were obtained beyond the point at which zero turgor was attained.
end of the branch while submerged under water. The stem sam-        Pressure–volume curves were established by plotting the inverse
ple was shaved at both ends with a fresh razor before being con-    of leaf water potential (−1/Ψ) of each sample vs relative water
nected to the hydraulics apparatus. Stem hydraulic conductivity     content. Projected leaf area of each leaf was measured using a leaf
measurements were made before and after removal of embolism         area metre and leaf dry weight determined after oven drying at
using a filtered (0.22 μm) solution of distilled water with 2 mmol   65 °C for 72 h. Leaf relative water content (RWC) was calculated
KCl. Flow rates were logged with a digital liquid flow metre         as the following: RWC = ((WT – WD) – (WF – WD))/(WF – WD) ×
(LiquiFlow L10, Bronkhorst High-Tech BV, Ruurlo, Gelderland,        100, where WT is turgid fresh weight, WD is leaf dry weight and
The Netherlands) in conjunction with flow analysis programs          WF is leaf fresh weight. From the pressure–volume curve, leaf
FlowDDE (v. 4.69) and FlowPlot (v. 3.34). Any embolisms were        water potential at turgor loss point (Ψtlp), osmotic potential at full
removed by flushing the stem for a minimum of 30 min at con-         turgor (π100) and modulus of elasticity (ɛ) were calculated
stant pressure (150 KPa). The relative difference in flow (PLC,       according to methods described by Bartlett et al. (2012). Leaf
percent loss of conductivity) before and after flushing was plot-    capacitance (Cleaf) was calculated from the change in volume per
ted against stem Ψ. A total of four to six stem segments were       change in water potential above turgor loss point. Leaf-saturated
sampled from each branch across a range of water potentials,        water content (LSWC; g g−1) was calculated as the mass of leaf
from near zero to those associated with 100% PLC as branches        water (WT – WD) divided by leaf dry mass (WD).
slowly dehydrated over 3–4 days in the lab.
   Stem hydraulic vulnerability curves for Pira were generated at   Growth and final harvest
the Caviplace platform of the University of Bordeaux using the      Measurements of stem basal diameter and height were taken on all
cavitron technique (Cochard et al. 2005). The main axis of each     plants every 4–6 weeks throughout the first three phases of the
individual was harvested 50 mm above the soil early in the          experiment. Stem volume (cm3) was calculated from these

Tree Physiology Volume 00, 2019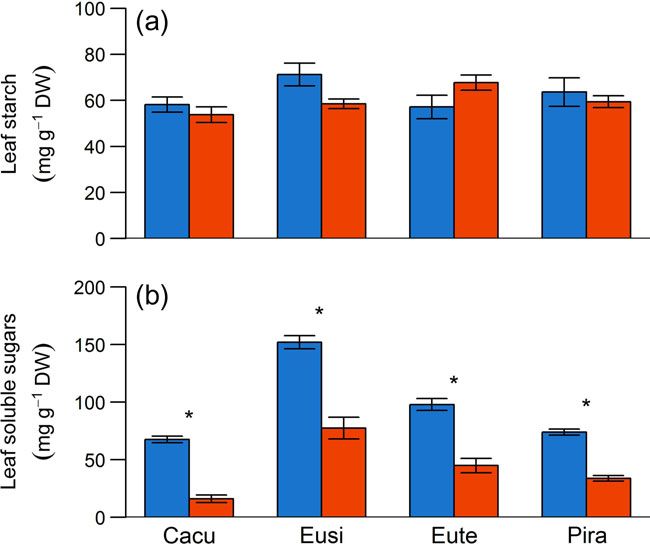
Physiology of drought-induced mortality          5

                                                                                                                                                       Downloaded from https://academic.oup.com/treephys/advance-article-abstract/doi/10.1093/treephys/tpz016/5379221 by INRA (Institut National de la Recherche Agronomique) user on 02 April 2019
measurements assuming that stem taper was consistent with the               calculated from a quadratic function fitted to the relationship
shape of a cone. Incremental relative growth rates for stem volume          between time (days) and midday leaf water potential measured
(RGRvol, cm3 cm−3 day−1) were calculated using the following                during the course of the final dry-down phase (see
equation: (log(vol2) – log(vol1))/(t2 – t1), where t is the measure-        Supplementary Figure S1 available as Supplementary Data at
ment day. Species growth rates were compared using RGRvol calcu-            Tree Physiology Online).
lated using growth measurements taken from October 2012 to
January 2013. At the end of the final dry-down phase, between 11             Statistical analysis
and 13 individual plants of each species were removed from the              For each species, the relationship between stem hydraulic con-
shelter for harvesting upon reaching near-complete canopy death.            ductivity and water potential was fitted with a ‘Weibull’ curve
A total of 18 well-watered plants of each species were harvested            using the ‘fitcond’ function in the fitplc package in R (Duursma
concurrently, within the same time period as the droughted plants           and Choat 2017), from which the water potential corresponding
of each species, respectively.                                              to 50% and 88% loss in conductivity, referred to as stemP50
                                                                            and stemP88, respectively, was calculated. In each case, boot-
Leaf carbohydrates                                                          strap 95% confidence intervals (CIs) were calculated and spe-
For each species, leaves from between 13 and 18 droughted                   cies differences were deemed significant if CIs did not overlap.
and well-watered plants were sampled for non-structural carbo-                 The response of stomatal conductance (gs) to increasing
hydrate (NSC) analysis. Leaves from the mid-upper canopy were               water potential was determined for each species using a 3-
sampled from each individual at the time they were harvested                parameter sigmoidal function fitted to data collected during each
(see above). After sampling, leaves were microwaved for 5 s to              of the drought phases, including the final dry-down. The
stop metabolism and oven-dried at 70 °C for 72 h before being               stomatal-hydraulic safety margin was calculated for each species
ground in ball mill (MM400, Retsch, Hann, Germany). For leaf                as the difference between the water potential at gsP90 and the
soluble sugars and leaf starch extraction, we followed the proto-           water potential at stemP50. For each species, differences in bio-
col described by Tissue and Wright (1995).                                  mass and leaf NSCs between drought and well-watered plants at
                                                                            final harvest were tested using one-way analysis of variance in R
Determining plant dry-down time                                             using log-transformed data.
Species plant dry-down time (or, ‘time-to-Ψcrit’) was defined as
the time it took plants of each species to desiccate from a com-            Results
mon level of soil water deficit, measured 4 weeks after the start of
the final dry-down phase, to water potentials corresponding to               Growth and gas exchange
stemP88 in the three angiosperms, and stemP50 in the conifer.               Under well-watered conditions, relative rates of stem volume
Previous studies suggest these levels of water potential/xylem              growth (RGRvol, cm cm−3 day−1) measured over spring–summer
tension correspond to hydraulic function at or close to plant death         (2012–13) varied (although not significantly, f-value = 1.5, P =
(Brodribb and Cochard 2009, Barigah et al. 2013, Urli et al.                0.27) among the four species (Table 1). The RGRvol of the three
2013), although other studies suggest lethal water potentials               angiosperms varied according to their ecological niches, with the
occur closer to stemP95 in some angiosperms (Li et al. 2016).               riverine species Cacu having the highest RGRvol (5.98 × 10⁻⁴
For each species, the average time-to-Ψcrit across individuals was          units) and the low-rainfall zone Eusi having the lowest (4.41 ×

Table 1. Average values for growth, leaf gas exchange and hydraulics traits measured in plants under well-watered conditions and/or during drought.
*Ψcrit = stemP88 for the three angiosperms (Cacu, Eusi and Eute) and stemP50 for the conifer Pira. Standard errors are given for growth and leaf gas
exchange traits; 95% confidence intervals (CIs) are given for stemP50 and stemP88.

                          Unit                     n    Cacu                    Eusi                    Eute                   Pira
Well-watered
RGRvol                    cm3 cm−3 d−1 × 10⁻⁴      4     5.98 ± 0.6              4.41 ± 0.8              4.83 ± 0.7             3.94 ± 0.7
Asat (mean max)           μmol m−2 s−1             6     21.2 ± 0.5              19.5 ± 1.3              20.4 ± 1.9             20.4 ± 1.6
gs (mean max)             mol m−2 s−1              6     0.33 ± 0.03             0.43 ± 0.04             0.51 ± 0.1             0.33 ± 0.4
Drought response
gsP90                     MPa                           −2.26                   −3.46                   −2.64                  −1.73
min gs                    mmol m−2 s−1             6     13.5 ± 3.1              19.7 ± 9.5              12.6 ± 3.1              1.9 ± 2.6
StemP50                   MPa                           −3.02 (−2.6, −3.5)      −4.28 (−3.5, −4.9)      −4.31 (−3.8, −4.8)     −4.09 (−4.1, −4.1)
StemP88                   MPa                           −5.52 (−4.5, −7.7)      −6.66 (−5.9, −7.7)      −6.64 (−5.6, −9.2)     −4.45 (−4.4, −4.5)
gsP90 – stemP50           MPa                            0.76                    0.82                    1.67                   2.36
gsP90 – stemΨcrit         MPa                            3.13                     3.2                     4.0                   2.36
Dry-down time-to-Ψcrit*   days                             39                      57                      56                   156

                                                                              Tree Physiology Online at http://www.treephys.oxfordjournals.org
6 Blackman et al.
Downloaded from https://academic.oup.com/treephys/advance-article-abstract/doi/10.1093/treephys/tpz016/5379221 by INRA (Institut National de la Recherche Agronomique) user on 02 April 2019
10−4 units). The plantation conifer Pira had the lowest RGRvol of Cleaf ranged from 0.41 mol m−2 MPa−1 for Eute to 0.81 mol m−2
all four species (3.94 × 10⁻⁴ units). In contrast, maximum rates MPa−1 for Cacu). Similarly, traits such as the water potential at
of photosynthesis (Asat) and stomatal conductance (gs) were leaf turgor loss (TLP), the solute potential at full turgor (Πo) and
strikingly similar across the four species (Table 1). bulk modulus of elasticity (ɛ) were much lower (less negative for
TLP and Πo) for Pira (TLP = −1.07; Πo = −0.64; ɛ = 4.9 MPa)
compared with the angiosperms (TLP ranged from −2.04 MPa
Drought tolerance traits
for Eute to −2.57 MPa for Eusi; Πo ranged from −1.56 MPa for
The four species differed in a range of traits related to drought Eute to −1.86 MPa for Eusi; ɛ ranged from 18.0 MPa for Eute to
tolerance. The water potential at critical levels of hydraulic dys- 23.8 MPa for Cacu).
function (i.e., stemP50 in the conifer Pira and stemP88 in the
three angiosperms) was highest in Pira (−4.09 MPa) and signifi-
cantly lower in the three angiosperms (Cacu = −5.52 MPa; Response to repeated drought–recovery cycles
Eute = −6.64 MPa; Eusi = −6.66 MPa) (Figure 1 and Table 1). The level of drought stress incurred by plants during the first
The sensitivity of stomata to increasing drought varied among drought event varied among species. All species showed a
species, with the water potential at 90% stomatal closure decrease in Asat and gs in response to water deficit (see
(gsP90) ranging from −1.73 MPa for the most sensitive species Supplementary Figures S2 and S3 available as Supplementary
(Pira) to −3.46 MPa for the least sensitive species (Eusi) Data at Tree Physiology Online). At the peak of the first drought
(Figure 2 and Table 1). The difference between the water poten- event, minimum water potentials were lower in the three angio-
tial at stomatal closure (gsP90) and stemP50 was the greatest for sperm species (Cacu = −3.1 MPa; Eusi = −3.4 MPa; Eute =
Pira (2.36 MPa) and Eute (1.67 MPa) and the smallest for Cacu −2.6 MPa) compared with the conifer Pira (−1.5 MPa)
(0.76 MPa) and Eusi (0.82 MPa). In contrast, the difference (Figure 3). Referencing each species vulnerability curve
between the water potential at stomatal closure (gsP90) and Ψcrit (Figure 1), these water potentials corresponded to a predicted
was the greatest for Eusi (−4.0 MPa) and the smallest for Pira loss in stem hydraulic conductance ranging from 51% for Cacu,
(2.36 MPa) (Table 1). 33% for Eusi, 17% for Eute and 0% for Pira. These levels of pre-
Pressure–volume traits differed strongly between the three dicted hydraulic dysfunction were related to the water potential
angiosperms and the conifer, but were similar among the angios- difference between gsP90 and stemP50 across species (r2 = 0.9,
perms (Table 2). Leaf-saturated water content (LSWC) and cap- P = 0.05; Supplementary Figure S4 available as Supplementary
acitance (Cleaf) were much higher in Pira (LSWC = 2.37 g g−1; Data at Tree Physiology Online). The cumulative impact of the
Cleaf = 2.76 mol m−2 MPa−1) than the angiosperm species first and second drought events caused a significant reduction in
(LSWC ranged from 1.23 g g−1 for Eusi to 1.64 g g−1 for Cacu; growth (measured in terms of stem volume recorded at the start
Figure 1. Stem hydraulic vulnerability curves for the species examined in this study. Panels (a), (b), (c) and (d) show stem vulnerability data for Cacu,
Eusi, Eute and Pira, respectively. In each panel, the water potential at 50% loss in conductance and associated confidence intervals are indicated by the
vertical red line and associated vertical red dashed lines, respectively.
Tree Physiology Volume 00, 2019Physiology of drought-induced mortality 7
Downloaded from https://academic.oup.com/treephys/advance-article-abstract/doi/10.1093/treephys/tpz016/5379221 by INRA (Institut National de la Recherche Agronomique) user on 02 April 2019
Final dry-down phase
For all species, leaf photosynthesis and stomatal conductance
decreased as water potentials became more negative during the
final dry-down phase (see Supplementary Figures S2 and S3
available as Supplementary Data at Tree Physiology Online). The
mean length of time that species spent at zero or negative
photosynthesis before Ψcrit was relatively short for the three
angiosperms (14, 16 and 14 days for Cacu, Eusi and Eute,
respectively) and longer for the conifer Pira (82 days). The aver-
age (±SE) minimum rate of stomatal conductance (gs; mmol
m−2 s−1) was the lowest for Pira (1.9 ± 2.6) and the highest for
Eusi (19.7 ± 9.5).
The overall time (days) it took plants to dry-down from a com-
mon level of soil water deficit to critical levels of water stress were
similar among the three angiosperms (39, 57 and 56 days to
stemP88 for Cacu, Eusi and Eute, respectively) and longer in the
conifer (156 days to stemP50) (Table 1 and Figure 3). Across spe-
cies, there was a trend of increasing plant dry-down time-to-Ψcrit
with increasing stomatal-hydraulic safety (Figure 5). Compared
with the three angiosperms, the longer dry-down time-to-Ψcrit
recorded for Pira was associated with higher leaf capacitance and
lower minimum stomatal conductance (Figure 5). In contrast, the
direction of the relationship was less pronounced between plant
dry-down time-to-Ψcrit and drought tolerance traits such as gsP90,
stemP50 and stemP88, as well as plant biomass traits such as leaf
mass fraction and plant size (stem volume) (Figure 5).
For each of the three angiosperms, there was close corres-
pondence between increasing canopy death (percentage brown
leaves) and leaf water potential during the final dry-down to mor-
tality phase (Figure 6). In contrast, a poor relationship emerged
between the level of leaf browning and water potential for Pira
(Figure 6). We were unable to pinpoint the exact water potential
associated with mortality. Nevertheless, a subset of plants that
were rewatered from levels of drought stress associated with
100% canopy leaf death showed no sign of recovery, with the
exception of Eute, in which a few plants showed signs of stem
re-sprouting at 2–4 weeks later (see Supplementary Table S1
available as Supplementary Data at Tree Physiology Online).
Final biomass and NSCs
Figure 2. The response of stomatal conductance (gs) to decreasing
water potential during drought recorded for each species; Cacu (a), Eusi Plant biomass ratios were largely unaltered by the three drought
(b), Eute (c) and Pira (d). In each panel, the vertical red line indicates the events, with the sole exception of Cacu (Table 3). At final harvest,
water potential at 90% loss of gs from mean maximum values, while the the leaf mass fraction was significantly lower (12.5%) and the
long-dashed and short-dashed vertical lines indicate the water potential
at stemP50 and stemP88, respectively. root mass fraction was higher (9.7%), but not significantly, in
droughted plants of Cacu compared with well-watered controls.
At final harvest, a significant reduction in leaf soluble sugars was
of the final drought phase) in droughted plants compared with observed in droughted plants of each species compared with
well-watered controls in only two of the four species (Cacu and well-watered controls, respectively (Table 4 and Figure 7). In con-
Eute, Figure 4). At the end of the repeated drought–recovery trast, there were no significant differences in leaf starch between
cycles, mean plant stem volume (±SE) was 187 ± 16 cm3, droughted and well-watered plants of any species at the end of
71.6 ± 5.0 cm3, 144 ± 9.1 cm3 and 90.8 ± 3.6 cm3 for Cacu, the final dry-down phase (Table 4 and Figure 7). Across species,
Eusi, Eute and Pira, respectively. the level of the reduction in leaf soluble sugars and leaf starch
Tree Physiology Online at http://www.treephys.oxfordjournals.org8 Blackman et al.
Downloaded from https://academic.oup.com/treephys/advance-article-abstract/doi/10.1093/treephys/tpz016/5379221 by INRA (Institut National de la Recherche Agronomique) user on 02 April 2019
Table 2. Pressure–volume traits (species means ± SE) measured in well-watered plants (n = 6) of each species.
Abbreviation Unit Cacu Eusi Eute Pira
Saturated water content LSWC g g−1 1.64 ± 0.07 1.23 ± 0.04 1.31 ± 0.03 2.37 ± 0.04
Turgor loss point TLP MPa −2.26 ± 0.11 −2.57 ± 0.11 −2.04 ± 0.11 −1.07 ± 0.14
Solute potential Πo MPa −1.84 ± 0.11 −1.86 ± 0.1 −1.56 ± 0.1 −0.64 ± 0.11
Elastic modulus ɛ MPa 23.8 ± 1.5 18.7 ± 0.4 18.0 ± 0.7 4.9 ± 0.5
Capacitance Cleaf mol m−2 MPa−1 0.81 ± 0.12 0.58 ± 0.03 0.41 ± 0.01 2.76 ± 0.38
Figure 3. Plots showing changes in midday leaf water potential recorded in droughted (filled circles) and well-watered (empty circles) plants of each
species: Cacu (a), Eusi (b), Eute (c) and Pira (d), during the course of the experiment. The light grey shaded areas in each panel represent the first,
second and extended drought phases, respectively. In each panel, the dotted horizontal line represents the water potential at stomatal closure, while the
short- and long-dashed horizontal lines represent the water potential at stemP50 and stemP88, respectively. Error bars represent SE.
concentrations was not related to species stomatal-hydraulic Species growth and drought response strategies
safety margin or time-to-Ψcrit (Figure 8). Species varied in their growth strategies under optimal condi-
tions, with the highest and lowest rates of stem volume growth
Discussion
exhibited by Cacu and Pira, respectively. The level of drought
The four species examined in this study showed a range of stress incurred during the first and second drought events varied
growth and drought response strategies that in combination with among the four species, despite being dried down to approxi-
water storage capacitance and drought tolerance traits influ- mately the same level of soil water deficit. All four species
enced the duration and intensity of drought stress. Canopy showed a reduction in stomatal conductance following bulk tur-
death, as defined by leaf browning, was coincident with water gor loss (Meinzer et al. 2016), although we acknowledge that
potentials associated with loss of xylem hydraulic conductance the mismatch in water potentials at TLP and stomatal closure
due to cavitation in the three angiosperm species. In the conifer recorded in three of the four species possibly arose as a result
species, the occurrence of leaf browning was lagged from exten- of having estimated TLP in well-water plants and gsP90 in
sive cavitation in the stem. At the end of the final dry-down drought-hardened plants. Nevertheless, the narrower hydraulic
phase, we did not observe a reduction in leaf starch reserves in safety margins exhibited by the three angiosperms is typical of
any species, irrespective of plant dry-down time to critical levels plants that allow water potentials to fall to levels associated with
of hydraulic failure. embolism formation during drought (Tardieu and Simonneau
Tree Physiology Volume 00, 2019Physiology of drought-induced mortality 9
Downloaded from https://academic.oup.com/treephys/advance-article-abstract/doi/10.1093/treephys/tpz016/5379221 by INRA (Institut National de la Recherche Agronomique) user on 02 April 2019
Figure 4. Plots showing changes in mean stem volume (±SE) in drought (filled circles) and well-watered (empty circles) plants of each species: Cacu
(a), Eusi (b), Eute (c) and Pira (d), during the experiment up to the start of the final dry-down phase. In each panel, the light grey shaded areas indicate
the first, second and (the start of the) final drought phase. Significant differences (P < 0.05) in stem volume between drought and well-watered plants
at the start of the final dry-down phase are indicated by an asterisk.
Figure 5. Cross-species relationships between selected hydraulic and biomass traits and plant dry-down time-to-Ψcrit recorded during the final dry-
down phase. In each panel, different symbols correspond to the four species examined: circles = Cacu, downward triangles = Eusi, squares = Eute and
diamonds = Pira. In plot (a), the solid and open symbols refer to stemP50 and stemP88, respectively.
Tree Physiology Online at http://www.treephys.oxfordjournals.org10 Blackman et al.
Downloaded from https://academic.oup.com/treephys/advance-article-abstract/doi/10.1093/treephys/tpz016/5379221 by INRA (Institut National de la Recherche Agronomique) user on 02 April 2019
Cochard 2009, Martorell et al. 2014). Alternatively, it might indi-
cate changes in allocation that decouple growth from assimila-
tion, in particular in favour of carbon storage to various carbon
sinks (Wurth et al. 2005, Muller et al. 2011, Fatichi et al. 2014,
Korner 2015) including to roots (Padilla and Pugnaire 2007),
although the observed increase in root mass fraction for drought
Cacu plants was not significantly different from controls.
In contrast to the three angiosperm species, the conifer Pira
was characterized by highly sensitive stomata that regulated plant
water status at high water potentials in response to drought. This
conservative stomatal behaviour (Tardieu and Simonneau 1998),
coupled with moderate embolism resistance (stemP50 similar to
the two eucalypts), resulted in Pira having the widest hydraulic
safety margin of the four species examined. Similarly wide
hydraulic safety margins have been observed in other conifer spe-
cies (Choat et al. 2012, Martin-StPaul et al. 2017). In effect, strin-
gent stomatal control prevented the loss of hydraulic conductance
during the first drought event. Subsequently, rewatered plants
without hydraulic impairment would have been able to rapidly
restore canopy transpiration, which may help explain the lack of
reduced growth observed for Pira during the repeated drought-
recovery cycles.
Drought avoidance traits contributed to longer dry-down
times
Pira leaves (needles) exhibited a larger LSWC (more water per
unit dry weight) and Cleaf than the three angiosperm species. A
strong (r2 = 0.92) correlation between LSWC and Cleaf across
the four species suggests these traits are coupled. Similarly,
Ogburn and Edwards (2012) found a significant relationship
between these variables in a comparison of 25 species while
highlighting their contribution to leaf succulence. A larger capaci-
Figure 6. Plots showing close correspondence between a score of can- tance means a larger buffering capacity for Pira when water sup-
opy leaf browning (black symbols) and leaf water potential (red symbols)
ply becomes limiting, which likely contributed to the longer dry-
during the final dry-down phase for the three angiosperm species: Cacu
(a), Eusi (b) and Eute (c), but not for the conifer Pira (d). The scale down time for Pira compared with the three angiosperms. In
ranges from 0 (0% of leaves dead) to 4 (100% of leaves dead). In each other studies, larger capacitance has been shown to contribute
panel, the short- and long-dashed vertical lines indicate the water poten- to longer desiccation time in excised branches of diverse tropical
tial at stemP50 and P88, respectively.
(Borchert and Pockman 2005) and temperate (Gleason et al.
2014) species, and is a key component of models predicting
1998, Skelton et al. 2015, Martinez-Vilalta and Garcia-Forner the time it takes plants to reach critical levels of drought stress
2017). Consequently, at the peak of the first drought event, the (Blackman et al. 2016).
three angiosperms reached water potentials that on average Somewhat unexpectedly, plant dry-down time was unrelated
were predicted to cause 17–50% loss of stem hydraulic func- to embolism resistance (i.e., stemP50 or stemP88) across the
tion. These levels of drought stress had a significant negative four species. This may be due in part to the influence of contrast-
effect on sapling growth rates in two of the angiosperms (Cacu ing hydraulic strategies exhibited by the three angiosperms and
and Eute) during subsequent recovery cycles. This reduced rate the conifer Pira, with the conifer in particular exhibiting traits
of growth might be related to more conservative stomatal regula- associated with a drought avoidance strategy (Pivovaroff et al.
tion in response to drought, as has been observed in other tem- 2016). In line with these contrasting strategies, there was a
perate tree species in the field (Dietrich et al. 2018). Reduced strong trend of plant dry-down time increasing with increasing
levels of gas exchange may be a consequence of incomplete breadth of the stomatal-hydraulic safety margin expressed rela-
hydraulic recovery due to residual xylem embolisms following tive to the water potential at stemP50. When expressed relative
the first drought event (Blackman et al. 2009, Brodribb and to the water potential at stemP88, the stomatal-hydraulic safety
Tree Physiology Volume 00, 2019Physiology of drought-induced mortality 11
Downloaded from https://academic.oup.com/treephys/advance-article-abstract/doi/10.1093/treephys/tpz016/5379221 by INRA (Institut National de la Recherche Agronomique) user on 02 April 2019
Table 3. Average (±SE) growth and biomass characteristics of well-watered (n = 18) and drought plants (n = 11–13) of each species harvested at
the end of each species final dry-down phase. Bolded values indicate significant differences in biomass allocation between treatments (P < 0.05).
Cacu Eusi Eute Pira
WW D WW D WW D WW D
Height m 2.51 ± 0.14 1.82 ± 0.09 1.24 ± 0.12 1.18 ± 0.05 1.52 ± 0.09 1.57 ± 0.06 1.17 ± 0.06 1.11 ± 0.02
Basal diameter cm 3.47 ± 0. 2 2.1 ± 0.1 1.84 ± 0.1 1.6 ± 0.1 2.6 ± 0.1 2.0 ± 0.1 2.3 ± 0.04 1.9 ± 0.03
Volume cm3 867 ± 111 223 ± 33 138 ± 46 77 ± 8 315 ± 74 164 ± 15 168 ± 12 104 ± 4
Leaf dry mass g 314 ± 31 98 ± 11 69 ± 17 56 ± 2.8 63 ± 19 47 ± 12 94 ± 4.5 69 ± 2.4
Branch dry mass g 145 ± 19 50 ± 8 64 ± 21 45 ± 2 37 ± 11 31 ± 7 23 ± 2 15 ± 1
Stem dry mass g 307 ± 32 114 ± 14 82 ± 25 58 ± 5.8 149 ± 30 107 ± 8.6 94 ± 6.2 70 ± 2.8
Root dry mass g 555 ± 61 213 ± 19 208 ± 23 178 ± 20 302 ± 46 201 ± 11 175 ± 10 125 ± 6.0
Total dry mass kg 1.32 ± 0.13 0.48 ± 0.05 0.42 ± 0.08 0.34 ± 0.03 0.55 ± 0.11 0.39 ± 0.03 0.39 ± 0.02 0.28 ± 0.01
Biomass ratios
Leaf mass 0.24 ± 0.01 0.21 ± 0.01 0.16 ± 0.01 0.17 ± 0.01 0.10 ± 0.01 0.11 ± 0.01 0.25 ± 0.01 0.25 ± 0.01
Branch mass 0.12 ± 0.01 0.10 ± 0.01 0.13 ± 0.01 0.14 ± 0.02 0.06 ± 0.01 0.08 ± 0.01 0.06 ± 0.004 0.05 ± 0.003
Stem mass 0.35 ± 0.01 0.34 ± 0.01 0.31 ± 0.02 0.32 ± 0.02 0.33 ± 0.01 0.36 ± 0.01 0.30 ± 0.01 0.30 ± 0.01
Root mass 0.41 ± 0.02 0.45 ± 0.01 0.54 ± 0.02 0.51 ± 0.03 0.57 ± 0.02 0.53 ± 0.02 0.45 ± 0.02 0.45 ± 0.01
Table 4. Mean leaf carbohydrate concentrations (±SE) measured in well-watered and drought plants at the end of each species dry-down phase.
Cacu Eusi Eute Pira
Unit WW D WW D WW D WW D
−1
Starch gg 58.2 ± 3.3 53.8 ± 3.4 71.3 ± 4.9 58.5 ± 2.1 57.1 ± 5.1 67.7 ± 3.3 63.6 ± 6.2 59.4 ± 2.6
Soluble sugars g g−1 67.6 ± 2.9 16.1 ± 3.3 152 ± 5.7 77.5 ± 9.4 98.0 ± 5.2 45.0 ± 6.2 74.0 ± 2.7 33.9 ± 2.3
TNCs g g−1 126 ± 5.5 69.9 ± 3.9 223 ± 8.4 136 ± 8.3 155 ± 8.1 113 ± 5.4 138 ± 6.8 93.3 ± 4.0
strong association across species between stomatal closure and
incipient decline in hydraulic function due to embolism (Skelton
et al. 2018, Li et al. 2018b), we argue that stomatal-hydraulic
safety expressed relative to a common level of water stress at
stemP50, which represents the steepest portion of the vulnerabil-
ity curve, is functionally more relevant to understanding species
drought response strategy (Skelton et al. 2015, Martin-StPaul
et al. 2017, Wason et al. 2018).
Other traits that were likely to contribute to differences in plant
desiccation time between species include the minimum leaf con-
ductance (gmin, mmol m−2 s−1), which is known to be very low
in species of Pinus and relatively high in genera such as
Eucalyptus from the family Myrtaceae (Duursma et al. 2018).
Consistent with this, minimum rates of stomatal conductance
(min gs; mol m−2 s−1) measured toward the end of the final dry-
down phase, were significantly lower for Pira than the three
angiosperms. Slow rates of desiccation during extended periods
Figure 7. Mean (±SE) concentrations of leaf starch (a) and leaf soluble of drought may also be dependent on whether plants can
sugars (b) in well-watered (blue bars) and drought (red bars) plants of
each species at the end of the final dry-down phase. Asterisk denote sig-
hydraulically isolate roots from rapidly drying soil (North and
nificant differences between treatments (P < 0.05). Nobel 1997), which is likely to be true of Pira considering that
pre-dawn water potentials in droughted plants were significantly
increased substantially for the three angiosperms but remained less negative than soil water potentials toward the end of the
roughly the same for the conifer, which in effect changed the final dry-down phase (Drake et al. 2017).
species rank order of stomatal-hydraulic safety and decoupled Additionally, variation in plant size and total leaf surface area
its relationship with dry-down time. Nevertheless, given the might have contributed to the observed species differences in
Tree Physiology Online at http://www.treephys.oxfordjournals.org12 Blackman et al.
Downloaded from https://academic.oup.com/treephys/advance-article-abstract/doi/10.1093/treephys/tpz016/5379221 by INRA (Institut National de la Recherche Agronomique) user on 02 April 2019
stress occurring (Mitchell et al. 2016, Feng et al. 2018). Overall
our findings highlight the need to incorporate multiple traits and
processes related to drought resistance (e.g., hydraulic vulnerabil-
ity) and avoidance (e.g., capacitance and/or stomatal closure)
when making predictions about the duration of drought before
hydraulic failure and defining species overall drought tolerance.
The mechanism of mortality
Strong correspondence between decreasing water potential and
canopy browning in the three angiosperms suggests a hydraulic
Figure 8. Cross-species relationships between the response ratio of leaf mechanism of progressive leaf death in these species. Interestingly,
starch (filled symbols) and leaf soluble sugar (open symbols) concentra- our measure of complete canopy death occurred at water potentials
tions in well-watered and droughted plants of Cacu (circles), Eusi (down-
ward triangles), Eute (squares) and Pira (diamonds), measured at the well beyond stemP88 in all three angiosperms, although we acknow-
end of the experiment. ledge the difficulty in determining plant death from visual estimates
of leaf browning without quantifying thresholds of irrecoverable
plant dry-down time. However, the relationship between plant drought stress (Brodribb and Cochard 2009). A similar response
dry-down time and both the average size (expressed as stem has been observed in temperate woody angiosperms (Blackman
volume) and average leaf mass ratio of saplings was not signifi- et al. 2009) and suggests that some plants are able to maintain a
cant across the four species, although we acknowledge that our small proportion of ‘green’ leaf area under severe drought stress,
biomass measurements may not have adequately captured spe- despite severe leaf and stem hydraulic dysfunction. It also suggests
cies variation in total leaf area, most likely as a result of species that theoretical plant morality thresholds in angiosperms, namely
differences in leaf form. Modelling analysis of plant dry-down stemP88 (Resco et al. 2009, Urli et al. 2013), may be conservative
times indicate that differences in leaf area will drive differences (Li et al. 2016). Although we were unable to clearly define the exact
in the rate of plant water loss before and after stomatal closure lethal water potential in our study species, plants were assumed to
(Mackay et al. 2015, Martin-StPaul et al. 2017). Nevertheless, if be dead (non-recoverable) at 100% canopy death. Nevertheless, a
we assume that the contribution of leaves and stems to whole few drought plants of one species (Eute) showed signs of stem re-
plant water loss are the same during drought, then the time to sprouting 2–4 weeks after soil re-wetting, again indicating that plants
critical levels of drought stress will not just depend on total leaf may show some capacity to maintain living tissue (at least in the
area but also on the amount of water available in the plant (see short term) despite near-complete loss in xylem conductance. This
Blackman et al. 2016). Further detailed experiments are needed level of resilience is not entirely surprising in Eucalyptus, given the
to elucidate the dynamics of water loss from different plant genus is well known for containing species with a high capacity for
organs, not just from stems (Tyree and Yang 1990) or shoots re-sprouting following fire and drought (Zeppel et al. 2015).
(Borchert and Pockman 2005, Gleason et al. 2014), during all The contrasting drought response strategies of the four spe-
phases of drought. cies in this study did not differentially affect concentrations of
It is important to acknowledge that plant desiccation time leaf starch and soluble sugars in drought and well-watered plants
recorded for Pira was likely extended, compared with the three at the end of the experiment. In other words, and contrary to our
angiosperms, due to plants surviving into the cooler winter expectations, we found no link between the duration of drought
months associated with lower evaporative demand. Nevertheless, and the level of carbohydrate depletion observed at the end of
it remains clear that Pira exhibits a range of traits including early the final dry-down phase. Also, we did not observe a significant
stomatal closure, slow rates of desiccation and leaf succulence decrease in leaf starch in droughted plants of any species, which
that allowed plants to delay the onset of critical hydraulic failure is in contrast to previous drought studies (Adams et al. 2013,
during drought. Although rapid dry-down times were observed in Duan et al. 2013, Mitchell et al. 2013) and a meta-analysis of
the angiosperm species using potted plants, albeit in large volume seasonal variation in NSCs (Martinez-Vilalta et al. 2016),
(75 l) containers, the risk of exposure to desiccation in large although the authors also report strong variability in the level of
mature trees is likely reduced for Cacu by its occurrence in ripar- seasonal starch depletion across plant functional types. In the
ian zones and for the two eucalypt species via their access to current study, the lack of a reduction in leaf starch observed in
underground water reserves and large water storage capacitance. plants of all species may have been due to processes linked to
Thus, when estimating plant dry-down times in mature plants in hydraulic limitation of phloem transport (Sevanto 2018).
the field, it is important to also consider traits such as rooting Alternatively, it may have been due to an insufficiently long peri-
depth that determine plant water availability in the soil, and the od of zero or negative carbon balance recorded in our plants
environmental variables that influence the likelihood of drought during the final dry-down phase.
Tree Physiology Volume 00, 2019Physiology of drought-induced mortality 13
Downloaded from https://academic.oup.com/treephys/advance-article-abstract/doi/10.1093/treephys/tpz016/5379221 by INRA (Institut National de la Recherche Agronomique) user on 02 April 2019
It is likely that all plants in our experiment died as a result of Allen CD, Breshears DD, McDowell NG (2015) On underestimation of
catastrophic hydraulic failure and severe tissue desiccation. This global vulnerability to tree mortality and forest die-off from hotter
drought in the Anthropocene. Ecosphere 6:1–55.
finding supports numerous studies that have observed a Anderegg WRL, Berry JA, Smith DD, Sperry JS, Anderegg LDL, Field CB
hydraulic-related mechanism of drought-induced dieback and/or (2012) The roles of hydraulic and carbon stress in a widespread
mortality in manipulative and field studies (Brodribb and climate-induced forest die-off. Proc Natl Acad Sci USA 109:233–237.
Cochard 2009, Nardini et al. 2013, Anderegg et al. 2015, Anderegg WRL, Flint A, Huang C-y, Flint L, Berry JA, Davis FW, Sperry JS,
Field CB (2015) Tree mortality predicted from drought-induced vas-
Johnson et al. 2018, Li et al. 2018a). However, we note that
cular damage. Nat Geosci 8:367–371.
carbon depletion may play a role in mortality during longer peri- Barigah TS, Charrier O, Douris M, Bonhomme M, Herbette S, Ameglio T,
ods of drought (Galiano et al. 2012, Dai et al. 2018), that the Fichot R, Brignolas F, Cochard H (2013) Water stress-induced xylem
interplay between carbon and hydraulic processes during hydraulic failure is a causal factor of tree mortality in beech and poplar.
Ann Bot (Lond) 112:1431–1437.
drought can be complex (Nardini et al. 2016, Adams et al.
Barnard DM, Meinzer FC, Lachenbruch B, McCulloh KA, Johnson DM,
2017) and furthermore that in some instances trees in the field Woodruff DR (2011) Climate-related trends in sapwood biophysical
show low levels of both hydraulic dysfunction and carbon deple- properties in two conifers: avoidance of hydraulic dysfunction through
tion during severe drought (Dietrich et al. 2018). We suggest coordinated adjustments in xylem efficiency, safety and capacitance.
Plant Cell Environ 34:643–654.
that future work in this area considers how diverse species with
Bartlett MK, Scoffoni C, Sack L (2012) The determinants of leaf turgor
a range of traits linked to stomatal sensitivity and drought toler- loss point and prediction of drought tolerance of species and biomes:
ance thresholds respond to acute (short) vs chronic (long) a global meta-analysis. Ecol Lett 15:393–405.
drought stress in the glasshouse and in the field when attempt- Bartlett MK, Klein T, Jansen S, Choat B, Sack L (2016) The correlations
ing to identify ecologically relevant mechanisms of drought and sequence of plant stomatal, hydraulic, and wilting responses to
drought. Proc Natl Acad Sci USA 113:13098–13103.
mortality. Blackman CJ, Brodribb TJ, Jordan GJ (2009) Leaf hydraulics and drought
stress: response, recovery and survivorship in four woody temperate
plant species. Plant Cell Environ 32:1584–1595.
Supplementary Data Blackman CJ, Pfautsch S, Choat B, Delzon S, Gleason SM, Duursma RA
(2016) Toward an index of desiccation time to tree mortality under
Supplementary data for this article are available at Tree drought. Plant Cell Environ 39:2342–2345.
Physiology Online. Borchert R, Pockman WT (2005) Water storage capacitance and xylem
tension in isolated branches of temperate and tropical trees. Tree
Physiol 25:457–466.
Acknowledgments Bourne AE, Creek D, Peters JMR, Ellsworth DS, Choat B (2017) Species
climate range influences hydraulic and stomatal traits in Eucalyptus
This experiment was supported by the Hawkesbury Institute for species. Ann Bot (Lond) 120:123–133.
the Environment and Western Sydney University and the ANR- Breda N, Huc R, Granier A, Dreyer E (2006) Temperate forest trees and
10-EQPX-16, XYLOFOREST. We thank Burhan Amiji and Craig stands under severe drought: a review of ecophysiological responses,
adaptation processes and long-term consequences. Ann For Sci 63:
Barton for their excellent technical support and help maintaining
625–644.
the site. Randol Villalobos-Vega, Nicolas Boulain, Melanie Breshears DD, Cobb NS, Rich PM et al. (2005) Regional vegetation die-
Zeppel, Markus Nolf, Alicia Cook and Honglang Duan contribu- off in response to global-change-type drought. Proc Natl Acad Sci USA
ted to the photosynthesis, leaf water potential and/or leaf pres- 102:15144–15148.
Brodribb TJ, Cochard H (2009) Hydraulic failure defines the recovery
sure–volume measurements.
and point of death in water-stressed conifers. Plant Physiol 149:
575–584.
Brodribb TJ, McAdam SAM (2013) Abscisic acid mediates a divergence in
Conflict of interest the drought response of two conifers. Plant Physiol 162:1370–1377.
Choat B (2013) Predicting thresholds of drought-induced mortality in
None declared.
woody plant species. Tree Physiol 33:669–671.
Choat B, Drayton WM, Brodersen C, Matthews MA, Shackel KA, Wada H,
McElrone AJ (2010) Measurement of vulnerability to water stress-
References induced cavitation in grapevine: a comparison of four techniques
Adams HD, Germino MJ, Breshears DD, Barron-Gafford GA, Guardiola- applied to a long-vesseled species. Plant Cell Environ 33:1502–1512.
Claramonte M, Zou CB, Huxman TE (2013) Nonstructural leaf carbohy- Choat B, Jansen S, Brodribb TJ et al. (2012) Global convergence in the
drate dynamics of Pinus edulis during drought-induced tree mortality vulnerability of forests to drought. Nature 491:752–755.
reveal role for carbon metabolism in mortality mechanism. New Phytol Choat B, Badel E, Burlett R, Delzon S, Cochard H, Jansen S (2016)
197:1142–1151. Noninvasive measurement of vulnerability to drought-induced embol-
Adams HD, Zeppel MJB, Anderegg WRL et al. (2017) A multi-species ism by X-ray microtomography. Plant Physiol 170:273–282.
synthesis of physiological mechanisms in drought-induced tree mortal- Choat B, Brodribb TJ, Brodersen CR, Duursma RA, Lopez R, Medlyn BE
ity. Nat Ecol Evol 1:1285–1291. (2018) Triggers of tree mortality under drought. Nature 558:531–539.
Allen CD, Macalady AK, Chenchouni H et al. (2010) A global overview of Clark JS, Iverson L, Woodall CW et al. (2016) The impacts of increasing
drought and heat-induced tree mortality reveals emerging climate drought on forest dynamics, structure, and biodiversity in the United
change risks for forests. For Ecol Manage 259:660–684. States. Glob Chang Biol 22:2329–2352.
Tree Physiology Online at http://www.treephys.oxfordjournals.orgYou can also read