Heat dissipation in subterranean rodents: the role of body region and social organisation - Nature
←
→
Page content transcription
If your browser does not render page correctly, please read the page content below
www.nature.com/scientificreports
OPEN Heat dissipation in subterranean
rodents: the role of body region
and social organisation
František Vejmělka1, Jan Okrouhlík1,2, Matěj Lövy1, Gabriel Šaffa1, Eviatar Nevo3,
Nigel Charles Bennett2 & Radim Šumbera1*
The relatively warm and very humid environment of burrows presents a challenge for
thermoregulation of its mammalian inhabitants. It was found that African mole-rats dissipate
body heat mainly through their venter, and social mole-rats dissipate more body heat compared to
solitary species at lower temperatures. In addition, the pattern of the ventral surface temperature
was suggested to be homogeneous in social mole-rats compared to a heterogeneous pattern in
solitary mole-rats. To investigate this for subterranean rodents generally, we measured the surface
temperatures of seven species with different degrees of sociality, phylogeny, and climate using
infrared thermography. In all species, heat dissipation occurred mainly through the venter and the
feet. Whereas the feet dissipated body heat at higher ambient temperatures and conserved it at
lower ambient temperatures, the ventral surface temperature was relatively high in all temperatures
indicating that heat dissipation to the environment through this body region is regulated mainly by
behavioural means. Solitary species dissipated less heat through their dorsum than social species,
and a tendency for this pattern was observed for the venter. The pattern of heterogeneity of surface
temperature through the venter was not related to sociality of the various species. Our results
demonstrate a general pattern of body heat exchange through the three studied body regions in
subterranean rodents. Besides, isolated individuals of social species are less able to defend themselves
against low ambient temperatures, which may handicap them if staying alone for a longer period,
such as during and after dispersal events.
The heat exchange between an endotherm and its environment is mediated via radiation, conduction, convec-
tion, and evaporation (e.g.1). In mammals, the transfer of excess heat to the environment is facilitated by so-
called thermal windows. These sparsely furred body regions are usually found at the body extremities, e.g. ear
pinnae2,3, the f eet3–6, and the t ail7, but may also occur on the t runk8, and on the ventral body s ide9–13. Together
with behavioural regulation, such as posture changes, or seeking convenient microhabitats, heat transfer in these
body parts is regulated mainly by vasodilatation and v asoconstriction1.
Mammalian thermal biology is influenced by multiple factors, but body size plays a crucial role. Compared to
their larger counterparts, small mammals have to compensate for the relatively higher heat losses in cold environ-
ments due to their larger surface-to-volume r atio14. There are various strategies as to how small mammals can
minimise heat loss at low ambient temperature ( Ta). For example, an individual curled up into a ball reduces its
surface-to-volume ratio15–17. Similarly, huddling as a mechanism of social thermoregulation decreases heat loss
rate (e.g.18–20). At higher Tas, rapid heat dissipation is crucial, especially in situations where animals produce a
surplus of metabolic heat, for example due to heavy physical activity. Animals move to a place with a more suit-
able microclimate or increase their evaporative water loss by sweating and/or panting. Thermal windows may
also be actively exposed to the environment at high Tas12,21.
Mammals living in subterranean burrows face a very challenging environment including difficulties in heat
dissipation. The burrow environment is relatively warm and very humid (> 80% relative humidity even in very
arid areas) with limited ventilation, and such a combination presents a problem for their thermoregulation22–25.
In addition, excavation of burrows, which is the main way to reach food, increases metabolic rate up to five times
that of resting22,26–28. Thus, the surplus body heat related to such increase needs to be effectively dissipated to
1
Department of Zoology, Faculty of Science, University of South Bohemia, 370 05 České Budějovice, Czech
Republic. 2Department of Zoology and Entomology, Mammal Research Institute, University of Pretoria,
Pretoria 0002, South Africa. 3Institute of Evolution, University of Haifa, 3498838 Haifa, Israel. *email: sumbera@
prf.jcu.cz
Scientific Reports | (2021) 11:2029 | https://doi.org/10.1038/s41598-021-81404-3 1
Vol.:(0123456789)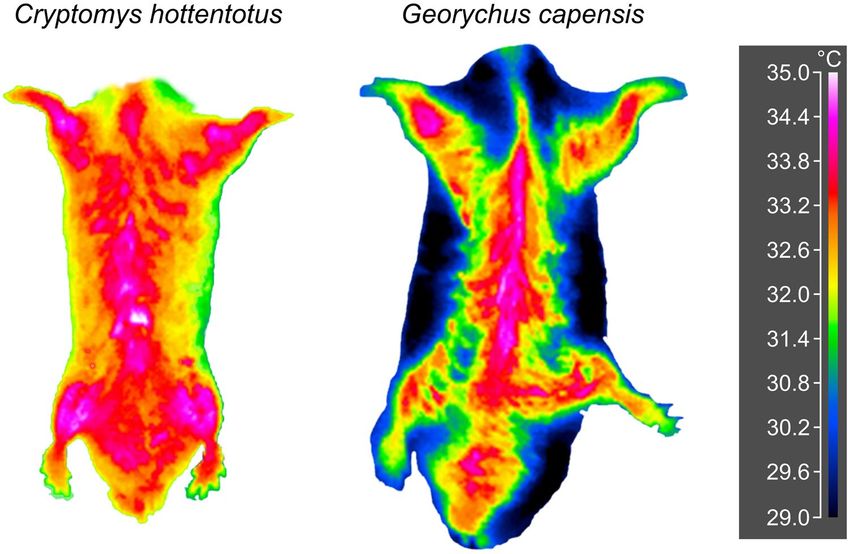
www.nature.com/scientificreports/
avoid overheating22,29. Although subterranean mammals live in a thermally relatively stable environment whose
overall Ta does not decrease much below the thermoneutral zone (TNZ), most of them have dense fur that well
conserve body heat30–33. This may complicate heat offloading at higher Tas or after digging. Finally, these mam-
mals have reduced or even lack most body extremities such as tails and ear pinnae used for heat dissipation in
non-fossorial mammals.
From this point of view it has for a long time been an enigma as to how subterranean mammals avoid over-
heating, especially during highly heat-producing activities. It was speculated that the excess metabolic heat is
dissipated mainly through the venter in the Talas tuco-tuco Ctenomys talarum34. This heat dissipation pathway
was later supported by the analysis of surface temperatures ( Ts), i.e. temperature of the fur surface facing to the
environment, in five African mole-rats (Bathyergidae, Rodentia)31,35. Both studies demonstrated that the feet
which are generally less haired compared to other body regions in all bathyergids also play a relevant role in heat
dissipation. It was also shown that two mole-rat species, the giant mole-rat Fukomys mechowii and the silvery
mole-rat Heliophobius argenteocinereus, cool themselves very effectively, while burrowing via contact of their
body with the colder surrounding soil, especially when the soil is wet36. Although interspecific differences in heat
dissipation in mole-rats could be attributed mainly to the climate of the habitats35, remarkable differences were
found, surprisingly, also between species from the same climatic conditions and habitats. Thus, social F. mechowii
has a shorter and sparser fur allowing more effective body heat dissipation and thus higher Ts, compared to the
solitary H. argenteocinereus which has longer and denser fur across most of its b ody31. Higher heat dissipation
37,38
for social species is disadvantageous at lower Tas, but is reduced by huddling . Both species also differed in
the pattern of T s on the venter. Whereas F. mechowii had a uniformly high T s distributed across its venter, H.
argenteocinereus had a smaller area of high Ts on the chest, and the rest of the ventral surface was remarkably
colder making the venter heterogeneous in terms of Ts31. However, interpretations regarding the heterogeneity
of thermal windows related to differences in social organisation are preliminary because only one solitary and
one social species have been compared so far (cf.31).
Apart from fur, heat dissipation through a particular body region could be influenced by the characteristics of
skin and fat tissue as exhibited in aquatic mammals39, or small terrestrial mammals40. Nevertheless, to be able to
move easily through burrows, mole-rats and probably also other subterranean mammals do not store fat as a sub-
cutaneous layer41,42. A recent analysis did not show any remarkable differences in parameters of skin and fat tissue
between the dorsum and venter in F. mechowii which supports an exclusive role of fur in heat dissipation through
the integument43. Different fur characteristics can thus have relevant behavioural and ecological consequences
in subterranean rodents. For example, it has been suggested that well insulating fur allows H. argenteocinereus
to colonise the highest altitudes of the Nyika Plateau in Malawi, whereas the sympatric social Whyte’s mole-rat
Fukomys whytei occurs at lower a ltitudes44. We may predict that individuals of social species, when dispersing
singly, have higher thermoregulatory costs due to a less insulating fur because they cannot decrease heat losses
by huddling, one of the most efficient energy saving mechanisms in small social m ammals20. Although it is very
difficult to obtain data on the duration of staying alone in social subterranean species in nature, several records
indicate solitary individuals of social mole-rats stay for weeks, months or even years on their own45–48.
In the current study, we recorded T s using infrared thermography (IRT), and core body temperature ( Tb) to
analyse heat dissipation ability, the presence of thermal windows, and the role of social organisation in seven
species of subterranean rodents over a Ta gradient from 10 to 35 °C. The studied species originated from different
phylogenetic lineages (families Bathyergidae, Octodontidae, Spalacidae), climatic zones, and continents with
representatives from both social and solitary species (for details see Table 1). As Tb may differ among the tested
species, we introduce Tdiff parameter defined as the difference between Tb and T s of a particular body region (the
dorsum, venter, and feet) at each T a to quantify heat dissipation. Higher values of this parameter indicate lower
heat dissipation from the respective body region to its surrounding. Since T diff is determined mainly by the value
of Ts, while Tb changes much less, we did not test Ts in most analyses to avoid redundant results similar to those
of Tdiff. We focused mainly on both extreme T as (10 and 35 °C), and a T
a within TNZ of all species (30 °C). We
hypothesized that:
(a) Smaller Tdiff will be found on the venter compared with the dorsum and feet at lower T as confirming the
existence of the ventral heat dissipation surface in all species. At these low T as, larger T diff on the feet and
dorsum is a consequence of vasoconstriction in the feet, and better fur insulation of the dorsum. Further-
more, Tdiff will be smaller in all three body regions at the highest T as when body heat needs to be dissipated
at the highest possible rate from all body surfaces to avoid overheating.
(b) Tdiff will be generally smaller on the venter and dorsum in social compared to solitary species indicating
easier heat dissipation through these regions in social species. No differences in T diff are expected for the
feet because they are less haired in both solitary and social species.
(c) The pattern of Tdiff along the ventral body region will be homogeneous in social species, and heterogeneous
in solitary species. The heterogeneity in T diff in solitary species will be caused by smaller T diff on the less
furred chest compared to higher T diff of other areas of the venter. Next, the venter will be homogeneous
in Tdiff in all species at highest Tas, when body heat needs to be dissipated by the whole ventral surface to
avoid overheating.
Material and methods
Tested animals. Altogether 73 individuals from seven species of subterranean rodents differing in body
mass, phylogenetic relatedness, and sociality were studied (Table 1). All animals were adult non-breeders, or
their breeding history was unknown in solitary species, but none of them showed signs of recent breeding, which
may theoretically influence measured parameters. For the purpose of this study, we used the following taxa.
Scientific Reports | (2021) 11:2029 | https://doi.org/10.1038/s41598-021-81404-3 2
Vol:.(1234567890)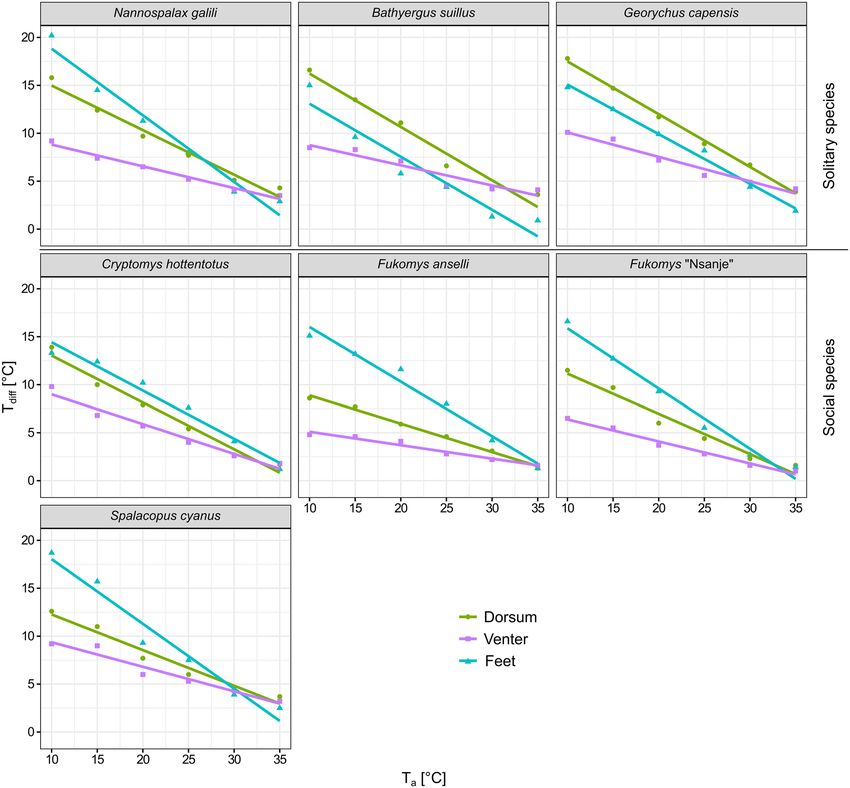
www.nature.com/scientificreports/
Burrow
Social Body mass temperature Altitude (m Locality
Species (n) organisation (g) TNZ (°C) (°C) a.s.l.) (GPS) Climatic zone AP (mm) AMT (°C) MT (°C) TAR (°C)
Darling, R. of
South Africa
B. suillus (10) Solitary 694 ± 146 25–3150 12.4–31.6a 252 Subtropics 435 17.6 6.7 20.8
(33° 22′ S, 18°
25′ E)
Darling, R. of
12.0–30.7a
South Africa
G. capensis (9) Solitary 148 ± 48 26.3–3442 9.8–36.3b 252 Subtropics 435 17.6 6.7 20.8
(33° 22′ S, 18°
10.2–29.755
25′ E)
Darling, R. of
C. hottentotus South Africa
Social 71 ± 13 27–3051 15.9–27.855 252 Subtropics 435 17.6 6.7 20.8
(10) (33° 22′ S, 18°
25′ E)
Lusaka, Zam-
F. anselli (9) Social 80 ± 11 26–3053 18–2656e 1320 bia (15° 28′ S, Tropics 824 19.9 7.7 22.2
28° 25′ E)
Nsanje,
F. “Nsanje” Malawi (16°
Social 139 ± 27 27–3452 – 53 Tropics 842 25.7 14 21.8
(10) 55′ S, 35°
16′ E)
Not known, Subtropics/
S. cyanus (5) Social 101 ± 19 26–335 8–32.157 Not known 377 13.1 1.9 22.0
Chile temperate
Gush Halav,
N. galili (20) Solitary 171 ± 32 26.4–(> 33)83,d 5.4–34.6c 770 Israel (33° 02′ Subtropics 791 16.7 1.3 28.2
N, 35° 27′ E)
Table 1. Characteristics of seven studied species of subterranean rodents and their habitats. Means ± SD
of body masses are given. Numbers in parentheses after the species names represent sample sizes. TNZ,
thermoneutral zone; AP, annual precipitation; AMT, annual mean temperature; MT, minimal temperature;
TAR, temperature annual range (climatic parameters were downloaded from the Worldclim d atabase49; due
to the unknown locality of S. cyanus, climatic data from the whole species range were used). a J. Okrouhlík,
unpublished data, soil temperature 30 cm deep, yearly range in 2017/2018, measured every hour. b J. Okrouhlík,
unpublished data, soil temperature 10 cm deep, yearly range in 2017/2018, measured every hour. c M. Lövy,
unpublished data, soil temperature 20 cm deep, yearly range in 2014/2015, measured every 15 min. d Upper
limit is not known, but our unpublished data indicate that it is above 33 °C in N. galili. e Winter season.
African mole-rats (Bathyergidae): the social Ansell’s mole-rat Fukomys anselli (Burda, Zima, Scharff, Macholán
& Kawalika 1999) occupies the miombo in a small area near Zambia’s capital Lusaka; another social species of
the genus Fukomys is named here as Fukomys “Nsanje” because founders of the breeding colony were captured
near town Nsanje in south Malawi. Although we used name Fukomys darlingi (Thomas 1895) for mole-rats from
this population in previous studies (e.g.38,49), its taxonomic status is still not resolved; the social common mole-
rat Cryptomys hottentotus hottentotus (Lesson, 1826) occurs in mesic and semi-arid regions of southern Africa;
the solitary Cape dune mole-rat Bathyergus suillus (Schreber, 1782) inhabits sandy soils along the south-western
coast of South Africa; and the solitary Cape mole-rat Georychus capensis (Pallas, 1778) occupies mesic areas of
the South A frica50. In addition, we studied the social coruro Spalacopus cyanus (Molina, 1782) (Octodontidae)
occupying various habitats in Chile51; and the solitary Upper Galilee Mountains blind mole rat Nannospalax
galili (Nevo, Ivanitskaya & Beiles 2001) (Spalacidae) from Israel52. Further information about the species includ-
ing number of individuals used in the study, their physiology and ecology is shown in Table 1.
All experiments were done on captive animals. Georychus capensis, C. hottentotus, and B. suillus, were captured
about four months before the experiment, and kept in the animal facility at the University of Pretoria, South
Africa (temperature: 23 °C; humidity: 40–60%, photoperiod: 12L:12D). The animals were housed in plastic boxes
with wood shavings used as a bedding. Cryptomys hottentotus and G. capensis were fed with sweet potatoes; B.
suillus with sweet potatoes, carrots, and fresh grass. Fukomys anselli, F. “Nsanje”, N. galili, and S. cyanus were
kept for at least three years in captivity (or born in captivity) before the experiment in the animal facility at the
University of South Bohemia in České Budějovice, Czech Republic (temperature: African mole-rats 25 °C, N.
galili and S. cyanus 23 °C; humidity: 40–50%, photoperiod: 12L:12D). The animals were kept in terraria with peat
as a substrate and fed with carrots, potatoes, sweet potatoes, beetroot, apple, and rodent dry food mix ad libitum.
Experimental design. We measured T b and T
s in all species at six T
as (10, 15, 20, 25, 30 and 35 °C). Each
individual of all species was measured only once in each T a. Measurements were conducted in temperature con-
trolled experimental rooms in České Budějovice and Pretoria. Each animal was tested on two experimental days.
The animals were placed in the experimental room individually in plastic buckets with wood shavings as
bedding. On the first day, the experimental procedure started at T a 25 °C. They spent 60 min of initial habituation
in the first T
a after which T
b and Ts were measured as described in the following paragraphs. The T a was then
increased to 30 °C and 35 °C, respectively. After the experimental room reached the focal T a, the animals were
left minimally 30 min in each T a to acclimate, and the measurements were repeated. Considering their relatively
small body size, tested animals were very likely in thermal equilibrium after this period because mammals of a
Scientific Reports | (2021) 11:2029 | https://doi.org/10.1038/s41598-021-81404-3 3
Vol.:(0123456789)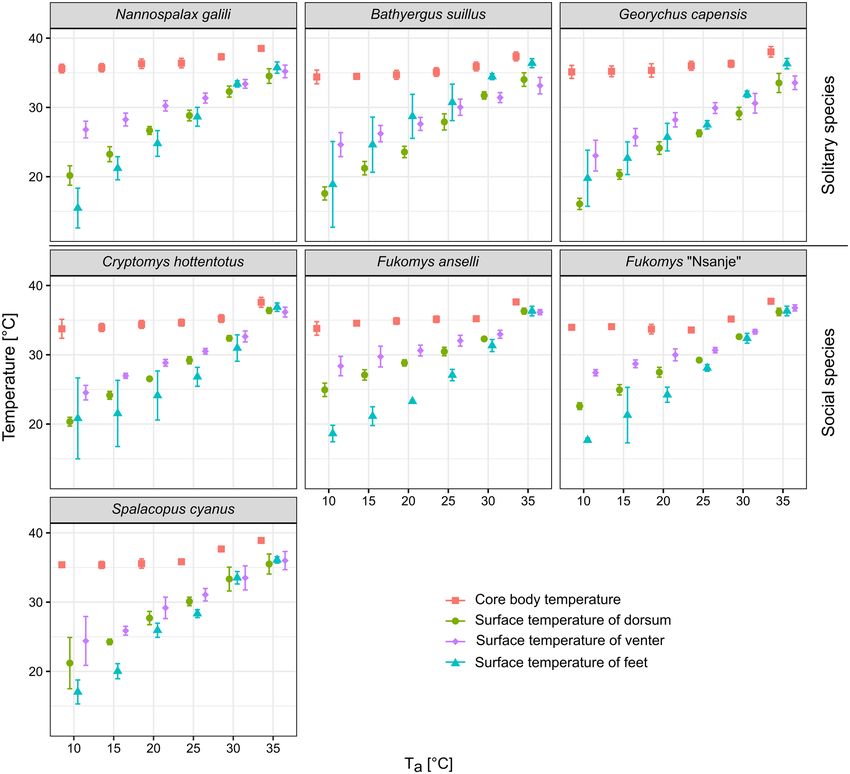
www.nature.com/scientificreports/
comparable body mass are thermally equilibrated after similar period of a cclimation53–56. On the second day, the
procedure was repeated with the initial T a 20 °C and decreasing to 15 °C and 10 °C, respectively. The time span
between the measurements of the same individual in different Ta was at least 150 min. Between experimental
days, the animals were kept at 25 °C in the experimental room (individuals of social species were housed together
with their family members).
Body temperature measurements. We used two sets of equipment to measure animal T b and Ts. In B.
suillus, G. capensis, and C. hottentotus, Tb was measured by intraperitoneally injected PIT tags (< 1 g, LifeChip
with Bio-Thermo Technology; Destron Fearing Corp., Dallas, Texas, USA, accuracy 0.5 °C, resolution 0.1 °C). A
vet injected the tags under anaesthesia (Isoflurane) three months before the experiment. The tags were calibrated
by the manufacturer and were read using a Global Pocker Reader EX (Destron Fearing Corp., Dallas, Texas,
USA). Ts was measured by FLIR SC325 thermal camera (FLIR Systems, Inc., Wilsonwille, Oregon, USA; sensitiv-
ity < 50 mK, accuracy ± 2%, frame rate 31 fps, calibrated by the manufacturer).
Core body temperatures of F. “Nsanje”, F. anselli, N. galili, and S. cyanus were measured using a RET-2 tem-
perature probe (Physitemp Instruments LLC., Clifton, New Jersey, USA; tip diameter 3.2 mm, inserted at least
2 cm in the rectum, accuracy 0.1 °C) connected to Thermalert TH-8 (Physitemp Instruments LLC., Clifton, New
Jersey, USA; resolution 0.1 °C). This procedure took less than 30 s. The apparatus was verified against a ther-
mometer (EL-USB-2-LCD+; Lascar Electronics Ltd., Salisbury, UK; overall accuracy 0.45 °C) calibrated by an
accredited laboratory. Both means of measuring Tb have been shown to provide almost identical results in small
mammals including one species belonging to African mole-rats57–59. Surface temperature was measured using
a Workswell WIRIS thermal imaging system (ver. 1.5.0, Workswell s.r.o., Praha, Czech Republic, sensitivity 30
mK, accuracy ± 2%, frame rate 9 fps, calibrated by the manufacturer). Both thermal cameras were calibrated prior
to measurement of each animal, and we used the same software to process the raw thermograms (see below).
To measure T s, a focused radiometric video of the animal was taken with its different body parts exposed
perpendicularly to the camera. More specifically, the animals were held hanging by the loose skin around the tail,
and their dorsal and ventral body regions were sequentially exposed to the camera. This procedure took less than
30 s. To ensure unbiased T s measurements, all fans in the experimental room were switched off during measure-
ments, and a non-uniformity correction (type of calibration of the camera) was performed just before measuring
each animal. Since the seven tested species were of different sizes, and the lenses of the two thermal cameras had
different focal lengths, and thus field of views, the animals were filmed at different distances from the camera
to fully utilise the resolution of the two cameras. Distances of animals to the camera lens were 38–42 cm for N.
galili, F. anselli, F. “Nsanje”, and S. cyanus, 53–57 cm for C. hottentotus, 64–68 cm for G. capensis, and 86–92 cm
for B. suillus. Room air temperature and humidity were monitored throughout the trials (EL-USB-2-LCD+;
Lascar Electronics Ltd., Salisbury, UK; calibrated by a certified laboratory). Humidity in both labs ranged from
47 to 72% during all experiments.
To assess the heat dissipation (which is related mainly to insulative properties of the integument) of each
species regardless of their actual value of Tb, we introduced Tdiff parameter defined as the difference between Tb
and Ts of a particular body region of each individual (the dorsum, the venter, and the feet) at each Ta.
Handling stress may influence Tb and may also evoke vasoconstriction on the periphery and thus potentially
affect Ts58. To test the potential influence of handling procedures employed in our study on T s and Tb, we carried
out several simple experiments. Firstly, we measured Tb of three individuals of F. mechowii (species not included
in the present study, but i n31) by intraperitoneal probes (G2-HR E-Mitter, Starr Life Sciences Corp., Oakmont,
Pennsylvania, USA; the only species with these probes in our breeds), and found no significant differences in
Tb prior to or after the 30 s handling period ( Tb was 34.0 ± 0.6 °C and 34.1 ± 0.7 °C before and after handling,
respectively; paired t-test: t = −0.42, df = 3, p = 0.70). Secondly, to exclude the possibility of a long-term effect
of repeated handling on Tb, we simulated the measurement procedure with another three individuals of the
same species with intraperitoneally injected PIT tags obtaining Tbs without direct contact. We placed mole-rats
singly in a bucket and after 150 min we measured their Tb. Subsequently, we lifted them for a period of one
min and returned them into the bucket. After 150 min, we again measured their T bs. Lifting of the mole-rats
and temperature measurement was repeated once again (Note that 150 min is the minimal period between two
manipulations of each individual in our experiment). The T bs did not change during these three subsequent
measurements (Generalized Least Squares model [GLS]: F = 0.7, p = 0.544; Tb values were 33.14 ± 0.6, 33.13 ± 0.77
and 33.23 ± 0.92 °C). Thirdly, to rule out a possible effect of handling on T s, we measured dorsal Ts in ten indi-
viduals of F. “Nsanje” (species included in the present study) before and after the handling period which took
usually less than 30 s. Similarly, we did not find significant differences (Ts was 30.5 ± 1.1 °C and 30.3 ± 1.1 °C
before and after the 30 s handling, respectively; paired t-test: t = 1.78, df = 9, p = 0.11). It should be noted that all
animals are accustomed to this handling, as they undertake it on a weekly basis during routine activities, such
as weighing, cleaning of terraria, and miscellaneous behavioural and physiological experiments. We therefore
suggest that the different approaches in obtaining Tb, and different time in captivity for experimental animals
did not affect our results substantially.
Thermogram processing and analysis. The thermographic camera produces (sequences of) images in
the infrared range, so-called thermograms. Sharp and high contrast radiometric thermograms of the dorsum,
the venter and one hind foot as a representative of the feet, were captured from the raw radiometric video in the
software CorePlayer (ver. 1.7.70.320; Workswell s.r.o., Praha, Czech Republic; https://workswell-thermal-camer
a.com/workswellcoreplayer), and processed into non-radiometric thermograms by specifying temperature cal-
culation parameters in the software ThermoFormat (Workswell s.r.o., Praha, Czech Republic; https://workswell-
thermal-camera.com/workswell-thermoformat). These parameters were entered as follows: fur emittance was
Scientific Reports | (2021) 11:2029 | https://doi.org/10.1038/s41598-021-81404-3 4
Vol:.(1234567890)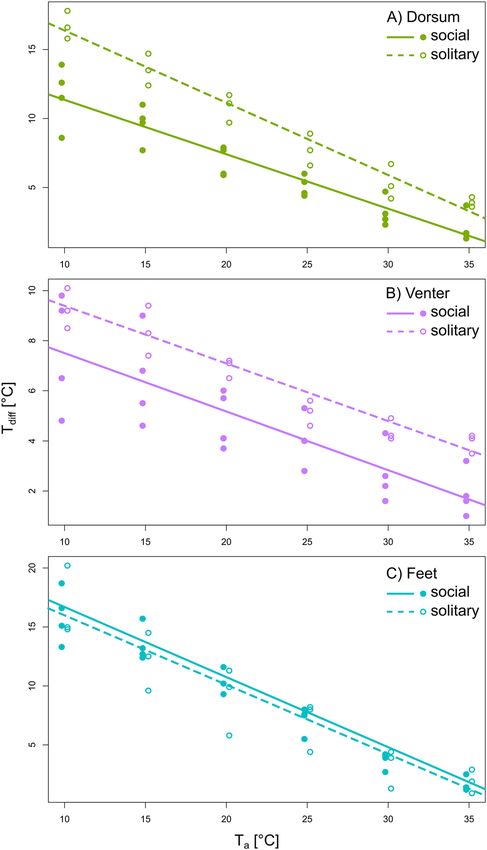
www.nature.com/scientificreports/
Figure 1. A schematic illustration of the layout of the five ventral areas for which surface temperatures were
measured. The background is an infrared thermogram of the Ansell’s mole-rat, F. anselli taken after acclimation
at 10 °C. The figure was prepared using the program Inkscape 0.92 (https://inkscape.org/).
set to 0.97 (e.g.60); air humidity, air temperature, and reflected temperature were entered as means of experimen-
tal room humidity and air temperature during the course of Ts measurement of each species at given Ta; distance
was set as the distance of camera lens from the animal. Although Šumbera et al.31 identified a few other body
surface areas through which body heat is mainly passively dissipated in mole-rats (peripalpebral, nose, and ear
area), we did not include them in our study due to their relatively small area, and thus very low contribution to
overall heat dissipation.
Processed thermograms were used to infer mean T s of the whole ventral and dorsal body region, and the
feet necessary for the calculation of Tdiff. The analysed body regions were manually marked out with a polygonal
region of interest in the CorePlayer (see Fig. 1 as an example for polygon of the whole venter). The region of inter-
est was adjusted to fit onto the part of the body region of the particular individual perpendicularly oriented to the
camera lens. Additionally, the venter was divided in the anterior–posterior axis into five areas (Fig. 1: 1—between
the front legs, 2—to the widest part of the chest, 3—to the end of the rib cage, 4—to the hips, and 5—between
hind legs without the anogenital area).
Data analyses. In all analyses performed in this study, Tdiff was used as a dependent variable assuming
Gaussian error distribution. In all models described below, body region (the dorsum, the venter, and feet),
social organisation (social and solitary), and ventral area (1–5) were treated as explanatory categorical variables,
whereas Ta was treated as a covariate. Means ± SD are given throughout the text. The sex of the tested animals was
not included as an explanatory variable, mainly because of a relatively low number of males and females tested.
Nevertheless, we did not expect any differences because there are no remarkable sex differences in thermal biol-
ogy of subterranean rodents apart from body mass if females are not pregnant or lactating pups25. To test our
hypotheses, we fitted the models on subsets of data divided according to body region and selected Ta values. All
analyses were carried out in R 61 and all figures were edited using the program Inkscape 0.92 (https://inkscape.
org/).
Scientific Reports | (2021) 11:2029 | https://doi.org/10.1038/s41598-021-81404-3 5
Vol.:(0123456789)www.nature.com/scientificreports/
Tb, Ts, and Tdiff over the Ta gradient. Prior to testing of our hypotheses, we performed the following basic
statistical exploratory analyses of Tb and Ts. For each species, we firstly calculated a piecewise linear regression
implemented in the R package Segmented62 to assess whether there is a breakpoint Ta, at which the regression
curve characterising the change in T b (expressed as mean values for each T a for each species) for a given species
changes its slope. Secondly, we calculated a linear regression to characterise a change in Ts (expressed as mean
values for each Ta for each species) in response to increasing Ta. We used Bonferroni procedure to correct the
α of the tests since we calculated one piecewise linear regression for T b for each of the seven species (adjusted
α = 0.0071) and 21 linear regressions for Ts (adjusted α = 0.0024).
For each species separately, we tested whether Tdiff differs amongst the three body regions, i.e. the dorsum,
the venter, and the feet, using GLS marginal models implemented in the nlme package63. One GLS model was
calculated for each of three Tas − 10 and 35 °C as extremes in order to obtain information about T diff in cold and
hot conditions, respectively, and 30 °C which represents TNZ of all the studied species (Table 1). In all GLS
models, the body region was the explanatory variable, and the identity of tested individuals was included to
avoid pseudo-replication. We used the Bonferroni procedure to correct the significance level of the tests because
we tested each T a separately for seven species and three T as (adjusted α = 0.0024), and then performed a similar
post-hoc comparison 13-times (adjusted α = 0.0038).
For each species separately, we first calculated three linear regressions to test whether the slope characterising
the change of Tdiff in response to increasing Ta for each of the three body regions is different from zero. For each
body region, T diff value for a given Ta was calculated as the mean obtained from all individuals within a given
species, for which we obtained a complete set of Ts values from all three body regions at all six Tas. Afterwards, a
homogeneity-of-slopes model was calculated to test whether these three regression lines are parallel to each other,
i.e. there is no interaction between body region and T a. The function “emtrends” implemented in the R package
emmeans64 was used to calculate post-hoc comparisons to find differences between the slopes for the dorsum,
the venter, and the feet in these models. We used the Bonferroni procedure to correct the significance level of
the tests we performed for each of the seven species: (a) three similar regression models (adjusted α = 0.0024)
and (b) altogether seven homogeneity-of-slope models with a post-hoc test (adjusted α = 0.0071).
Tdiff of the three body regions in solitary and social species. To assess the effect of the social organi-
zation on Tdiff (expressed as a mean value for each T a for each species) in each of the three body regions, we
fitted Generalized Linear Mixed Models in a Bayesian framework using Markov Chain Monte Carlo sampling
algorithm (MCMC) implemented in the R package MCMCglmm65. This approach was used to account for non-
independence in Tdiff measurements arising due to shared phylogenetic ancestry, and therefore a random effect
of phylogeny was included in all models. We controlled for phylogenetic relatedness using the subset tree of the
mammal phylogeny by Upham et al.66. The set of subtrees was retrieved via an online tool: vertlife.org/phylo-
subsets/. The maximum credibility tree was then inferred using the R package phangorn67, and taxa labels were
changed using the R package phytools68 in order to merge the taxa with the comparative dataset.
Parameter estimates for fixed and random effects of each model were obtained from sampling posterior
distributions by running 2,500,000 MCMC iterations with a burn-in period of 20% and a thinning interval
sampling each 1000th iteration. Estimates of each parameter are thus based on 2000 samples from a posterior
distribution. In all models, we used weakly informative priors for variance components (V = 1, ν = 0.02), and a
default prior specification for fixed effects, i.e. mean centred on zero with a very large variance (µ = 0, V = 108), to
let the posterior be determined mostly by the information in the data. Mixing and convergence of MCMC chains
were assessed by visual inspection of both time-series and density plots, as well as by calculating autocorrelation
among successive MCMC samples. There was no apparent trend among MCMC samples in time-series plots,
and autocorrelation was low in each fitted model. Effective sample size was ~ 2000 for all estimated parameters
in all models, suggesting generally good mixing and convergence properties of MCMC chains.
For each of the three body regions separately, we fitted a model of the formula: Tdiff ~ Ta + social organisa-
tion + Ta: social organisation (the same Tdiff datasets as for linear regressions were used for these models). Beside
the random effect of the phylogeny accounting for evolutionary history of the studied taxa, we included also a
random effect of species to account for species-specific effects on the variability in T diff in response to T a. This
model allowed us to test whether the slopes for the change in T diff as a response to increasing T a differ between
solitary and social species. Interaction term was considered only when its effect in a model was significant (see
highest posterior density (HPD) intervals and/or pMCMC in Table 3), and the deviance information criterion
(DIC) indicated a better fit (lower DIC) of the model with than without interaction. If the effect of interaction
was not significant, we ran the model without the interaction term, and interpreted only the effects of Ta and
social organization, respectively.
Tdiff along the venter in solitary and social species. For each species individually, we tested whether
Tdiff differs among the five ventral areas using GLS models. One GLS model was calculated for each T a of 10, 30
and 35 °C. In all GLS models, the ventral area was the explanatory variable (a factor with five levels: ventral area
1—ventral area 5, see Fig. 1). We used the Bonferroni procedure to correct the significance level of the tests since
we tested each of three T as separately for seven species (adjusted α = 0.0024). In all GLS models, an identity of
tested individuals was included to avoid pseudo-replication.
In addition, for each of the three Ta, we fitted one MCMCglmm of the form: Tdiff ~ ventral area + social
organisation + ventral area: social organisation, with random effects of the phylogenetic relatedness and spe-
cies. This model allowed us to test whether the pattern of mean change in Tdiff (calculated as the mean from all
individuals of each species entering GLS analysis mentioned above) across five ventral areas differed between
solitary and social species. The effect of interaction term was considered significant if the HPD intervals did not
Scientific Reports | (2021) 11:2029 | https://doi.org/10.1038/s41598-021-81404-3 6
Vol:.(1234567890)www.nature.com/scientificreports/
Slope before the
Ta breaking point for breaking point of Tb (p Slope after the breaking Ts Dorsum (F and p
Species Tb (°C) value) point of T
b value) Ts Venter (F and p value) Ts Feet (F and p value)
B. suillus 27.5 ± 0.9 0.052 ± 0.010 (0.035) 0.244 ± 0.033 609.6, 1.6 × 10–5* 850.9, 8.2 × 10–6* 125.5, 3.6 × 10⁻⁴*
G. capensis 28.6 ± 1.4 0.048 ± 0.020 (0.137) 0.264 ± 0.066 –5
386.6, 3.9 × 10 * –4
157.5, 2.3 × 10 * 216.1, 1.2 × 10⁻⁴*
C. hottentotus 29.3 ± 0.2 0.069 ± 0.005 (0.004)* 0.397 ± 0.015 –5
615.7, 1.6 × 10 * –5
263.6, 8.4 × 10 * 56.1, 0.0017*
F. anselli 28.8 ± 0.9 0.072 ± 0.019 (0.064) 0.361 ± 0.067 137.3, 3.0 × 10–4* 74.1, 0.001* 160.0, 2.3 × 10⁻⁴*
F. “Nsanje” 26.8 ± 0.5 − 0.030 ± 0.012 (0.131) 0.054 ± 0.040 309.1, 6.1 × 10–5* 52.1, 0.002* 1229.7, 3.9 × 10⁻⁶*
S. cyanus 23.1 ± 1.1 0.002 ± 0.025 (0.942) 0.274 ± 0.035 1060.3, 5.3 × 10–6* 670.9, 1.3 × 10–5* 350.4, 4.8 × 10⁻⁵*
N. galili 26.6 ± 1.6 0.059 ± 0.013 (0.047) 0.192 ± 0.044 1036.3, 5.5 × 10–6* 921.5, 7.0 × 10–6* 382.4, 4.0 × 10⁻⁵*
Table 2. Results of piecewise linear regressions characterising a change in core body temperature ( Tb) and
linear regressions characterising a change in the surface temperature ( Ts) for three body regions in response
to increasing ambient temperature (Ta) in seven subterranean rodent species. Breaking points and slopes are
provided as mean ± SEM; p values for the slopes before the breaking point are in parentheses; statistically
significant tests after the Bonferroni procedure α = 0.0071 for Tb and α = 0.0024 for Ts are marked with asterisks.
include zero (see HPD intervals and/or pMCMC in Table 4), and DIC of the model with interaction was lower
than that of the model without it.
Ethical approval. The experimental procedures in the Czech Republic were approved by the University of
South Bohemia Animal Welfare committee and Ministry of Education, Youth and Sports of the Czech Republic
(Permission no. MSMT-26065/2014-12). The experimental procedures in South Africa were approved by Uni-
versity of Pretoria Ethics Committee (Permission no. EC069-16). All procedures were performed in accordance
with relevant guidelines and regulations.
Results
Tb, Ts, and Tdiff over the Ta gradient. In all species apart from C. hottentotus and S. cyanus, Tb was stable
from 10 up to 25 °C (the slopes of segmented regressions were close to 0), showing breaking points between 26.6
and 28.8 °C, after which T b started to increase (see Table 2 for details). For C. hottentotus, Tb increased across the
whole Ta range (the slope was significantly different from 0 for T b values before the breaking point), but there
was a relatively steeper increase between 30 and 35 °C (breaking point at 29.3 ± 0.2 °C, Table 2). For S. cyanus, Tb
was stable only from 10 to 20 °C, with a breaking point at Ta of 23.1 ± 1.1 °C.
Surface temperature for the dorsum, the venter, and the feet increased in all species over the range of T a
(Linear regressions, all p < 0.002 were significant after the Bonferroni procedure, Fig. 2 and Table 2). In contrast
to Tb, Ts of all three regions showed markedly higher differences among the species, with the highest value for
the venter at lower T as, but these differences became smaller at 30 and 35 °C (Fig. 2).
For each of the seven species, T diff differed among the three body regions at 10 °C (p < 0.0001, Supplementary
Table S2). In N. galili, F. anselli, F. “Nsanje”, and S. cyanus, Tdiff was the lowest for the venter, and the highest for
the feet, with the dorsum having intermediate T diff significantly different from both (p < 0.001, for all pairwise
comparisons see Supplementary Table S2). In B. suillus, G. capensis, and C. hottentotus, Tdiff was lower only for
the venter than the dorsum (p < 0.001), and the feet did not differ from either of the two.
At 30 °C, Tdiff differed among the three body regions in N. galili, B. suillus, and F. anselli only (p < 0.0001,
Supplementary Table S2). While both the venter and the feet had significantly lower T diff than the dorsum in N.
galili (p < 0.001), Tdiff was lower for the feet than for both the venter and the dorsum in B. suillus (p < 0.001). In F.
anselli, the ventral Tdiff was lower than the dorsal one, with T diff of the feet being the highest (p < 0.001).
At 35 °C, Tdiff differed among the three body regions only in N. galili, B. suillus, and G. capensis (p < 0.0001,
Supplementary Table S2). The feet of N. galili had lower T diff than the venter and the dorsum, with the latter hav-
ing the highest T diff (p < 0.001). In both B. suillus and G. capensis, the feet had lower T diff than both the dorsum
and the venter (p < 0.001) which had similar T diff.
For each of the seven species, T diff decreased with increasing T a in all three body regions (see Table 3 for statis-
tical details and Fig. 3). Among the three body regions, the ventral Tdiff showed the smallest change in response
to increasing T a (i.e. a less steep slope), and it differed significantly from those of both the dorsum and the feet
in five species. In S. cyanus, it differed from the feet only, and in C. hottentotus, no differences among all three
respective slopes were found. Besides, the slopes for the dorsum were significantly steeper than slopes for the
feet in F. anselli, F. “Nsanje”, S. cyanus, and N. galili.
Tdiff of the three body regions in solitary and social species. The comparison among the slopes
of regression lines characterising the response of Tdiff to increasing Ta for the dorsum, the venter, and the feet
differed between solitary and social species (Fig. 4). For the dorsum, T diff was significantly higher in solitary
than in social species across the whole Ta range (pMCMC < 0.0001), and it decreased relatively more in solitary
(slope − 0.52) than in social species (slope − 0.39) for a given increase in Ta (Fig. 4A and Table 4, DIC = 134.4
and 119.8 for models without and with the interaction between T a and social organisation, respectively). For the
venter, the slopes characterising the change in T diff in response to increasing T a did not differ between solitary
and social species (slope − 0.23, DIC = 93.4 and 95.6 for models without and with the interaction between Ta and
Scientific Reports | (2021) 11:2029 | https://doi.org/10.1038/s41598-021-81404-3 7
Vol.:(0123456789)www.nature.com/scientificreports/
Figure 2. Core body temperatures and surface temperatures of the dorsum, the venter, and the feet measured
across the range of ambient temperatures in seven subterranean rodent species. Means ± SD are depicted. The
figure was prepared using the program Inkscape 0.92 (https://inkscape.org/).
social organisation, respectively; pMCMC = 0.884), but there was a tendency (pMCMC = 0.079) for higher Tdiff in
solitary compared with social species (Fig. 4B and Table 4). For the feet, Tdiff did not differ between solitary and
social species across the T
a range (slope − 0.59, Fig. 4C, and Table 4, DIC = 145.8 and 148.1 for models without
and with the interaction between Ta and social organisation, respectively; pMCMC = 0.902).
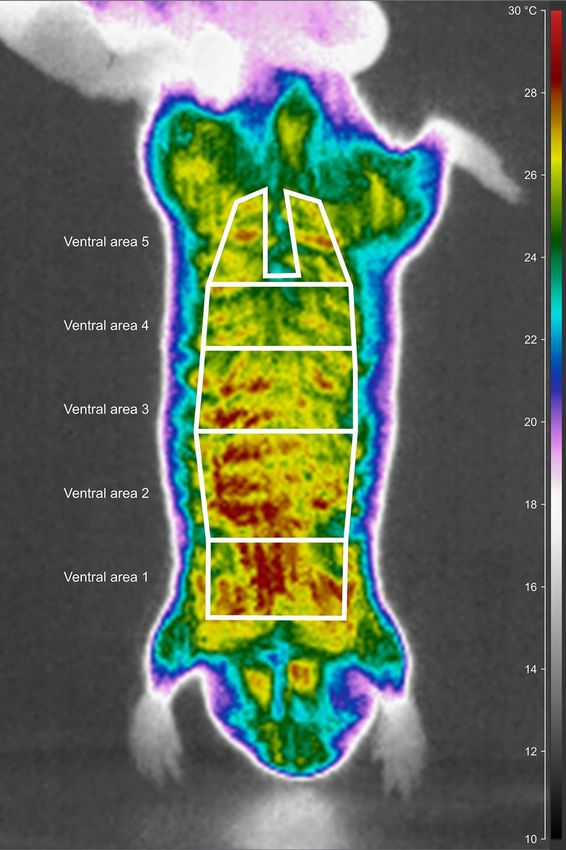
Tdiff along the venter in solitary and social species. The Tdiff for the five ventral areas varied for each
of the seven species at Ta of 10, 30, but not at 35 °C (Table 5; Supplementary Fig. S1; see also Fig. 5 for the com-
parison of Ts pattern of the venter at 30 °C for one solitary and one social mole-rat). In the N. galili, F. anselli, F.
“Nsanje”, Tdiff varied among the five ventral areas at both 10 and 30 °C, whereas for C. hottentotus and S. cyanus,
it differed at 30 °C only. At 35 °C, there were no differences in T diff among the five ventral areas in all species. In
solitary B. suillus and G. capensis, the venter was thermally homogeneous at all Tas. There were no significant dif-
ferences in the pattern of the T diff change among the five ventral areas between solitary and social species in either
of the three Tas (see Table 6 for statistical details; at 10 °C: DIC = 65.2 and 72.7, at 30 °C: DIC = − 3.6 and 3.1 and
at 35 °C: DIC = − 44.1 and − 42.5; the first and second DIC value are for models without and with the interaction
between the ventral area and social organisation, respectively).
Scientific Reports | (2021) 11:2029 | https://doi.org/10.1038/s41598-021-81404-3 8
Vol:.(1234567890)www.nature.com/scientificreports/
Results of linear regressions testing non-zero slopes Results of homogeneity-of-slope models
p value of post-hoc comparison
Dorsum (R 2
Body
Species adj)a Venter (R2 adj)a Feet (R2 adj)a region × Tab V versus Da V versus Fa D versus Fa
t = −11.1, t = −6.1, t = −7.1, F = 12.1,
B. suillus 0.003* 0.003* 0.999
p < 0.001* (0.96) p < 0.001* (0.88) p = 0.002* (0.91) p = 0.001*
t = −38.0, t = −10.0, t = −21.4, F = 54.2,
G. capensis < 0.001* < 0.001* 0.552
p < 0.001* (1.00) p < 0.001* (0.95) p < 0.001* (0.99) p < 0.001*
t = −13.3, t = −10.4, t = −11.8,
C. hottentotus F = 8.5, p = 0.005* 0.013* 0.008* 0.956
p < 0.001* (0.97) p < 0.001* (0.96) p < 0.001* (0.97)
t = −25.0, t = −10.0, t = −13.4, F = 66.2,
F. anselli 0.004* < 0.001* < 0.001*
p < 0.001* (0.99) p < 0.001* (0.95) p < 0.001* (0.97) p < 0.001*
t = −10.6, t = −14.9, t = −14.2, F = 31.7,
F. “Nsanje” 0.007* < 0.001* 0.003*
p < 0.001* (0.96) p < 0.001* (0.98) p < 0.001* (0.98) p < 0.001*
t = −10.5, t = −8.4, t = −10.1, F = 21.1,
S. cyanus 0.231 < 0.001* 0.002*
p < 0.001* (0.96) p = 0.001* (0.93) p < 0.001* (0.95) p < 0.001*
t = −12.4, t = −14.4, t = −11.6, F = 31.4,
N. galili 0.004* < 0.001* 0.006*
p < 0.001* (0.97) p < 0.001* (0.98) p < 0.001* (0.96) p < 0.001*
Table 3. Results of the linear regressions testing whether the slopes characterising a decrease in the change
of the difference between core body and surface temperatures (Tdiff ) in response to increasing ambient
temperatures (Ta) differ from zero for the dorsum (D), venter (V) and feet (F) and of the homogeneity-of-
slope models (Body region × Ta) testing whether these slopes differ among the three body regions in seven
subterranean rodent species. The degrees of freedom were 1 and 4 for the linear regressions and 2 and 12 for
the homogeneity-of-slope models; the goodness of fit of the regression is presented by the adjusted R 2; the p
value of post-hoc pairwise comparisons for the homogeneity-of-slope models are shown in the columns V
vs. D, V vs. F, and D vs. F; statistically significant results after Bonferroni correction α = 0.0024a or α = 0.0071b
applied are marked with an asterisk.
Discussion
To the best of our knowledge, this study represents the highest number of endotherm species, where heat dis-
sipation has been analysed within a single study using the IRT approach. In several aspects, this allows us to
generalise our findings for subterranean rodents. We found that the main heat dissipation areas in all species
are present at the venter and the feet. With respect to the effect of sociality, solitary species dissipate less heat
through the dorsum than social species and the same tendency was found for the venter. For the feet, there were
no differences between both groups. Finally, the pattern of heat dissipation along the venter was not consistent
between species and could not be attributed to sociality.
For the purpose of our study, we defined Tdiff as the difference between Tb and Ts in each individual and each
Ta measured. The value of this parameter is predominantly driven by T s which increases remarkably over the
gradient of T a for all three body regions with T b being much more stable (Fig. 2). Applying this approach can be
important especially in comparative studies using multiple species differing in Tb and species-specific change of
Tb over the gradient of Ta. This can be illustrated by the results of the segmented analysis when the increase of
Tb started at 23.1 °C as found in S. cyanus, but at 29.3 °C as observed for C. hottentotus (Table 2).
Our results demonstrate that the tested body regions play different roles in heat dissipation in subterranean
rodents. As predicted (based on31,34), at the coldest Ta measured (10 °C) we found lower Tdiff on the venter com-
pared to the dorsum in all studied species (and in F. anselli, F. “Nsanje”, S. cyanus, N. galili also compared to the
feet) showing relatively higher heat dissipation from this body region (Fig. 3 and Supplementary Table S2). The
warmer venter in lower Tas compared to other body surfaces was recently also found in three social mole-rat
species35. This finding corresponds with the pattern found in some other mammals. A venter suitable for heat
dissipation can be advantageous as its heat flow may be controlled b ehaviourally12,21,31,69. Although we did not
quantify the behaviour of all individuals during the experiments, closing of a ventral thermal window by curling
up into a ball was observed in most individuals at lower Tas (see Supplementary Fig. S2). Adopting this posture,
animals not only minimise heat losses through their venter, but also reduce their effective surface-to-volume
ratio bringing additional energetic savings70 (note that the same posture is adopted also by torpid small non-
volant mammals71). On the contrary, at high Tas (≥ 30 °C), tested animals usually exposed their venter to the
environment mainly by lying on their back with the legs outstretched trying to maximize heat transfer to the
surroundings (Supplementary Fig. S2). A large ventral thermal window should thus be advantageous, especially
in subterranean mammals because they are predicted to lose the excessive metabolic heat during digging by
means of conduction when the venter is in direct contact with the excavated soil and burrow fl oor36.
Our findings also confirm an important role of the feet in thermoregulation of subterranean rodents as has
been also shown in two studies on African mole-rats31,35. In laboratory rats, the feet together with the distal
parts of legs comprise around 10% of the total body surface and serve as an important heat dissipating r egion72.
The feet of rodents adapted for digging and removing the soil are larger than in non-fossorial r odents73,74, and
thus represent a significant proportion of the body surface. The importance of the feet in the thermoregulation
of subterranean rodents is likely even higher because of lack of other body appendages, and due to their large
surface-to-volume ratio. The feet are usually not well haired which, together with their bare pedal surface, makes
them suitable for fast and effective heat transfer. Due to their relatively large size and heat convection via direct
Scientific Reports | (2021) 11:2029 | https://doi.org/10.1038/s41598-021-81404-3 9
Vol.:(0123456789)www.nature.com/scientificreports/
Figure 3. The difference between core body temperature and surface temperature ( Tdiff ) for the dorsum, the
venter, and the feet across the range of ambient temperature ( Ta) in seven subterranean rodent species. Points
indicate mean values, straight lines are the regression lines predicted by linear models. The figure was prepared
using the program Inkscape 0.92 (https://inkscape.org/).
contact with the substrate, the feet are far more effective than small areas around the eyes or ears which were
also found to lose heat in mole-rats31.
In this regard, our results indicate very effective vasoconstriction taking place in the feet to decrease heat
losses at the lowest T as. This is supported by the feet being the body region with the lowest T s, and thus high-
est Tdiff in four of seven tested species at Ta of 10 °C (Fig. 2, 3, and Supplementary Table S2). The absence of
significant differences between the feet and the other two body regions at this T a in B. suillus, G. capensis, C.
hottentotus indicates a very effective insulative ability of their haired body surfaces rather than the absence of
effective vasoconstriction in their feet. Importantly, at 35 °C, the feet Tdiff was significantly smaller than the Tdiff of
other two body regions in three tested solitary species, N. galili, B. suillus, and G. capensis (Fig. 3, Supplementary
Table S2). This demonstrates intensive vasodilatation and dissipation of the excessive body heat which cannot
be effectively dissipated by other body parts because of the presence of well insulating fur (based on data on fur
characteristics for all three species, Vejmělka and Šumbera unpubl. data). Heat dissipation via the feet is likely
very relevant, similarly to the venter, especially during digging because of their contact with soil. McGowan
et al.35 even suggested that the feet with reduced hair coverage are important at high T as when other conductive
heat losses are working at their maximal capacity. Since the feet contribute to increased heat dissipation at high
Tas, but effectively decrease heat loss at low Tas, they serve as a typical body-extremity-located thermal window
similarly to other mammals (e.g.3–6).
Scientific Reports | (2021) 11:2029 | https://doi.org/10.1038/s41598-021-81404-3 10
Vol:.(1234567890)www.nature.com/scientificreports/
Figure 4. The difference between core body temperature and surface temperature ( Tdiff ) in response to
increasing ambient temperature (Ta) for the dorsum (A), the venter (B), and the feet (C) between solitary and
social species. Lines are the regression lines predicted by MCMCglmm. The figure was prepared using the
program Inkscape 0.92 (https://inkscape.org/).
The importance of the feet in heat exchange was supported also by behavioural observations during the
experiment. At low T as, we observed that many tested animals were sitting on the hind feet with the front feet
not in contact with the cold floor (Supplementary Fig. S2). It was also documented that several individuals of
H. argenteocinereus had some of their feet surprisingly warm while shivering at 10 °C31. This indicates that the
feet may play an active role in dissipation of excessive heat produced by shivering as suggested by authors, or
alternatively, occasional warming of the feet could be related to protection against cold damage by repeated
short-term redirection of blood flow into peripheral colder body parts, as showed across diverse mammalian
taxa including foxes, rats, or humans (e.g.4,75,76).
We demonstrated that tested species and probably other subterranean rodents effectively combine heat dissi-
pation through the venter and the feet, yet each of these body regions acts as a different type of thermal exchanger.
The first type emits heat more or less continuously (as indicated by constantly relatively low T diff, and by its less
steep slope over the gradient of Ta compared to the other two body regions; see Fig. 3), and is represented by
being less furred, and thus less thermally insulated venter31. When necessary in cold conditions, heat dissipation
through this surface can be reduced behaviourally by changing the body posture (see above). The second type
is represented by the feet with the steeper slope of the Tdiff change. In the cold temperatures, heat loss may be
prevented effectively as for instance indicated in g erbils77. In this regard, the way in which these mechanisms,
when acting simultaneously, contribute to heat dissipation is intriguing, and needs to be further explored in
subterranean rodents and mammals in general.
Considering the effect of sociality on heat dissipation, Šumbera et al.31 found that social F. mechowii had
higher Ts on both the venter and the dorsum, but not the feet compared with solitary H. argenteocinereus. Our
results partially support the effect of sociality on heat dissipation in larger number of species. As expected, the
Scientific Reports | (2021) 11:2029 | https://doi.org/10.1038/s41598-021-81404-3 11
Vol.:(0123456789)www.nature.com/scientificreports/
Body region Fixed term Estimate (β) 2.5% HPD 97.5% HPD pMCMC
Intercept 15.237 12.534 17.958
Ta − 0.394 − 0.437 − 0.349 < 0.0001
Dorsum
Social organisation (solitary) 6.358 3.664 8.995 0.001
Ta × Social organisation − 0.131 − 0.190 − 0.059 < 0.0001
Intercept 9.870 6.637 13.007
Ta − 0.233 − 0.257 − 0.208 < 0.0001
Venter
Social organisation (solitary) 1.962 − 0.124 4.427 0.079
Ta × Social organisation 0.004 − 0.046 0.053 0.884
Intercept 22.6530 19.3105 26.4544
Ta − 0.591 − 0.636 − 0.543 < 0.0001
Feet
Social organisation (solitary) − 0.644 − 3.258 2.197 0.558
Ta × Social organisation 0.005 − 0.092 0.093 0.902
Table 4. Relationships between the difference between core body and surface temperature ( Tdiff ) of the
three body regions, ambient temperature (Ta), and social organisation (solitary vs. social) in seven species
of subterranean rodents. 2.5% HPD and 97.5% HPD represent lower and upper highest posterior density
intervals; pMCMC denotes to the p value obtained from MCMCglmm; Ta × Social organisation = interaction
between Ta and social organisation.
Species Ta (°C) (n) Fixed term: ventral area
10 (10) F4, 45 = 0.7, p = 0.616
B. suillus 30 (9) F4, 30 = 1.3, p = 0.302
35 (10) F4, 45 = 0.4, p = 0.817
10 (9) F4, 40 = 2.6, p = 0.054
G. capensis 30 (7) F4, 30 = 1.8, p = 0.160
35 (4) F4, 15 = 0.7, p = 0.593
10 (9) F4, 40 = 3.9, p = 0.010
C. hottentotus 30 (9) F4, 40 = 8.0, p < 0.001*
35 (9) F4, 40 = 4.0, p = 0.008
10 (8) F4, 35 = 14.7, p < 0.001*
F. anselli 30 (7) F4, 30 = 16.4, p < 0.001*
35 (6) F4, 25 = 3.9, p = 0.014
10 (11) F4, 50 = 39.5, p < 0.001*
F. “Nsanje” 30 (8) F4, 35 = 11.3, p < 0.001*
35 (6) F4, 25 = 0.4, p = 0.814
10 (2) F4, 5 = 0.4, p = 0.804
S. cyanus 30 (3) F4, 10 = 43.1, p < 0.001*
35 (5) F4, 20 = 0.7, p = 0.586
10 (17) F4, 80 = 6.1, p < 0.001*
N. galili 30 (15) F4, 70 = 8.7, p < 0.001*
35 (17) F4, 80 = 1.4, p = 0.239
Table 5. The results of GLS models comparing the difference between core body and surface temperature
(Tdiff ) among the five ventral areas at ambient temperature (Ta) of 10, 30 and 35 °C in each of the seven
subterranean rodent species. For each Ta, the venter was tested separately; n denotes to the number of
individuals tested for each Ta; statistically significant results after Bonferroni correction α = 0.0024 applied
are marked with an asterisk; post-hoc comparisons among the areas are depicted by letter combinations in
Supplementary Fig. S1.
role of the feet in heat dissipation was independent of social organization, as demonstrated by almost identical
regression lines for solitary and social species (Fig. 4C). On the contrary, solitary species had significantly higher
Tdiff on the dorsum across tested T as, especially at lower temperatures (Fig. 4A). Solitary species thus conserve heat
more effectively through this body region especially at lower Tas (cf.31). Although the mean ventral Tdiff of solitary
species was about 2 °C higher across experimental Tas (Fig. 4B), this difference only approached significance.
This might be caused mainly by a large intraspecific variability of the ventral T diff among the four studied social
species (compare Fig. 4A,B). Indeed, S. cyanus and C. hottentotus had markedly higher T diff than two Fukomys
Scientific Reports | (2021) 11:2029 | https://doi.org/10.1038/s41598-021-81404-3 12
Vol:.(1234567890)You can also read