Shift of seed mass and fruit type spectra along longitudinal gradient: high water availability and growth allometry - Biogeosciences
←
→
Page content transcription
If your browser does not render page correctly, please read the page content below
Biogeosciences, 18, 655–667, 2021
https://doi.org/10.5194/bg-18-655-2021
© Author(s) 2021. This work is distributed under
the Creative Commons Attribution 4.0 License.

Shift of seed mass and fruit type spectra along longitudinal
gradient: high water availability and growth allometry
Shunli Yu1 , Guoxun Wang1 , Ofir Katz2 , Danfeng Li1 , Qibing Wang1 , Ming Yue3 , and Canran Liu4
1 StateKey Laboratory of Vegetation and Environmental Change, Institute of Botany, Chinese Academy of Sciences,
Beijing, China
2 Dead Sea and Arava Science Center, Eilat, Israel
3 College of Life Sciences, Northwest University, Xian, China
4 Rylah Institute for Environmental Research, Heidelberg, Department of Environment, Land, Water and Planning,

Melbourne, VIC 3084, Australia

Correspondence: Shunli Yu (shunliyu@ibcas.ac.cn)

Received: 13 December 2019 – Discussion started: 8 June 2020
Revised: 23 November 2020 – Accepted: 8 December 2020 – Published: 28 January 2021

Abstract. Propagule traits vary among biomes along geo-          ing leaf area, much more photosynthate (photosynthesis pro-
graphical gradients such as longitude, but the mechanisms        duction) and allometric growth then ultimately increase the
that underlie these variations remain unclear. This study aims   biome average seed mass from west to east. Phylogenetic sig-
to explore seed mass variation patterns of different biome       nal or diversity are not found to be significantly involved in
types along a longitudinal gradient and their underlying vari-   the effect on the patterns. A novel mechanistic framework
ation mechanisms by involving an in-depth analysis on the        and mathematical model are provided to expound seed vari-
variation of seed mass, fruit type spectra, growth forms and     ation among species or biomes.
dispersal mode spectra in Inner Mongolia and northeastern
China. Plant community characterization and seed collec-
tion were conducted in 26 sites spreading over five vegeta-
tion types and covering 622 species belonging to 66 families     1   Introduction
and 298 genera. We found there are significantly declining
trends for mean seed mass, vertebrate-dispersed species rich-    Seed traits have great impact on plants’ competitive abil-
ness and fleshy-fruited species richness along a longitudinal    ity, fitness, fecundity and reproduction. Therefore, studying
gradient from forests to desert grasslands. However, we also     seed mass variations and their mechanism is crucial for un-
found the lowest average seed mass and the smallest pro-         derstanding a plant’s ecological strategy and resource acqui-
portion of species dispersed by vertebrates occurring at typ-    sition (Zanne et al., 2014) as well as deep-time origin and
ical grasslands in the five biomes. The variations of average    evolution of seed attributes. Being a relatively stable bio-
seed mass display high congruence with transition of growth      logical trait, seed mass is controlled by an appointed gene
form spectra. The selection for these propagule attributes is    (Adamskia et al., 2009; Wang et al., 2014), while retaining a
driven mainly by climatic factors such as precipitation, tem-    certain degree of plasticity being affected by the surrounding
perature, soil moisture and evaporation, as well as by inter-    environment (Baker, 1972). Therefore, an individual plant’s
nal biotic factors such as growth forms, canopy coverage and     seed size is a combined result of its taxonomic group’s evolu-
leaf area (Ackerly and Donoghue, 1998). A hypothesis was         tionary history and immediate selective pressures of the local
provided that environmental factors and botanical traits that    environment (Westoby et al., 2002; Moles et al., 2005a). Fur-
favor greater water availability lead to emergence (or speci-    thermore, as an important aspect in the reproductive biology
ation) of species with large seeds or fleshy fruits with high    of plants, seed mass is evolutionarily associated with and cor-
water content. Due to greater water availability and increas-    responds to other plant traits, relating to growth forms (for in-
                                                                 stance, trees, shrubs and herbs), life history (for example, an-

Published by Copernicus Publications on behalf of the European Geosciences Union.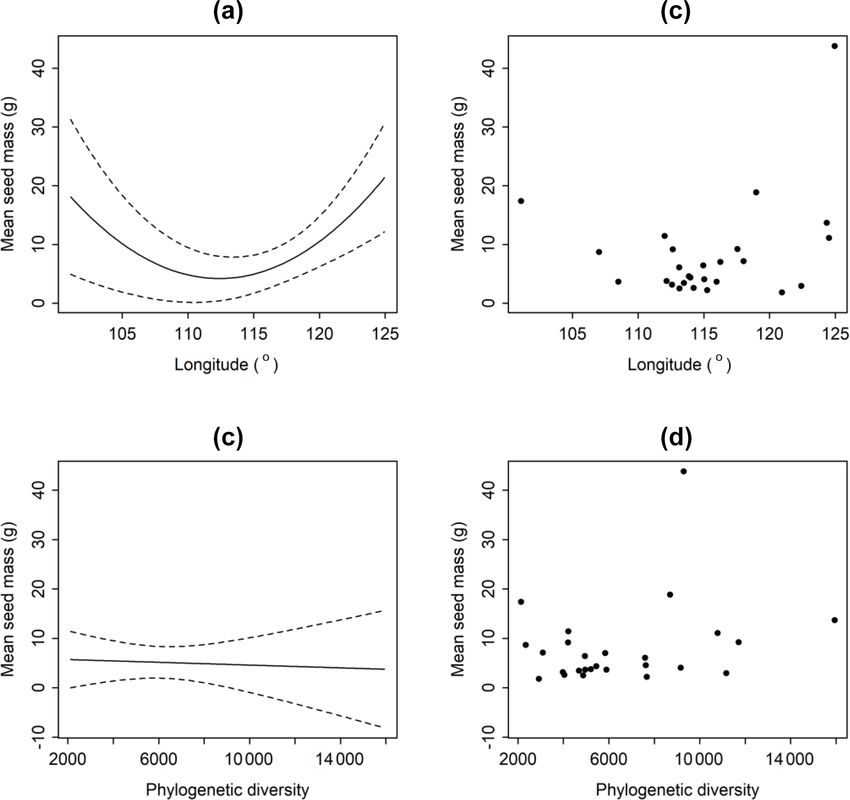
656                                        S. Yu et al.: Shift of seed mass and fruit type spectra along longitudinal gradient

nual plants or perennial plants) (Garnier, 1992; Moles et al.,      al., 2019), and in this article we emphasize the importance
2005a), stature and canopy sizes (Venable, 1992; Leishman           of high water availability and allometric growth for specia-
and Westoby, 1994; Moles et al., 2005a), dispersal modes            tion and colonization of species with large seeds due to envi-
(Greene and Johnson, 1993; Hughes et al., 1994), leaf area          ronmental factors and biological traits. Allometry of biomass
(Díaz et al., 2016), and plant longevity (Telenius and Torstes-     growth and size-asymmetry of light competition became the
son, 1991), as well as to anatomical traits of flowers and fruits   drivers of seed mass variation owing to soil resource avail-
(Primack, 1987).                                                    ability and ultimate productivity heterogeneity along the soil
   Numerous works show that seed mass varies along envi-            resource gradient (surely including water gradient). As we
ronmental gradients such as latitude, elevation and longitude       know, primary production of communities increases across
owing to environmental variations in temperature and pre-           an increasing water gradient (Bai et al., 2008). This article
cipitation both among and within communities (Moles et al.,         presents a novel mechanistic framework that integrates pre-
2007) and several ecological factors are proposed to explain        vious theory and hypotheses (related to climate, phylogeny,
such seed mass variation gradients or patterns, for exam-           water conduction systems and other traits related to water
ple, temperature (Moles et al., 2014), light (or solar radia-       balance) to evaluate seed mass variation among species or
tion) (Murray et al., 2004; Demalach and Kadmon, 2018),             communities.
soil resource availability (Demalach and Kadmon, 2018),                The objectives of this study are to explore seed mass
growth forms (Moles et al., 2005b), dispersal modes (Moles          variation patterns of different community types in the re-
and Westoby, 2003; Herrera, 2005) and soil pH (Tautenhahn           gion along a longitudinal gradient and seed mass variation
et al., 2008). However, a deep understanding of the factors         mechanisms. First, we test whether community-level seed
that underlie these major biogeographical variations is miss-       mass declines from forests to deserts and what drives the
ing (Demalach and Kadmon, 2018), especially at a conti-             patterns by identifying correlations between average seed
nental scale along longitude. Previous work suggested that          mass and precipitation and temperature. Second, we test
community-level average seed mass tends to decrease to-             whether species richness and growth form display similar
wards higher latitudes and elevations (Moles et al., 2007).         variations to seed mass, because growth forms are the key
These trends can be explained by shifts in habitat type, plant      determinant of seed mass (Moles et al., 2005b). Third, we
growth form spectra, seed disperser assemblage (Moles and           test whether seed mass variations are significantly associated
Westoby, 2003), solar radiation and metabolic expenditure           with growth forms, fruit types and dispersal modes in order to
(Murray et al., 2003, 2004), and NPP (Bu et al., 2007; Guo          know whether woody species combine larger seeds or fleshy-
et al., 2010) along latitudinal and elevational gradients. Addi-    fruited species. Fourth, we expound whether these patterns
tionally, species that prefer shaded habitats and late succes-      can be simply explained by phylogeny, latitude and eleva-
sional stages generally tend to have larger seeds than those        tion. Finally, we construct a general hypothesis for seed mass
in open arid habitats or earlier successional stages (Baker,        evolution based on our conclusions and previous research re-
1972; Salisbury, 1974; Foster and Janson, 1985; Hallett et al.,     sults. In addition, like most plant functional traits, seed size
2011), indicating a strong effect of high water availability on     and fruit water content are also considered to be related to
seed mass owing to low evaporation under close canopy cov-          phylogenetic history (Griffiths and Lawes, 2006; Norden et
erage. Longitudinal variations of seed mass among species           al., 2012). These traits are often strongly phylogenetically
with a single genus have been discussed (Murray et al., 2003,       conserved, so phylogenetic distances need to be considered
2004); however, there are few studies that focus on how             when examining trait variation patterns and their correspon-
community-level variations of seed mass (especially across          dence to environmental variables (Griffiths and Lawes, 2006;
species) correspond with other plant traits along longitudinal      Yu et al., 2017). Therefore, we also took into account the ef-
gradients, because of the difficulty to predict variations of       fect of phylogenetic signal or diversity on the seed mass dis-
comprehensive environmental factors arising from complex            tribution patterns in our analysis.
topography. In this region average seed mass is expected to
decrease with declining longitude due to gradually less rain-
fall from forests to desert ecosystems (Murray et al., 2003,        2     Methods
2004). Here we present a study of community-level varia-
tions in seed mass and their relationship to position in the        2.1    Study sites and plant community characterization
continent (relative to the sea) across Inner Mongolia and
northeastern China, to identify the longitudinal pattern and        The study area is located in the continental arid Inner Mongo-
discuss the mechanisms that may underlie them.                      lian plateau, where vegetation types shift from broad-leaved
   Previous works emphasize the role of high light acquisi-         deciduous forest to typical grassland and finally to desert
tion and allometric growth (a growth pattern in which dif-          (from east to west, respectively), due to a gradual increase
ferent parts of an organism grow at defined rates) in shap-         in sunshine duration (from 3000 to 3200 h yr−1 ) and inten-
ing seed mass variation through model prediction and exper-         sity (from 586 × 104 to 796 × 104 KJ m−2 ) and decrease in
iment testing (Demalach and Kadmon, 2018; Demalach et               rainfall (from 780.6 to 29 mm) (Table 1). The study was car-

Biogeosciences, 18, 655–667, 2021                                                       https://doi.org/10.5194/bg-18-655-2021
S. Yu et al.: Shift of seed mass and fruit type spectra along longitudinal gradient                                         657

ried out in 26 sites along this gradient, extending between     dispersal modes of each species were confirmed by referring
longitude 100–124◦ E (about 2864 km distance between the        to Kew Gardens data (Howe and Smallwood, 1982) and liter-
westernmost and easternmost sites) and 41–44◦ N in Inner        ature collections from northwestern China (Liu et al., 2014).
Mongolia and northeastern China (Table 1).                      For some species, dispersal modes were confirmed with em-
   Different sampling designs were used in different habi-      pirical analysis according to morphological features of their
tat types, owing to differences in vegetation structure and     diaspores, and the dispersal modes represent how seeds move
density. Within each forest plot, 6 quadrats of 10 × 10 m2      from the parent plant to the soil surface. Each species was
were selected at random in undisturbed or slightly disturbed    treated as having a single dispersal mode, reflecting their
(at least in recent several years) areas. For shrub communi-    principal dispersal agents (PDAs) (Leishman and Westoby
ties and herbaceous communities, 3 quadrats of 5 × 5 m2 and     1994; Butler et al., 2007): wind-adapted (279 species, with
at least 8 quadrats 1 × 1 m2 were investigated, respectively.   wings, hairs or a pappus), vertebrate-adapted (66 species,
Species composition (species number and number of indi-         with an aril or fleshy fruits), ant-adapted (195 species, with
viduals per species) were recorded. The geographical posi-      an elaiosome), unassisted (70 species, no obvious morpho-
tions (latitude, longitude and elevation) were measured by      logical structure) and adhesion-adapted (12 species, with
wireless GPS logger (HOLUX Technology Inc., Taiwan).            hooks, spines or bards).
Other physiographic factors such as grade of slope, slope
aspect and micro-topography were recorded. The vegeta-          2.3   Fruit types and other plant traits
tion types were determined based on the dominant species
and information referenced from the classification system of    Fruits were classified as fleshy if they were described in the
Chinese vegetation (Editorial Committee for Vegetation of       flora as berries, drupes, pomes, rose hips, multiple fruits and
China, 1980). Data of temperature and precipitation as well     pepos or as possessing fleshy pericarps or succulent tissue in
as other climatic factors were retrieved from the WorldClim     general (including arils) (Yu et al., 2017). Accordingly, cap-
database (http://www.worldclim.org/version1.4, last access:     sules, achenes, nuts, caryopses, legumes, follicles, pods, cre-
8 July 2017) using the R raster package (R Core Team, 2018):    mocarps, utricles, samaras and schizocarps were classified as
average values per site were obtained from interpolations of    non-fleshy (dry) fruits. Some species (e.g., Vitex nengudo var.
observed data during the period between 1950 and 2000.          heterophylla) that were described as fleshy-fruited in related
Two climatic variables, mean annual temperature (MAT) and       local flora were reclassified as dry-fruited owing to very low
mean annual precipitation (MAP), were used to analyze the       water content.
relationship between seed mass and the climate along the ge-       Species life-history information is drawn primarily from
ographical gradient (Table 1).                                  the Flora of China (Editorial Committee of Chinese Flora,
                                                                2004) and based on our yearly field observations. Species in
2.2   Seed collection and characterization                      the flora were grouped into the following five major growth-
                                                                form categories: trees (12 species), shrubs (65 species), sub-
Mature seeds were collected for each species observed in        shrubs (20 species), lianas (15 species), perennials (400
each site at the start of the natural dispersal season (from    species) and annuals (110 species).
June to October) during the years 2008–2014. Seeds of each
species were collected from at least three mother individuals   2.4   Soil moisture measurement
in the same stand and mixed together to avoid bias caused
by maternal effects. Seeds were allowed to air-dry to a con-    The soil moisture of the top 10 cm was measured gravimetri-
stant mass in the laboratory before being weighed. For each     cally by oven-drying the samples at 105 ◦ C for 24 h in 12
plant species, seed mass was calculated as the average values   sites of typical grasslands and desert grasslands. Five soil
of 5 to 100 (even to 1000) seeds, depending on seed size        samples were collected from each site on 10–17 July 2014,
and availability, and at least three repeated measurements      21 d after rainfall.
were conducted for each species. Seed mass was measured to
microgram precision on a PB303 balance (Mettler, Toledo).       2.5   Data analysis
Seeds that were likely to be inviable (unusually small seeds
that contained abnormal looking embryos or that appeared        Seed mass, longitude and precipitation were log-transformed
hollow) were subjectively excluded before the measurement.      before analysis to meet the normality and homoscedasticity
For some species with caryopses, achenes and utricles, the      assumptions of linear regression models. In order to ensure
dry mass of entire propagules was weighed. Structures such      that any observed seed mass variation along the longitudi-
as delicate wings and pappus (or hairs) strictly associated     nal gradient is independent of latitude and elevation, general
with wind dispersal were removed and the spine was retained     linear models (GLMs) were employed. Seed mass and other
before weighing the seeds.                                      plant traits were treated as the dependent variable in all anal-
   Dispersal modes were assigned for all 622 species, based     yses with latitude, longitude and climatic variables entered
on ornamentation and appendages on fruits and seeds. The        into models as independent variables.

https://doi.org/10.5194/bg-18-655-2021                                                    Biogeosciences, 18, 655–667, 2021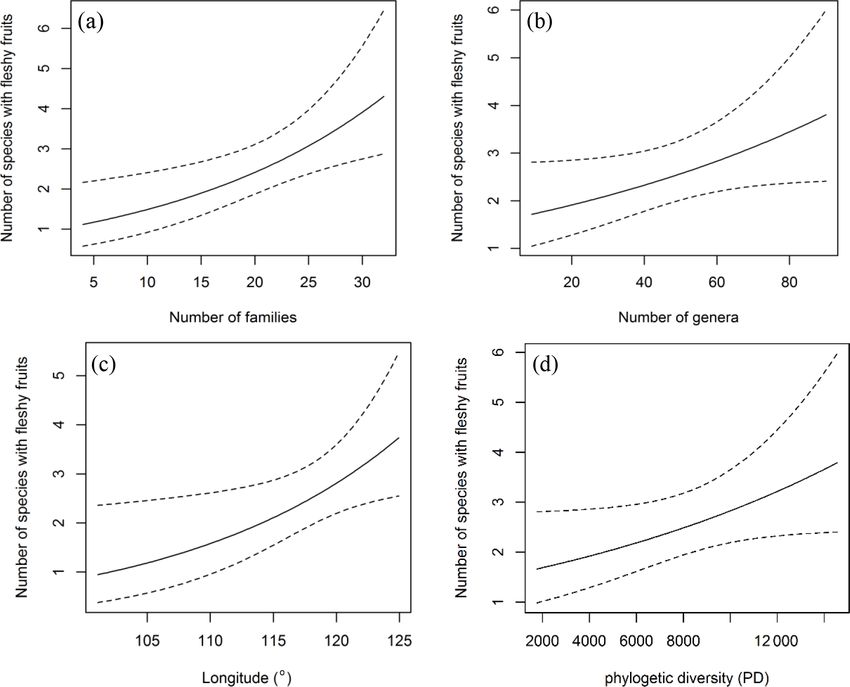
658                                        S. Yu et al.: Shift of seed mass and fruit type spectra along longitudinal gradient

Table 1. Information about geographic positions and environmental factors in 26 sampling sites in the Inner Mongolian plateau and north-
eastern China (MAP: mean annual precipitation, MAT: mean annual temperature, K value: phylogenetic signal values, the small the values,
the weak the signals. Vegetation types: deserts (DS), desert grasslands (DG), typical grasslands (TG), sparse forest (SF), forests (FR).

           No.    Site names         Longitude     Latitude   Altitude     MAP     MAT         K    Evaporation   Vegetation
                                                                   (m)     (mm)    (◦ C)    value        (mm)     types
           1      Ejinaqi             101.0815     41.9520       942          29     8.9   0.774          3850    DS
           2      Wulatehouqi         107.0160     41.0750      1137       136.8     7.9   0.647          3069    DG
           3      Wulatezhongqi       108.4833     41.3002      1203       198.8     5.8   0.395          2500    DG
           4      Erlianhaote         112.0108     43.7239       907       134.8     4.6   0.451          2700    DG
           5      Suyouqi             112.6328     42.7662      1100       346.8     2.1   0.855          2700    DG
           6      Chayouzhongqi         112.37       41.17     1737.3        223     3.2   0.383          2186    TG
           7      Siziwangqi          112.1533     42.0780      1439       315.2       4   0.516          1900    TG
           8      Wulanchabu          113.1244     41.0557      1392       350.1     4.7   0.512          2000    TG
           9      Chayouhouqi         113.1358     41.5916      1499       318.8     4.3   0.430          2186    TG
           10     Shangdu             113.4799     41.5415      1361       337.1     4.2   0.343          2020    TG
           11     Xianghuangqi        113.8587     42.2400      1351       270.6     3.9   0.221          2250    TG
           12     Huade                 113.97       41.88      1483       311.9     3.2   0.483          2050    TG
           13     Zhangbei            114.2200     41.3310      1413       383.7     3.6   0.450          1956    TG
           14     Abagaqi             114.9481     44.0294      1153         238     1.9   0.291          1900    TG
           15     Zhengxiangbaiqi     115.0138     42.2911      1389       351.2     2.8   0.274          1932    TG
           16     Taipusiqi           115.2543     41.9875      1529       383.5     2.4   0.469          1879    TG
           17     Lanqi               115.9547     42.6684      1315       359.6     2.5   0.313          1926    SF
           18     Xilinhaote          116.2514     43.8036      1033       263.5       3   0.224          2100    TG
           19     Keqi                117.5389     43.2250      1038       391.8     3.2   0.353          1600    TG
           20     Linxi                 118.02         43.6      923       369.5     5.2   0.365          1826    TG
           21     Chifeng             118.9778     42.3060       568       370.2     7.8   0.376          1700    TG
           22     Naimanqi            120.9421     42.9535       340       355.9     7.4   1.928          1979    TG
           23     Kezuohouqi          122.4112     42.9017       251       414.9     6.8   0.395          1782    TG
           24     Liaoyuan            124.3416     42.7950       240       604.2     7.1   0.338          1345    FR
           25     Siping              124.5178     43.1757       243       622.6     5.8   0.491           797    FR
           26     Qingyuan            124.9407     41.8513       682       780.8     6.2   0.538          1033    FR

   The proportions and species richness of plants with vari-             tested the phylogenetic signal in seed mass using Pagel’s λ
ous seed mass and fruit types in different communities were              (Pagel, 1999) and Blomberg’s K (Blomberg et al., 2003) cal-
compared using analysis of variance (ANOVA). ANOVA was                   culated using the “phylosig” function in the package “phy-
also used to compare average seed mass between differ-                   tools” v0.2-1 (R Foundation, Vienna, Austria) (Revell et al.,
ent growth forms, different community types, different fruit             2008). A λ or K of 0 indicates no phylogenetic signal (Pagel,
types and dispersal types. The GLM procedure was used to                 1999; Panchen et al., 2015). Regression analyses were con-
examine the explanatory power of community types, disper-                ducted between phylogenetic signal and longitude across the
sal types, longitude, precipitation and temperature on seed              sites in five community types. Using the phylogenetic tree
mass. All analyses were performed with R-3.3.3 (R Core                   with branch length, we calculated the phylogenetic diversity
Team, 2018). By use of the function commonality in the                   using the measure PD, which was defined as the minimum to-
R package “yhat” (Nimon et al., 2013), we take the log-                  tal length of all the phylogenetic branches required to span a
transformed seed size as a dependent variable and life forms,            given set of taxa on the phylogenetic tree (Faith, 1992). Tak-
vegetation types and dispersal modes as independent vari-                ing mean seed mass as a dependent variable and longitude
ables with latitude, exploring the predictive power of each              (including both linear and quadratic terms) and the phyloge-
variable.                                                                netic diversity measure PD as independent variables, we built
   For the 620 species (two gymnosperm species were ex-                  a linear model using R package stats (R Core Team, 2018).
cluded owing to their low relatedness with most of an-                      We considered the relations between the number of species
giosperm species), a supertree was constructed using the                 with fleshy fruits and longitude, the number of families,
software Phylomatic (Webb et al., 2008). The phylogenetic                number of genera and the phylogenetic diversity PD. Since
backbone was based on the APG III tree (R20120829, http:                 there are strong correlations between the latter four vari-
//phylodiversity.net/phylomatic/, last access: 10 July 2017).            ables (r > 0.67, p < 0.001), they cannot be used in the same
We quantified the strength of phylogenetic conservatism and              model. Therefore, we built four models. Each took one of

Biogeosciences, 18, 655–667, 2021                                                           https://doi.org/10.5194/bg-18-655-2021
S. Yu et al.: Shift of seed mass and fruit type spectra along longitudinal gradient 659
the four variables as the independent variable and the num-
ber of species with fleshy fruits as a dependent variable. A
generalized linear regression model with the Poisson family
was fitted using R package stats (R Core Team, 2018). In the
model, we also included the log (number of species) as off-
set.
3 Results
3.1 Seed mass variations along the longitudinal
gradient
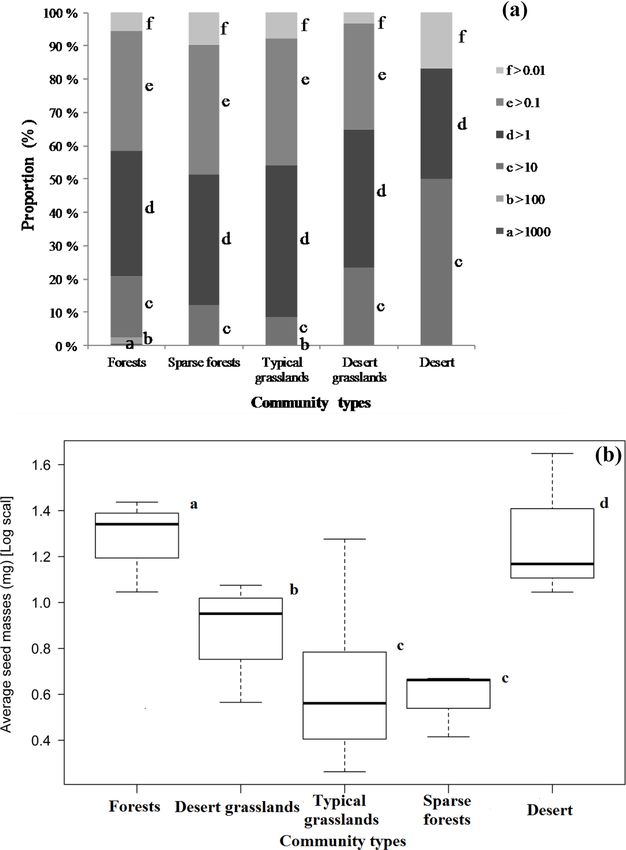
Although the majority of species had medium-sized seeds
(Fig. 1), variations among all species were great. There
were considerable differences in average seed mass and
seed spectra among the five biome types (Fig. 1). Forests
have the largest average seed mass (23.45 ± 18.34 mg), and
both typical grasslands (4.75 ± 3.93 mg) and sparse forests
(4.45 ± 1.18 mg) have the lowest average seed mass. The av-
erage seed mass of forests is significantly greater than that of
the sparse forests (F = 12.13, p = 0.0253), and deserts are
remarkably larger (20.12 ± 8.26 mg) than desert grasslands
(10.08 ± 2.34 mg) (F = 6.914, p = 0.0466), with nearly 4.2
times smaller average seed mass from deserts to typical
grasslands. The average seed mass of typical grasslands is
significantly smaller than that of desert grasslands (F =
11.92, p = 0.0025), while there is no significant difference
between average seed mass of typical grasslands and sparse
grasslands (F = 0.019, p = 0.892). Figure 1. Seed mass spectra vary among five community types in
Inner Mongolia (a), and proportions of larger seeds (a) and average
3.2 Variation of species richness, growth form spectra seed mass (b) decline from forests to desert grasslands but increase
and abundance along the longitudinal gradient in deserts (average seed masses bearing the same letters are insignif-
icantly different at p > 0.05).
There are declining trends for herbaceous species richness
and canopy coverage from forests to desert along decreasing
longitudinal gradient in this region (Table 2). Typical steppe The average seed mass of species with fleshy fruits
was found to have the lowest woody species richness and (40.15 ± 110.41 mg) was significantly greater than that of
highest herbaceous abundance in five community types (Ta- species with dry fruits (26.58 ± 286.97 mg) for the whole
ble 2). 622 species pool (F = 18.61, p = 0.0125), for the five com-
munity types (Table S1 in the Supplement; Fig. 2) and for
3.3 Seed mass relations to growth forms, seed each site (Table S2; Fig. 2).
dispersers and fruit types Seed mass is weakly negatively correlated with leaf area
(R 2 = 0.063, p = 0.005) and not significantly correlated
The average seed mass of trees was significantly larger with SLA across all sampled species (R 2 = 0.006, p =
than that of shrubs (F = 12.2, p = 0.000), shrubs had larger 0.195). SLA is significantly related with leaf area (R 2 =
seeds than perennials (F = 59.57, p = 0.000), and the aver- 0.160, p < 0.001).
age seed mass of perennials was larger than that of annuals
(F = 4.932, p = 0.0268; Fig. 2). 3.4 Seed mass relations to environmental variables
Seeds that are dispersed by vertebrates
(232.09 ± 823.98 mg) were significantly larger than Average seed mass was minimum at approximately 114◦
those dispersed by wind (2.46 ± 6.23 mg) (F = 238.2, longitude where typical grasslands occur (Fig. 3). However,
p < 0.0001) and ants (3.56 ± 10.03 mg) (F = 17.73, phylogenetic diversity (PD) was not a significantly explana-
p < 0.0001) and those with unassisted dispersal tory variable (p > 0.8) (Fig. 3). Linear regression model
(7.42 ± 12.08 mg, F = 17.73, p = 0.000) and adhesive shows that there is no significant decreasing trend from
dispersal (5.07 ± 8.12 mg, F = 17.73, p < 0.0001; Table 3). forests to deserts along declining longitude (F = 2.289, p =
https://doi.org/10.5194/bg-18-655-2021 Biogeosciences, 18, 655–667, 2021660 S. Yu et al.: Shift of seed mass and fruit type spectra along longitudinal gradient
Table 2. Species richness (no. per sample area) or percentages for woody plants and herbs (%) as well as abundance (individual m−2 ) and
canopy coverage (%) in five ecosystem types.
Ecosystem types Sites Woody species Herbaceous species Abundance Canopy
Richness Percentage Richness Percentage coverage
Forests Qingyuan 11 ± 2 40.0 ± 4.5 16 ± 1 60.0 ± 4.5 30 ± 9 80–90
Sparse forests Sanggendalai 5±2 18.0 ± 5.2 24 ± 2 82.0 ± 5.2 126 ± 8 20–40
Typical steppe Sanggendalai 1±1 6.67 ± 4.44 19 ± 5 93.3 ± 4.4 458 ± 54 5–10
Desert grasslands Erlianhaote 2±0 17.0 ± 4.0 8±1 83.0 ± 4.0 23 ± 7S. Yu et al.: Shift of seed mass and fruit type spectra along longitudinal gradient 661
Figure 3. Relationships between average seed mass of communities
and longitude (a, b) and phylogenetic diversity (c, d). The average
seed mass declines as longitude rises, and it reaches its bottom at
around 114◦ , after which that it increases. But average seed mass
does not have a significant relationship with phylogenetic diversity
(p > 0.05).
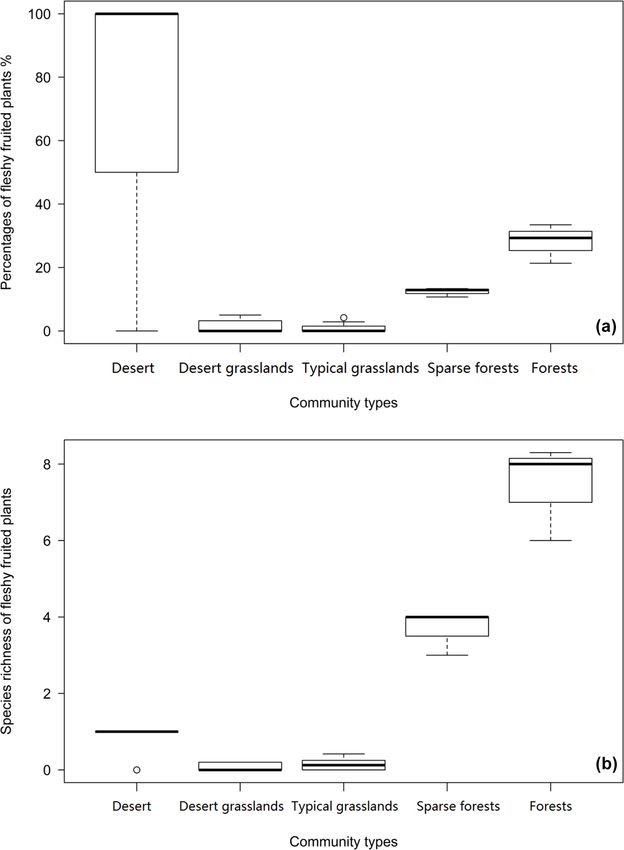
3.5 Species richness and proportion of fleshy-fruited Figure 4. Proportions (a) and species richness (b) of plants with
species fleshy fruits decline gradually from forests through sparse forests
to (typical and desert) grasslands but increase in deserts (the same
Among the five community types, forests have the high- letter indicates difference is insignificant at p > 0.05).
est number (7.44 ± 1.26) and proportion (28.05 ± 6.16) of
fleshy-fruited species, while desert grasslands have the
lowest number (0.06 ± 0.097) and typical grasslands have
the lowest proportion (1.00 ± 1.49) (Fig. 4). Fleshy-fruited between proportions of fleshy-fruited species and lati-
species richness (F = 22.25 p = 0.00919) and proportion tude (R 2 = −0.0396, p = 0.8272) as well as MAP (R 2 =
(F = 18.61, p = 0.0125) in sparse forests are significantly −0.0389, p = 0.8009), and no strong relationships between
smaller than those in forests. The desert has higher fleshy- fleshy-fruited species richness and latitude (R 2 = 0.0408,
fruited species richness (F = 6.081, p = 0.0239) and pro- p = 0.8899) as well as MAT (R 2 = 0.0414, p = 0.9416).
portion (F = 24.9, p < 0.0001) than desert grasslands. From desert through desert grassland to typical grassland,
Sparse forests have remarkably higher fleshy-fruited species significantly positive correlations were found between rich-
richness (F = 281.3, p = 0.000) and proportion (F = 78.6, ness of fleshy-fruited species and longitude (R = 0.3466,
p = 0.0009) than typical grasslands (Fig. 4). p = 0.0019) and MAP (R 2 = 0.284, p = 0.0052), while
there were no significant correlations between the propor-
3.6 Fleshy-fruited species relations to environmental tion of fleshy-fruited species and MAT (R 2 = 0.1295, p =
factors 0.0513). From typical grassland to the forests, remark-
able correlations occurred between the proportion of fleshy-
Fleshy-fruited species richness was significantly associated fruited species and longitude (R 2 = 0.324, p = 0.00418) and
with longitude (R 2 = 0.1691, p = 0.02113) and MAP (R 2 = MAP (R 2 = 0.324, p = 0.00418); however, no significant re-
0.4749, p = 0.0000) across the 26 sample sites. Signifi- lationships were found between MAT and proportion (R 2 =
cantly positive correlation existed between the proportions −0.0519, p = 0.9065) and species richness (R 2 = −0.0522,
of species with fleshy fruits and MAT (R 2 = 0.1172, p = p = 0.93) of fleshy-fruited plants. The number of species
0.0486), while the correlation with elevation (R 2 = 0.0938, with fleshy fruits increased with longitude (p = 0.022) and
p = 0.0703) and longitude (R 2 = 0.0831, p = 0.0832) was the number of families (p = 0.005; Fig. 5a–b), but correla-
weak. In addition, there were no significant relationships tions with number of genera and phylogenetic diversity were
https://doi.org/10.5194/bg-18-655-2021 Biogeosciences, 18, 655–667, 2021662 S. Yu et al.: Shift of seed mass and fruit type spectra along longitudinal gradient
portant to certain vegetation syndromes such as high seed
mass and high fruit water content (Moles et al., 2014). High
water availability can potentially produce high assimilation
products, and high temperature (in the normal range of plant
growth) can increase water availability.
In this study the average seed mass of each biome displays
congruent distribution patterns to plant growth form spectra
variation (Table 2, Fig. 1). General linear models (GLMs) re-
vealed significant relationships between seed mass and each
of the variables predicted to influence the longitudinal gra-
dient in seed mass: plant growth form (99.76 %), vegetation
types (99.01 %) and seed dispersal syndrome (99.88 %), as
each variable reflects different profiles of biome syndromes,
not being independent effect factors to the seed mass. Such
patterns have previously been attributed mostly to a corre-
spondence of seed mass to plant growth form and seed dis-
persal syndrome, which themselves are driven by climatic
Figure 5. Relationships between the number of species with fleshy and environmental variations (Moles et al., 2005a, 2007).
fruits and longitude (a), number of families and genera (b, c) as well In Inner Mongolia, typical grasslands are often composed
as phylogenetic diversity (d). The number of species with fleshy mainly of grasses (many of which are biennial and perennial)
fruits increases as longitude increases. But it does not have a signif- that are small-seeded (Fig. 2), whereas trees and lianas that
icant relationship with phylogenetic diversity (p > 0.05). dominate forests and shrubs that dominate deserts have the
largest seeds (Fig. 2). Large seeds were proved to be often as-
sociated with woody growth forms (Salisbury, 1942; Baker,
not significant (p = 0.056 and 0.058, respectively; Fig. 5c– 1972; Silvertown, 1981; Mazer, 1989; Jurado et al., 1991;
d). Leishman and Westoby, 1994; Moles et al., 2005a, b). This
pattern is often attributed to woody plants’ better capability
3.7 Phylogenetic signals and their shift along to take up (Schenk and Jackson, 2002; Li et al., 2002; Qi et
longitudinal gradient al., 2019) and store resources and to buffer the effects of en-
vironmental variations on seed size (Weiner, 2004; Moles et
Most phylogenetic signals (k values) are weak (from 0.234
al., 2005a), or to reduced evaporation for understory species
to 0.688, p > 0.05) for the five biome types and for most
(Yu et al., 2017). Surely, woody species, on average, having
sample plots except Naimanqi (1.928, p < 0.05) in the early-
larger leaves, can produce more photosynthate to invest in
successional stage. No significant relationships are found be-
seeds (Díaz et al., 2016).
tween phylogenetic signals (k values) and longitude across
It is possible that larger seeds are more common in
26 sample sites (R = 0.0403, p = 0.8596). Both from desert
drought-prone habitats most likely because they allow
(to desert grasslands) to typical grasslands (R = 0.047, p =
seedlings to establish large root systems early, with a better
0.9123) and from typical grasslands to the forests (R =
chance of surviving drought (Baker, 1972; Salisbury, 1974).
0.0401, p = 0.6382), phylogenetic signals were not related
In this study, desert grassland and desert ecosystems are
to longitude for the five community types.
found to be dominated by shrubs that often possess larger
seeds (Fig. 2). In the Inner Mongolian plateau these species
4 Discussion are seldom exposed to strong interspecies competition or
shading that make the plants invest more in propagules than
4.1 Variation of seed mass spectra and environmental in vegetative apparatus for competitive strength (Bai et al.,
factors 2008). In addition, relatively high species richness and the
highest number of species occurred in this typical steppe
There is a strong and consistent effect of community type grassland (Table 2), and in contrast, desert steppe had very
(along a longitudinal gradient) on seed mass (Figs. 1, 3). The low species richness and a low number of individuals (abun-
average seed mass displays a significantly declining trend dance) (Table 2).
along decreasing longitude from forests to typical grasslands With increasing MAP, the richness of wind dispersed
and then to some sites in desert grasslands in this region species decreased (Table S3, Fig. S1 in the Supplement).
(Fig. 3). In these sites, average seed mass was found to have The proportion of vertebrate dispersed species in typical
a significantly positive relationship with MAP and weakly grasslands was the lowest in comparison to other commu-
positive relationship with MAT. The combined effects of pre- nities (Fig. S1). The patterns of seed dispersal syndromes
cipitation and temperature may be, to some extent, most im- observed in this study are congruent with previous find-
Biogeosciences, 18, 655–667, 2021 https://doi.org/10.5194/bg-18-655-2021S. Yu et al.: Shift of seed mass and fruit type spectra along longitudinal gradient 663
ings in Australia’s subtropics (Butler et al., 2007). Biotic may be related to low evaporation and high water availabil-
dispersal agents exert a strong selective pressure on an- ity in plants (Fig. 6). We suggest that, as an ecological strat-
giosperm species with various seed size in the Inner Mon- egy, the derivation and evolution of species with large seeds
golian plateau, as evidenced by the evolution of a wide range may be due to improved water accommodation in plants by
of adaptations for dispersal of animals (such as ants, birds, strong resource acquisition ability (such as having a strong
squirrels). water absorbing root system and advanced water conductive
ability) or water retention ability (such as habituating shaded
4.2 Variation of fruit type spectrum and associations of environments or developing small, thick leaves and hair or
seed mass with fruit types waxiness on leaves to prevent water loss) (Baker, 1972; Fon-
seca et al., 2000). Plant species have evolved various ecolog-
Fleshy-fruited species richness significantly corresponded to ical strategies to match their environments (Laughlin, 2014).
gradual changes of climate, especially for MAP (Table 1). These strategies are manifested in many plant organs and
The smallest proportion of fleshy-fruited species occurred traits. In the present study, seed mass is strongly connected
in typical grasslands and desert grasslands (Fig. 3), in the with other biological characteristics such as plant dispersal
middle zone of Inner Mongolia. Previous findings showed ability (Fig. S1; Table 3), fruit types and growth forms. For
that fleshy-fruited species were often associated with shaded example, there is a rising trend in average leaf area (Wright
habitats, mature forests, tropical forests, regions with lower et al., 2004) and water-conducting conduits (Wheele et al.,
elevations and woody life forms (summarized in Yu et al., 2007; Zanne et al., 2014) along increasing longitude (or de-
2017), indicating high canopy coverage and low evaporation clining latitude and elevation). Seed mass is also sure to
(Fig. 6). The increasing prevalence of canopy coverage (Ta- be coordinated with conducting issues of plant apparatus
ble 2, Fig. 4) with increasing fleshy-fruited species is proba- (Wheele et al., 2007; Zanne et al., 2014). Anatomical struc-
bly related to the prominence of species with larger seeds in tures of lots of species indicated that the species with large
such habitats. Previous hypotheses suggest that fleshy fruit seeds or fleshy fruits often have wide and long vessel ele-
evolution is related to water availability and the ineffective- ments that can provide much more water (Carlquist, 1975;
ness of wind-assisted dispersal beneath a dense canopy (But- Zimmermann, 1983). As suggested before, seed mass also is
ler et al., 2007; Yu et al., 2017). The reduced dispersal capa- likely to be a result of co-evolution among various organs that
bility following from an increase in seed mass may be coun- determine plant responses to changing abiotic factors (Díaz
terbalanced by the evolution of traits mediating seed disper- and Cabido, 1997; Sandel et al., 2010).
sal by animals, such as fleshy fruits. Alternatively, increasing In light of growth allometry theory, average seed mass
water availability may promote the evolution of species with variation should converge with community total biomass
fleshy fruits (Bolmgren and Eriksson, 2005; Yu et al., 2017) (Demalach and Kadmon, 2018). Evidently, spatial distribu-
and large seeds. tions of community-level seed mass and NPP consistency
correspond (Moles and Westoby, 2003; Murray et al., 2003;
4.3 Ecological and evolutionary drivers of seed mass Griffiths and Lawes, 2006; Chen et al., 2007; Chen et al.,
variations 2011). Indeed, in Inner Mongolia ANPP (aboveground net
primary production) and RUE (rain-use efficiency) increased
A consistent combination was found between the posses- in space across different communities or ecosystems with in-
sion of fleshy fruits and heavier seeds when comparing seed creasing MAP eastwards (Bai et al., 2008), showing similar
mass among clades with fleshy and non-fleshy fruits (Fig. 2, variation trends with the average seed mass of the biomes.
Tables S1, S2). The results were largely in agreement with Both soil moisture and soil nutrients (total N) were found to
previous findings (Eriksson et al., 2000; Butler et al., 2007; decrease significantly in Inner Mongolia from east to west
Bolmgren and Eriksson, 2010). A possible explanation may (Liu et al., 2017), showing a similar variation trend with
be that woody species have larger internal water surpluses ANPP and seed mass. Moreover, water retention of plants is
and photosynthate to invest in their seeds and fruits. Accord- becoming unfavorable with an increase in evaporation west-
ingly, the formation of seed mass may also be related to plant wards (Table 1).
resource acquisition and allocation strategies or to the allo- In previous studies, soil moisture was found to not corre-
metric growth of plant apparatus (Weiner, 2004; Price et al., late with the relative abundance of fleshy-fruited species due
2007; Demalach and Kadmon, 2018). to low temperature on water availability constraints (Yu et al.,
As a result of evolution for high water availability, large 2017). As we know, seed plants employ two main strategies
seeds are often associated with low latitude (Moles et al., to increase water use efficiency: one is to take up more water
2007) and low elevation (Bu et al., 2007), or with shaded through strong root systems and the other is reducing wa-
habitats such as northern slopes (Csontos et al., 2004) and ter loss through low evapotranspiration. In our study, canopy
closed vegetation (Mazer, 1989; Hammond and Brown, coverage decreases from forests to sparse forests and then
1995) and with late successional stages (Hammond and to grasslands and desert grasslands (Table 2). This leads to
Brown, 1995). All those phenomena indicate that seed mass a gradual reduction in fleshy-fruited or large-seeded species
https://doi.org/10.5194/bg-18-655-2021 Biogeosciences, 18, 655–667, 2021664 S. Yu et al.: Shift of seed mass and fruit type spectra along longitudinal gradient
Figure 6. Mechanistic frameworks of large seeded species formation and corresponding increment process of community average seed mass.
richness (Fig. 5; Table 2). However, since fleshy fruits have leaf or fruits to prevent water loss), that favor water reten-
high water content and thus require higher plant internal wa- tion in the plant body would also be useful in increasing seed
ter content (Yu et al., 2017), we suggest the correspondence mass or fruit water content.
of seed size and fruit water content implies that some species In order to understand variation mechanisms of seed mass
evolved to contain more water or photosynthate in multiple better, a simple mechanistic model is provided to try to quan-
body parts. Furthermore, CO2 concentration is generally the titatively explain average (or total) seed mass variation be-
same everywhere, and although there is some small varia- tween communities for one species as follows:
tion during growth seasons (Wang et al., 2002), its impact Xn
on seed mass variation patterns should be disregarded. So- St = C B (C < 1),
i=1 i1 t i1
lar radiation variation is not very large along longitude (see Xn
Sa = 1/n i=1 Ci1 Bt (Ci1 < 1),
site description) especially among typical grasslands, desert
grasslands and deserts with similar elevation; therefore, its Bt = Bid + Bi0 + Bl .
effect on seed mass variation is very small, since light is not
a limited factor for growth in northern China according to our St is the total seed mass of all species in a community, Sa
observation. Variation trends of sunshine hours or light inten- is the average seed mass per species taken from the total
sity are contrary to that of rainfall amount along longitude. community (St /n), n is the number of species in a commu-
Only when water remains sufficient may strong light favor nity, and Ci1 is the allometric growth coefficient (or alloca-
plant growth and increase seed mass. For example, a com- tion portion to seeds) that differ among species. Bt is total
bination of much more belowground water with more sun- biomass from photosynthate per species. Bid value is the
shine hours or higher light intensity in Erjina may increase biomass of photosynthate related to water from conducting
its average seed mass, and this may be responsible for larger issues for one species, Bi0 is the biomass of photosynthate
seed mass in deserts than in some sites of desert grasslands. related to water from other approaches (for instances, less-
Therefore, combined with previous results of other studies, ening evaporation), Bl is the biomass of photosynthate re-
we deduce that drivers of seed mass spatial distribution pat- lated to leaf area (Fig. 6). As we know, ecological factors
terns include temperature, rainfall, solar radiation, soil mois- affecting St are numerous. St will be developed according
ture and nutrients, leaf area canopy coverage, and their inter- to other sufficient data bases. For instance, seed developing
actions; however, high water availability in plant body may time, sunshine duration and intensity, and belowground wa-
be the most vital driving factor in shaping seed mass spatial ter may affect Bt ; however, their extent and effects will be
distribution patterns. According to growth allometry, a frac- further defined in the future to improve and perfect Bt .
tion of photosynthate, coming from each increment of tem- Generally, seed mass is quite phylogenetically conserva-
perature, rainfall, soil moisture and nutrients, leaf area, and tive (Lord et al., 1995). However, in this study, phylogenetic
canopy coverage, is considered to be allocated to seeds. In signal is weak across the 26 sites (Table 1), and the phy-
addition, biological structures (such as hair or waxiness on logenetic signal is found to be not so involved in the rela-
tionships between seed mass and longitude, MAP and MAT
Biogeosciences, 18, 655–667, 2021 https://doi.org/10.5194/bg-18-655-2021S. Yu et al.: Shift of seed mass and fruit type spectra along longitudinal gradient 665
in the five biomes. This proves that the environmental fac- Competing interests. The authors declare that they have no conflict
tors affect seed mass variation in the community context, and of interest.
phylogenetic constraints are not significant (Figs. 3, 4). The
five communities are in middle or late successional stages in
which the main construction process is environmental filter- Financial support. This research has been supported by the Na-
ing effect rather than competitive exclusion (Norden et al., tional Natural Science Foundation of China (grant nos. 40771070
2012). and 41171041) and the Beijing Natural Science Foundation (grant
no. 5092015).
In addition, in this study we just measure the soil mois-
ture of the top 10 cm, which mainly influences the growth of
herbs, but for the growth of shrubs and trees, rich soil wa-
Review statement. This paper was edited by Anja Rammig and re-
ter below the depth of 10 cm in some areas of Ejinaqi is also viewed by four anonymous referees.
useful. As mentioned above, combination of much more be-
lowground water with more sunshine hours or higher light
intensity in Erjina may increase seed mass and shape the
present seed mass variation patterns in this region. Moreover,
ecological-scale and micro-environmental heterogeneity of- References
ten affects results of functional traits along biogeographical
gradients, so further study may be necessary on a larger scale Ackerly, D. and Donoghue, M.: Leaf size, sapling allometry, and
(or large investigation area) to identify the results of this ar- Corner’s rules: phylogeny and correlated evolution in maples
ticle. (Acer), Am. Nat., 152, 767–791, 1998.
Adamski, N. M., Anastasiou, E., Eriksson, S., O’Neill, C. M.,
and Lenhard, M.: Local maternal control of seed size by
5 Conclusions KLUH/CYP78A5-dependent growth signaling, P. Natl. Acad.
Sci. USA, 106, 20115–20120, 2009.
Mean seed mass, seed dispersal spectra, fruit type spectra and Bai, Y., Wu, J., Xing, Q., Pan, Q., Huang, J., Yang, D., and Han,
plant growth form spectra of five biome types vary signifi- X.: Primary production and rain use efficiency across a precipita-
tion gradient on the Mongolia plateau, Ecology, 89, 2140–2153,
cantly along a longitudinal gradient, with the lowest average
2008.
seed mass and the smallest proportion of species dispersed by
Baker, H. G.: Seed weight in relation to environmental conditions
vertebrates occurring at the middle longitude (typical grass- in California, Ecology, 53, 997–1010, 1972.
lands). The selection for these propagule attributes is most Blomberg, S. P., Garland, T., and Ives, A. R.: Testing for phyloge-
likely to be driven by external and internal drivers (Fig. 6); netic signal in comparative data: behavioral traits are more labile,
however, water availability potentials and growth allometry Evolution, 57, 717, 2003.
may be key drivers of seed mass variation along climatic gra- Bolmgren, K. and Eriksson, O.: Fleshy fruits – origins, niche shifts,
dients or resource gradients. Larger seeded species or species and diversification, Oikos, 109, 255–272, 2005.
with fleshy fruits may have evolved due to much photosyn- Bolmgren, K. and Eriksson, O.: Seed mass and the evolution of
thate or high water availability in plants. Our findings can fleshy fruits in angiosperms, Oikos, 119, 707–718, 2010.
provide help in understanding the origin and evolution of Bu, H., Chen, X., Xu, X., Liu, K., Jia, P., and Du, G.: Seed mass and
germination in an alpine meadow on the eastern Tsinghai-Tibet
species with large seeds or fleshy fruits.
plateau, Plan. Ecol., 191, 127–149, 2007.
Butler, D., Green, R. J., Lamb, D., McDonald, W., and Forster, P.:
Biogeography of seed-dispersal syndromes, life-forms and seed
Data availability. The data for this article were uploaded in the sizes among woody rain-forest plants in Australia’s subtropics,
Dataset of Dryad and are available on the following website: J. Biogeogr., 34, 1736–1750, 2007.
https://doi.org/10.5061/dryad.vq83bk3rq (Yu et al., 2021). Carlquist, S.: Ecological Strategies of Xylem Evolution, University
of California Press, Berkeley and Los Angeles, USA, 1975.
Chen, B., Wang, S. Q., Liu, R. G., and Song, T.: Study on mod-
Supplement. The supplement related to this article is available on- eling and spatial pattern of net primary production in China’ s
line at: https://doi.org/10.5194/bg-18-655-2021-supplement. terrestrial ecosystem, Res. Sci., 29, 47–53, 2007.
Chen, F., Shen, Y. J., Li, Q., Guo, Y., and Xu, L. M.: Spatio-temporal
variation analysis of ecological systems NPP in China in past 30
Author contributions. SY led data collection and analysis, con- years, Sci. Geol. Sin., 31, 1409–1414, 2011.
ceived the idea, and led the writing of the paper. GW and DL took Csontos, P., Tamás, J., and Padani, J.: Slope aspect affects seed mass
part in data collection and analysis. OK assisted in paper writing. spectrum of grassland vegetation, Seed Sci. Res., 14, 379–385,
CL carried out phylogenetic analysis. QW provided soil moisture 2004.
data. MY gave critical revision suggestions on an early draft. All Demalach, N. and Kadmon, R.: Seed mass diversity along resource
authors contributed critically to the drafts and gave final approval gradients: the role of allometric growth rate and size-asymmetric
for publication. competition, Ecology, 99, 2196–2206, 2018.
https://doi.org/10.5194/bg-18-655-2021 Biogeosciences, 18, 655–667, 2021666 S. Yu et al.: Shift of seed mass and fruit type spectra along longitudinal gradient
Demalach, N., Ron, R., and Kadmon, R.: Mechanisms of seed Li, H. L., Dong, Z., Wang, L. H., and Hao, Y. L.: Study on the root
mass variation along resource gradients, Ecol. Lett., 22, 181– distribution characteristic and biomass of Ulmus pumila in Hun-
189, 2019. shandake Sands, J. Arid Land Res. Environ., 16, 99–105, 2002.
Díaz, S. and Cabido, M.: Plant functional types and ecosystem func- Liu, D., Zhu, W., Wang, X., Pan, Y., Wang, C., Xi, D., Bai, E.,
tion in relation to global change, J. Veg. Sci., 8, 463–474, 1997. Wang, Y., Han, X., and Fang, Y.: Abiotic versus biotic controls on
Díaz, S., Kattge, J., Cornelissen, J. H. C. Wright, I. J., and Gorné, soil nitrogen cycling in drylands along a 3200 km transect, Bio-
L. D.: The global spectrum of plant form and function, Nature, geosciences, 14, 989–1001, https://doi.org/10.5194/bg-14-989-
529, 167–171, 2016. 2017, 2017.
Editorial Committee for Vegetation of China: Vegetation of China, Liu, H. L., Zhang, D. Y., Duan, S. M., Wang, X. Y., and Song, M.
Science Press, Beijing, China, 1980. F.: The relationship between diaspore characteristics with phy-
Editorial Committee of Chinese Flora: Flora of China, Science logeny, life history traits, and their ecological adaptation of 150
Press, Beijing, China, 2004 (in Chinese). species from the cold desert of northwest China, Sci. World J.,
Eriksson, O., Friis, E. M., and Löfgren, P.: Seed size, fruit size, and 16, 436, https://doi.org/10.1155/2014/510343, 2014.
dispersal systems in angiosperms from the Early Cretaceous to Lord, J., Westoby, M., and Leishman, M.: Seed size and phy-
the Late Tertiary, Am. Nat., 156, 47–58, 2000. logeny in six temperate floras: constraints, niche conservatism,
Faith, D. P.: Conservation evaluation and phylogenetic diversity, and adaptation, Am. Nat., 146, 349–364, 1995.
Biol. Conser., 61, 1–10, 1992. Mazer, S. J.: Ecological, taxonomic, and life history correlates of
Fonseca, C. R., Overton, J. M., Collins, B., and Westoby, M.: Shifts seed mass among Indiana dune angiosperms, Ecol. Monograp.,
in trait-combinations along rainfall and phosphorus gradients, J. 59, 153–175, 1989.
Ecol., 88, 964–977, 2000. Moles, A. T. and Westoby, M.: Latitude, seed predation and seed
Foster, S. and Janson, C. H.: The relationship between seed size and mass, J. Biogeogr., 30, 105–128, 2003.
establishment conditions in tropical woody plants, Ecology, 66, Moles, A. T., Ackerly, D. D., Webb, C. O., Tweddle, J. C., Dickie, J.
773–780, 1985. B., and Westoby, M.: A brief history of seed size, Science, 307,
Garnier, E.: Growth analysis of congeneric annual and perennial 576–580, 2005a.
grass species, J. Ecol., 80, 665–675, 1992. Moles, A. T., Acherly, D. D., Webb, C. O., Tweddle, J. C., Dickie, J.
Greene, D. F. and Johnson, E. A.: Seed mass and dispersal capacity B., Pitman, A. J., and Westoby, M.: Factors that shape seed mass
in wind-dispersed diaspores, Oikos, 76, 211–220, 1993. evolution, P. Natl. Acad. Sci. USA, 102, 10540–10544, 2005b.
Griffiths, M. E. and Lawes, M. J.: Biogeographic, environmental, Moles, A. T., Ackerly, D. D., Tweddle, J. C., Dickie, J. B., Smith,
and phylogenetic influences on reproductive traits in subtropical R., Leishman, M. R., Pitman, M. M., Mayfield, A., Wood, J., and
forest trees, South Africa, Ecography, 29, 614–622, 2006. Westoby, M.: Global patterns in seed size, Glob. Ecol. Biogeogr.,
Guo, H., Mazer, S. J., and Du, G. Z.: Geographic variation in seed 16, 109–116, 2007.
mass within and among nine species of Pedicularis (Oroban- Moles, A. T., Perkins, S. E., Laffan, S. W., Flores-Moreno, H.,
chaceae): effects of elevation, plant size and seed number per Awasthy, M., Tindall, M. L., Sack, L., Pitman, A., Kattge, J.,
fruit, J. Ecol., 98, 1232–1242, 2010. and Aarssen, L. W.: Which is a better predictor of plant traits:
Hallett, L. M., Standish, R. J., and Hobbs, R. J.: Seed mass and temperature or precipitation?, J. Veg. Sci., 25, 1167–1180, 2014.
summer drought survival in a Mediterranean-climate ecosystem, Murray, B. R., Brown, A., and Grace, J.: Geographic gradients in
Plant Ecol., 212, 1479–1489, 2011. seed size among and within perennial Australian Glycine species,
Hammond, D. and Brown, V.: Seed size of woody plants in rela- Aus. J. Bot. 51, 47–56, 2003.
tion to disturbance, dispersal, soil type in wet neotropical forests, Murray, B. R., Brown, A., Dickman, C., and Crowther, M.: Geo-
Ecology, 76, 2544–2561, 1995. graphical gradients in seed mass in relation to climate, J. Bio-
Herrera, C. M.: Seed dispersal by vertebrates, in: Plant-animal in- geogr., 31, 379–388, 2004.
teractions: An evolutionary approach, edited by: Herrera, C. M. Nimon, K., Oswald, F., and Roberts, J. K.: yhat: Interpreting Re-
and Pellmyr, O., Blackwell Publishing, Oxford, UK, 185–208, gression Effects, R package version 2.0-0, availabe at: https:
2005. //CRAN.R-project.org/package=yhat (last access: 8 July 2019),
Howe, H. F. and Smallwood, J.: Ecology of seed dispersal, Ann. 2013.
Rev. Ecol. Syst., 13, 201–228, 1982. Norden, N., Letcher, S. G., Boukili, V., Swenson, N. G., and Chaz-
Hughes, L., Dunlop, M., French, K., Leishman, M. R., Rice, B., don, R.: Demographic drivers of successional changes in phylo-
Rodgerson, L., and Westoby, M.: Predicting dispersal spectra: a genetic structure across life-history stages in plant communities,
minimal set of hypotheses based on plant attributes, J. Ecol., 82, Ecology, 93, 70–82, 2012.
933–950, 1994. Pagel, M.: Inferring the historical patterns of biological evolution,
Jurado, E., Westoby, M., and Nelson, D.: Diaspore weight, disper- Nature, 401, 877–884, 1999.
sal, growth form and perenniality of central Australian plants, J. Price, C. A., Enqist, B. J., and Savage, V. M.: A general model for
Ecol., 79, 811–828, 1991. allometric covariation in botanical form and function, P. Natl.
Laughlin, D. C.: The intrinsic dimensionality of plant traits and its Acad. Sci. USA, 104, 13204–13209, 2007.
relevance to community assembly, J. Ecol., 102, 186–193, 2014. Primack, R. B.: Relationships among flowers, fruits and seeds, Ann.
Leishman, M. R. and Westoby, M.: Hypotheses on seed size: tests Rev. Ecol. Syst., 18, 409–430, 1987.
using the semiarid flora of western New South Wales, Australia, Qi, K., Xin, Z., Zhang, J., and Zhu, Y.: Root distribution character-
Am. Nat., 143, 890–906, 1994. istics of Ammopiptanthus mongolicus community in Ulan Buh
Desert, Pratacultu. Sci., 36, 1706–1715, 2019.
Biogeosciences, 18, 655–667, 2021 https://doi.org/10.5194/bg-18-655-2021S. Yu et al.: Shift of seed mass and fruit type spectra along longitudinal gradient 667 R Core Team: R: A language and environment for statistical com- Weiner, J.: Allocation, plasticity and allometry in plants, Perspec. puting, R Foundation for Statistical Computing, Vienna, Austria, Plant Ecol. Evol. Syst., 6, 207–215, 2004. availabe at: https://www.R-project.org/, last access: 1 July 2018. Westoby, M., Falster, D. S., Moles, A. T., Vesk, P. A., and Wright, I. Revell, L. J., Harmon, L. J., Collar, D. C.: Phylogenetic signal, evo- J.: Plant ecological strategies: some leading dimensions of varia- lutionary process, and rate, Syst. Biol., 57, 591–601, 2008. tion between species, Ann. Rev. Ecol. Sys., 33, 125–159, 2002. Salisbury, E. J.: The productive capacity of plants, G. Bell and Wheele, E. A., Baas, P., and Rodgers, S.: Variations in dicot wood Sons., London, UK, 1942. anatomy: a global analysis based on the inside wood database, Salisbury, E. J.: Seed size and mass in relation to environment, Proc. IAWA J., 28, 229–258, 2007. Roy. Soc. London Seri. B. Biol. Sci., 186, 83–88, 1974. Wright, I. J., Reich, P. B., Westoby, M., Ackerly, D. D., Baruch, Sandel, B., Goldstein, L. J., Kraft, N. J., Okie, J. G., Shuldman, M. Z., Bongers, F., Cavender-Bares, J., Chapin, T., Cornelissen, J. I., Ackerly, D. D., Cleland, E. E., and Suding, K. N.: Contrast- H. C., and Diemer, M.: The worldwide leaf economics spectrum, ing trait responses in plant communities to experimental and ge- Nature, 428, 821–827, 2004. ographic variation in precipitation, New Phytol., 188, 565–575, Yu, S. L., Katz, O., Fang, W. W., Li, D. F., Sang, W. G., and Liu, 2010. C. R.: Shift of fleshy fruited species along elevation: tempera- Schenk, H. J. and Jackson, R. B.: Rooting depths, lateral root ture, canopy coverage, phylogeny and origin, Sci. Rep., 7, 40417, spreads and below-ground/above-ground allometries of plants in https://doi.org/10.1038/srep40417, 2017. water-limited ecosystems, J. Ecol., 90, 480–494, 2002. Yu, S. L., Wang, G. X, Katz, O., Li, D. F., Wang, Q. B., Yue, M., Silvertown, J. W.: Seed size, life span, and germination date as and Liu, C. R.: Shift of seed mass and fruit type spectra along coadapted features of plant life history, Am. Nat., 118, 860–864, longitudinal gradient: high water availability and growth allom- 1981. etry, Dataset of Dryad, https://doi.org/10.5061/dryad.vq83bk3rq, Tautenhahn, S., Heilmeier, H., Götzenberger, L., Klotz, S., Wirth, 2021. C., and Kühn I.: On the biogeography of seed mass in Germany Zanne, A. E., Tank, D. C., Cornwell, W. K., Eastman, J. M., Smith, – distribution patterns and environmental correlates, Ecography, S. A., FitzJohn, R. G., McGlinn, D. J., O’Meara, B. C., Moles, 31, 457–468, 2008 A. T., Reich, P. B., Royer, D. L., Soltis, D. E., Stevens, P. F., Telenius, A. and Torstensson, P.: Seed wings in relation to seed size Westoby, M., Wright, I. J., Aarssen, L., Bertin, R. I., Calaminus, in the genus Spergularia, Oikos, 61, 216–222, 1991. A., Govaerts, R., Hemmings, F., Leishman, M. R., Oleksyn, J., Venable, D. L.: Size-number trade-offs and the variation of seed size Soltis, P. S., Swenson, N. G., Warman, L., and Beaulieu, J. M.: with plant resource status, Am. Nat., 140, 287–304, 1992. Three keys to the radiation of angiosperms into freezing environ- Wang, G. C., Wen, Y. P., Kong, Q. X., Ren, L. X., Wang, M. L.: ments, Nature, 506, 12872, https://doi.org/10.1038/nature12872, Background concentration and its variation of CO2 over China 2014. mainland, Chinese. Sci. Bull., 47, 780–783, 2002. Zimmermann, M.: Xylem Structure and the Ascent of Sap, Wang, L., He, L. L., Li, J., Zhao, J., Li, Z. C., and He, C. Y.: Regula- Springer, Berlin, Germany, 1983. tory change at Physalis Organ Size 1 correlates to natural varia- tion in tomatillo reproductive organ size, Nat. Commun. 5, 1–12, 2014. Webb, C. O., Ackerly, D. D., and Kembel, S. W.: Phylocom: soft- ware for the analysis of community phylogenetic structure and character evolution, available at: http://www.phylodiversity.net/ phylocom (last access: 8 June 2018), 2008. https://doi.org/10.5194/bg-18-655-2021 Biogeosciences, 18, 655–667, 2021
You can also read