Where Might We Find Ecologically Intact Communities? - Frontiers
←
→
Page content transcription
If your browser does not render page correctly, please read the page content below
ORIGINAL RESEARCH
                                                                                                                                                  published: 15 April 2021
                                                                                                                                           doi: 10.3389/ffgc.2021.626635

                                              Where Might We Find Ecologically
                                              Intact Communities?
                            Edited by:        Andrew J. Plumptre 1,2* † , Daniele Baisero 1† , R. Travis Belote 3 , Ella Vázquez-Domínguez 4† ,
                Manuel R. Guariguata,         Soren Faurby 5† , Włodzimierz Jȩdrzejewski 6† , Henry Kiara 7 , Hjalmar Kühl 8,9 ,
       Center for International Forestry      Ana Benítez-López 10† , Carlos Luna-Aranguré 4† , Maria Voigt 11 , Serge Wich 12,13 ,
         Research (CIFOR), Indonesia
                                              William Wint 14 , Juan Gallego-Zamorano 15† and Charlotte Boyd 16†
                          Reviewed by:
                                              1
                            Paola Isaacs,       Key Biodiversity Areas Secretariat, BirdLife International, Cambridge, United Kingdom, 2 Conservation Science Group,
    Alexander von Humboldt Biological         Department of Zoology, University of Cambridge, Cambridge, United Kingdom, 3 The Wilderness Society, Bozeman, MT,
         Resources Research Institute,        United States, 4 Instituto de Ecología, Universidad Nacional Autónoma de México, Ciudad Universitaria, Mexico City, Mexico,
                                              5
                               Colombia         Department of Biological and Environmental Sciences, University of Gothenburg, Gothenburg, Sweden, 6 Centro
                     Renato Crouzeilles,      de Ecología, Instituto Venezolano de Investigaciones Científicas (IVIC), Caracas, Venezuela, 7 International Livestock
International Institute for Sustainability,   Research Institute, Nairobi, Kenya, 8 Max Planck Institute for Evolutionary Anthropology, Department of Primatology, Leipzig,
                                Australia     Germany, 9 German Centre for Integrative Biodiversity Research (iDiv), Leipzig, Germany, 10 Integrative Ecology Group,
                     Marina Schmoeller,       Estación Biológica de Doñana (EBD-CSIC), Seville, Spain, 11 Durrell Institute of Conservation and Ecology (DICE), School
   Federal University of Rio de Janeiro,      of Anthropology and Conservation, University of Kent, Canterbury, United Kingdom, 12 School of Natural Sciences
                                    Brazil    and Psychology, Liverpool John Moores University, Liverpool, United Kingdom, 13 Institute for Biodiversity and Ecosystem
                                              Dynamics, University of Amsterdam, Amsterdam, Netherlands, 14 Environmental Research Group Oxford Ltd., Department
               *Correspondence:
                                              of Zoology, Oxford, United Kingdom, 15 Department of Environmental Science, Radboud University Nijmegen, Nijmegen,
                Andrew J. Plumptre
                                              Netherlands, 16 International Union for Conservation of Nature (IUCN) North America Office, Washington DC, WA,
  aplumptre@keybiodiversityareas.org
                                              United States
                             † ORCID:

                   Andrew J. Plumptre
     orcid.org/0000-0002-9333-4047            Conservation efforts should target the few remaining areas of the world that represent
                       Daniele Baisero        outstanding examples of ecological integrity and aim to restore ecological integrity to
     orcid.org/0000-0002-1266-7174
              Ella Vázquez-Domínguez          a much broader area of the world with intact habitat and minimal species loss while
     orcid.org/0000-0001-6131-2014            this is still possible. There have been many assessments of “intactness” in recent
                         Soren Faurby
                                              years but most of these use measures of anthropogenic impact at a site, rather than
     orcid.org/0000-0002-2974-2628
             Włodzimierz Jȩdrzejewski        faunal intactness or ecological integrity. This paper makes the first assessment of faunal
     orcid.org/0000-0002-9934-0683            intactness for the global terrestrial land surface and assesses how many ecoregions
                    Ana Benítez-López
     orcid.org/0000-0002-6432-1837            have sites that could qualify as Key Biodiversity Areas (KBAs – sites contributing
                 Carlos Luna-Aranguré         significantly to the global persistence of biodiversity) based on their outstanding
     orcid.org/0000-0002-7493-2092
                                              ecological integrity (under KBA Criterion C). Three datasets are combined on species
              Juan Gallego-Zamorano
     orcid.org/0000-0003-2317-5148            loss at sites to create a new spatially explicit map of numbers of species extirpated.
                        Charlotte Boyd        Based on this map it is estimated that no more than 2.9% of the land surface can be
     orcid.org/0000-0003-4095-9390
                                              considered to be faunally intact. Additionally, using habitat/density distribution data for
                    Specialty section:        15 large mammals we also make an initial assessment of areas where mammal densities
          This article was submitted to       are reduced, showing a further decrease in surface area to 2.8% of the land surface that
                    Forest Disturbance,
                a section of the journal      could be considered functionally intact. Only 11% of the functionally intact areas that
        Frontiers in Forests and Global       were identified are included within existing protected areas, and only 4% within existing
                                Change
                                              KBAs triggered by other criteria. Our findings show that the number of ecoregions that
       Received: 09 November 2020
          Accepted: 17 March 2021
                                              could qualify as Criterion C KBAs could potentially increase land area up to 20% if
           Published: 15 April 2021           their faunal composition was restored with the reintroduction of 1–5 species. Hence,

Frontiers in Forests and Global Change | www.frontiersin.org                         1                                              April 2021 | Volume 4 | Article 626635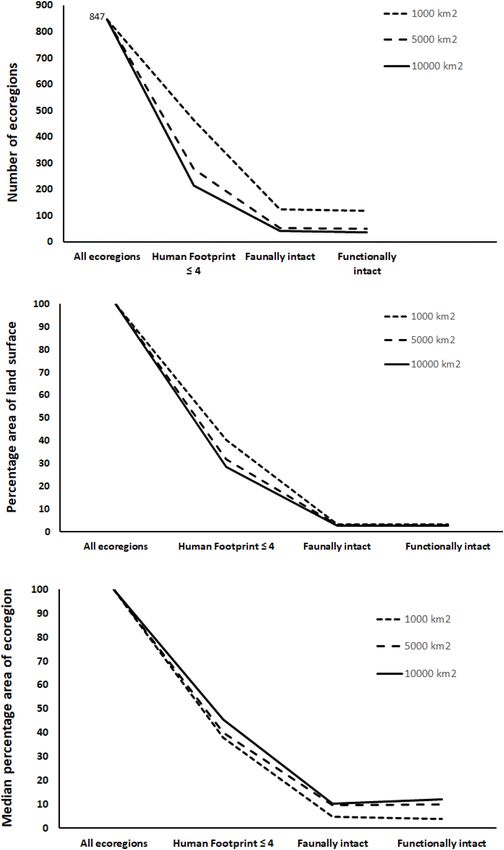
Plumptre et al.                                                                                                                   Scoping Ecological Integrity

                                           if all necessary requirements are met in order to reintroduce species and regain faunal
                                           integrity, this will increase ecological integrity across much of the area where human
                                           impacts are low (human footprint ≤4). Focusing restoration efforts in these areas could
                                           significantly increase the area of the planet with full ecological integrity.
                                           Keywords: ecological integrity, KBA, human impact, species restoration, faunal intactness, functional intactness

INTRODUCTION                                                                      or those known to be highly sensitive to human impact) and
                                                                                  absence (or very low levels) of direct industrial human impact (as
Ecologically intact ecosystems have long been recognized as                       quantified by appropriate indices at the scale of interest and verified
an important conservation objective for protection. Wilderness                    on the ground or in the water).” There is also a recommendation
areas were identified as important priorities over 30 years ago                   that Criterion C KBAs “should ideally be delineated to be at
(McCloskey and Spalding, 1989; Mittermeier et al., 1998), but                     least 10,000 km2 in size, within the confines of manageability”
more recently there have been attempts to be more explicit about                  and “based on historical bounds of variation using a regionally
what is being measured when referring to wilderness, with a                       appropriate benchmark (e.g., the past 500 years).” Ecological
focus on quantifying intact habitat (Potapov et al., 2008, 2017;                  integrity needs to be assessed against some regionally appropriate
Watson et al., 2016; Kennedy et al., 2019; Grantham et al., 2020)                 historical benchmark. Species distributions have been changing
and the values of intact habitat (Watson et al., 2018). Many                      for millennia because of human activity [e.g., the loss of large
assessments have focused on mapping anthropogenic influence                       mammals across continents (Sandom et al., 2014)] and we chose
(Human Footprint: Sanderson et al., 2002a; Venter et al., 2016b;                  to focus on changes that have occurred since the year 1500 AD,
Anthromes: Goldewijk et al., 2017; Global Human Modification:                     because this is the baseline date for assessing species extinctions
Kennedy et al., 2018; Low Impact Areas: Jacobson et al., 2019;                    within the IUCN Red List of Threatened species (IUCN, 2020).
Intact Forest: Potapov et al., 2008, 2017) and have generated                         Building on these definitions, we distinguish three types of
several maps of anthropogenic impact that independently                           intactness which together make up ecological integrity. Habitat
estimate that 20–40% of the earth’s terrestrial surface is under                  intactness occurs where there is no anthropogenic habitat
low human influence (Riggio et al., 2020). Recently, the integrity                conversion/transformation. Habitat intactness can be estimated
of natural ecosystems has been recognized as an important goal                    and monitored using remote sensing techniques and measures
in the post 2020 global biodiversity framework (CBD, 2020),                       of the impact of the human footprint on ecosystem structure,
and the value of intact forest also been recognized both for                      although it is easier to estimate for forests than some other
biodiversity conservation and for ecosystem services (Watson                      habitat types. However, habitat intactness does not necessarily
et al., 2018). Systematic identification of wilderness areas with                 equate to faunal intactness (Benítez-López et al., 2019; Plumptre
outstanding ecological integrity requires a clear definition of                   et al., 2019). Several studies have shown that habitats that appear
ecological integrity and indicators of intactness that can be used                intact are often missing large, wide-ranging species that play
to assess areas with potential ecological integrity at a global scale.            important ecological roles in the ecosystem (Morrison et al.,
    There is no clear definition of what is meant by intactness and               2007; Plumptre et al., 2019). Medium-size and even small species
the term is used loosely in the scientific literature. However, the               also play key ecological and functional roles in ecosystems (e.g.,
KBA Standard, published in 2016, following an extensive global                    small carnivores, bats), significantly contributing to integrity and
consultation process, provides a global standard for identifying                  intactness (Camargo-Sanabria et al., 2015; Brodie et al., 2018).
“sites contributing significantly to the global persistence of                    Faunal intactness is therefore differentiated here and occurs
biodiversity” (IUCN, 2016, p. 9). Five over-arching criteria are                  where there is no loss of faunal species. We also include the
used to identify KBAs, with Criterion C identifying sites of                      term functional intactness to refer to where there is no reduction
globally outstanding ecological integrity. The KBA Standard                       in faunal densities below ecologically functional densities to
defines Criterion C KBAs in terms of ecological intactness as:                    differentiate this intactness at sites from those where species
A site is one of ≤ 2 per ecoregion characterized by wholly                        are just present but at diminished density. Identifying sites with
intact ecological communities, comprising the composition and                     outstanding ecological integrity requires an assessment of habitat,
abundance of native species and their interactions. The KBA                       faunal and functional intactness.
Standard further defines “intact ecological community” as:                            Efforts to measure intactness to date have mostly mapped
“An ecological community having the complete complement                           human influence that is visible from remotely sensed data
of species known or expected to occur in a particular site                        (e.g., roads, human settlement, night lights, forest canopy
or ecosystem, relative to a regionally appropriate historical                     intactness, etc.) or where global-scale data are available from
benchmark, which will often correspond to pre-industrial times.”                  other sources of human activity (e.g., human population density;
The KBA Standard provides some guidance on how ecological                         livestock density, etc.), and thus provide measures of the human
integrity should be measured and states that it “should be observed               footprint on habitat/land cover change. Habitat loss and resulting
or inferred from both direct measures of species composition                      ecosystem degradation is one of the key drivers of species
and abundance/biomass across taxonomic groups (particularly for                   loss (Chase et al., 2020) but it is not the only driver. While
species indicative of long-term structural stability and functionality            measurements of the Human Footprint (HF) on habitat are

Frontiers in Forests and Global Change | www.frontiersin.org                  2                                         April 2021 | Volume 4 | Article 626635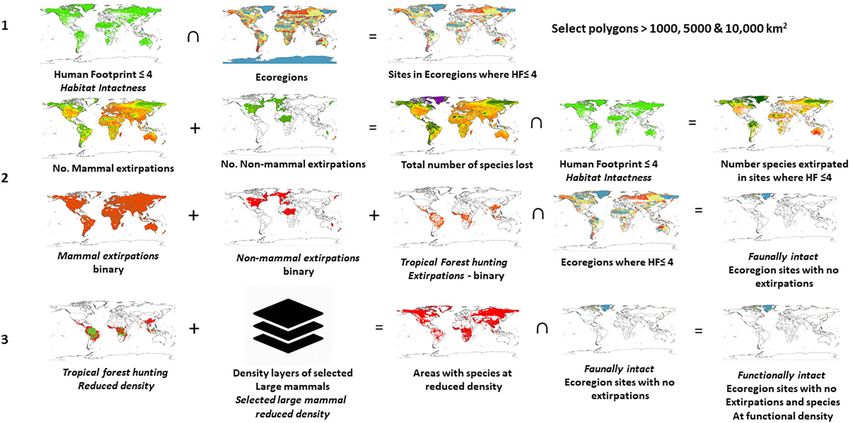
Plumptre et al.                                                                                                          Scoping Ecological Integrity

useful, they do not fully capture the effects of human activities          that are ecologically intact (i.e., low human footprint and
on biodiversity. Overexploitation, effects of invasive species, and        faunally intact and functionally intact). We then calculated the
disease, for example, are more difficult to assess using HF-type           percentage of the earth’s land surface and the number/percent of
datasets. In particular, hunting is one threat that is much more           ecoregion with at least one polygon remaining in the different
difficult to assess because hunters can penetrate large areas of           grades of intactness, and identified areas with potential for
intact habitat, spending days by moving camps, and this activity           restoration of ecological integrity through reintroduction of
is impossible to detect remotely (Redford, 1992; Peres et al.,             extirpated species.
2006). Benítez-López et al. (2019) provided the first attempt to
map the impact of hunting across the tropical forests of the
world, developing a model of hunting impacts using data from               MATERIALS AND METHODS
many local hunting studies from South America, Africa, and
Asia, and predicting mammal defaunation (both extirpation and              To undertake a global scoping of ecological integrity we used
reduction in density) across the tropical forested region. This            three main data layers and an analytical process to: (1) Identify
analysis showed that at least 50% of the tropical forests likely           areas where human impact is low; (2) Assess where species
have partial defaunation of their mammal biota, with 52% of                have been historically extirpated; and (3) Assess where species
Intact Forests and 62% of Wilderness Areas (where the Human                densities are low where this is likely to have been caused by
Footprint ≤ 2) being partially depleted of large mammals. Clearly          human influence.
habitat loss and hunting have compounded impacts on mammal
populations (Romero-Muñoz et al., 2020); reducing the area of              Areas of Low Human Impact
occupied habitat by more than half, with 29% of the total area             We used the Human Footprint (HF) map (Venter et al., 2016a)
attributed to hunting activities (Gallego-Zamorano et al., 2020).          as our index of human impact. The HF is a composite index of
    Where species have fallen below a “functional density” at              eight global pressures and ranges between 0 and 50. HF scores
a site, it would not be considered functionally intact because             of four or more are considered modified habitat; scores below
important biotic interactions are likely no longer fulfilling their        this are considered as low impact (Venter et al., 2016b; Mokany
ecological role (Soulé et al., 2003). Overexploitation, invasive           et al., 2020; Williams et al., 2020), although, in some recent
species and disease may reduce species below functional densities          papers, a value of below three is considered low impact (Di Marco
leading to loss of functional intactness even if species are               et al., 2018; O’Bryan et al., 2020). The HF mainly maps human
not completely extirpated. Functional densities are particularly           infrastructure, population or agriculture, but does attempt to
important for species that play key ecological roles in an                 predict impacts up to 15 km on either side of linear features
ecosystem, such as seed dispersal, nutrient cycling or top-down            (rivers and roads). For our scoping we selected a threshold value
regulation (Estes et al., 2011; Camargo-Sanabria et al., 2013;             for the HF of four or lower, to ensure that sites with scores
Peres et al., 2016). Where mesopredators or competitive species            between three and four that might still meet faunal intactness
have been introduced by humans, these can have an impact on                were considered. Following the methodology in Plumptre et al.
both species composition and on ecosystem function (Gordon                 (2019), we smoothed the global HF scores before identifying
and Letnic, 2016). Assessment of functional intactness should              where the HF score is equal to or lower than four. This was
therefore assess both loss of species at a site (faunal intactness)        done to eliminate isolated micro-patches of high or low HF scores
as well as decline in the functional role of individual species as a       that would add to analysis time while providing no substantial
result of human influence.                                                 benefit to global findings. We then converted the result to a
    To support identification of sites with outstanding ecological         vector file. This process developed our baseline map of estimated
integrity, we provide an initial scoping analysis and explore              habitat intactness.
how measuring habitat, faunal and functional intactness narrow                We calculated the percentage loss of area for each ecoregion
down the areas where sites might be identified as having                   (Dinerstein et al., 2017) and the average percentage loss across all
outstanding ecological integrity under KBA Criterion C. More               ecoregions where there was habitat with a HF score ≤ 4. Criterion
detailed analyses specific to single ecoregions would be needed            C sites are suggested to be large (10,000 km2 or larger). However,
for a complete assessment of Criterion C sites. We assess how              our initial results showed that few ecoregions can meet this size
the percentage of land that would qualify for Criterion C KBA              with complete functional intactness. We therefore also assessed
would change if we consider just habitat intactness or if we               how the number of ecoregions and the area of land surface would
include faunal and functional intactness, which is arguably more           change when selecting sites with minimum areas of 1,000, 5,000,
difficult to measure. We compile data across multiple taxonomic            and 10,000 km2 . We excluded Antarctica as it is not designated
groups, but the focus is primarily on mammals, particularly                as an ecoregion but included within a category of rock and ice
large- and medium-sized mammals, because these are often the               (Dinerstein et al., 2017).
first species to be affected by hunting (Redford, 1992; Atwood
et al., 2020; Gallego-Zamorano et al., 2020). We then assess               Areas of Where Fauna Have Not Been
what proportion of the terrestrial surface of the world could              Extirpated
be considered faunally and functionally intact at a minimum.               We used three data layers that provided measures of species
We compiled three sets of data layers, representing areas that             extirpation at a site: two global, and one focused on tropical
have low human footprint, are faunally intact, and functionally            forested areas. The first layer was an estimate of the number
intact. We applied these layers cumulatively to identify areas             of historical mammal extinctions across the world (Mammal

Frontiers in Forests and Global Change | www.frontiersin.org           3                                       April 2021 | Volume 4 | Article 626635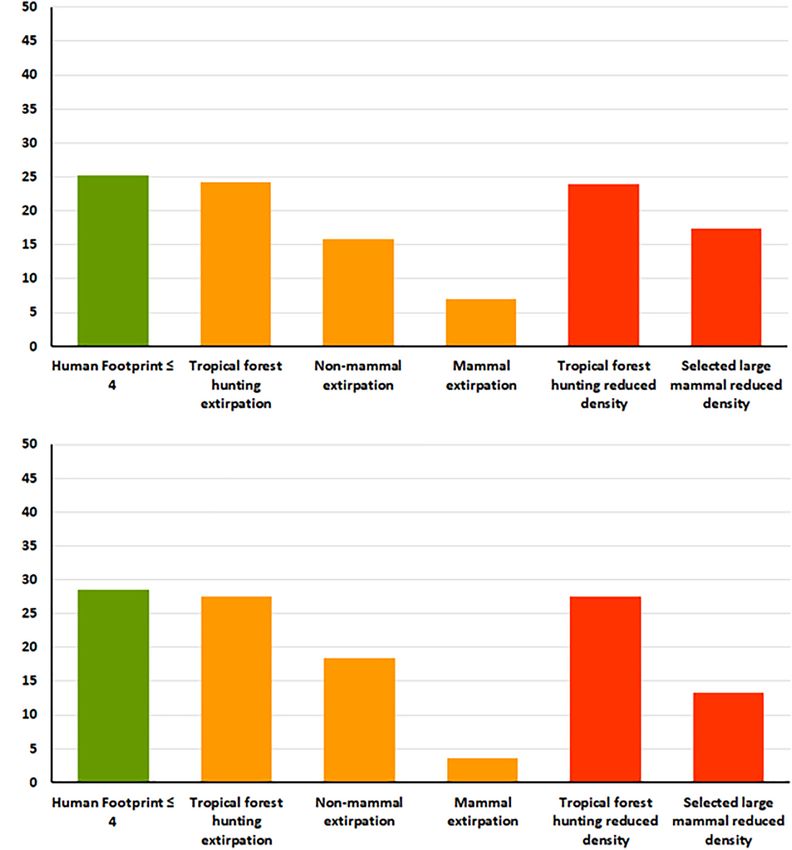
Plumptre et al.                                                                                                         Scoping Ecological Integrity

extirpations). The data for this were taken from Faurby et al.            Assess Areas Where Species Are
(2018), with the original data mainly coming from Faurby and              Reduced Below Functional Density
Svenning (2015) and IUCN 2016-3. We note that these data
                                                                          We compiled maps for widespread species for which predicted
are not explicitly linked to any specific time point but rather
                                                                          density or probability of suitable habitat has been modeled across
compare current ranges with estimated non-human modified
                                                                          their global range. We targeted wide-ranging large mammals
ones. However, we omitted any global or continental extinctions
                                                                          (including large ungulates, great apes, and carnivores), and
happening before 1500 AD. Whilst a few species have had
                                                                          landscape species that are often the first species to be lost
prolonged range contractions within the continents they still
                                                                          from an ecological community because of anthropogenic impacts
occupy, the data are generally an adequate approximation of
                                                                          (Sanderson et al., 2002b). While this is not a comprehensive
the mammalian community if 1500 AD is used as a baseline
                                                                          mapping of potential reduction in densities of species across the
and have previously been used as such (Belote et al., 2020).
                                                                          world, these species may be considered indicators of ecological
The resolution of this map was at ∼ 100 × 100 km and we
                                                                          integrity because they are sensitive to human impacts. We
downscaled it to 10 × 10 km for this study using a bilinear
                                                                          assembled density data for the following species or subspecies:
interpolation in ArcGIS 10.5.
                                                                          African forest elephant (Loxodonta africana cyclotis) (Maisels
   The second layer was a map of extinct and possibly extinct
                                                                          et al., 2013), western lowland gorilla (Gorilla gorilla gorilla)
range areas compiled from the IUCN Red List of Threatened
                                                                          and central chimpanzee (Pan troglodytes troglodytes) (Strindberg
Species for all taxonomic groups assessed by June 2020 (IUCN
                                                                          et al., 2018), western chimpanzee (P.t.verus) (Heinicke et al.,
2020 – henceforth IUCN Red List). The IUCN Red List assesses
                                                                          2019), Grauer’s gorilla (Gorilla beringei graueri) (Plumptre
where species have been extirpated (extinct) since the year 1500
                                                                          et al., 2016), Bornean Orangutan (Pongo pygmaeus) (Voigt
AD and this is recorded in the “Presence” field of the range
                                                                          et al., 2018), Sumatran Orangutan (P. abelii) (Wich et al.,
polygons (Plumptre et al., 2019). We updated the map of all
                                                                          2016), Tapanuli Orangutan (P. tapanuliensis) (Nater et al.,
extinct ranges provided by Plumptre et al. (2019) for the IUCN
                                                                          2017), jaguar (Panthera onca) (Jȩdrzejewski et al., 2018),
Red List 2020 v2. Range mapping on the IUCN Red List is not
                                                                          lion (Panthera leo) (Riggio et al., 2013), and African buffalo
consistent and has changed over time, so that not all species
                                                                          (Syncerus caffer) (Wint and Kiara, 2017). In addition, species
have their extinct range mapped, but it provides a measure across
                                                                          distribution models showing probability of suitable habitat
many taxonomic groups. For this analysis we excluded the extinct
                                                                          were compiled for eastern chimpanzee (P. t. schweinfurthii)
ranges of mammal species as these were included already in
                                                                          (Plumptre et al., 2010), and four bear species: polar bear (Ursus
the first layer (Mammal extirpations). We refer to this layer as
                                                                          maritimus), brown bear (Ursus arctos), American black bear
non-mammal extirpations (Non-mammal extirpations). Because
                                                                          (Ursus americanus) and Asian black bear (Ursus thibetanus)
IUCN Red List Assessors do not consistently map extirpated
                                                                          (Luna-Aranguré et al., 2020). Threshold densities or probabilities
range for species when making assessments, we preferred to use
                                                                          were identified for each species and for this study were assumed
the first layer for mammals as the mammal layer uses the same
                                                                          to predict where a species is at low abundance and will not
approach for nearly all mammal species.
                                                                          be playing its functional role in the ecosystem (Supplementary
   To account for the localized effect of hunting, we used a third
                                                                          Table 1). We compiled these into an overall map showing
layer, a binary raster map of defaunation (i.e., defaunated or
                                                                          where densities are likely to be low (Selected large mammal
not) within tropical forest areas which represented where tropical
                                                                          reduced density).
mammals are predicted to be locally extirpated due to hunting
                                                                             As a second input layer to measure reduced density, Benítez-
pressure (Gallego-Zamorano et al., 2020). This dataset contains
                                                                          López et al. (2019) mapped areas of predicted defaunation
tropical mammal species with at least 95% of their range within
                                                                          (defaunation map) resulting from hunting across tropical forests.
the tropical biome. In its preparation, each species was modeled
                                                                          Their maps show the areas where mammal species are predicted
separately at 1 km resolution using presence information in
                                                                          to have declined in abundance, but do not identify areas of local
hunted and unhunted areas. A binomial mixed-effects model
                                                                          extinction. However, the same data were used to predict where
that quantified the species-specific probability of persistence
                                                                          species have been extirpated by hunting (Gallego-Zamorano
under hunting pressure was used to identify local extirpations
                                                                          et al., 2020) – our Tropical Forest Hunting Extirpation map
per species (Gallego-Zamorano et al., 2020). We calculated this
                                                                          above – and we used this as a mask to remove areas from the
layer by aggregating all species to create a map of predicted
                                                                          defaunation map which have lost species, thereby leaving sites
numbers of large and medium mammals extirpated within the
                                                                          where species have been reduced in absolute abundance, but not
areas identified as “defaunated” in the binary map (Tropical forest
                                                                          lost. We used a threshold of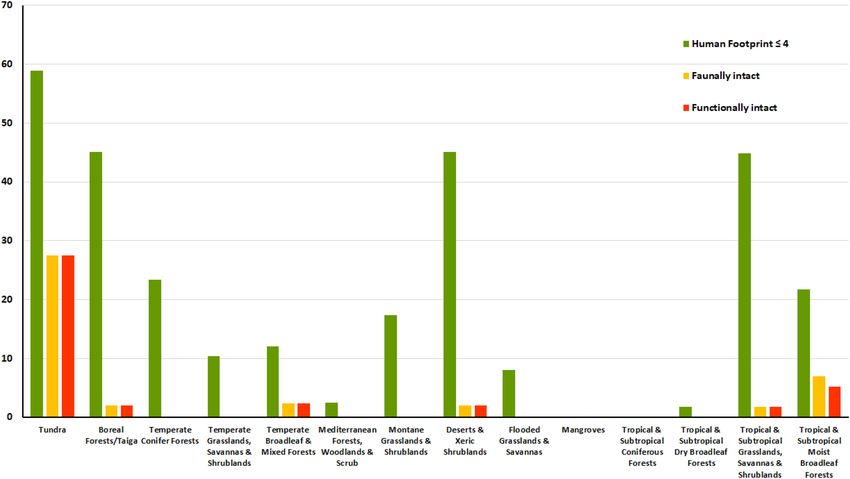
Plumptre et al.                                                                                                                                Scoping Ecological Integrity

  FIGURE 1 | Diagram of the analysis process to calculate habitat intactness, faunal intactness, and functional intactness. (∩ = intersect with).

vector files that we had derived from the various maps described                         restore ecological integrity by assessing where few species (1–5)
above (Figure 1):                                                                        have been extirpated and might be reintroduced if they have not
                                                                                         gone extinct globally. The number of species extirpated did not
    1. Habitat intactness: Select all areas where Human                                  correlate well with the Human Footprint score (Supplementary
       Footprint ≤ 4;                                                                    Figure 1) but the requirement of Criterion C sites to be in areas
    2. Faunally intact: Subtract areas from 1 (Habitat intactness),                      with low human impact meant we restricted our analyses to the
       where one or more species have been extirpated;                                   area of low human impact (Human footprint ≤ 4). We first
    3. Functionally intact: Subtract areas from 2 (Faunally intact)                      removed the number that were globally extinct on the IUCN Red
       where selected large mammal density is low.                                       List from the map of number of species extirpated, so that we
                                                                                         could assess areas where restoration might be possible in land
   We assessed the effect of limiting sites to a minimum polygon                         where HF ≤ 4. Applying the three minimum area classes, the total
area of 1,000, 5,000, and 10,000 km2 for each ecoregion. We                              area of a site was computed for sites incorporating 0–5 species
calculated changes in numbers and percentage area of ecoregions                          extirpated (for example a 10,000 km2 site assessed for 2 species
and calculated median polygon area for each ecoregion that                               extirpated could contain areas within the 10,000 km2 where 0, 1
had at least one polygon for each minimum area class.                                    or 2 species were extirpated).
We then calculated the total percentage of land that would
meet a definition of faunal and functional intactness for each
minimum area class.                                                                      RESULTS
   We assessed which biomes of the world would contain areas
of faunal intactness that are at least 10,000 km2 by intersecting                        Areas Under the Types of Intactness
the polygons generated above with the map of terrestrial biomes                          Habitat intactness (as measured by HF ≤ 4), covered 43.4% of
generated by Dinerstein et al. (2017) as attributes in their                             the terrestrial surface of the planet. When selecting areas of land
ecoregions shapefile. For the ecoregions that were identified as                         exclusively based on the HF ≤ 4 score, only 214 of the 847
having functionally intact areas, we also assessed what percentage                       ecoregions (25.3%) qualify as having polygons of 10,000 km2
of these areas was covered by protected areas using the World                            or larger. This rises to 464 ecoregions (54.8%) if areas as small
Database of Protected Areas (UNEP-WCMC and IUCN, 2020)                                   as 1,000 km2 are considered. Removing each of the individual
and percentage covered by existing KBAs using the World                                  faunal layers from this baseline habitat intactness map for a
Database of KBAs (BirdLife International, 2020). We measured                             minimum area of 10,000 km2 showed that most of the reduction
this coverage using the same threshold areas above to evaluate                           in percentage of ecoregions or terrestrial land surface occurs as a
changes with minimum polygon area.                                                       result of mammal and non-mammal extirpations and the reduced
   Finally, having mapped the number of species extirpated in                            densities of selected species (Figure 2).
each 10 km × 10 km cell, we also mapped the extent of land                                  Combining the three layers measuring extirpation (Tropical
where Human Footprint ≤ 4 and where it might be possible to                              forest hunting extirpation, Non-mammal extirpation, and

Frontiers in Forests and Global Change | www.frontiersin.org                         5                                               April 2021 | Volume 4 | Article 626635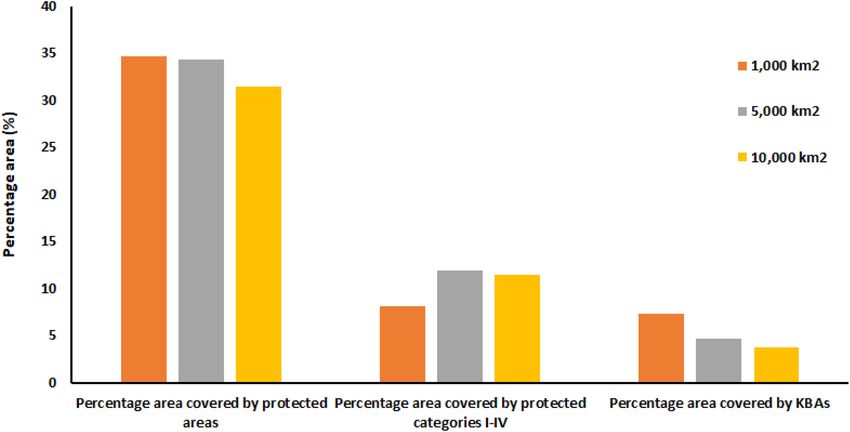
Plumptre et al.                                                                                                                           Scoping Ecological Integrity

  FIGURE 2 | The effects of selecting a HF ≤ 4 (green) on the percentage of (A) ecoregions and (B) area of the land surface of the earth with the addition of three
  measures of faunal intactness (Orange – Intact fauna in tropical forest; non-mammal extirpations from the IUCN Red List; Mammal extirpations) and two measures of
  functional intactness (Red – Minimal impacts of hunting in tropical forest; High densities of selected large mammals). The percentages/areas are calculated as the
  amount remaining as each layer is selected within the HF ≤ 4 layer for polygon areas that are 10,000 km2 or larger.

Mammal extirpation) into a single mask layer enabled us to                               Finally, we combined the two layers measuring low
assess faunal intactness. Removing regions where species have                         density (tropical forest hunting reduced density and selected
been lost from the HF ≤ 4 map has a huge impact, reducing the                         large mammal density) to assess functional intactness (i.e.,
number of ecoregions to 42 at 10,000 km2 or 124 at 1,000 km2                          faunally intact areas which also have functional densities
(Figure 3A; Supplementary Figure 2). Only 2.9% of land surface                        of species). This reduced the number of ecoregions that
(Figure 3B) could be considered faunally intact for a minimum                         would qualify further from 38 at 10,000 km2 to 119 at
area of 10,000 km2 (3.4% at 1,000 km2 ).                                              1,000 km2 and only 2.8% of the land surface can be considered

Frontiers in Forests and Global Change | www.frontiersin.org                      6                                             April 2021 | Volume 4 | Article 626635
Plumptre et al.                                                                                                                                Scoping Ecological Integrity

  FIGURE 3 | Changes in (A) number of ecoregions, (B) percentage area of terrestrial surface and (C) median percentage area of each ecoregion remaining as first
  HF ≤ 4, then faunally intact and finally functionally intact areas are selected, showing the cumulative loss with each layer. Results are shown for minimum areas of
  1,000, 5,000, and 10,000 km2 .

Frontiers in Forests and Global Change | www.frontiersin.org                        7                                               April 2021 | Volume 4 | Article 626635
Plumptre et al.                                                                                                            Scoping Ecological Integrity

functionally intact for a minimum area of 10,000 km2 (3.3% at                    The datasets we have applied in our analysis are the best
1,000 km2 ).                                                                 we could compile at a global scale; we recognize that at an
   Approximately 25% of the world’s terrestrial ecoregions have              ecoregional scale it will be possible to make more detailed
at least one habitat intact polygon >10,000 km2 remaining;                   analyses of human footprint, identification of areas which have
whereas only 5.0% have at least one faunally intact polygon                  experienced species loss, and mapping of population densities
remaining; and 4.5% have at least one functionally intact polygon            of species likely impacted by humans to assess whether they
remaining. The median percentage area of ecoregions that remain              are likely functional. In particular, we selected a subset of large
in the analysis also drops as we sequentially filter for HF ≤ 4,             mammals to assess functional density, choosing species that were
faunal intactness, and functional intactness (Figure 3C). This               relatively widespread and likely hunted, as surrogates for other
shows that not only do the numbers of ecoregions decrease,                   species. Few species have their density mapped across their global
but also the area remaining within the ecoregions that can be                range and we compiled what we could find that was relevant
considered intact decreases greatly.                                         to the analysis. We strongly encourage more detailed analyses
                                                                             to be made to start scoping where ecologically functional KBAs
Biome Representation                                                         might be identified and that sensitivity analyses are made using
A few biomes – tundra, deserts, tropical and subtropical                     variation in the datasets. Detailed assessments will likely reduce
grasslands – have an average of more than 40% of each ecoregion              the area that can be described as ecologically intact still further.
in faunally and ecologically intact areas of >10,000 km2 .                   However, detailed assessments may also reveal that smaller sites
Other biomes have a much lower percentage (Figure 4 and                      are sufficient to maintain populations and ecological processes in
Supplementary Figure 2).                                                     a few ecoregions, especially on islands or island-like ecosystems
                                                                             with few area-demanding species. For example, the East African
Proportion of Intact Land Covered by                                         montane moorlands ecoregion is a high altitude ecoregion where
Protected Areas or KBAs                                                      few large-bodied fauna occur naturally. The total area of this
Only about 11% of the area identified as functionally intact is              ecoregion is less than 5,000 km2 but it could potentially have areas
included in existing protected areas (categories I-IV). The median           that are considered functionally intact. We therefore explored the
percentage of functionally intact land covered by protected areas            effect of relaxing the area requirement, but emphasize that sites
of all types is larger but still only 34% (Figure 5). The percentage         that are smaller than 10,000 km2 would still need to maintain
of functionally intact land area covered by KBAs identified with             functionally intact populations of all species for that ecoregion
other KBA criteria is only 4% at 10,000 km2 but rises to 7% at               to qualify as KBAs under Criterion C.
1,000 km2 .                                                                      A surprisingly low percentage of the area identified as
                                                                             ecologically intact in our analysis is covered by protected
Potential for Recovery of Functional                                         areas (11% covered by PAs in categories I-IV), indicating
                                                                             that Other Effective Conservation Measures (OECMs) have
Intactness
                                                                             an important role to play in maintaining ecological integrity.
The very low percentage of land that might qualify as functionally
                                                                             Many of the areas identified as ecologically intact coincide
intact led us to assess what remaining land exists where only five
                                                                             with territories managed by indigenous communities, who have
or fewer species have been extirpated (but are not globally extinct)
                                                                             played a vital role in maintaining the ecological integrity of
within the area of habitat intactness (Figure 6). We calculated
                                                                             these areas (Figure 6). We show that there is potential to
changes in land surface and number of ecoregions that could in
                                                                             restore ecological integrity over a much broader area. We found
future become faunally intact (and eventually functionally intact)
                                                                             that up to 20% of the earth’s land surface could be restored
if restoration occurred by sequentially adding 1, 2, up to 5 extant
                                                                             to faunal intactness through the reintroduction of up to five
species where these have been extirpated (Table 1). Restoring 1–5
                                                                             species. Clearly restoring faunal intactness will involve meeting
species would increase the percentage of the earth’s land surface
                                                                             the requirements for successful species’ reintroduction and the
that is faunally intact from approximately 3% at present up to 19%
                                                                             ability to build up population numbers so that they can reach
(10,000 km2 minimum area) to 24% (1,000 km2 ).
                                                                             functional densities. Applying the IUCN/SSC reintroduction and
                                                                             translocation guidelines (IUCN/SSC, 2013) will be necessary to
DISCUSSION                                                                   minimize disease risks and possible conflicts with people, but
                                                                             our findings show there is potential to increase faunal intactness,
While wilderness areas are increasingly recognized as important              and ultimately functional intactness over time, if species can
for biodiversity conservation, few areas of the world remain                 be reintroduced to sites with low human footprint. In this
that can be characterized as having outstanding ecological                   “decade of restoration” (Aronson et al., 2020), we believe that,
integrity, (i.e., retaining intact species assemblages at ecologically       as well as focusing on restoring habitat, a proactive approach
functional densities). We found that only 2.8% of the terrestrial            should assess which areas would be amenable to restore faunal
surface of the planet is represented in areas of 10,000 km2 or               intactness with the aim of regaining full functional intactness,
larger with low human footprint, no known species loss and                   by tackling the threats that led to the loss in the first place.
no species known to be reduced below functional densities.                   These areas will likely be located in eastern Russia, northern
This compares with estimates of 20–40% from mapped habitat                   Canada and Alaska, the Amazon Basin, parts of the Sahara,
intactness in the literature (Riggio et al., 2020).                          and the Congo Basin. Planning for ecological restoration to

Frontiers in Forests and Global Change | www.frontiersin.org             8                                       April 2021 | Volume 4 | Article 626635
Plumptre et al. Scoping Ecological Integrity FIGURE 4 | Changes in percentage of ecoregions in biomes selecting first areas of HF ≤ 4; then removing areas where species have been extirpated and finally removing areas where species are at low density. Results are presented for ecoregions with minimum polygon of 10,000 km2 . FIGURE 5 | The percentage of ecologically intact sites (polygons) covered by protected areas of all types (left), protected areas in IUCN categories I-IV (center), and covered by KBAs (right). include the reintroduction of extirpated but globally extant increase the number of ecoregions that could achieve sites species, as has occurred in several conservation projects around with outstanding ecological integrity. Examples would include the world (Hale and Koprowski, 2018), could significantly reintroducing forest elephants in areas of the Congo Basin Frontiers in Forests and Global Change | www.frontiersin.org 9 April 2021 | Volume 4 | Article 626635
Plumptre et al. Scoping Ecological Integrity
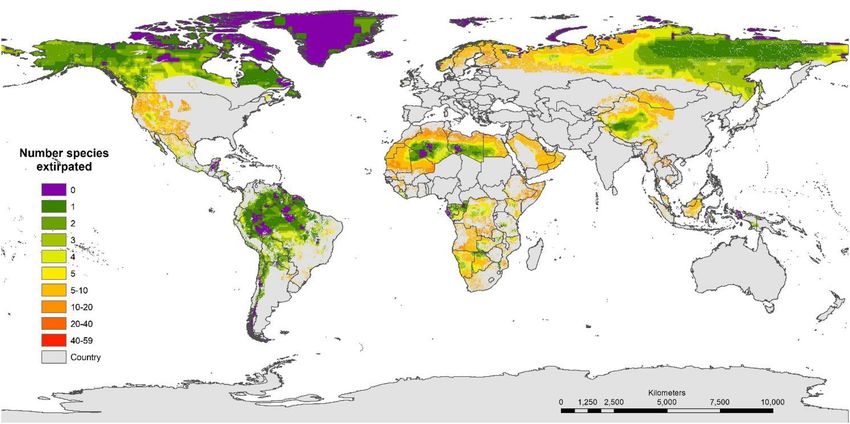
FIGURE 6 | The number of extirpated species (mammals and all other taxa mapped on the IUCN Red List) mapped in areas of habitat intactness (Human
Footprint ≤ 4) for the land surface of the earth (removing areas (gray) where species have become globally extinct since 1500 AD, HF >4, and Antarctica).
where they have been extirpated, or reintroducing some of Surprisingly, human footprint indices did not correlate well
the large ungulates that have been lost from much of Africa’s with faunal intactness (Supplementary Figure 1), because while
woodlands and savannas because of overhunting (e.g., buffalo, threats such as habitat loss may correlate well, several major
giraffe, zebras etc.), as long as overhunting has ceased. We threats to faunal intactness (e.g., hunting, invasive species) are not
acknowledge that other key factors need be taken into account properly accounted for by the human footprint maps (Benítez-
for successful species reintroduction projects, including but not López et al., 2019; Belote et al., 2020). There is considerable
limited to adequate source populations, pedigree and genetics, geographic variation in patterns of hunting pressure, but many
and disease assessments (Dinca et al., 2018; Hunter-Ayad tropical forest regions characterized by relatively low human
et al., 2020). Restoration projects should also consider assessing densities and land cover change have also suffered from extensive
which ecoregions currently cannot meet the requirement of and unsustainable hunting pressure (Redford, 1992; Tilker et al.,
faunal intactness and determine where they could best support 2019); invasive predators have encroached into wilderness areas
restoration in these ecoregions to rebuild faunal intactness and, far from infrastructure networks (Doherty et al., 2016); and
over time, functional intactness as densities rebuild. diseases such as ebola can spread deep into remote forests
(Rizkalla et al., 2007). None of these threats are picked up by
remote sensing tools. Threats such as hunting primarily affect
large- and medium-sized mammals (Benítez-López et al., 2019;
TABLE 1 | The change in number of ecoregions (top row) and percentage land Gallego-Zamorano et al., 2020), although regional variations
surface area (second row) that could potentially be conserved with the
exist because of hunters’ preferences, cultural beliefs, and taboos
reintroduction of extant species that have been locally extirpated onto land
where HF ≤ 4. regarding the consumption of some species (Ngoufo et al., 2014;
Bobo et al., 2015). For instance, in Uganda ungulates but not
Minimum 0 0–1 0–2 0–3 0–4 0–5 primates are targeted by hunters, unlike just over the border in
area class species species species species species species
the Democratic Republic of Congo where primates are widely
(km2 )
hunted as well (A. Plumptre pers. obs.). Along the Gabon and
1,000 117 175 201 228 249 277 Congo coastline, chimpanzees but not gorillas are considered
3.51% 9.14% 14.47% 18.54% 21.66% 23.51% taboo, and this is reversed in some areas of Cameroon; a
5,000 58 99 126 143 160 172 factor “eat gorillas” or “eat chimpanzees” was included in the
3.16% 8.29% 13.14% 16.69% 19.35% 20.74% spatial model that predicted the density of both taxa in western
10,000 42 82 99 117 124 131 Equatorial Africa (Strindberg et al., 2018). Predicting the impacts
2.96% 7.89% 12.41% 15.69% 18.13% 19.29% of hunting needs much more detailed analysis (Benítez-López
The method identified sites with the minimum area class for polygons with zero up et al., 2019; Bogoni et al., 2020; Romero-Muñoz et al., 2020) than
to five species extirpated somewhere within the polygon. making assumptions about impacts from access distance to road
Frontiers in Forests and Global Change | www.frontiersin.org 10 April 2021 | Volume 4 | Article 626635Plumptre et al. Scoping Ecological Integrity
and river networks. Similarly, the impacts of introduced species manuscript structure and analyses. All authors contributed to the
cannot be assessed from maps such as the Human Footprint but article and approved the submitted version.
have had a major impact on extirpated species numbers in places
such as Australia (Woinarski et al., 2015).
Nevertheless, human footprint indices can play an essential FUNDING
role in identifying areas with potential for ecological restoration
through reintroduction of extirpated species, as there will AP was supported by the KBA Partnership. DB supported by
typically be fewer barriers to successful restoration in areas with Daniel K. Thorne Foundation and CCI Collaborative Fund.
low human footprint. As the world develops the next goals and SF received funding from the Swedish Research Council
targets for the Convention on Biological Diversity under the (2017-03862). AB-L was supported by a Juan de la Cierva-
post 2020 global biodiversity framework, “intact habitat” has Incorporación grant (IJCI-2017-31419) from the Spanish
been recognized as an important target. We would argue here Ministry of Science, Innovation and Universities.
that “intact habitat” is clearly an important conservation target,
and that we must also consider faunal and functional intactness,
and direct resources to areas that still retain a fully functioning ACKNOWLEDGMENTS
ecological community as this is clearly very rare. Retaining large
areas will give these sites a better chance of retaining their This work was undertaken by AJP while working for the KBA
functional intactness. Working to restore ecological integrity to Partnership as head of the KBA Secretariat and he wishes to thank
those areas of the world that are close to ecological integrity BirdLife International and the KBA Partnership who support his
should be a focus of the current decade of restoration also. position.
Moreover, identifying Criterion C KBAs could help focus
attention on these sites for conservation action and investment.
SUPPLEMENTARY MATERIAL
The Supplementary Material for this article can be found
DATA AVAILABILITY STATEMENT online at: https://www.frontiersin.org/articles/10.3389/ffgc.2021.
626635/full#supplementary-material
The raw data supporting the conclusions of this article will be
made available by the authors, without undue reservation. Supplementary Figure 1 | Plot of number of species extirpated against human
footprint score for 3,474 randomly assigned points across the land surface of the
planet. While a positive linear correlation exists R2 is only 0.21.
AUTHOR CONTRIBUTIONS Supplementary Figure 2 | Location of land with (A) HF ≤ 4 and (B) faunal
intactness. Colors represent different ecoregions, gray is land that does not
AP and DB conceived the original idea, compiled layers, made meet the criteria.
analyses, and drafted manuscript. RB, EV-D, SF, WJ, HKi, HKü, Supplementary Table 1 | The species name, threshold density and source of
AB-L, CL-A, MV, SW, WW, and JG-Z provided data layers data for rangewide species distribution maps for the species that were used to
and contributed to the manuscript. CB contributed ideas on assess impacts on functional intactness.
REFERENCES Wildlife Fund. September 2020 version. Available online at: http://www.
keybiodiversityareas.org/site/search (accessed September, 2020).
Aronson, J., Goodwin, N., Orlando, L., Eisenberg, C., and Cross, A. T. (2020). A Bobo, K. S., Aghomo, F. F. M., and Ntumwel, B. C. (2015). Wildlife use and
world of possibilities: six restoration strategies to support the United Nation’s the role of taboos in the conservation of wildlife around the Nkwende Hills
Decade on Ecosystem Restoration. Restor. Ecol. 28, 730–736. doi: 10.1111/rec. Forest Reserve; South-west Cameroon. J. Ethnobiol. Ethnomed. 11:2. doi: 10.
13170 1186/1746-4269-11-2
Atwood, T. B., Valentine, S. A., Hammill, E., McCauley, D. J., Madin, E. M., Beard, Bogoni, J. A., Peres, C. A., and Ferraz, K. M. (2020). Extent, intensity and drivers
K. H., et al. (2020). Herbivores at the highest risk of extinction among mammals, of mammal defaunation: a continental-scale analysis across the Neotropics. Sci.
birds, and reptiles. Sci. Adv. 6:eabb8458. doi: 10.1126/sciadv.abb8458 Rep. 10, 1–16. doi: 10.1038/s41598-020-72010-w
Belote, R. T., Faurby, S., Brennan, A., Carter, N. H., Dietz, M. D., Hahn, B., Brodie, J. F., Redford, K. H., and Doak, D. F. (2018). Ecological function analysis:
et al. (2020). Mammal species composition reveals new insights into earth’s incorporating species roles into conservation. Trends Ecol. Evol. 33, 840–850.
remaining wilderness. Front. Ecol. Environ. 18, 376–383. doi: 10.1002/fee. doi: 10.1016/j.tree.2018.08.013
2192 Camargo-Sanabria, A. A., Mendoza, E., Guevara, R., Martınez-Ramos, M.,
Benítez-López, A., Santini, L., Schipper, A. M., Busana, M., and Huijbregts, and Dirzo, R. (2015). Experimental defaunation of terrestrial mammalian
M. A. (2019). Intact but empty forests? Patterns of hunting-induced mammal herbivores alters tropical rainforest understorey diversity. Proc. R. Soc. B
defaunation in the tropics. PLoS Biol. 17:e3000247. doi: 10.1371/journal.pbio. 282:20142580. doi: 10.1098/rspb.2014.2580
3000247 CBD (2020). Update of the Zero Draft of the Post2020 Global Biodiversity
BirdLife International (2020). World Database of Key Biodiversity Areas. Framework. CBD/POST2020/PREP/2/1. Available online at: https://www.cbd.
Developed by the KBA Partnership: BirdLife International, International Union int/conferences/post2020/post2020-prep-01/documents (accessed September,
for the Conservation of Nature, Amphibian Survival Alliance, Conservation 2020).
International, Critical Ecosystem Partnership Fund, Global Environment Chase, J. M., Blowes, S. A., Knight, T. M., Gerstner, K., and May, F. (2020).
Facility, Global Wildlife Conservation, NatureServe, Rainforest Trust, Royal Ecosystem decay exacerbates biodiversity loss with habitat loss. Nature 584,
Society for the Protection of Birds, Wildlife Conservation Society and World 238–243. doi: 10.1038/s41586-020-2531-2
Frontiers in Forests and Global Change | www.frontiersin.org 11 April 2021 | Volume 4 | Article 626635Plumptre et al. Scoping Ecological Integrity
Di Marco, M., Venter, O., Possingham, H. P., and Watson, J. E. M. (2018). Changes Kennedy, C. M., Oaklefa, J. R., Theobald, D. M., Baruch-Mordo, S., and Kiesecker,
in human footprint drive changes in species extinction risk. Nat. Commun. J. (2018). Global Human Modification. Available online at: https://doi.org/10.
9:4621. doi: 10.1038/s41467-018-07049-5 6084/m9.figshare.7283087 (accessed September, 2020).
Dinca, V., Balint, Z., Voda, R., Dapporto, L., Hebert, P. D. N., and Vila, R. (2018). Luna-Aranguré, C., Soberón, J., and Vázquez-Domínguez, E. (2020). A tale of four
Use of genetic, climatic, and microbiological data to inform reintroduction of a bears: environmental signal on the phylogeographical patterns within the extant
regionally extinct butterfly. Conserv. Biol. 32, 828–837. doi: 10.1111/cobi.13111 Ursus species. J. Biogeogr. 47, 472–486. doi: 10.1111/jbi.13752
Dinerstein, E., Olson, D., Joshi, A., Vynne, C., Burgess, N. D., Wikramanayake, Maisels, F., Strindberg, S., Blake, S., Wittemyer, G., Hart, J., Williamson, E. A.,
E., et al. (2017). An ecoregion-based approach to protecting half the terrestrial et al. (2013). Devastating decline of forest Elephants in Central Africa. PLoS
realm. Bioscience 67, 534–545. doi: 10.1093/biosci/bix014 One 8:e59469. doi: 10.1371/journal.pone.0059469
Doherty, T. S., Glen, A. S., Nimmo, D. G., Ritchie, E. G., and Dickman, C. R. (2016). McCloskey, J. M., and Spalding, H. (1989). A reconnaissance level inventory of the
Invasive predators and global biodiversity loss. Proc. Natl. Acad. Sci. U.S.A. 113, amount of wilderness remaining in the world. Ambio 18, 221–227.
11261–11265. doi: 10.1073/pnas.1602480113 Mittermeier, R. A., Myers, N., Thomsen, J. B., Gustavo, A. B. D. F., and Olivieri, S.
Estes, J. A., Terborgh, J., Brashares, J. S., Power, M. E., Berger, J., Bond, W. J., (1998). Biodiversity hotspots and major tropical wilderness areas: approaches
et al. (2011). Trophic downgrading of planet Earth. Science 333, 301–306. doi: to setting conservation priorities. Conserv. Biol. 12, 516–520.
10.1126/science.1205106 Mokany, K., Ferrier, S., Harwood, T. D., Ware, C., and Di Marco, M. (2020).
Faurby, S., Davis, M., Pedersen, R. Ø, Schowanek, S. D., Antonelli, A., and Reconciling global priorities for conserving biodiversity habitat. Proc. Natl.
Svenning, J. -C. (2018). PHYLACINE 1.2: the phylogenetic atlas of mammal Acad. Sci. 117, 9906–9911.
macroecology. Ecology 99:2626. doi: 10.1002/ecy.2443 Morrison, J. C., Sechrest, W., Dinerstein, E., Wilcove, D. S., and Lamoreux, J. F.
Faurby, S., and Svenning, J. C. (2015). A species-level phylogeny of all extant and (2007). Persistence of large mammal faunas as indicators of global human
late Quaternary extinct mammals using a novel heuristic-hierarchical Bayesian impacts. J. Mammal. 88, 1363–1380. doi: 10.1644/06-MAMM-A-124R2.1
approach. Mol. Phylogenet. Evol. 84, 14–26. doi: 10.1016/j.ympev.2014.11.001 Nater, A., Mattle-Greminger, M. P., Nurcahyo, A., Nowak, M. G., de Manuel, M.,
Gallego-Zamorano, J., Benítez-López, A., Santini, L., Hilbers, J. P., Huijbregts, Desai, T., et al. (2017). Morphometric, behavioral, and genomic evidence for a
M. A. J., and Schipper, A. M. (2020). Combined effects of land use and hunting new orangutan species. Curr. Biol. 27, 3487–3498. doi: 10.1016/j.cub.2017.09.
on distributions of tropical mammals. Conserv. Biol. 34, 1271–1280. doi: 10. 047
1111/cobi.13459 Ngoufo, R., Yongyeh, N., Obioha, E., Bobo, K., Jimoh, S., and Waltert, M. (2014).
Goldewijk, K. K., Beusen, A., Doelman, J., and Stehfast, E. (2017). Anthropogenic Social norms and cultural services-community belief system and use of wildlife
land use estimates for the Holocene – HYDE 3.2. Earth Syst. Sci. Data 9, products in the Northern periphery of the Korup National Park, South-West
927–953. doi: 10.5194/essd-9-927-2017 Cameroon. Change Adapt. Socio-Ecol. Syst. 1, 26–34. doi: 10.2478/cass-2014-
Gordon, C. E., and Letnic, M. (2016). Functional extinction of a desert rodent: 0003
implications for seed fate and vegetation dynamics. Ecography 39, 815–824. O’Bryan, C. J., Allan, J. R., Holden, M., Sanderson, C., Venter, O., Di Marco, M.,
doi: 10.1111/ecog.01648 et al. (2020). Intense human pressure is widespread across terrestrial vertebrate
Grantham, H. S., Duncan, A., Evans, T. D., Jones, K. R., Beyer, H. L., Schuster, ranges. Glob. Ecol. Conserv. 21:e00882. doi: 10.1016/j.gecco.2019.e00882
R., et al. (2020) Anthropogenic modification of forests means only 40% of Peres, C. A., Barlow, J., and Laurance, W. F. (2006). Detecting anthropogenic
remaining forests have high ecosystem integrity. Nat. Commun. 11, 5978. doi: disturbance in tropical forests. Trends Ecol. Evol. 21, 227–229. doi: 10.1016/j.
10.1038/s41467-020-19493-3 tree.2006.03.007
Hale, S. L., and Koprowski, J. L. (2018). Ecosystem-level effects of keystone species Peres, C. A., Emilio, T., Schietti, J., Desmoulière, S. J., and Levi, T. (2016).
reintroduction: a literature review. Restor. Ecol. 26, 439–445. doi: 10.1111/rec. Dispersal limitation induces long-term biomass collapse in overhunted
12684 Amazonian forests. Proc. Natl. Acad. Sci. U.S.A. 113, 892–897. doi: 10.1073/
Heinicke, S., Mundry, R., Boesch, C., Amarasekaran, B., Barrie, A., Brncic, T., pnas.1516525113
et al. (2019). Advancing conservation planning for western chimpanzees using Plumptre, A. J., Baisero, D., Jêdrzejewski, W., Kühl, H., Maisels, F., Ray, J. C.,
IUCN SSC A.P.E.S.—the case of a taxon-specific database. Environ. Res. Lett. et al. (2019). Are we capturing faunal intactness? A comparison of intact forest
14:064001. doi: 10.1088/1748-9326/ab1379 landscapes and the “last of the wild in each ecoregion. Front. For. Glob. Change
Hunter-Ayad, J., Ohlemüller, R., Recio, M. R., and Seddon, P. J. (2020). 2:24. doi: 10.3389/ffgc.2019.00024
Reintroduction modelling: a guide to choosing and combining models for Plumptre, A. J., Nixon, S., Kujirakwinja, D. K., Vieilledent, G., Critchlow, R.,
species reintroductions. J. Appl. Ecol. 57, 1233–1243. doi: 10.1111/1365-2664. Williamson, E. A., et al. (2016). Catastrophic decline of World’s largest primate:
13629 80% loss of grauer’s Gorilla (Gorilla beringei graueri) population justifies
IUCN (2016). A Global Standard for the Identification of Key Biodiversity Areas, critically endangered status. PLoS One 11:e0162697. doi: 10.1371/journal.pone.
Version 1.0, 1st Edn. Gland: IUCN. 0162697
IUCN (2020). The IUCN Red List of Threatened Species. Version 2020-v2. Available Plumptre, A. J., Rose, R., Nangendo, G., Williamson, E. A., Didier, K., Hart, J., et al.
online at: http://www.iucnredlist.org (accessed June, 2020). (2010). Status Survey and Conservation Action Plan for the Eastern Chimpanzee
IUCN/SSC (2013). Guidelines for Reintroductions and Other Conservation (Pan troglodytes schweinfurthii). Gland: IUCN.
Translocations. The Reintroduction and Invasive Species Specialist Groups’ Task Potapov, P., Hansen, M. C., Laestadius, L., Turubanova, S., Yaroshenko, A.,
Force on Moving Plants and Animals for Conservation Purposes Version 1.0. Thies, C., et al. (2017). The last frontiers of wilderness: tracking loss of intact
Gland: IUCN Species Survival Commission. forest landscapes from 2000 to 2013. Sci. Adv. 3:e1600821. doi: 10.1126/sciadv.
Jacobson, A. P., Riggio, J., Tait, A. M., and Baillie, J. E. M. (2019). Global areas of 1600821
low human impact (‘Low impact areas’) and fragmentation of the natural world. Potapov, P., Yaroshenko, A., Turubanova, S., Dubinin, M., Laestadius, L., Thies, C.,
Sci. Rep. 9:14179. doi: 10.1038/s41598-019-50558-6 et al. (2008). Mapping the world’s intact forest landscapes by remote sensing.
Jȩdrzejewski, W., Robinson, H. S., Abarca, M., Zeller, K. A., Velasquez, G., Ecol. Soc. 13:51.
Paemelaere, E. A. D., et al. (2018). Estimating large carnivore populations Redford, K. H. (1992). The empty forest. BioScience 42, 412–422.
at global scale based on spatial predictions of density and distribution - Riggio, J., Baillie, J. E. M., Brumby, S., Ellis, E., Kennedy, C. M., Oakleaf, J. R.,
Application to the jaguar (Panthera onca). PLoS One 13:0194719. doi: 10.1371/ et al. (2020). Global human influence maps reveal clear opportunities in
journal.pone.0194719 conserving Earth’s remaining intact terrestrial ecosystems. Glob. Change Biol.
Kennedy, C. M., Oakleaf, J. R., Theobald, D. M., Baruch-Mordo, S., and Kiesecker, 26, 4344–4356. doi: 10.1111/gcb.15109
J. (2019). Managing the middle: a shift in conservation priorities based on Riggio, J., Jacobson, A., Dollar, L., Bauer, H., Becker, M., Dickman, A., et al. (2013).
the global human modification gradient. Glob. Change Biol. 25, 811–826. doi: The size of savannah Africa: a lion’s (Panthera leo) view. Biodivers. Conserv. 22,
10.1111/gcb.14549 17–35. doi: 10.1007/s10531-012-0381-4
Frontiers in Forests and Global Change | www.frontiersin.org 12 April 2021 | Volume 4 | Article 626635Plumptre et al. Scoping Ecological Integrity
Rizkalla, C., Blanco-Silva, F., and Gruver, S. (2007). Modeling the impact of ebola undermine global environment targets. Curr. Biol. 26, 2929–2934. doi: 10.1016/
and bushmeat hunting on Western Lowland Gorillas. EcoHealth 4, 151–155. j.cub.2016.08.049
doi: 10.1007/s10393-007-0096-2 Wich, S., Singleton, I., Nowak, M. G., Utami Atmoko, S. S., Nisam, G., Arif,
Romero-Muñoz, A., Benítez-López, A., Zurell, D., Baumann, M., Camino, M., S. M., et al. (2016). Land-cover changes predict steep declines for the Sumatran
Decarre, J., et al. (2020). Increasing synergistic effects of habitat destruction orangutan (Pongo abelii). Sci. Adv. 2:e1500789. doi: 10.1126/sciadv.150
and hunting on mammals over three decades in the Gran Chaco. Ecography 0789
43, 1–13. doi: 10.1111/ecog.05053 Williams, B. A., Venter, O., Allan, J. R., Atkinson, S. C., Rehbein, J. A., Ward, M.,
Sanderson, E. W., Jaiteh, M., Levy, M. A., Redford, K. H., Wannebo, A. V., and et al. (2020). Change in terrestrial human footprint drives continued loss of
Woolmer, G. (2002a). The human footprint and the last of the wild. Bioscience intact ecosystems. One Earth 3, 371–382. doi: 10.1016/j.oneear.2020.08.009
52, 891–904. Wint, W., and Kiara, H. (2017). Where Should the Muguga Cocktail be
Sanderson, E. W., Redford, K. H., Vedder, A., Coppolillo, P. B., and Ward, S. E. Used? The Distributions of Theileria Parva, its Hosts and Vectors in Africa.
(2002b). A conceptual model for conservation planning based on landscape Unpublished Report of International Livestock Research Institute. Available
species requirements. Landscape Urb. Plann. 58, 41–56. doi: 10.1016/S0169- online at: https://cgspace.cgiar.org/handle/10568/103218 (accessed October,
2046(01)00231-6 2020).
Sandom, C., Faurby, S., Sandel, B., and Svenning, J.-C. (2014). Global late Woinarski, J. C. Z., Burbidge, A. A., and Harrison, P. L. (2015). Ongoing unraveling
Quaternary megafauna extinctions linked to humans, not climate change. Proc. of a continental fauna: decline and extinction of australian mammals since
Biol. Sci. 281, 1–9. doi: 10.1098/rspb.2013.3254 European settlement. Proc. Natl. Acad. Sci. 112, 4531–4540. doi: 10.1073/pnas.
Soulé, M. E., Estes, J. A., Berger, J., and Del Rio, C. M. (2003). ’Ecological 1417301112
effectiveness: conservation goals for interactive species’. Conserv. Biol. 17,
1238–1250. doi: 10.1046/j.1523-1739.2003.01599.x Disclaimer: The views implied or expressed here are those of the authors and do
Strindberg, S., Maisels, F., Williamson, E. A., Blake, S., Stokes, E. J., and Aba’a, R. not necessarily represent the views of the institutions they work for or represent
(2018). Guns, germs, and trees determine density and distribution of gorillas and are meant to inform, but not pre-empt, planned workshops to discuss the
and chimpanzees in Western Equatorial Africa. Sci. Adv. 4:eaar2964. doi: 10. application of KBA criterion C.
1126/sciadv.aar2964
Tilker, A., Abrams, J. F., Mohamed, A., Nguyen, A., Wong, S. T., Sollmann, R., Conflict of Interest: WW is employed by a consultancy, Environmental Research
et al. (2019). Habitat degradation and indiscriminate hunting differentially Group Oxford Ltd. which has no potential conflict of interest with these research
impact faunal communities in the Southeast Asian tropical biodiversity hotspot. topics and provided input free of charge.
Commun. Biol. 2:396. doi: 10.1038/s42003-019-0640-y
UNEP-WCMC, and IUCN (2020). Protected Planet: The World Database on The remaining authors declare that the research was conducted in the absence of
Protected Areas (WDPA). Cambridge: UNEP-WCMC and IUCN. any commercial or financial relationships that could be construed as a potential
Venter, O., Sanderson, E. W., Magrach, A., Allan, J. R., Beher, J., Jones, K. R., conflict of interest.
et al. (2016b). Sixteen years of change in the global terrestrial human footprint
and implications for biodiversity conservation. Nat. Commun. 7:12558. doi: Citation: Plumptre AJ, Baisero D, Belote RT, Vázquez-Domínguez E, Faurby S,
10.1038/ncomms12558 Jȩdrzejewski W, Kiara H, Kühl H, Benítez-López A, Luna-Aranguré C, Voigt M,
Venter, O., Sanderson, E. W., Magrach, A., Allan, J. R., Beher, J., Jones, K. R., et al. Wich S, Wint W, Gallego-Zamorano J and Boyd C (2021) Where Might We
(2016a). Data from: global terrestrial Human Footprint maps for 1993 and 2009. Find Ecologically Intact Communities? Front. For. Glob. Change 4:626635.
Dryad Digital Repository doi: 10.5061/dryad.052q5.2 doi: 10.3389/ffgc.2021.626635
Voigt, M., Wich, S. A., Ancrenaz, M., Meijaard, E., Abram, N., Banes, G. L.,
et al. (2018). Global demand for natural resources eliminated more than Copyright © 2021 Plumptre, Baisero, Belote, Vázquez-Domínguez, Faurby,
100,000 bornean orangutans. Curr. Biol. 28, 761–769. doi: 10.1016/j.cub.2018. Jȩdrzejewski, Kiara, Kühl, Benítez-López, Luna-Aranguré, Voigt, Wich, Wint,
01.053 Gallego-Zamorano and Boyd. This is an open-access article distributed under the
Watson, J. E. M., Evans, T., Venter, O., Williams, B., Tulloch, A., Stewart, C., et al. terms of the Creative Commons Attribution License (CC BY). The use, distribution
(2018). The exceptional value of intact forest ecosystems. Nat. Ecol. Evol. 2, or reproduction in other forums is permitted, provided the original author(s) and
599–610. doi: 10.1038/s41559-018-0490-x the copyright owner(s) are credited and that the original publication in this journal
Watson, J. E. M., Shanahan, D. F., Di Marco, M., Allan, J., Laurance, W. F., is cited, in accordance with accepted academic practice. No use, distribution or
Sanderson, E. W., et al. (2016). Catastrophic declines in wilderness areas reproduction is permitted which does not comply with these terms.
Frontiers in Forests and Global Change | www.frontiersin.org 13 April 2021 | Volume 4 | Article 626635You can also read