Geographic contingency, not species sorting, dominates macroevolutionary dynamics in an extinct clade of neogastropods (Volutospina; Volutidae)
←
→
Page content transcription
If your browser does not render page correctly, please read the page content below
Paleobiology, 47(2), 2021, pp. 236–250
     DOI: 10.1017/pab.2020.60

     Article

     Geographic contingency, not species sorting, dominates
     macroevolutionary dynamics in an extinct clade of
     neogastropods (Volutospina; Volutidae)

     Dana S. Friend*           , Brendan M. Anderson               , and Warren D. Allmon

     Abstract.—Rates of speciation and extinction are often linked to many ecological factors, traits (emergent
     and nonemergent) such as environmental tolerance, body size, feeding type, and geographic range. Mar-
     ine gastropods in particular have been used to examine the role of larval dispersal in speciation. However,
     relatively few studies have been conducted placing larval modes in species-level phylogenetic context.
     Those that have, have not incorporated fossil data, while landmark macroevolutionary studies on fossil
     clades have not considered both phylogenetic context and net speciation (speciation–extinction) rates.
     This study utilizes Eocene volutid Volutospina species from the U.S. Gulf Coastal Plain and the Hampshire
     Basin, U.K., to explore the relationships among larval mode, geographic range, and duration. Based on the
     phylogeny of these Volutospina, we calculated speciation and extinction rates in order to compare the
     macroevolutionary effects of larval mode. Species with planktotrophic larvae had a median duration of
     9.7 Myr, which compared significantly to 4.7 Myr for those with non-planktotrophic larvae. Larval
     mode did not significantly factor into geographic-range size, but U.S. and U.K. species do differ, indicating
     a locality-specific component to maximum geographic-range size. Non-planktotrophs (NPTs)were absent
     among the Volutospina species during the Paleocene–early Eocene. The relative proportions of NPTs
     increased in the early middle Eocene, and the late Eocene was characterized by disappearance of plankto-
     trophs (PTs). The pattern of observed lineage diversity shows an increasing preponderance of NPTs; how-
     ever, this is clearly driven by a dramatic extinction of PTs, rather than higher NPT speciation rates during
     the late Eocene. This study adds nuance to paleontology’s understanding of the macroevolutionary
     consequences of larval mode.

     Dana S. Friend and Warren D. Allmon. Paleontological Research Institution, 1259 Trumansburg Road, Ithaca,
       New York 14850 U.S.A. E-mail: dsf88@cornell.edu, wda1@cornell.edu
     Brendan M. Anderson. Department of Geosciences, Baylor University, 101 Bagby Avenue, Waco, Texas 76706
        U.S.A. E-mail: Brendan_Anderson@baylor.edu

     Accepted: 6 December 2020
     *Corresponding author.

                              Introduction
                                                                               that have, have not incorporated fossil data,
        Many ecological factors have been suggested                            while landmark macroevolutionary studies on
     as influencing rates of speciation and extinc-                             fossil clades (Jablonski and Lutz 1983; Jablonski
     tion, including feeding type (Levinton 1974),                             1986; Hansen 1997) have not considered both
     population size (Boucot 1975), range of environ-                          phylogenetic context and net speciation (speci-
     mental tolerance (Jackson 1974), and dispersal                            ation–extinction) rates (Krug et al. 2015). Traits
     ability (Lester et al. 2007). Marine gastropods                           that lead to increasing rates of speciation might
     in particular have been the subject of much                               also lead to a proportionally greater increase in
     study of the role of dispersal in speciation (Han-                        rates of extinction, resulting in lower net diver-
     sen 1978; Jablonski 1987; Jablonski and Valen-                            sification of the clade possessing said trait
     tine 1990; McKinney 1997; Crampton et al.                                 (Goldberg et al. 2010).
     2010). However, relatively few studies have                                  Gastropods are among the many marine
     been conducted placing larval modes in                                    invertebrates that undergo a two-stage life
     species-level phylogenetic context (Collin                                cycle. The adult gastropod body plan typically
     2004; Krug et al. 2015; Sang et al. 2019). Those                          results in restricted mobility relative to the

     © The Author(s), 2021. Published by Cambridge University Press on behalf of The Paleontological Society. This is an Open
     Access article, distributed under the terms of the Creative Commons Attribution licence (http://creativecommons.org/
     licenses/by/4.0/), which permits unrestricted re-use, distribution, and reproduction in any medium, provided the original
     work is properly cited.                                                                                    0094-8373/21
Downloaded from https://www.cambridge.org/core. IP address: 46.4.80.155, on 22 Aug 2021 at 21:35:51, subject to the Cambridge Core terms of
use, available at https://www.cambridge.org/core/terms. https://doi.org/10.1017/pab.2020.60
GEOGRAPHIC CONTINGENCY IN VOLUTID MACROEVOLUTION                                                               237

        dispersal that occurs while in the larval form.                            generally predicted to have a geologically short
        Two larval types (or developmental modes)                                  duration, and lineages are predicted to have
        are generally recognized in the literature:                                higher extinction rates (Jablonski and Lutz
        planktotrophic and non-planktotrophic (Thor-                               1983). Depending on the environmental or eco-
        son 1950; Jablonski and Lutz 1983). Plankto-                               logical mechanisms driving extinction, however,
        trophs (PTs) feed on the plankton, meaning                                 either planktotrophy or non-planktotrophy may
        their dispersal potential is not nutrient limited                          be selectively advantageous for reasons unre-
        (Thorson 1950), and the adults produce relatively                          lated to dispersal potential (Shuto 1974;
        larger numbers of eggs. Non-planktotrophs                                  Jablonski and Lutz 1980); for example, non-
        (NPTs) have a higher per-offspring investment,                             planktotrophy may be favored when regional
        potentially increasing survival, but produce                               productivity declines (Sang et al. 2019).
        fewer eggs (Jablonski and Lutz 1980). NPTs                                    Dispersal ability also affects the rate of speci-
        include species with both lecithotrophic (plank-                           ation. Wide dispersal of larvae effectively mixes
        tonic, but yolk-feeding) and direct-developing                             genes from disjunct populations, suppressing
        larvae. Because non-planktotrophic larvae lack                             genetic divergence required for speciation. This
        the structures that facilitate feeding within the                          model hypothesizes, then, that planktotrophic
        plankton, they are expected to have more                                   lineages have relatively low speciation rates. In
        restricted dispersal and consequently both                                 contrast, larvae with restricted dispersal ability
        lower population interconnectivity (potentially                            form local populations that remain isolated
        increasing speciation rates) and smaller geo-                              after the initial colonization, meaning NPT
        graphic ranges (potentially increasing extinction                          lineages likely have higher speciation rates. The
        risk; Jablonski and Lutz 1980). The exact nature                           end result of this model is that planktotrophic
        of the relationship between geographic range                               species have relatively longer durations, lower
        and speciation is paradoxical (Jablonski 2017),                            extinction rates, and low speciation rates; while
        as greater dispersal ability may lead to either                            species with non-planktotrophic larvae have
        increased chances of the formation of peripheral                           relatively shorter durations, higher extinction
        isolates or higher interpopulation connectivity,                           rates and higher speciation rates. Alternatively,
        depressing speciation (Boucot 1975; Stanley                                planktotrophic lineages may have more oppor-
        1986; Allmon and Martin 2014).                                             tunities to form peripheral isolates, leading to
           The consequences of larval ecology in macro-                            high speciation rates as well.
        evolutionary processes have long been dis-                                    A primitive planktotrophic larval mode
        cussed in the paleobiological literature. Jackson                          characterizes many gastropod clades, as deter-
        (1974) and Scheltema (1977, 1978, 1979) devel-                             mined by phylogenetic methods, for example,
        oped a model to think about the effect of larval                           Turritellidae (Lieberman et al. 1993; Sang
        dispersal ability (i.e., larval type) on speciation                        et al. 2019), Kermia and Pseudodaphnella (Fedo-
        and extinction rates. In this model, species                               sov and Puillandre 2012), Conus (Duda and
        with planktotrophic larvae (and thus the poten-                            Palumbi 1999), and neogastropods (Hansen
        tial to disperse over a large geographic area) can                         1982). However, while planktotrophic species
        easily maintain gene flow between populations,                              usually give rise to non-planktotrophic species,
        because larvae from outside populations con-                               the reverse seems to be a rare exception (Reid
        stantly “replenish” (Zelnik et al. 2015) popula-                           1989). Of the groups mentioned, direct devel-
        tions that are reduced by local disturbances                               opment has independently arisen at least two
        (which are not likely to completely extinguish                             times, and there were no reversals back to
        a widespread species from its whole geographic                             planktotrophy. The lack of reversals can be
        range). These conditions theoretically result in                           attributed to the inability to redevelop the spe-
        species with long durations, and lineages display                          cialized feeding and swimming features that
        low extinction rates. Species with non-plankto-                            characterize planktotrophic larvae once they
        trophic larvae are likely to have more restricted                          have been lost (e.g., Strathmann 1974, 1978).
        geographic ranges, and extinction is more likely                           High rates of irreversible character change can
        to occur due to local disturbances and randomly                            result in the accumulation of distantly related
        fluctuating populations. Consequently, NPTs are                             NPTs in the fossil record, similar to state-

Downloaded from https://www.cambridge.org/core. IP address: 46.4.80.155, on 22 Aug 2021 at 21:35:51, subject to the Cambridge Core terms of use, available at
https://www.cambridge.org/core/terms. https://doi.org/10.1017/pab.2020.60
238 DANA S. FRIEND ET AL.
FIGURE 1. Proposed effects of non-planktotrophy on the proportion of planktotrophic (PT) taxa (white) to non-
planktotrophic (NPT) taxa (filled) based on speciation and extinction rates in four theoretical models of macroevolution.
A, Rare origins of new non-planktotrophic lineages from planktotrophic taxa coupled with low speciation rates lead to per-
sistence at low relative diversity. B, Non-planktotrophic lineages of equal or higher net speciation than planktotrophic
lineages accumulate passively due to the one-way nature of the transitions. C, Non-planktotrophic lineages with higher
rates of both speciation and extinction due to their low population sizes and low connectivity would result in strong fluc-
tuations of relative diversity, with frequent extinction of non-planktotrophic lineages. D, For non-planktotrophic lineages
with extremely low speciation rates, the total diversity is dictated by the frequency of new non-planktotrophic lineages
from planktotrophic taxa relative to extinction rate.
dependent diversification (which is one aspect Little empirical evidence has been produced
of species sorting) (Duda and Palumbi 1999). regarding the macroevolutionary effects of larval
Exceptions are seen in Lacuninae (Littorini- mode in phylogenetic context (Krug et al. 2015).
dae) (Reid 1989) and Crepipatella (Calyptraeidae) There are various reasonable macroevolutionary
(Collin et al. 2007), for which reversals from non- scenarios that may be governed by larval mode,
planktotrophy to planktotrophy are inferred. In if one considers transitions unidirectional from
such cases, non-planktotrophic larvae retain the planktotrophy to non-planktotrophy:
specialized feeding and swimming structures,
making the transition from non-planktotrophy 1. NPTs may have rare origins from PTs and
back to planktotrophy possible (Collin 2004; lower speciation rates, leading to persistence
Collin et al. 2007; Collin and Miglietta 2008). at low relative diversity (Fig. 1A).
Downloaded from https://www.cambridge.org/core. IP address: 46.4.80.155, on 22 Aug 2021 at 21:35:51, subject to the Cambridge Core terms of use, available at
https://www.cambridge.org/core/terms. https://doi.org/10.1017/pab.2020.60GEOGRAPHIC CONTINGENCY IN VOLUTID MACROEVOLUTION 239
2. NPTs may have equal or higher net speci- type (e.g., deposit-feeder, grazer, carnivore).
ation (speciation–extinction) rates and accu- Planktotrophic larval type was associated
mulate passively due to the one-way with wide geographic range only via species
nature of the transitions (Fig. 1B). duration (through a three-way interaction).
3. NPTs may have higher speciation and Other authors found that geographic range
extinction rates due to their low population and duration had a reciprocal relationship in
sizes and low connectivity. This high volatil- marine invertebrates and microfossils. Foote
ity (Gilinsky 1994; J. C. Lamsdell, personal et al. (2008) concluded that duration deter-
communication) would result in strong fluc- mines range as much as range determines
tuations of relative diversity, but frequent duration.
extinction of non-planktotrophic lineages While the studies cited have supplied an
(Fig. 1C). abundance of data on the associations between
4. NPTs may have extremely low speciation larval ecology and species-level traits (i.e., traits
rates. Under these conditions, the total emergent at the species level; Jablonski 2000,
diversity of NPTs is dictated by the fre- 2017; Congreve et al. 2018) of geographic
quency of transitions relative to extinction range and population interconnectivity, they
(Fig. 1D). It is possible to envision a scenario did not explicitly test the macroevolutionary
(however unlikely) in which NPTs never outcomes (in terms of speciation and extinc-
speciate but there is a higher than 50% pro- tion). In other words, they did not test for spe-
duction of NPTs during planktotrophic spe- cies selection (Stanley 1975; Krug et al. 2015).
ciation events coinciding with larval mode While Krug et al. (2015) examined larval
transitions. This would eventually drive mode selection in a phylogenetic context,
the clade to extinction through decreasing their results are not comparable to other tests
speciation rates without necessarily requir- of species sorting and selection, because no
ing increased extinction rates. sea slug fossil lineages were included when cal-
culating net speciation. Other authors have
Larval type can often be confidently inferred noted the problems in inferring speciation
from fossil gastropod shells, because the size and extinction rates using phylogenies con-
and shape of the protoconch (larval shell) (Ven- structed with only extant species (Quental
detti 2007; Sang et al. 2019) differ between the and Marshall 2009; Liow et al. 2010; Rabosky
two modes. A large protoconch with few whorls 2010; Marshall 2017).
(paucispiral) indicates a non-planktotrophic lar- Early investigators focused on differential
val stage after hatching from a large yolked egg, survival of species based on organismal traits
whereas small, multispiral protoconchs gener- present in all members of a given species
ally indicate a longer planktonic period (PT). (Stanley 1975, 1979; Arnold and Fristrup 1982;
Investigations into potential connections Coyne and Orr 2004; Okasha 2006), more pre-
between larval type and evolutionary patterns cisely termed “species sorting” (Vrba and
in several neogastropod families (e.g., Hansen Gould 1986; Lieberman and Vrba 1995). But
1978, 1982) found that (consistent with the in its strict sense, species selection refers to the
model outlined in Jackson [1974] and Schel- emergent fitness (differential origination and
tema [1977]) species with non-planktotrophic extinction of species) within clades due to
larvae had narrower geographic ranges than species-level emergent traits, while the obser-
species with planktotrophic larvae. Crampton vation of differential outcomes among species
et al. (2010) modeled the relationships between as a result of unexpected (emergent) higher-
geographic range, species duration, size, and level consequences of traits possessed by all
other traits in mollusks and found positive rela- individuals of a species is more properly
tionships between body size and geographic termed “species sorting” (Vrba and Gould
range as well as geographic range and species 1986; Jablonski 2000).
duration. Gastropod species duration dis- Hansen’s (1978) research on Paleogene Volu-
played two-way associations between life tidae (Neogastropoda) found that the first
mode (e.g., infaunal, epifaunal), and feeding appearance of non-planktotrophy resulted in
Downloaded from https://www.cambridge.org/core. IP address: 46.4.80.155, on 22 Aug 2021 at 21:35:51, subject to the Cambridge Core terms of use, available at
https://www.cambridge.org/core/terms. https://doi.org/10.1017/pab.2020.60240 DANA S. FRIEND ET AL.
more appearances of non-planktotrophic spe- framework for testing the effect of dispersal
cies, but in the absence of phylogenetic context, potential (larval mode). The stratigraphy of
the frequency of larval mode transitions both regions has been extensively studied, and
remains unknown, as do which lineages (PTs fossil mollusks are generally well preserved.
or NPTs) have higher speciation, extinction, or
net-speciation rates. In his attempt to link larval
Methods
mode with speciation, Hansen assumed that
larval mode transitions were unidirectional For all but one (V. arangia) species, multiple
and that the accumulation of NPTs is exponen- specimens with complete protoconchs were
tial (scenario shown in Fig. 1B). He concluded studied under a microscope to determine larval
that increased speciation rates resulting from mode. Larval inferences for rare taxa and worn,
restricted dispersal ability (via larval mode fragmented, or poorly preserved species were
transition) could have resulted in the strictly based on a single specimen, but larval type is
non-planktotrophic family of extant volutids largely thought to be species specific (Robert-
(Darragh and Ponder 1998; Penchaszadeh son 1974). None of the taxa with multiple
et al. 1999). Yet the prevalence of plankto- protoconch-bearing specimens displayed intra-
trophic species in families other than Volutidae specific variation in larval type. Following the
argues against the possibility that there is a uni- method outlined by Shuto (1974), we used the
versal advantage, independent of other traits ratio between maximum diameter (D) and
and environmental circumstances, to having number of volutions of the protoconch (Vol)
non-planktotrophic larvae. to infer each species’ larval type (D/Vol).
Here we reexamine Hansen’s conclusions on Planktotrophic larvae have D/Vol ratios of
the effects of dispersal ability (via larval type) less than 0.3; at least 3 volutions; and a thin,
on speciation and evaluate several scenarios acute apex. Non-planktotrophic larvae have
that could be responsible for the proportional D/Vol ratios 0.3 and above; fewer than 2.25
increase in NPTs to PTs over geologic time in volutions; and a blunt, low apex. But when
Volutidae. For larval mode switches to have D/Vol ratio is between 0.3 and 1.0 and the pro-
produced the dominance of non-planktotro- toconch more than 3 volutions, both plankto-
phy, several plausible scenarios are considered: trophy and non-planktotrophy are possible,
(1) many unidirectional switches from plankto- and qualitative characters like sculpture and
trophy to non-planktotrophy occurred in shape help infer larval mode (Shuto 1974;
multiple different subclades; (2) only a few Vendetti 2007).
switches to the non-planktotrophic mode, Following the methods of Hansen (1980),
along with the differential diversification of maps of the GCP and the APB were divided
lineages with non-planktotrophic larvae; and into linear geographic units, each 75 km wide.
finally (3), species selection could be implicated Locality data for each species were collected
if the difference in net rate of speciation favor- from both published literature and museum
ing NPTs is found to offset any differences in specimens. Paleobiogeographic ranges of Volu-
rate of extinction. These are not mutually exclu- tospina species were calculated by mapping
sive scenarios, however, but rather independ- occurrences and counting the number of geo-
ent hypotheses to test. graphic units (Hansen 1980) between its most
To minimize the effect of factors other than distant localities. To avoid giving species an
dispersal ability, a single genus within Voluti- anomalously wide distribution, geographic
dae, Volutospina, was chosen for detailed units were counted for only the stratigraphic
analysis. The taxonomy and systematics of this unit during which the species occupied the
clade were recently analyzed (Friend 2021), most zones.
and a phylogeny produced therein provides Species durations (stratigraphic ranges) were
the phylogenetic context for this study (Fig. 2). calculated by summing the durations of nano-
The Paleocene–Eocene outcrops of the U.S. plankton (NP) zones of the geologic formations
Gulf Coastal Plain (GCP) and the Anglo- in which each was present. NP ages were based
Parisian Basin (APB) provide an excellent on Papazzoni et al. 2017 (Table 1). Mann-
Downloaded from https://www.cambridge.org/core. IP address: 46.4.80.155, on 22 Aug 2021 at 21:35:51, subject to the Cambridge Core terms of use, available at
https://www.cambridge.org/core/terms. https://doi.org/10.1017/pab.2020.60GEOGRAPHIC CONTINGENCY IN VOLUTID MACROEVOLUTION 241
FIGURE 2. Phylogeny of Paleocene–Eocene Volutospina. PT, planktotrophic; NPT, non-planktotrophic; gray circle labels,
U.S. species; white circle labels, U.K. species; white circles on phylogeny, larval mode change from planktotrophic to non-
planktotrophic. Black arrows, west to east Atlantic larval dispersal; white arrows, east to west Atlantic larval dispersal.
TABLE 1. Nanoplankton (NP) boundary ages and Whitney U-tests, calculated in PAST v. 3.24
duration. Number of planktotrophs (PTs) and
non-planktotrophs (NPTs) present in each zone.
(Hammer et al. 2001) were used to assess the
relationship between larval type and emergent
Age at upper and No. traits (geographic range and species duration).
lower boundaries Duration of No. of
NP zone (Myr) (Myr) PTs NPTs
The potential interactive effect of geographic
range and duration was explored using a mul-
NP5 59.5–61.4 1.9 1 0
NP6 59.0–59.5 0.5 3 0 tiple logistic regression analysis in the Quest
NP8 57.2–58.4 1.8 3 0 Graph Logistic Regression Calculator (ATT Bio-
NP9 55.8–57.2 1.4 3 0 quest, Inc., 2019). Although this test is not with-
NP10 54.2–55.8 1.6 6 0
NP11 53.7–54.2 0.5 7 0 out criticism, particularly because it assumes
NP12 50.6–53.7 3.1 7 0 normality and treats dependent variables
NP13 49.2–50.6 1.4 6 1 as independent, it does give some indication
NP14 46.4–49.2 2.8 8 2
NP15 42.8–46.4 3.6 10 2 as to which variable is the strongest predictor
NP16 40.6–42.8 2.2 15 4 of larval mode.
NP17 37.4–40.6 3.2 10 4 Larval mode was mapped onto Friend’s
NP18 36.8–37.4 0.6 4 1
NP19–20 34.4–36.8 2.4 0 1 (2021) phylogeny of Paleocene and Eocene Volu-
NP21 34.4–33.0 1.4 0 1 tospina to assess the origin of NPTs and to deter-
NP22 33.0–32.5 0.5 0 0 mine the number of lineage originations and
Downloaded from https://www.cambridge.org/core. IP address: 46.4.80.155, on 22 Aug 2021 at 21:35:51, subject to the Cambridge Core terms of use, available at
https://www.cambridge.org/core/terms. https://doi.org/10.1017/pab.2020.60242 DANA S. FRIEND ET AL.
extinctions in each NP zone for both PTs and TABLE 3. Results of Mann-Whitney U-tests. **significant
p-value. PT, planktotrophs; NPT, non-planktotrophs; GCP,
NPTs. Per-lineage speciation and extinction U.S. Gulf Coastal Plain; APB, Anglo-Parisian Basin.
rates were calculated for each by observing the
number of new species or the number of Trait Comparison U-value z-score p-value
lineages ending at the base of each NP zone. Geographic NPT and PT 42 0.935 0.350
range
The rates of per-lineage speciation and extinc- Geographic GCP and 32 1.991 0.046**
tion were then calculated using the duration range APB
(in millions of years) of the NP zone immedi- Duration NPT and PT 20 2.381 0.017**
Speciation rate NPT and PT 38.5 0.728 0.447
ately before the boundary where measurements Extinction rate NPT and PT 38 0.827 0.408
were taken. Comparisons between NPTs and
PTs across the entire history of the clade (as
opposed to within an NP zone) included all
time periods for which lineages existed repre- definitively indicate non-planktotrophic lar-
senting the larval mode under consideration. vae. These six include four GCP species and
An unequal variance t-test comparing per- two APB species. The test results that follow
lineage, per-million years net-speciation rates treated V. arangia as an NPT (a reasonable infer-
was also performed in PAST v. 3.24 (Hammer ence as a member of NPT-only clade), but stat-
et al. 2001). istical analyses found that treating it as
non-planktotrophic did not ultimately have
an effect on final results.
Results
Patterns of species distribution reveal the dif-
The larval modes of Eocene Volutospina are ferences in geographic ranges between species
summarized in Table 2 (protoconchs were with presumably similar dispersal abilities.
located for all species except V. arangia). Of For example, some planktotrophic species
the species included in this analysis, six exhibited restricted geographic ranges (e.g.,
V. depauperata, V. horrida, and V. luctator). Con-
sidering all taxa together, the difference of geo-
TABLE 2. Larval mode (PT, planktotroph; NPT, graphic range between PTs and NPTs is
non-planktotroph), species duration, provenance (GCP,
U.S. Gulf Coastal Plain; APB, Anglo-Parisian Basin), and insignificant, as determined by Mann-Whitney
maximum geographic-range size (in units of 75 km, as in U-tests ( p = 0.350) (Table 3). The analysis here
Hansen [1980]) of Volutospina species. indicates that these volutids exhibited little
Larval Duration Geographic difference in geographic range between differ-
Species Region mode (Myr) range ent larval modes. Results of a Mann-Whitney
ambigua APB PT 6.0 7 U-test between GCP and APB species,
arangia GCP ? 4.4 1 however, shows GCP species had significantly
athleta APB PT 9.0 6
clayi GCP NPT 2.2 1
larger geographic ranges ( p = 0.046) and indi-
dalli GCP NPT 2.8 4 cates a locality-specific component to max-
depauperata APB. PT 5.8 1 imum geographic-range size (Table 3).
haleana GCP NPT 9.0 21
horrida APB PT 13.8 1
Species with non-planktotrophic larvae had
labrella APB NPT 5.8 2 a median duration of 4.7 Myr but 9.7 Myr for
ledoni APB PT 8.6 2 those with planktotrophic larvae. A
lisbonensis GCP PT 10.0 16
luctator APB PT 9.0 1
Mann-Whitney U-test (Table 3) indicates that
monstrosa APB PT 5.4 2 this difference between species durations of
nodosa APB PT 19.0 2 PTs and NPTs is significant ( p = 0.017).
petrosa GCP PT 22.1 40
sayana GCP NPT 3.2 2
The interactive effect of both duration and
scalaris APB PT 5.4 1 geographic range, as measured by multiple
selseiensis APB NPT 5.4 1 logistic regression, revealed that duration had
spinosa APB PT 17.4 8
suspensa APB PT 5.4 1
a closer correlation with larval modes than
tuomeyi GCP PT 5.3 22 geographic-range size (Table 4). In other
yvonnae APB PT 8.6 1 words, duration was a better predictor for
limopsis GCP PT 4.0 17
larval mode than geographic-range size.
Downloaded from https://www.cambridge.org/core. IP address: 46.4.80.155, on 22 Aug 2021 at 21:35:51, subject to the Cambridge Core terms of use, available at
https://www.cambridge.org/core/terms. https://doi.org/10.1017/pab.2020.60GEOGRAPHIC CONTINGENCY IN VOLUTID MACROEVOLUTION 243
TABLE 4. Results of the multiple logistic regression
analysis.
Standard
Variable Coefficient error p-value z-value
Constant 3.6892 2.0096 0.0664 1.8358
Duration −0.6033 0.3267 0.0648 −1.8463
Geographic −0.2252 0.1953 0.249 −1.1527
range
The number of species in each NP zone grew
modestly from NP 4 to 12, peaked in NP 16
(Table 1), and dropped quickly after NP 18.
The results of this analysis indicate that non-
planktotrophy was absent among the Volutos-
pina species during the Paleocene and early
Eocene. The relative proportions of NPTs
increased in the early middle Eocene and was
highest during NP 18 (20% of species). The
late Eocene was characterized by disappear-
ance of PTs, leaving only one presumed non-
planktotrophic species (V. arangia) in NP 20.
When the larval modes of Volutospina are
incorporated in the phylogeny, planktotrophy
appears to be the plesiomorphic state, given
the substantially higher frequency of PTs across
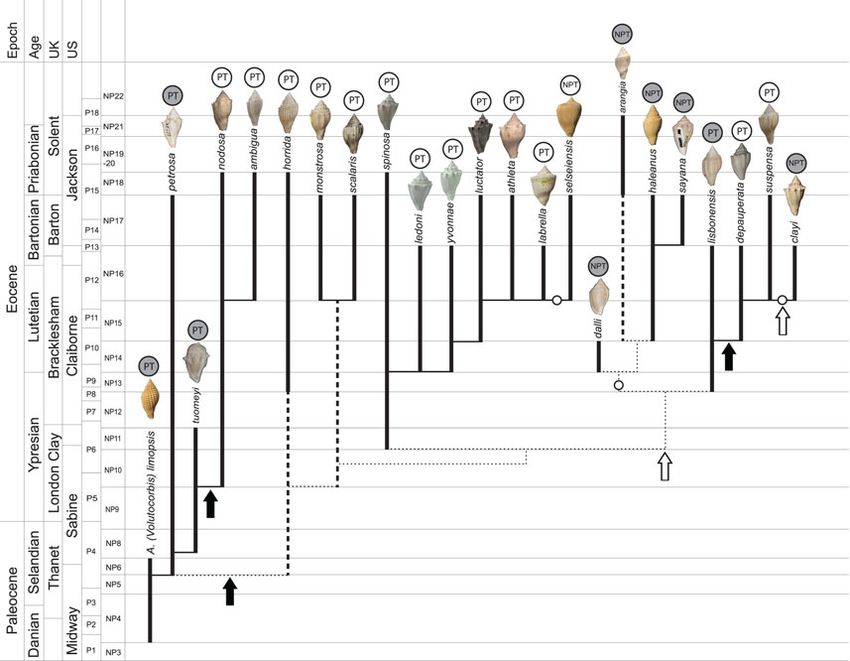
the clade (Krug et al. 2015; Collin and Moran FIGURE 3. A, Number of planktotrophic and non-
2018). Non-planktotrophy has independently planktotrophic Volutospina. B, Relative abundance of plank-
totrophic and non-planktotrophic Volutospina. See zones
arisen at least three times in this clade (Fig. 2, noted in Table 1.
white circles), and there is no evidence that
reversals of larval mode occurred (although
the larval mode of V. arangia remains unknown, a mean PT speciation rate of 0.252 per species,
and therefore the possibility that one reversal per million years, and mean NPT speciation
took place cannot be definitively ruled out). rate 0.162 per species, per million years (Tables
Of the seven NPTs in this clade, four originated 3, 5). Extinction rate also did not differ signifi-
from a single mode change (V. dalli, V. arangia, cantly (Mann-Whitney U-test, p = 0.41), with a
V. haleana, and V. sayana). The other two origi- mean PT extinction rate of 0.09 per species,
nations (V. selseiensis and V. clayi) coincided per million years and a mean NPT extinction
with larval mode changes but did not give rate of 0.16 per species, per million years
rise to any new species. (Tables 3, 5). PT net speciation rates had a
The pattern of observed lineage diversity mean of 0.164 from 12 time steps, while NPT
shows an increasing preponderance of NPTs; net speciation rates had a mean of 0.01 from 8
however, this is clearly driven by a dramatic time steps (Table 6). These differences were
extinction of PTs between NP 17 and NP 19– not statistically significant, including when
20 (Table 1, Fig. 3). This extinction took place time steps of 0 change were removed from the
simultaneously in Europe and North America, analysis.
but eliminated all APB species, leaving the sin-
gle surviving American species, Volutospina
Discussion
arangia.
Comparing speciation between PTs and Paleogeographic Range.—Hansen’s (1980)
NPTs produces no statistically significant dif- study on fossil Volutidae (including Volutospina
ference (Mann-Whitney U-test, p = 0.47), with examined here) from the GCP supported
Downloaded from https://www.cambridge.org/core. IP address: 46.4.80.155, on 22 Aug 2021 at 21:35:51, subject to the Cambridge Core terms of use, available at
https://www.cambridge.org/core/terms. https://doi.org/10.1017/pab.2020.60244 DANA S. FRIEND ET AL.
TABLE 5. Speciation and extinction rates (per species per million years) of planktotroph and non-planktotroph
Volutospina.
PT speciations per species NPT speciations per PT extinctions per species NPT extinctions per
Timestep per million years species per million years per million years species per million years
1 1.053 0.714 0 0
2 0.667 0.357 0.667 0.179
3 0 0 0 0
4 0.714 0.227 0 0.114
5 0.104 0 0 0.234
6 0 0 0 0
7 0.046 0 0.046 0
8 0.204 0 0 0.714
9 0.071 0
10 0.162 0
11 0 0.152
12 0 0.188
predictions that planktotrophic species consensus (King et al. 2016). In other words,
would have larger geographic ranges than the geographic ranges of Volutospina in the APB
non-planktotrophic species (PTs had a median may have been smaller than those in North
geographic range of 5.5 units, while NPTs America because there was less habitable space
spanned an average of 1.0 unit). Our results in which mollusks could live. Results of a
show a different pattern; two considerations Mann-Whitney U-test of geographic range
may explain the discrepancy. between GCP species and APB species (Table 3)
The first consideration is potential preserva- is consistent with the hypothesis that the size of
tion bias within the fossil deposits of the two the biogeographic province may ultimately con-
regions (GCP and APB). The distribution of trol the geographic range of all APB Volutospina.
accessible fossiliferous outcrops in the APB There is also some evidence to suggest that epei-
may have underestimated the true extent of ric seas (such as the Hampshire and Paris Basins)
the geographic ranges. This, of course, is a ubi- may support a higher species-area relationship
quitous problem in paleontology. The second than open ocean–facing settings (such as the
consideration, which we view as a more rele- GCP) due to differences in physical conditions
vant factor, is the relatively limited size of (Lagomarcino and Miller 2012).
actual paleobiogeographic provinces in the Species of similar dispersive potential still dif-
APB during the late Paleocene and Eocene. fered in geographic-range size, suggesting larval
Paleogeographic reconstructions of the Paleo- mode is not a predictor of realized geographic
cene and Eocene vary with respect to the coast- range. However, an alternate relationship is
line of the United Kingdom and France, revealed when short-lived and long-lived spe-
depending on the precise age of the sediments cies (regardless of larval mode) are compared.
(King et al. 2016). The North Sea was connected Short-lived species occupy smaller geographic
to the Atlantic Ocean during the Paleogene by a ranges than do the longer-enduring species
northern passage between current-day Scot- (Mann-Whitney U-test, p = 0.04). This result is
land and Norway. In this case, the shared similar to that of Hansen (1980), who found
waters covering the present United Kingdom that widespread species have the longest dura-
and France were bordered on three sides by tions, while species that are narrowly distribu-
land (Zacke et al. 2009). There is some uncer- ted exhibit the shortest durations.
tainty as to when the southern passage (i.e., Our conclusions on the macroevolutionary
current-day English Channel) formed, so it is consequences of paleogeographic range size
possible that there were two routes by which are limited, because this study only encom-
larvae could enter or exit the Hampshire and passes APB and GCP. While collectively a
Paris Basins (Zacke et al. 2009). The precise tim- large area, it is relatively small relative to
ing of open- or closed-access routes is a topic of the world’s Eocene sedimentary record. Limit-
recent interest, but there is currently no ing the study to two basins might obscure
Downloaded from https://www.cambridge.org/core. IP address: 46.4.80.155, on 22 Aug 2021 at 21:35:51, subject to the Cambridge Core terms of use, available at
https://www.cambridge.org/core/terms. https://doi.org/10.1017/pab.2020.60https://www.cambridge.org/core/terms. https://doi.org/10.1017/pab.2020.60
Downloaded from https://www.cambridge.org/core. IP address: 46.4.80.155, on 22 Aug 2021 at 21:35:51, subject to the Cambridge Core terms of use, available at
TABLE 6. Calculations of speciation and extinction rates. *Time-bin length based on Papazonni et al. (2017) until NP21. NP 21–23 based on Less and Ozcan (2012). PT, planktotroph; NPT, non-planktotroph;
NP, nanoplankton.
PT per
species
per Myr
No. of PT No. of NPT Total speciation
Length in originations originations originations PT per rate No. of NPT
NP zone Length Lower Myr since No. of No. of from from from species (length of No. of originations from
Time at base of of time boundary last zone observed planktotrophic planktotrophic planktotrophic planktotrophic speciation previous non-planktotrophic non-planktotrophic
step boundary bin* age boundary lineages lineages species species species rate time bin) lineages species
1 NP5 59.5-61.4 61.4 1.9 1 1 N/A N/A N/A N/A N/A 0 N/A
GEOGRAPHIC CONTINGENCY IN VOLUTID MACROEVOLUTION
2 NP6 59.0-59.5 59.5 0.5 3 3 2 0 2 2.00 1.05 0 N/A
3 NP8 57.2-58.4 58.4 1.8 3 3 1 0 1 0.33 0.67 0 N/A
4 NP9 55.8-57.2 57.2 1.4 3 3 0 0 0 0 0 0 N/A
5 NP10 54.2-55.8 55.8 1.6 6 6 3 0 3 1.00 0.71 0 N/A
6 NP11 53.7-54.2 54.2 0.5 7 7 1 0 1 0.17 0.10 0 N/A
7 NP12 50.6-53.7 53.7 3.1 7 7 0 0 0 0 0 0 N/A
8 NP13 49.2-50.6 50.6 1.4 7 6 0 1 1 0.14 0.05 1 N/A
9 NP14 46.4-49.2 49.2 2.8 10 8 2 0 2 0.29 0.20 2 1
10 NP15 42.8-46.4 46.4 3.6 12 10 2 0 2 0.20 0.07 2 1
11 NP16 40.6-42.8 42.8 2.2 19 15 5 2 7 0.58 0.16 4 0
12 NP17 37.4-40.6 40.6 3.2 14 10 0 0 0 0 0 4 1
13 NP18 36.8-37.4 37.4 0.6 5 4 0 0 0 0 0 1 0
14 NP19–20 34.4-36.8 36.8 2.4 1 0 0 0 0 0 0 1 0
15 NP21 34.4-33.0 33 1.4 1 0 0 0 0 0 0 1 0
16 NP22 33.0-32.5 32.5 0.5 0 0 0 0 N/A N/A N/A 0 0
TABLE 6. Continued.
NPT per PT per NPT per
No. of PT originations NPT per species per PT per species per NPT per species per
from Total species Myr species Myr species Myr PT net NPT net
Time non-planktotrophic originations speciation speciation PT extinction extinction NPT extinction extinction Proportion speciation speciation
step lineages from NPT rate rate extinctions rate rate extinctions rate rate NP rate rate
1 N/A N/A N/A N/A N/A N/A N/A N/A N/A N/A 0 N/A N/A
2 N/A N/A N/A N/A 0 0 0 N/A N/A N/A 0 1.05 N/A
3 N/A N/A N/A N/A 1 0.33 0.67 N/A N/A N/A 0 0 N/A
4 N/A N/A N/A N/A 0 0 0 N/A N/A N/A 0 0 N/A
5 N/A N/A N/A N/A 0 0 0 N/A N/A N/A 0 0.71 N/A
6 N/A N/A N/A N/A 0 0 0 N/A N/A N/A 0 0.10 N/A
7 N/A N/A N/A N/A 0 0 0 N/A N/A N/A 0 0 N/A
8 N/A N/A N/A N/A 1 0.14 0.05 N/A N/A N/A 0.14 0 N/A
9 0 1 1.00 0.71 0 0 0 0 0 0 0.20 0.20 0.71
10 0 1 1.00 0.36 0 0 0 1 0.50 0.18 0.17 0.07 0.18
11 0 0 0 0 0 0 0 0 0 0 0.21 0.16 0
12 0 1 0.50 0.23 5 0.33 0.15 1 0.25 0.11 0.29 −0.15 0.11
13 0 0 0 0 6 0.60 0.19 3 0.75 0.23 0.20 −0.19 −0.23
14 0 0 0 0 N/A N/A N/A 0 0 0 1.00 N/A 0
15 0 0 0 0 N/A N/A N/A 0 0 0 1.00 N/A 0
16 0 0 0 0 N/A N/A N/A 1 1.00 0.71 0 N/A −0.71
245246 DANA S. FRIEND ET AL.
larger-scale patterns, but a global study is accumulated more rapidly over time (Shuto
beyond the scope of this study. 1974; Hansen 1978, 1980, 1982; Jablonski 1982,
Changes in Larval Mode.—A few general 1986; Jablonski and Lutz 1983). The results pre-
geographic trends in larval modes are known sented here indicate that, despite the multiple
from studies of extant marine invertebrates. shifts to non-planktotrophy, this developmen-
Jablonski and Lutz (1980) noted that the pro- tal mode change did not trigger increased
portion of NPTs relative to PTs increased with cladogenesis, and indeed may have lowered
water depth. But living volutids (all that are speciation rates. Only one species was asso-
known are NPTs) occur in both shallow and ciated with each of two shifts to non-
deeper waters. And because early Cenozoic planktotrophy (33% of origins), while one add-
deposits do not show trends toward deeper itional shift resulted in the NPT clade contain-
water environments, water depth is unlikely ing only four species. This pattern does not
to be causing observed switches and trends support the commonly cited hypothesis that
(Hansen 1978). Additionally, continental posi- NPTs diversify at a higher rates and weakly
tions (reconstructed with paleomagnetic data) supports the competing hypothesis that non-
indicate only minor changes in the paleolati- planktotrophy results in decreased speciation
tude of both the GCP and the ABP (Hansen by limiting the potential for allopatry (with spe-
1978; Torsvik et al. 2012) during the early ciation rates of NPTs found to be lower, but not
Cenozoic; therefore, changes in developmental significantly so). Results from this study are
mode cannot be attributed to changes in more consistent with findings from recent
latitude. phylogenetic studies, which have challenged
A steady trend of global cooling took place non-phylogenetic interpretations of the fossil
throughout most of the time period studied record, and reveal independent origins of non-
herein, beginning after the early Eocene cli- planktotrophy are more common than might
matic optimum, resulting in the onset of be expected and rarely precede bursts of clado-
ephemeral (∼36 Ma) and then permanent genesis (Lieberman et al. 1993; Hart et al. 1997;
(∼34 Ma) Antarctic ice sheets (Zachos et al. Hart 2000; Jeffery et al. 2003; Meyer 2003; Collin
2001). If a relationship between larval develop- 2004; Hart and Podolsky 2005; Krug 2011). The
ment and latitude is mediated by temperature, hypothesis that non-planktotrophy increases
a period of cooling might explain larger num- extinction rates is only weakly supported, and
bers of NPTs (due to less stratification, and the difference was not found to be statistically
increased potential for upwelling). However, significant.
it is doubtful that global temperature changes Gastropod dispersal ability (inferred via lar-
caused the developmental mode changes in val mode) has been repeatedly cited as a text-
Volutospina, as most diversification of PTs book example of how emergent traits can
took place during the Lutetian, the same time affect speciation rates (Jablonski and Lutz
period when most non-planktotrophic lineages 1983; Jablonski 1986; Bergstrom and Dugatkin
originated. 2012). While some authors have invoked spe-
Macroevolutionary Effects of Larval Mode.—It cies selection, several widely cited paleonto-
is essential that we consider selection and sort- logical studies did not actually calculate the
ing hierarchically if we are to understand emergent fitness of the clade (the net outcome
macroevolutionary trends throughout life his- of differential speciation and extinction rates),
tory (Gould 1998; Congreve et al. 2018). This which is the crucial measure of species selection
in turn necessitates the integration of phylogen- (Hansen 1980; Jablonski and Lutz 1983;
etic, ecological, and paleoenvironmental infor- Jablonski 1986). For Paleogene Volutospina,
mation into a coherent interpretation of results here show that planktotrophic lineages
evolution of a clade (Lamsdell et al. 2017). For disappeared from the paleontological record
almost 50 years, studies of gastropods in the in two ways: through extinction (16 instances)
fossil record have reported that NPTs had and through character change to non-
high rates of both speciation and extinction, planktotrophy (3 instances). Similarly, NPTs
and at least some neogastropod clades arose in two ways: speciation (3 instances)
Downloaded from https://www.cambridge.org/core. IP address: 46.4.80.155, on 22 Aug 2021 at 21:35:51, subject to the Cambridge Core terms of use, available at
https://www.cambridge.org/core/terms. https://doi.org/10.1017/pab.2020.60GEOGRAPHIC CONTINGENCY IN VOLUTID MACROEVOLUTION 247
and character change in a planktotrophic Species sorting (Vrba and Gould 1986) can
ancestor (3 instances). Statistical comparison occur when the net diversification rate of a
of speciation and extinction rates suggests lineage is character-state dependent and is
diversification rate was only slightly higher termed “species selection” for emergent traits
for non-planktotrophic volutids. As the one (Stanley 1975; Vrba and Gould 1986; Jablonski
clade of NPTs to diversify also was inferred to 2008; Congreve et al. 2018). Despite compara-
have arisen after a trans-Atlantic dispersal tive studies of species selection currently
event (from a planktotrophic ancestor), the capturing moderate interest, confident identifi-
transition to non-planktotrophy may be only cation of traits linked to diversification rates is
associated with speciation in a region with exceedingly rare (Rabosky and McCune 2010;
unoccupied volutid niche space, while non- Rabosky and Goldberg 2015). In the case of lar-
planktotrophy may have supported persistence val mode, the organism-level trait of larval
of the colonizing population. However, one mode may have nonlinear (emergent) impacts
example is insufficient to draw general on species duration and speciation rate through
conclusions. the mediating species-level traits’ interpopula-
tion connectivity (presumed to dampen
speciation rate) and geographic range (pre-
Conclusions
sumed to impact extinction risk). Despite the
The aim of this research was to examine lar- seemingly substantial and likely irreversible
val mode change in Volutospina from the Paleo- transformation required, shifts to non-
cene–Eocene deposits of the GCP and APB. planktotrophy have occurred in most clades,
Larval modes were mapped onto a phylogeny providing paleontologists with copious poten-
to determine the plesiomorphic larval mode tial study subjects with which to evaluate the
and to hypothesize causes of larval mode evolutionary origins and the resulting effects
switches. Both phylogenetic and non- of reduced dispersal. Across the Volutospina
phylogenetic approaches were used to explore clade, non-planktotrophy appears to have
macroevolutionary trends attributable to dif- both dampened speciation and increased
ferent larval modes. extinction risk and should presumably have
The results indicated that species with plank- been disfavored by species selection, ceteris
totrophic larvae are geologically longer lived paribus. However, while three independent
than species with non-planktotrophic develop- planktotrophic lineages produced non-
ment. Yet there was not a clear-cut relationship planktotrophic lineages, no reversals were
between larval mode and geographic-range observed. This directionality may have led to
size. Biogeographic distribution is the result of a pattern resembling Figure 1C. However,
many variables, including dispersal potential, examining the stratigraphic and geographic
presence or absence of geographic barriers, pattern of the extinction makes it clear that
and environmental tolerance. In the case of this natural experiment did not continue to an
this study, the two larval modes did not possess independent conclusion, but rather was trun-
significantly different geographic-range sizes, cated by a severe extinction event associated
but paleobiogeography of the APB is a factor with global cooling and European shallow
that could potentially limit species ranges, shelf area loss. When studied in proper phylo-
including those of high dispersal capabilities genetic and geographic context, Hansen’s
(in contrast, on a global scale, Halder and Das (1978) conclusions that non-planktotrophy (in
[2019] attributed the limited geographic distri- species of Volutidae) was favored by species
bution of most species within Indovolutinae to selection appear incorrect on two counts: (1)
non-planktotrophic larval mode). The disparity non-planktotrophy is not selectively favored,
in geographic-range size among taxa with simi- and (2) NPTs only “dominate” the clade after
lar dispersal potential may also be associated a major extinction leaves a single surviving spe-
with their environmental tolerances, although cies. This suggests that in the instance of Paleo-
no specific environmental changes were found gene Volutospina, species selection does not
to account for our observations. appear to have driven the trend toward non-
Downloaded from https://www.cambridge.org/core. IP address: 46.4.80.155, on 22 Aug 2021 at 21:35:51, subject to the Cambridge Core terms of use, available at
https://www.cambridge.org/core/terms. https://doi.org/10.1017/pab.2020.60248 DANA S. FRIEND ET AL.
planktotrophy, but rather the clade follows the Boucot, A. 1975. Standing diversity of fossil groups in successive
intervals of geologic time viewed in the light of changing levels
pattern proposed in Jablonski (2017), in which of provincialism. Journal of Paleontology 49:1105–1111.
a chance shift in composition of the clade alters Collin, R. 2004. Phylogenetic effects, the loss of complex characters,
evolutionary dynamics. and the evolution of development in calyptraeid gastropods. Evo-
lution 58:1488–1502.
The dominance of NPTs in extant Volutidae Collin, R., and M. P. Miglietta. 2008. Reversing opinions on Dollo’s
may similarly have been the result of contin- law. Trends in Ecology and Evolution 23:602–609.
gency, either in extinction or through stochastic Collin, R., O. R. Chaparro, F. Winkler, and D. Veliz. 2007. Molecular
phylogenetic and embryological evidence that feeding larvae
accumulation of irreversible transitions (there- have been reacquired in a marine gastropod. Biological Bulletin
fore the result of biased origination of, rather 212:83–92.
than differences in, net speciation rates between Collin, R., and A. Moran. 2018. Evolutionary transitions in mode of
development. Pp. 50–66 in T. J. Carrier, A. M. Reitzel, and
NPTs and PTs) and is a suitable area for future A. Heyland, eds. Evolutionary ecology of marine invertebrate lar-
research in phylogenetic context. While the dif- vae. Oxford University Press, Oxford.
ferences in net diversification rates between non- Congreve, C. R., A. R. Falk, and J. C. Lamsdell. 2018. Biological hier-
archies and the nature of extinction. Biological Reviews 93:811–826.
planktotrophic and planktotrophic Volutospina Coyne, J. A., and H. A. Orr. 2004. Speciation. Sinauer, Sunderland,
species were not found to be statistically signifi- Mass.
cant in the present analysis, it is nevertheless pos- Crampton, J. S., R. A. Cooper, A. G. Beu, M. Foote, and B.
A. Marshall. 2010. Biotic influences on species duration: interac-
sible that increased sample sizes may detect tions between traits in marine molluscs. Paleobiology 36:204–223.
statistically distinguishable speciation and extinc- Darragh, T. A., and W. F. Ponder, eds. 1998. Family Volutidae.
tion rates or volatility. If increased sampling does CSIRO Melbourne, Australia.
Duda, T. F., and S. R. Palumbi. 1999. Developmental shifts and spe-
suggest a statistically significant difference, then cies selection in gastropods. Proceedings of the National Acad-
non-planktotrophic lineages, having potentially emy of Sciences USA 96:10272–10277.
originated due to organism-level selection, are Fedosov, A. E., and N. Puillandre. 2012. Phylogeny and taxonomy
of the Kermia–Pseudodaphnella (Mollusca: Gastropoda: Raphito-
at greater risk of clade extinction due to macro- midae) genus complex: a remarkable radiation via diversification
evolutionary dynamics (Wagner et al. 2018); of larval development. Systematics and Biodiversity 10:447–477.
that is, living dead clades walking (Jablonski Foote, M., Crampton, J. S., Beu, A. G., and R. A. Cooper. 2008. On
the bidirectional relationship between geographic range and
2002; Sang et al. 2019). Only by examining the fos- taxonomic duration. Paleobiology 34:421–433.
sil and extant members of living clades in phylo- Friend, D. S. 2021. Systematics of Paleocene–Eocene Volutospina
genetic context can we properly answer these and (Neogastropoda) from the U.S. Gulf Coastal Plain and the Anglo-
Parisian Basin. PeerJ (in press).
other questions of evolutionary ecology (Lams- Gilinsky, N. L. 1994. Volatility and the Phanerozoic decline of back-
dell et al. 2017). ground extinction intensity. Paleobiology 20:445–458.
Goldberg, E. E., J. R. Kohn, R. Lande, K. A. Robertson, S. A. Smith,
and B. Igić. 2010. Species selection maintains self-incompatibility.
Acknowledgments Science 330:493–495.
Gould, S. J. 1998. Gulliver’s further travels: the necessity and diffi-
The authors extend their gratitude to G. Dietl culty of a hierarchical theory of selection. Philosophical Transac-
and W. Bemis for their guidance and tions of the Royal Society of London B 353:307–314.
Halder, K., and S. Das. 2019. New subfamily Indovolutinae and
L. Skibinski and J. Todd for assistance in other volutids (Volutidae, Gastropoda) from the Eocene of
using collections. We also would like to thank Kutch, western India and their paleobiogeographic implications.
J. C. Lamsdell and S. Tybout for discussions Journal of Paleontology 93:899–915.
Hammer, Ø., D. A. T. Harper, and P. D. Ryan. 2001. PAST: Paleonto-
of volatility. Our appreciation also goes to our logical Statistics Software Package for Education and Data Ana-
reviewers, who greatly helped us improve the lysis. Palaeontologia Electronica 4:9.
article and suggested additional appropriate Hansen, T. A. 1978. Larval dispersal and species longevity in Lower
Tertiary gastropods. Science 199:885–887.
statistical methods. Hansen, T. A. 1980. Influence of larval dispersal and geographic dis-
tribution on species longevity in neogastropods. Paleobiology
6:193–207.
Hansen, T. A. 1982. Modes of larval development in early Tertiary
Literature Cited neogastropods. Paleobiology 8:367–377.
Allmon, W. D., and R. E. Martin. 2014. Seafood through time revis- Hansen, T.A. 1997. Stabilizing selection and the comparative ana-
ited: the Phanerozoic increase in marine trophic resources and its lysis of adaptation. Evolution 51:1341–1351.
macroevolutionary consequences. Paleobiology 40:256–287. Hart, M. 2000. Phylogenetic analyses of mode of larval develop-
Arnold, A. J., and K. Fristrup. 1982. The theory of evolution by nat- ment. Seminars in Cell and Developmental Biology 11:411–418.
ural selection: a hierarchical expansion. Paleobiology 8:113–129. Hart, M. W., and R. D. Podolsky. 2005. Mitochondrial DNA phyl-
Bergstrom, C. T., and L. A. Dugatkin. 2012. Evolution. Norton, ogeny and rates of larval evolution in Macrophiothrix brittlestars.
New York. Molecular Phylogenetics and Evolution 34:438–447.
Downloaded from https://www.cambridge.org/core. IP address: 46.4.80.155, on 22 Aug 2021 at 21:35:51, subject to the Cambridge Core terms of use, available at
https://www.cambridge.org/core/terms. https://doi.org/10.1017/pab.2020.60GEOGRAPHIC CONTINGENCY IN VOLUTID MACROEVOLUTION 249
Hart, M. W., M. Byrne, and M. J. Smith. 1997. Molecular phylogen- Liow, L. H., T. B. Quental, and C. R. Marshall. 2010. Marshall. 2010.
etic analysis of life-history evolution in asterinid starfish. Evolu- When can decreasing diversification rates be detected with
tion 51:1848–1861. molecular phylogenies and the fossil record? Systematic Biology
Jablonski, D. 1982. Evolutionary rates and modes in late Cretaceous 59:646–659.
gastropods: role of larval ecology. Third North American Marshall, C. R. 2017. Five palaeobiological laws needed to under-
Paleontological Convention Proceedings 1:257–262. stand the evolution of the living biota. Nature Ecology and Evo-
Jablonski, D. 1986. Larval ecology and macroevolution in marine lution 1:0165.
invertebrates. Bulletin of Marine Science 39:565–587. McKinney, M. L. 1997. Extinction vulnerability and selectivity: com-
Jablonski, D. 1987. Heritability at the species level: analysis of bining ecological and paleontological views. Annual Review of
geographic ranges of Cretaceous mollusks. Science 238:360–363. Ecology and Systematics 28:495–516.
Jablonski, D. 2000. Micro-and macroevolution: scale and hierarchy Meyer, C. P. 2003. Molecular systematics of cowries (Gastropoda:
in evolutionary biology and paleobiology. Paleobiology 26:15–52. Cypraeidae) and diversification patterns in the tropics. Biological
Jablonski, D. 2002. Survival without recovery after mass extinctions. Journal of the Linnean Society 79:401–459.
Proceedings of the National Academy of Sciences USA 99:8139– Okasha, S. 2006. Evolution and the levels of selection. Clarendon
8144. Press, Oxford, U.K.
Jablonski, D. 2008. Species selection: theory and data. Annual Papazzoni, C. A., V. Ćosović, A. Briguglio, and K. Drobne. 2017.
Review of Ecology, Evolution, and Systematics 39:501–524. Towards a calibrated larger foraminifera biostratigraphic zon-
Jablonski, D. 2017. Approaches to macroevolution: 2. Sorting of ation: celebrating 18 years of the application of shallow benthic
variation, some overarching issues, and general conclusions. Evo- zones. Palaios 32:1–4.
lutionary Biology 44:451–475. Penchaszadeh, P. E., P. Miloslavich, M. Lasta, and P. M. S. Costa. 1999.
Jablonski, D., and R. A. Lutz. 1980. Molluscan larval shell morph- Egg capsules in the genus Adelomelon (Caenogastropoda: Voluti-
ology: ecological applications and paleontological applications. dae) from the Atlantic coast of South America. Nautilus 113:56–63.
Pp. 323–379 in D. C. Rhoads and R. A. Lutz, eds. Skeletal growth Quental, T. B., and C. R. Marshall. 2009. Extinction during evolu-
of marine aquatic organisms. Plenum, New York. tionary radiations: reconciling the fossil record with molecular
Jablonski, D., and R. A. Lutz. 1983. Larval ecology of marine benthic phylogenies. Evolution 63:3158–3167.
invertebrates: paleobiological implications. Biological Reviews Rabosky, D. L. 2010. Extinction rates should not be estimated from
58:21–89. molecular phylogenies. Evolution 64:1816–1824.
Jablonski, D., and J. W. Valentine. 1990. From regional to total geo- Rabosky, D. L., and E. E. Goldberg. 2015. Model inadequacy and
graphic ranges: testing the relationship in Recent bivalves. Paleo- mistaken inferences of trait-dependent speciation. Systematic
biology 16:126–142. Biology 64:340–355.
Jackson, J. B. C. 1974. Biogeographic consequences of eurytopy and Rabosky, D. L., and A. R. McCune. 2010. Reinventing species selec-
stenotopy among marine bivalves and their evolutionary signifi- tion with molecular phylogenies. Trends in Ecology and Evolu-
cance. American Naturalist 108:541–560. tion 25:68–74.
Jeffery, C. H., R. B. Emlet, and D. Littlewood. 2003. Phylogeny and Reid, D. 1989. The comparative morphology, phylogeny and evolu-
evolution of developmental mode in temnopleurid echinoids. tion of the gastropod family Littorinidae. Philosophical Transac-
Molecular Phylogenetics and Evolution 28:99–118. tions of the Royal Society of London B 324:1–110.
King, C. N., A. S. Gale, and T. L. Barry. 2016. A revised correlation of Robertson, R. 1974. Marine prosobranch gastropods: larval studies
Tertiary rocks in the British Isles and adjacent areas of NW and systematics. Thalassia Jugoslavica 10:213–236.
Europe. Geological Society of London Special Reports 27. Sang, S., D. S. Friend, W. D. Allmon, and B. M. Anderson. 2019. Pro-
Krug, P. J. 2011. Patterns of speciation in marine gastropods: a toconch enlargement in western Atlantic turritelline gastropod
review of the phylogenetic evidence for localized radiations in species following the closure of the Central American Seaway.
the sea. American Malacological Bulletin 29:169–187. Ecology and Evolution 9:5309–5323.
Krug, P. J., J. E. Vendetti, R. A. Ellingson, C. D. Trowbridge, Y. M. Scheltema, R. 1978. On the relationship between dispersal of pelagic
Hirano, D. Y. Trathen, A. K. Rodriguez, C. Swennen, N. G. Wil- veliger larvae and the evolution of marine prosobranch gastro-
son, and Á. A. Valdés. 2015. Species selection favors dispersive pods. Pp. 303–322 in J. Beardmore and B. Battaglia, eds. Marine
life histories in sea slugs, but higher per-offspring investment organisms: genetics, ecology and evolution. Plenum, New York.
drives shifts to short-lived larvae. Systematic Biology 64:983–999. Scheltema, R. 1979. Mode of reproduction and inferred dispersal of
Lagomarcino, A. J., and A. I. Miller. 2012. The relationship between prosobranch gastropods in the geologic past: consequences for
genus richness and geographic area in Late Cretaceous marine biogeography and species evolution. Annual Meeting of the Geo-
biotas: epicontinental sea versus open-ocean-facing settings. logical Society of America Abstracts 11:126.
PLoS ONE 7:e40472. Scheltema, R. S. 1977. Dispersal of marine invertebrate organisms:
Lamsdell, J. C., C. R. Congreve, M. J. Hopkins, A. Z. Krug, and paleogeographic and biostratigraphic implications. Pp. 73–108 in
M. E. Patzkowsky. 2017. Phylogenetic paleoecology: tree-think- E. G. Kauffman and J. E. Hazel, eds. Concepts and methods in bio-
ing and ecology in deep time. Trends in Ecology and Evolution stratigraphy. Dowden, Hutchinson, and Ross, Stroudsburg, Penn.
32:452–463. Shuto, T. 1974. Larval ecology of prosobranch gastropods and its
Less, G., and E. Özcan. 2012. Bartonian–Priabonian larger benthic bearing on biogeography and paleontology. Lethaia 7:239–256.
foraminiferal events in the Western Tethys. Austrian Journal of Stanley, S. M. 1975. A theory of evolution above the species level. Pro-
Earth Sciences 105:129–140. ceedings of the National Academy of Sciences USA 72:646–650.
Lester, S. E., B. I. Ruttenberg, S. D. Gaines, and B. P. Kinlan. 2007. Stanley, S. M. 1979. Macroevolution, pattern and process. Freeman,
The relationship between dispersal ability and geographic San Francisco.
range size. Ecology Letters 10:745–758. Stanley, S. M. 1986. Population size, extinction, and speciation: the
Levinton, J. S. 1974. Trophic group and evolution in bivalve mol- fission effect in Neogene Bivalvia. Paleobiology 12:89–110.
luscs. Palaeontology 17:579–585. Strathmann, R. 1974. The spread of sibling larvae of sedentary mar-
Lieberman, B. S., and E. S. Vrba. 1995. Hierarchy theory, selection, ine invertebrates. American Naturalist 108:29–44.
and sorting. BioScience 45:394–399. Strathmann, R. R. 1978. The evolution and loss of feeding larval
Lieberman, B. S., W. D. Allmon, and N. Eldredge. 1993. Levels of stages of marine invertebrates. Evolution 32:894–906.
selection and macroevolutionary patterns in the turritellid gastro- Thorson, G. 1950. Reproductive and larval ecology of marine bot-
pods. Paleobiology 19:205–215. tom invertebrates. Biological Reviews 25:1–45.
Downloaded from https://www.cambridge.org/core. IP address: 46.4.80.155, on 22 Aug 2021 at 21:35:51, subject to the Cambridge Core terms of use, available at
https://www.cambridge.org/core/terms. https://doi.org/10.1017/pab.2020.60You can also read