Projections of global emissions of fluorinated greenhouse gases in 2050 - | CLIMATE CHANGE
←
→
Page content transcription
If your browser does not render page correctly, please read the page content below
| CLIMATE CHANGE |               17/2009

       Projections of global emissions
       of fluorinated greenhouse gases
       in 2050
| CLIMATE CHANGE |                          17/2009

ENVIRONMENTAL RESEARCH OF THE GERMAN
FEDERAL MINISTRY OF THE ENVIRONMENT,
NATURE CONSERVATION AND NUCLEAR SAFETY
Project-no. (FKZ) 3708 42 311
Report-no. (UBA-FB) 001318

Projections of global emissions of
fluorinated greenhouse gases in 2050

by
Barbara Gschrey
Winfried Schwarz

Öko-Recherche

On behalf of the German Federal Environment Agency

UMWELTBUNDESAMT
This publication is only available online. It can be downloaded from
http://www.umweltbundesamt.de/uba-info-
medien/mysql_medien.php?anfrage=Kennummer&Suchwort=3866
along with a fact sheet.

The study is part of the project "Emission projections of HFCs,
PFCs and SF6 in Germany and the global situation until 2050"
(Project-no. (FKZ) 3708 42 311).

The contents do not necessarily reflect the official opinions.

ISSN 1862-4359

Publisher:         Federal Environment Agency (Umweltbundesamt)
                   P.O.B. 14 06
                   06813 Dessau-Roßlau
                   Germany
                   Phone: +49-340-2103-0
                   Fax: +49-340-2103 2285
                   Email: info@umweltbundesamt.de
                   Internet: http://www.umweltbundesamt.de

Edited by:         Section III 1.4 Substance-related Product Issues

                   Dessau-Roßlau, November 2009
I
Content
Summary ................................................................................................................................................ II
1. Current global emissions of fluorinated greenhouse gases.................................................... 1
1.1 Global quantity and share of emissions of fluorinated greenhouse gases ................................... 1
1.2 Emission sources of Kyoto F-gases.............................................................................................. 4
1.3 Growing banks of fluorinated greenhouse gases.......................................................................... 5
1.4 Emissions of chlorine-containing and chlorine-free F-gases ........................................................ 6
2. Emissions of fluorinated greenhouse gases and political framework in
developing and developed countries ......................................................................................... 9
3. Main assumptions for the projection of future emissions ..................................................... 12
4. Global emissions of fluorinated greenhouse gases in 2050 .................................................. 15
4.1 Population, economic situation and status of phase out in 2050................................................ 15
4.2 Quantification of emissions in 2050 per sector ........................................................................... 16
1. Refrigeration and air conditioning ............................................................................................. 17
2. Foam blowing............................................................................................................................ 22
4. Aerosols .................................................................................................................................... 23
5. Solvents .................................................................................................................................... 23
6. Fire extinguishers...................................................................................................................... 24
7. Conventional applications......................................................................................................... 24
8. Filling and distribution losses.................................................................................................... 26
4.3. Overview of global emissions of fluorinated greenhouse gases in 2050 ................................... 27
5. Contribution of fluorinated GHG gases to global warming in 2050 ...................................... 31
6 Conclusions ................................................................................................................................ 34
References ........................................................................................................................................... 35
Annex 1 Emissions of CFCs, HCFCs and Kyoto F-gases in 2005 .................................................. 37
Annex 2 Calculation of sector-specific GWPs (2050) ...................................................................... 39
Annex 3 Overview of growth rates .................................................................................................... 41
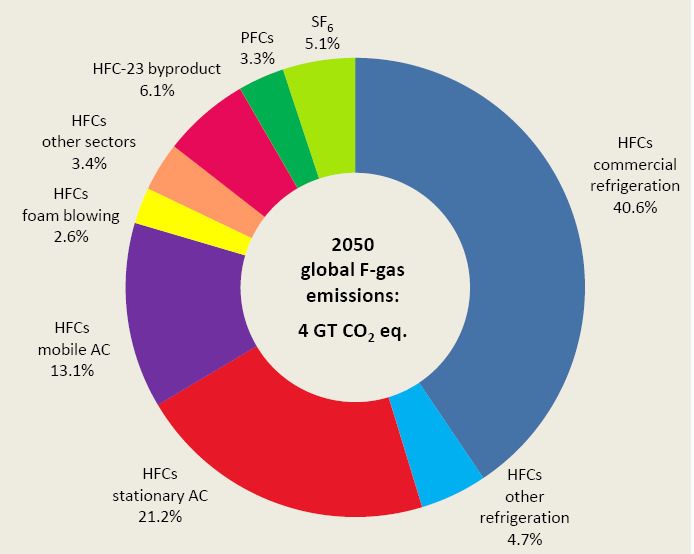
Annex 4 Projections of F-gas emissions in 2050 by sector............................................................ 42II Summary Emissions of fluorinated greenhouse gases are currently covered under the Montreal Protocol, which focuses on ozone-depleting substances such as CFCs (chlorofluorocarbons) and HCFCs (hydrochlorofluorocarbons), and under the Kyoto Protocol, which controls emissions of HFCs (hydrofluorocarbons), PFCs (perfluorocarbons) and SF6 (sulfur hexafluoride). This study bridges the gap between political regimes and their reporting systems by giving an overview of banks and emissions of all fluorinated gases in 2005, and projections of banks and emissions of fluorinated gases in 2050. The Montreal Protocol and its amendments will eventually result in the full phase out of CFCs and HCFCs. Developed countries have already completed the phase out of CFCs and will reach full phase out of HCFCs by 2020. Developing countries, in contrast, will phase out CFCs by 2010 and HCFCs by 2030. Although climate-friendly technology is available for most applications, the risk occurs that substitutes for ozone-depleting substances rely on HFCs, which cause global warming. This study determines global emissions of HFCs, PFCs and SF6 (Kyoto F-gases) in 2050 in a “business-as-usual” scenario. The global population is expected to increase to ca. 8.7 billion people, and high economic growth of 3.5% per year is assumed. Emissions in 2050 are quantified for each sector of application as well as for developed and developing countries based on growth rates of each sector. In 2050, total global emissions of fluorinated greenhouse gases are projected to amount to 4 GT CO2 eq. which equals ca. 5.9% of the total greenhouse gas emissions at this time. Compared to a relatively small share of F-gas emissions ranging around 1.3% of total greenhouse gas emissions in 2004, this percentage reflects an enormous increase. Relative to projected direct CO2 emissions alone, the 2050 F-gas emissions will even account for ca. 7.9%. In case of CO2 mitigation, this share would be significantly higher. The commercial refrigeration sub sector and the air conditioning (stationary and mobile) sector will account for about 75% of F-gas emissions in 2050. In most sectors, emissions from developing countries will exceed emissions from developed countries. Large banks of HFCs will cause F-gas emissions well beyond 2050. In order to limit F-gas emissions, it appears crucial to consider measures to reduce emissions from all sectors in both developed and developing countries. The current post- Kyoto negotiation process might provide an opportunity to address these issues within a wider scope. A switch from substances that cause global warming to climate friendly alternatives is considered inevitable to be undertaken in the near future in developed countries. Developing countries, in contrast, are facing the chance to replace ozone- depleting substances directly by climate friendly alternatives, and could hence benefit from technologies developed in the last decades. The study does not exclude other scenarios on future HFC emissions. Like earlier projections, it underlines the urgent need for mitigation measures of F-gas emissions. Frankfurt/Main, October 2009
1

1. Current global emissions of fluorinated greenhouse gases

1.1 Global quantity and share of emissions of fluorinated greenhouse gases

Since 1987, the Montreal Protocol and its amendments control production and consumption
of ozone depleting substances (ODS). Presently, the regulations apply to 96 chemicals
including chlorofluorocarbons (CFCs), halons, hydrobromofluorocarbons (HBFCs),
hydrochlorofluorocarbons (HCFCs), and others. Most of the fluorinated ozone-depleting
substances (CFCs, HCFCs) are being phased out which has resulted in a significant
decrease of ODS production and consumption all over the world since the 1980s.

However, most of the ODS substitutes (HFCs, PFCs) are greenhouse gases which
contribute to climate change. Some of the substitutes are hence covered under the United
Nations Framework Convention on Climate Change (UNFCCC, 1994) and its Kyoto
Protocol (adopted 2005), which is an agreement on legally binding measures to reduce
greenhouse gas emissions.

The UNFCCC stipulates that emissions of greenhouse gases are reported by those countries
that have acceded to the Convention (to date 192 countries) in order to tackle the challenge
posed by climate change. The UNFCCC requirements do not apply to CFCs and HCFCs
already controlled by the Montreal Protocol.

The Kyoto Protocol promotes emission reductions of greenhouse gases such as carbon
dioxide (CO2), methane (CH4), nitrous oxide (N2O), hydrofluorocarbons (HFCs),
perfluorocarbons (PFCs), and sulfur hexafluoride (SF6). HFCs, PFCs and SF6 are often
summed up in the term “fluorinated greenhouse gases” or “F-gases”. In this study, they are
referred to as “Kyoto F-gases” or “chlorine-free F-gases”. In January 2009, 183 parties had
ratified the Kyoto Protocol, out of which 41 developed countries (Annex 1) committed
themselves to emission reduction targets. The USA is the only Annex 1 country to the
UNFCCC who did not ratify Kyoto Protocol.

In general, fluorinated ozone-depleting substances and Kyoto F-gases are characterized by
a long atmospheric lifetime and are therefore estimated to highly contribute to global
warming over a long time span. Thus, their global warming potential (GWP) is relatively
large, and they are sometimes referred to as “high GWP gases”. The IPCC calculates a short
term GWP (20 years), a medium term GWP (100 years) and a long term GWP (500 years)
for each greenhouse gas. They are referred to as GWP20, GWP100 and GWP500.

Under the Kyoto Protocol, the Conference of the Parties decided that the values of GWP100
calculated for the IPCC Second Assessment Report (1996) are to be used for converting the
various greenhouse gas emissions into comparable CO2 equivalents when computing and
reporting overall sources and sinks. However, the values of GWPs are updated regularly. In
this study, GWPs from IPCC 2007 were used (Table 1) unless other GWPs are indicated.

This study focuses on current and future global emissions of fluorinated greenhouse gases.
Projections for emissions of fluorinated greenhouse gases in the year 2050 are based on
current trends and emissions in developed and developing countries.
2

                                        Table 1:
                 Global warming potentials (GWPs) of various fluorinated
                                  greenhouse gases
                                           IPCC 1996       IPCC 2007
                Gas                         GWP 100         GWP 100
                Carbon dioxide (CO2)                 1               1
                Methane (CH4)                       21              25
                Nitrous oxide (N2O)                310             298
                HFC-23                          11,700          14,800
                HFC-32                             650             675
                HFC-125                          2,800           3,500
                HFC-134a                         1,300           1,430
                HFC-143a                         3,800           4,470
                HFC-152a                           140             124
                HFC-227ea                        2,900           3,220
                HFC-236fa                        6,300           9,810
                HFC-245fa                          560           1,030
                HFC-365mfc                        n. e.            794
                HFC-43-10mee                     1,300           1,640
                NF3                               n. e.         17,200
                CF4 (PFC-14)                     6,500           7,390
                C2F6 (PFC-116)                   9,200          12,200
                C3F8 (PFC-218                    7,000           8,830
                c-C4F8 (PFC-318)                 8,700          10,300
                SF6                             23,900          22,800

                      n. e. = not estimated

In 2004, global greenhouse gas emissions of ca. 40.5 GT CO2 eq. were reported (emissions
from land use, land use changes and forestry excluded; IPCC, 2007). So far, the share of
Kyoto F-gases in global greenhouse gas emissions has been relatively small and ranged
around 1.3% of global emissions in 2004 (Diagram 1). However, reported emissions of Kyoto
F-gases increased 20% since 1995, which is the base year for these substances in most
countries (Netherlands Environmental Assessment Agency, 2006).

Developed countries under the UNFCCC (Annex 1 countries) are obliged to annually report
their emissions to the UNFCCC Secretariat. The list of Annex 1 countries comprises 40
parties including most European countries, Turkey, the United Kingdom, the Russian
Federation, Japan, Australia, New Zealand, and North America. Under the Kyoto Protocol,
emissions of HFCs, PFCs and SF6 caused by developed countries are assessed and
monitored. Greenhouse gas emissions from Annex 1 parties currently account for 63.7% of
total greenhouse gas emissions (UNFCCC, 2009).

It has to be noted that IPCC estimations of emissions mostly focus on CO2, N2O and CH4,
whereas emissions of fluorinated greenhouse gases are neglected due to their small share.
The 2004 database of fluorinated greenhouse gas emissions has not been updated since.
3
Diagram 1:
Global emissions of greenhouse gases (CO2,
CH4, N2O, F-gases) in 2004 (IPCC, 2007).
Global greenhouse gas emissions amounted
to ca. 40.5 GT CO2 eq. (excluding land use,
land use change and forestry). Kyoto-F-gases
were estimated to account for 0.54 GT CO2
eq. (1.3%).
Table 2 shows total greenhouse gas emissions, total emissions of Kyoto F-gases and
emissions of HFCs, PFCs and SF6 in developed countries (Annex 1 countries) in 1990,
2000 and 2006 as reported to the UNFCCC.
We estimate, however, that the reported data actually underestimate emissions of Kyoto F-
gases. This is due to the facts that, firstly, not all sectors of application are reported by the
countries, and secondly, not all Annex 1 countries did report emissions of Kyoto F-gases
which, however, do occur undoubtedly.
Table 2: Total greenhouse gas emissions, total emissions of F-gases (MT CO2 eq.) and
share of F-gases (%; HFCs, PFCs, SF6) in Annex 1 countries in 1990, 2000 and 2006 as
reported to the UNFCCC Secretariat. (UNFCCC website)
Annex 1 countries 1990 2000 2006
MT CO2 eq. % MT CO2 eq. % MT CO2 eq. %
Total GHG emissions 23,157 100 21,734 100 22,171 100
Total F-gases 326 1.4 349 1.6 366 1.6
HFCs 128 39 231 66 278 76
PFCs 97 30 64 18 43 12
SF6 101 31 54 16 45 12
Although the share of total Kyoto F-gas emissions has not increased from 2000 to 2006
(1.6%), the absolute amount of emissions has increased from 349 MT CO2 eq. in 2000 to
366 MT CO2 eq. in 2006. This is mostly due to a rise of emissions of HFCs used as
substitutes for ODS which were being phased out in developed countries in the respective
time period. The share of HFC emissions in total Kyoto F-gas emissions rose from 39% in
1990, just some years after the adoption of the Montreal Protocol, to 66% in 2000 and 76%
in 2006.
A comparison of Kyoto F-gas emissions from Annex 1 countries with total global emissions
indicates that developed countries accounted for 65% in 2004.4
1.2 Emission sources of Kyoto F-gases
Emissions of Kyoto F-gases occur during both their production and their use in industrial
applications (Diagram 2). Production emissions are much smaller than emissions arising
from use (and decommissioning) of the products.
• Manufacturing and distribution emissions result from unintentional losses during
manufacture of F-gases in the Chemical industry, from charging of equipment, and from
container management. In addition, the undesired by-product HFC-23 arises during the
production of HCFC-22.
• “Conventional applications” which were introduced in the 1970s such as electric
switch gear systems, manufacture of semiconductors, magnesium manufacturing (EPA,
S.4-1). (Primary aluminium production is also included in this category.) These sectors of
application are usually not included as F-gas emission sectors in the IPCC reports.
Diagram 2:
Emission sources of high GWP gases.
Sources of high GWP gases
Industrial sources Substitutes for ODS
Production Conventional Refrigeration / Foam-blowing
applications airconditioning agents
Byproduct of Magnesium Medical Non-medical
HCFC-22 industry aerosols (MDI) aerosols
manufacture
Semiconductor Solvents Equipment for
Losses manufacture fire protection
during
manufacture Electricity
transmission
equipment
Primary
aluminium
production
• Kyoto F-gases are used widely as substitutes for ODS in a variety of applications, such
as refrigeration, stationary and mobile air conditioning, foams, metered dose inhalers
(MDI), non-medical aerosols, solvents, and equipment for fire protection, which used to
contain ODS. In the early stages of the Montreal Protocol, HCFCs were introduced as
interim replacements for CFCs (and halons) in some parts of the world, where they now
get substituted by HFCs or low GWP alternatives. In developing countries, however,
conversion from CFCs and halons to ODS-substitutes continues.
Despite a significant decrease in production and use of ODS, the quantity of material
contained in existing equipment remains considerably large (IPCC SROC, 2005).5 1.3 Growing banks of fluorinated greenhouse gases Banks are the total amount of substances contained in existing equipment, chemical stockpiles, foams and other products which are not yet released to the atmosphere. Although the magnitude of banks remains uncertain, their contribution to global warming is expected to be comparable with that of HFC emissions to the atmosphere in the next few decades. The UNFCCC addresses anthropogenic emissions by sources of all greenhouse gases not included in the Montreal Protocol. Its Kyoto Protocol regulates emissions of CO2, N2O, CH4, HFCs, PFCs and SF6. In contrast, the Montreal Protocol, (which deals with ODS only), does not take emissions into account, but rather production and consumption. Therefore, emissions due to releases of CFCs and HCFCs from banks are covered neither by the Montreal Protocol nor the UNFCCC/ Kyoto Protocol. (IPCC SROC, 2005) Current emissions profiles of ODS and their substitutes are largely determined by historical use patterns. The bank-turnover varies for different applications from months (e.g. solvents) to several years (refrigeration) to several decades (foam insulation). The banks stored in equipment and foams leak during use of the products and at the end of the product life-cycle if not recovered or destructed. Since banks of CFCs and HCFCs are estimated and monitored under the Montreal Protocol, data on quantity and emissions are updated quite regularly. Banks of HFCs, however, are not covered by any global regime, and, thus, are not observed globally. Global CFC banks currently amount to 450,000 t mostly installed in developing countries (70%). HCFCs (mainly HCFC-22) form the dominant refrigerant banks of ca. 1,500,000 t which equals about 60% of the global total amount of refrigerants in use. Two thirds of the HCFC banks are installed in developing countries. (RTOC Assessment Report 2006) Without any bank management, future emissions will be determined significantly by the build-up of HFC banks from HFCs substituting ODS in both developed and developing countries. HCFC banks will continue growing in developing countries only because production and consumption of HCFCs can continue in these countries until 2030. In this study, the growing Kyoto F-gas banks in both developed and developing countries play a key role for the emission projections.
6

1.4 Emissions of chlorine-containing and chlorine-free F-gases

The Kyoto Protocol refers to just a small share of global emissions of fluorinated greenhouse
gases as chlorine and bromine containing F-gases are excluded by definition. Since the
Montreal Protocol includes chlorine and bromine containing F-gases such as
chlorofluorocarbons (CFCs), hydrochlorofluorocarbons (HCFCs) and halons, it was decided
not to treat them any further in the Kyoto Protocol which, consequently, applies to chlorine-
free and bromine-free F-gases only. Emissions of chlorine and bromine containing F-gases
(Montreal Protocol) accounted for 15% of the global direct GHG emissions in 1990.

Before 1990, emissions of chlorine-free F-gases were not caused by ODS substitutes yet
but were released from industrial applications only, which were mostly introduced in the
1970s (“conventional applications”). Emissions from conventional applications include
   -   HFC-23 from the production of HCFC-22;
   -   SF6 from electrical equipment, magnesium manufacturing, sound-proof glassing,
       soles of sports shoes, car tyres, military aircraft radars, nuclear industry (uranium
       hexafluoride production) etc.;
   -   PFCs from primary aluminium production and manufacturing of semiconductors.

In total, the emissions of HFC-23, SF6 and PFCs from conventional applications amounted to
about 30,000 metric tons in 1990, which accounted for approximately 0.34 GT CO2 eq.
These emissions remained at the same level through 2000. An increase of fluorinated
greenhouse gas emissions throughout the last years has been caused completely by ODS-
substitutes. During the 1990s, substitutes for chlorine containing F-gases (ODS) were
developed and introduced in most sectors such as refrigeration, air conditioning, aerosols,
solvents, fire protection and foams.

Since 1991, the emissions of chlorine-free F-gases have been driven significantly by
production and consumption of ODS substitutes. Yet, not all of the applications of HCFCs
and CFCs in 1990 were replaced by HFCs as the ban of ODS has also resulted in a series of
innovative methods and substances which do affect neither the ozone layer nor the climate.
CFCs and HCFCs have hardly been substituted in aerosols, solvents, and fire extinguishing
equipment. Concerning emissions of ODS-substitutes, it should be emphasized that the
GWP of HFCs is considerably lower than the GWP of most CFCs.

In the “business as usual” scenario of this study, we assume that CFCs and HCFCs
(chlorine-containing gases) currently used in various applications will become substituted to
some extent by HFCs, which then will contribute to HFC emissions, but also by other
alternatives such as natural refrigerants and blowing agents. The share of non-HFC
substitutes for ODS varies between applications and regions.

Today, emissions of fluorinated greenhouse gases comprise three categories:
   -   HFC-23, SF6, PFCs from conventional applications;
   -   HFCs which have already substituted ODS;
   -   CFCs and HCFCs which have not been substituted yet but will be replaced by HFCs
       and non-HFC alternatives within the next decades.
7 Diagram 3, which is based on Table 3, illustrates global emissions of CFCs, HCFCs, and Kyoto F-gases, including HFCs used as ODS-substitutes and emissions from conventional applications such as HFC-23, SF6 and PFCs, in 2005. Total emissions of fluorinated greenhouse gases in 2005 are estimated at 2,352 MT CO2 eq. (including halons). Emissions from Kyoto F-gases (HFCs for ODS; conventional applications) accounted for 717 MT CO2 eq. (30%), while the major share was contributed by CFC and HCFC emissions (ODS). Diagram 3: Global emissions of CFCs/Halons, HCFCs, and Kyoto F-gases including applications using HFCs as ODS substitutes and conventional applications (i.e. HFC-23 by product emissions, PFCs, SF6) in 2005 (GWP100; MT CO2 eq.). It is striking that the column for CFCs is much higher than the others although major reductions of emitted quantities have been reached as a result of the Montreal Protocol. This is due the high GWP of CFCs. Therefore, emissions are high as well. Kyoto F-gas emissions (HFCs for ODS; conventional applications) indicated in Diagram 3 are high compared to the data shown in Diagram 1. This can be explained partly by referring to the years the datasets are based on (Diagram 1: 2004/ Diagram 3: 2005). Moreover, the 2005 data (Diagram 3; Table 3) include several emission sources which were not comprised in previous datasets but got compiled from various scientific publications (Annex 1).
8

Table 3: Global emissions of ODS (CFCs, HCFCs) and Kyoto F-gases (HFCs as ODS
substitutes; HFC-23, SF6 and PFCs from conventional applications) in 2005 (MT CO2 eq.).
                   Refrigeration
                                                              Aerosols        Fire
2005                   & Air          Foams         MDI
                                                             & Solvents    fighting
                                                                                        Total
                   Conditioning
ODS
CFCs                     932           109           50           -            -        1,091
Halons                    -             -             -           -           34          34
HCFCs                    475           29             -           7           1          512
ODS substitutes
HFCs                     284             5           8           25            1         323

Subtotal sectors        1,679          143           58          32           36        1,960

Conventional applications
HFC-23 by product                                                                        182
SF6                                                                                      142
PFCs                                                                                      68

TOTAL global (MT CO2 eq.)                                                               2,352
Note: This dataset is based on several sources and can be found in Annex 1. The emissions in Table
3 are mostly based on SROC data which used GWP values from IPCC 2001 and WMO 2003. The
data in Annex 1 are hence higher than the data in Table 3 as we used GWPs from IPCC 2007 as
listed in Table 1.

In 2005, the refrigeration and air conditioning sector accounted for ca. 70% of global ODS
and Kyoto F-gas emissions. The largest share of emissions from this subsector was
contributed by CFCs and HCFCs which are mostly contained in old equipment.

Emissions from foam blowing agents accounted for ca. 6% of global emissions, which were
composed of CFCs and HCFCs mostly, too.

The share of emissions from conventional applications was about 18%.
9
2. Emissions of fluorinated greenhouse gases and political
framework in developing and developed countries
Both, the Montreal Protocol and UNFCCC/ Kyoto Protocol distinguish between developed
countries (Non-Article 5/ Annex-1 countries) and developing countries (Article 5 countries/
Non-Annex-1) according to the agreed timeframe for phase out/ the members’ commitments
to reduce emissions.
In 2008, 146 countries were listed as operating under Article 5 of the Montreal Protocol (A5
countries) including most of Africa, Latin America and Asia. Eastern European transformation
countries and the Russian Federation are no longer A5 countries as their per capita
consumption of ODS has increased over the threshold of 0.3 kg per year.
Table 4 shows that the consumption of both CFCs and HCFCs varies significantly between
developing and developed countries. Most CFCs are currently consumed in A5 countries,
whereas they are almost phased out in developed countries.
Table 4: ODS consumption by CFCs and HCFCs (ODP tons) in developing countries (A5)
and developed countries (non-A5) in 2005
CFCs HCFCs total
(ODP tons) (ODP tons)
Developing countries (A5) 43,328 21,620 64,948
Developed countries (non A5) 846 10,278 11,124
TOTAL 44,174 31,898 76,072
Source: UNEP Ozone Secretariat website. Recalculation into GWP values is not possible.
The large difference in ODS consumption between developing and developed countries has
been caused mostly by the Montreal Protocol. While ODS were phased out within a few
years in industrialized countries, developing countries are allowed to organize their phase out
over a longer time period. Thus, the potential for emissions of chlorine-free F-gases (HFCs)
in developing countries remains high as long as the ODS phase out is not completed.
Current phase out schedules for HCFCs are shown in Table 5.
Table 5: Accelerated phase out schedule for HCFCs in non- A5 (developed) countries and
A5 (developing) countries
Year Non A5 countries A5 countries
Baseline 1989 Average of 2009 and 2010 levels
1996 Freeze
2004 35%
2010 75%
2013 Freeze
2015 95% 10%
Full phase out
2020 (a reserve of 0.5% of the baseline is 35%
allowed for servicing within the decade)
2025 67.5%
2030 100% Full phase out
(97.5% reduction for 10 years; a reserve is
allowed for servicing needs)
2040 100%10 In absence of the Montreal Protocol, the use of CFCs would have increased significantly all over the world (IPCC SROC, 2005). The adoption of the Protocol, however, caused the almost complete phase-out of use and production of CFCs in developed countries, and a rapid fall in developing countries. CFC production in developed countries was banned in 1996, while in some developing countries production continues until 2010. The phase out of HCFC production and consumption has also been scheduled under the Montreal Protocol. In September 2007, the Parties to Protocol even agreed to accelerate the phase-out of HCFCs (Table 6). • Developed countries, having already frozen production, are required to fully phase out production and consumption of HCFCs by 2020. • Developing countries (Article 5 countries whose annual calculated level of consumption of the controlled substances is less than 0.3 kilograms per capita) are required to freeze production in 2013, at average the level of 2009 – 2010, and undertake a graduated step- down in consumption and production to a full phase-out in 2030. In 2040 at the latest, ODS will be neither produced nor consumed any more in developing countries. However, the risk occurs that today’s applications of ODS will turn into future applications of HFCs, which highly contribute to global warming. The risk that substitute technologies will focus on HFCs is quite high as large HFC production capacities are already installed in major developing countries. Financial mechanisms enabling the compliance of developing countries and countries with economies in transition under the Multilateral Fund of the Montreal Protocol and the Global Environmental Facility have fostered the use of HFCs in recent years. After the phase out of CFCs in developed countries, existing markets have now absorbed the production of HFCs and PFCs. Rapidly expanding markets and the phase out of CFCs in developing countries in 2010 have also resulted in an expansion of the HCFC-22 and HCFC-141b production capacity. It is thus important that additional measures are taken to replace HCFCs with substitutes that have zero or low GWPs, as well as to improve leakage and recycling rates of existing equipment. Some regions that have been supported under the Multilateral Fund for the implementation of the Montreal Protocol have benefited from access to hydrocarbon technologies. Under certain political pressure, it has been possible to convert some production plants in India and China to the use of hydrocarbons (HCs) instead of HFCs. In contrast, conversion happens slowly and usually towards HFCs in regions such as South Asia and Sub-Saharan Africa, indicating small scale production of many manufacturing plants of appliances. A number of national initiatives and international cooperation projects have recently focussed on the promotion of zero or low GWP substances in order to take a step forward towards global HFC phase out. These initiatives comprise for example legal measures, such as the EU F-Gas Regulation (2006) and an EU-Directive preventing the use of HFC-134a in mobile AC equipment, as well as voluntary commitments by certain sectors (e.g. the initiative
11

Refrigerants, Naturally! in supermarkets and vending machines) or certain regions (e.g.
California).

Technology transfer to developing countries is also supported by the Clean Development
Mechanism (CDM), which is an instrument under the Kyoto Protocol fostering investment in
environmentally friendly infrastructure in developing countries in order to reduce emissions.

However, a global framework and future emission reduction targets under the UNFCCC post-
Kyoto-regime are currently unclear as negotiations for the commitment period from 2012 to
2020 will take place end of the year 2009 in Copenhagen at COP15. Pressure is mounting
particularly in large non-Annex 1 countries like Brazil, China, and India to accept binding
commitments to reduce their greenhouse gas emissions in the post-2012 period.

As large reductions of total greenhouse gas emissions are relatively cheap and easy to
achieve by emission reductions of Kyoto F-gases in comparison with other greenhouse
gases (multi-gas abatement strategy), it seems possible that developing countries will
approach emission sectors of Kyoto F-gases at an early stage of their potential commitment
period. In fact, the abatement option of reducing greenhouse gases other than CO2 has been
acknowledged through the GHG basket approach adopted in the Kyoto Protocol targets and
the US administration GHG intensity strategy already, allowing full substitution among CO2,
CH4, N2O, HFCs, PFCs and SF6 (Lucas et al. 2007).
12

3. Main assumptions for the projection of future emissions

The “business-as-usual” scenario (BAU) presented in this study is based on some
assumptions concerning future trends of emissions. These emissions in developed and
developing countries will highly depend on a number of drivers, such as political measures,
population growth, the expected worldwide increase in disposable income, etc.

For our projections of the main greenhouse gases (CO2, N2O and CH4) in 2050, we use
scenarios from the SRES Report (IPCC SRES, 2000). The report describes four “families” of
in total forty scenarios which are explained by one storyline each (A1, A2, B1, B2). Bearing in
mind the development of the world since the publication of the SRES report in 2000, the A2
and B2 storylines seem not to take current trends into account, such as globalisation and
rapid economic development in certain countries.

Hence we decided to use a scenario that combines the two remaining marker scenarios A1
and B1. They both assume economic growth and rapid introduction of new technologies. The
A1 family develops into three groups that describe alternative directions of technological
change in the energy system, such as fossil intensive (A1FI), non fossil energy sources
(A1T), and balanced across all sources (A1B). As future development will highly depend on
political decisions to be made within the next few years, we decided to use the A1B scenario
as it seems to be less extreme than A1FI and A1T.

In contrast to A1B, the B1 family describes a convergent world with the same global
population as in the A1 storyline but with rapid change in economic structures towards a
service and information economy, with reductions in material intensity and the introduction of
clean and resource efficient technologies. The emphasis is on global solutions to economic,
social and environmental problems.

In order to reflect the range of potential options of the development until 2050 as assumed by
SRES, we took the average of the quantitative projections of the two scenarios A1B and B1
for the projections of greenhouse gas emissions in 2050 (Chapter 5), economic growth and
population growth.

The population growth assumed by the two SRES scenarios (and their combination) has
been well in line with real statistical data of the world population, and the population in
developed and developing countries (World Bank statistics 2007). According to the SRES
projections, the world population will increase to 8.7 billion people until 2050, which reflects
an annual growth rate of ca. 0.6% (2010 – 2050). 17% of the 2050 population will live in
developed countries, and 83% in developing countries. The annual growth rate of the
population in developed countries amounts to 0.24% until 2050, and to 0.83% in developing
countries.

We applied the two categories “developed countries” and “developing countries” in this study
in order to illustrate different political, social and economic conditions in different countries.
Although the economic and social situation of a specific country might change throughout the
next decades, we assume these categories to remain unchanged.
13

The term “developed countries” refers to non-Article 5 countries under the Montreal Protocol
such as North America, Japan, Australia, New Zealand, Europe, Eastern European
transforming countries and the Russian Federation. In large parts, this category is also
consistent with the list of Annex 1 countries under the Kyoto Protocol. The term “developing
countries” covers all Article 5 countries.

Concerning the future economic situation, our scenario (combined A1B/B1 from SRES)
assumes rapid innovation and change towards a service and information economy. Growth
rates range at 2% in developed countries and 5.5% in developing countries.

The assumed high economic growth will cause a rise in disposable income in developing
countries. This is an important driver of the demand for e.g. household appliances and
serves as a basis for the projections of future HFC emissions from the domestic refrigeration
subsector.

Equally important for future demand for HFCs is the political framework in both developed
and developing countries. We consider in particular the Montreal Protocol and its
amendments including the accelerated phase out schedule for HCFCs (Chapter 2) to play a
fundamental role for emission reductions. Our projections assume that all existing political
measures will remain in place such as the accelerated HCFC phase out and relevant
national regulations. These also comprise commitments under the Kyoto Protocol which
caused some countries to adopt legislation restricting the use of fluorinated greenhouse
gases in some applications, e.g. the EU F Gas regulation (2006).

The rates for HFC recovery, reuse and destruction at the end of product life are difficult to
assess and can be quantified hardly for future decades. For the projection, recovery rates
are thus assumed to be constant although new technology might increase recovery rates
at some point. Furthermore, it is assumed that the use-phase emission rates of 2005 will
remain unchanged. Emission rates include both use-phase and disposal emissions.

Table 6 gives an overview of the emission rates applied in the projections for each sector.
Emission rates differ between developed and developing countries and are mostly based on
the latest TEAP report (UNEP TEAP Task Force Decision XX/8 Report, 2009). Disposal
emissions from refrigeration, air conditioning and fire extinguishing equipment are included in
bank emissions. Disposal of foam products does not occur until 2050, except for appliances.
14

      Table 6: Emission rates for each sector of application in developed and
      developing countries as assumed in the projections
                                     Developed countries      Developing countries
      Domestic refrigeration                               6%
      Commercial refrigeration              18%                        22%
      Industrial refrigeration              11%                        13.7%
      Transport refrigeration               25%                        30%
      Stationary AC
         Unitary AC systems                 11%                        13%
         Chillers                           7.7%                       8.8%
      Mobile AC                             18%                        24%
      Foam blowing
          XPS                                   30% First Year, 1% Bank
          PU Rigid                              10% First Year, 1% Bank
          PU Integral, OCF                          100% First Year
          Appliances                            5% First Year, 1% Bank
      Aerosols, Solvents, MDI                             100%
      Fire extinguishing
         Portable systems                                  4%
         Fixed systems                                     2%
      Filling/ distribution losses                         2%

As HCFC phase out will take place within the next decades and HFC emissions are
controlled by the Kyoto Protocol, zero or low GWP alternatives for various applications are
increasingly being developed and in use all over the world. In this study, which presents a
business-as-usual scenario, we assume the share of alternative technologies to remain
constant through 2050.

Unlike a recent publication by Velders et al. (2009), the business as usual scenario in this
study follows a sectoral approach. While Velders et al. (2009) base their projections on sales
data and assume that the consumption of HFCs will grow proportional to the population from
2020 to 2050, we assume sector-specific growth rates for both developed and developing
countries.
15
4. Global emissions of fluorinated greenhouse gases in 2050
4.1 Population, economic situation and status of phase out in 2050
As outlined earlier, the scenario presented in this study is a so-called “business as usual”
scenario which assumes that all existing measures continue and emission rates, recovery
rates and common practices remain unchanged.
In 2050, the world population will reach 8.7 billion people based on SRES projections (IPCC
SRES, 2000). About 83% will then live in the current “developing countries” (annual growth
rate 0.83%) and 17% will live in the current “developed countries” (annual growth rate
0.24%).
Free trade, continued innovation, and a stable political and social climate are assumed to
enable developing regions to access knowledge, technology, and capital. Combined with a
rapid demographic transition, this is thought to lead to acceleration of economic growth in
time and space. The global economy is projected to expand at an average annual rate of
3.5% to 2050. Growth rates in developing countries range at 5.5% and in developed
countries at 2% respectively.
Assuming that current phase out schedules are implemented, emissions in 2050 will be
released from different sources than today.
• Direct CFC emissions will not occur any more, and CFC banks practically do no longer
exist.
• Some HCFC emissions are released from refrigeration and AC equipment, as well as
from foam products manufactured in developing countries until 2030 and still in use.
Please note that emissions of CFCs and HCFCs from remaining banks are neglected in the
emission projections for 2050 as their quantity is expected to be very low. The projections will
hence focus on emissions of chlorine-free fluorinated greenhouse gases previously referred
to as Kyoto F-gases.
• Considerable emissions of HFCs are expected as they will replace a large share of
HCFCs in developed and developing countries until 2030 and beyond. Large HFC banks
in equipment will account for future emissions well beyond 2050.
• An increase of emissions from conventional applications is expected to take place mostly
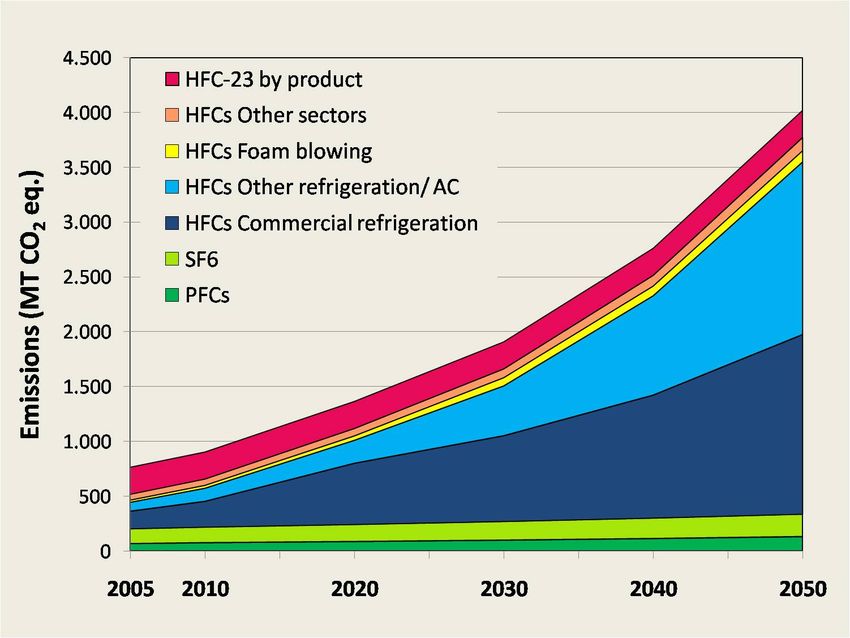
in developing countries due to economic growth.16 4.2 Quantification of emissions in 2050 per sector Future growth rates for each sector and resulting emissions in 2050 are identified as follows. Diagram 4 shows the trend of F-gas emissions through 2050. The diagram does not explicitly reflect certain political milestones, e.g. the global HCFC phase out in 2030, but includes important legal measures, e.g. the EU directive on HFC-134a phase out from passenger cars. This is due to the fact that the year of interest of this study is 2050. Growth rates were hence determined for time periods of several decades. However, the diagram points out that the steep increase of emissions is mostly caused by the refrigeration and air conditioning sector, which will be treated in detail below. Diagram 4: Trend of global F-gas emissions until 2050 by sectors of application. The steep rise in F-gas emissions until 2050 is primarily caused by the expansion of the refrigeration and air conditioning sector, especially the commercial refrigeration sector In many cases, this study relies on data for banks and emissions from the IPCC SROC (2005) report and the latest TEAP report (UNEP TEAP Task Force Decision XX/8 Report, 2009) when considering the time period until 2020. The sector-specific market growth in the period 2020 - 2050 is based on own assumptions and projections by market researchers. These long-term growth rates are lower than the data on market growth given by the TEAP report because we assume market saturation. For each sector of application, different growth rates are applied in developed and developing countries until 2050 (Annex 3).
17

1. Refrigeration and air conditioning

General trends
The refrigeration and AC sector continues to be the main driver of future emissions of
fluorinated greenhouse gases. A strong increase of HFC emissions reflects the phase-out of
CFCs (completed 2025) and HCFCs (completed 2050) from existing equipment as well as
the growing demand for new equipment that operates with HFCs from the beginning.

Current dominant refrigerant options for each sub-sector are listed in Table 7.

     Table 7. Dominant refrigerant options by sub sectors in developing and developed countries
                                        Developing countries           Developed countries
    Domestic refrigeration                              HFC134a, HC-600a
    Commercial refrigeration                  HCFC-22                   HFC-134a, R-404A
    Industrial refrigeration                  HCFC-22                     HFCs, ammonia
    Stationary AC                       HFC-134a, HCFC-123               HFC-134a, blends
    Mobile AC                                HFC-134a                HFC-134a, low-GWP fluids
Source: TEAP 2008.

Future demand for refrigeration and air conditioning equipment will vary between developed
and developing countries.

•     In developed countries, the demand for refrigeration equipment is expected to remain
      constant as their markets are saturated to a large extent and population growth is
      expected to be low. The demand for air conditioning, however, is likely to grow in non-
      saturated markets such as Europe, because average annual temperatures will increase
      due to climate change.
•     In developing countries, significant growth of the refrigeration and air conditioning
      sector is expected as the demand for chilling and cooling rises when population grows,
      economies develop and urbanisation proceeds.

Domestic refrigeration
An estimated 1,500 to 1,800 million units of domestic refrigerators and freezers are currently
installed globally (UNEP TEAP Task Force 2009). Increase in demand for domestic
refrigerators is driven by population growth, disposable income, urbanisation, and
electrification.

In addition to the projection of a global population of 8.7 billion people in 2050, we assume
an ownership rate of 1 unit per household, and average household sizes of 4 in developing
countries1 and of 2 in developed countries2. Hence, the total number of domestic refrigerators

1
  The current average household size in China is 3.2 (China Statistical Yearbook 2007), in India 4.8
(International Institute for Population Sciences: National Family Health Survey 2005-2006 National
Fact Sheet, 2006. http://www.nfhsindia.org/pdf/IN.pdf).
18 is estimated to amount to about 2.5 billion units. 70% of the units will be installed in developing countries and 30% in developed countries. The increase in the number of installed domestic refrigerators and freezers reflects an annual growth rate of 1.2%. At the moment, about 65% of the current new production of domestic refrigerators and freezers employs HFC-134a, and 35% employ hydrocarbon refrigerants (UNEP TEAP Task Force Decision XX/8 Report, 2009). The total number of domestic refrigerators running on HFC-134a in 2050 is hence projected to amount to 1.65 billion units. The vast majority (80%) of the systems running on hydrocarbon refrigerants is installed in developed countries. In the business as usual scenario, we assume these rates to remain constant. Commercial refrigeration The sector includes small, medium and large vending and storage equipment in super markets, food trade, etc. The short-term growth rates of the refrigerant banks until 2020 and the banks themselves are from the latest TEAP Report (global: 1,270 kt) (Annex 5, UNEP TEAP Task Force Decision XX/8 Report, 2009). The commercial refrigeration sector grows faster than the population in both developed and developing countries, as the demand for refrigerated and frozen food increases overproportionally when economies develop and urbanisation proceeds3. In developed countries, recent increases in the consumption of chilled and frozen food4 reflect changes in lifestyle and demography. Short-term growth rates range from 1.8 - 2.7% in developed countries to 2.6 – 5.2% in developing countries (2002-2015; IPCC SROC 2005; see Annex 3). We assume gradual market saturation during the period 2020-2050 and hence estimate long-term growth rates to be lower than short-term rates. A growth rate of 3.5% per year is assumed for developing countries as population growth and economic development will continue. For developed countries a growth rate of 1% per year is estimated as societies get older and more people are expected to live in urban areas. Industrial refrigeration This sector includes food processing, cold storage, and to a smaller part non-food refrigeration and freezing in manufacturing industry, chemical and power-generation plants, etc. In the same way as for the commercial refrigeration sector, we base our projections of the size of refrigerant banks in 2020 on the latest TEAP report (global: 256.8 kt) (Annex 5, UNEP TEAP Task Force Report, 2009). 2 The current average household size in Germany amounts to 2.1 and is expected to decrease (Statistisches Bundesamt- Ergebnisse der Haushaltsvorausberechnung 2007). Household size in the USA is 2.61 (2006 American Community Survey, U.S. Census Bureau). 3 In Brazil, the market for frozen food grew at an annual rate of 7.4% and the market for chilled food at 3.3% (2001–2006). In China, the market for chilled food grew at 13.4% (2001–2006) (Datamonitor 2008: Frozen Food in Brazil to 2011; Chilled Food in Brazil to 2011; Chilled Food in China to 2011). 4 Sales of chilled convenience food in Germany grew at an annual rate of ca. 7% in the period 2003- 2008 (CMA 2008).
19

Short-term growth rates are estimated at 1% in developed coutries and at 3.6-4% in
developing countries (IPCC SROC, 2005). In developed countries, the long-term growth rate
(2020-2050) is expected to be lower and to amount to 0.5% per year as market saturation
will occur in some countries.

In developing countries, however, the sector is expected to grow at fairly high rates due to a
certain backlog in the production of frozen food5, and because population growth and
economic development will continue. For HFC systems only, we assume a growth rate of 3%
in developing countries. Systems containing ammonia or other natural fluids are expected to
increase at higher rates but will not be considered in the emission projections.

Transport refrigeration
This sector includes refrigerated ship holds, refrigerated road vehicles, and reefer containers.
The demand for transport of chilled and frozen food is expected to rise considerably in both
developed and developing countries due to changes in lifestyle, urbanization and population
growth. The short-term growth rates of the refrigerant banks until 2020 and the banks are
from the latest TEAP Report (global: 26.52 kt) (Annex 5, UNEP TEAP Task Force Decision
XX/8 Report, 2009).

Short-term growth rates (2002-2015) of the sector were estimated to range from 1-3% in
developed countries to 3.3-5.2% in developing countries (IPCC SROC 2005). Since
saturation of the global transport refrigeration sector does not seem likely in a globalised
world as long as population growth and economic development continue, significant long-
term growth is assumed. Projections are based on an annual rate of 1.5% in developed
countries and 3.5% in developing countries in the period 2020-2050. As refrigerated
transport is strongly linked to consumption of chilled and frozen food, and hence the
commercial refrigeration sector, similar growth rates are used for projections of emissions
from these sectors.

Stationary Air Conditioning
The sector comprises air conditioning by centralised chillers for large buildings and air
conditioning by unitary systems which refer to a variety of decentralised devices for flats or
individual rooms in commercial and residential applications: portable, window-mounted, split,
multi-split systems, ducted or non-ducted air conditioners and heat pumps, packaged
systems etc. Asia-Pacific currently constitutes the largest market for air conditioning
equipment in the world (ca. 40% by value), followed by the Americas, while India and the
Middle East represent significant potential for future growth6.

5
 Example: The Indian market of frozen French fries and potato specialties is only 8,000 t (2009; Quick
Frozen Food International, April 2009), which is far below the German market of 420,891 t (2008;
Deutsches Tiefkühlinstitut e.V.), although potatoes are known as an everyday meal in both countries.
6
 BSRIA Ltd, 2009: http://www.bsria.co.uk/news/global-air-conditioning-sales-reach-us70-billion-in-
2008/
20

The use of chillers for air conditioning of office space, commercial buildings, hotels etc. has
increased at annual rates of over 10% in recent years7, but experienced a decline of 6% in
value in 20088 due to the economic crisis. In the last years, a certain portion of sales of
commercial air conditioning equipment have shifted from small chillers to unitary systems for
lower installation cost and increased flexibility of floor-by-floor large building systems (UNEP
RTOC 2006).

As for residential air conditioning, ownership rates vary between developed and developing
countries and according to climatic conditions9. Recent evolution of the market has shown
that air conditioner ownership can increase at higher rates than economic growth in warm
climate countries. In 1990, less than 1% of urban Chinese households owned an air
conditioning unit; in 2006 the share had increased to 88% (China Statistical Yearbook 2007).
Countries in warm climate hence have a higher potential for residential AC ownership than
temperate regions, in particular if market saturation is still low.

The projections presented in this study refer to the size of refrigerant banks in 2020 as
forecasted by the latest TEAP report (global: 1,758 kt) (Annex 5, UNEP TEAP Task Force
Report, 2009). The shares contributed by unitary systems (79%) and by chillers (21%) are
adopted from projections by UNEP (UNEP RTOC 2006).

Short-term growth rates (2003 – 2015) of the sector are estimated at 1-3.8% in developed
countries and 5.4-6% in developing countries (IPCC SROC, 2005). Long-term growth rates
are expected to be lower than short-term rates because of market saturation in some
regions10, but will follow population growth and economic development. Long-term growth
rates for unitary systems are assumed to be 1% in developed countries and 4% in
developing countries. For chillers we assume long-term growth rates of 1% in developed
countries and 3% in developing countries.

Total banks will more than double (from 1,758 kt in 2020 to 3,610 kt in 2050), banks in
developing countries will more than triple (from 724 kt in 2020 to 2216 kt in 2050).

Mobile AC
Mobile air conditioning (MAC) refers to air-conditioning systems in motor vehicles (i.e. cars,
trucks, and buses), agricultural and construction vehicles and rail vehicles. More than 80% of
the refrigerants of this sector are contained in passenger cars. Refrigerant use is already
considerably high, especially in cars in USA and Japan. Currently, about 30% of the total

7
 The total chiller market grew from US$ 5,951 million in 2006 to US$ 6,630 million in 2007 (+11.4%)
(JARN- Air conditioning, Heating and Refrigeration News, 2008).
8
 BSRIA Ltd, 2009: http://www.bsria.co.uk/news/global-air-conditioning-sales-reach-us70-billion-in-
2008/
9
 Saturation rates for residential air conditioners of several developing countries and their cooling
degree days are provided by McNeil & Letschert (2008).
10
  Market saturation for room air conditioners in Europe has been projected to begin around 2025-2030
(Pout & Hitchin 2008). The Japanese market for room air conditioners is mature already (JARN Ltd.
2008: http://www.ejarn.jp/Type_news_inside.asp?id=10307&classid=4). Mexico is projected to reach
an ownership of over 80% in 2030 from about 20% in 2005 (McNeil & Letschert, 2008)
21

global HFC emissions are from MACs including the emissions in production, use, servicing
and end-of-life (UNEP TEAP Task Force 2009). In developed countries, the car population is
today considerably higher than in developing countries, which indicates an enormous
potential for future car ownership.

The global vehicle stock amounted to about 800 million units in 2002 (Dargay et al., 2007),
and is expected to increase worldwide within the next decades as economies develop. In
2030, about 2 billion vehicles are projected to be in use (Dargay et al., 2007), which refers to
growth rates of 1.4% in developed countries and 6.5% in developing countries (2002–2030).
For the period 2030-2050, we assume an annual growth rate of 0.5% in developed countries
and 3.5% in developing countries, which will result in a total fleet of 3.3 billion vehicles in
2050. This number includes buses, trucks, heavy duty vehicles, etc. which are assumed to
account for ca. 15% of the global fleet.11

We assume that just about 85% of the vehicles are equipped with MAC systems that run on
HFC-134a. This derives, firstly, from legislation in Europe which prohibits the use of HFC-
134a in passenger cars from 2017 onwards. Currently, about 10% of the worldwide car fleet
is registered in the EU. Secondly, a certain share of low-cost vehicles in developing countries
will not feature a MAC system at all (e.g. Nano by Tata). We estimate this market share to
account for about 5% of the global market. In 2050, the number of vehicles with MAC
systems will hence amount to 2.8 billion units.

11
   This number is well in line with calculations by Meyer (2005) on the global passenger car fleet,
which used the Gompertz model approach and resulted in a global stock of 2.7 billion cars in 2050.
Assuming that buses, trucks etc. account about for another 15-20%, the global fleet will amount to 3.3
billion vehicles in total.
22

2. Foam blowing

The high amounts of CFCs and HCFCs formerly used in this sector will not be replaced by
HFCs in the future. Hydrocarbons will be used as blowing agents instead, which are
technically equal and much cheaper. HFCs will be limited to applications of particularly high
insulation performance or applications that require incombustible blowing agents.

Over the next years, a stable quantity of fluorinated greenhouse gases of ca. 125 kt/ year will
be consumed globally for foam products of PU and XPS (UNEP FTOC 2006). Developed
countries will use 75 kt/ year of HFCs (HFC-245fa, HFC-134a, HFC-365mfc-227ea, HFC-
152a). Developing countries, in contrast, continue using ca 50 kt/ year of HCFCs (HCFC-
141b, HCFC-142b, HCFC-22) which will be fully replaced by HFCs by 2030. We assume
hydrocarbons to account for the entire future increase in consumption of blowing agents.
This implies a long-term rate of HFC consumption we assume to remain constant until 2050
(growth rates are zero in developing and developed countries).

We do not follow the IPCC SROC report (2005) which assumes sharp reduction in HFC
consumption from 2015 onwards, but does not give a plausible explanation for this
assumption in a no-action scenario. Applications of fluorinated greenhouse gases in the foam
sector which will not be replaced by HCs completely include XPS boards, PU spray foam, PU
appliances, and PU integral skin. Almost equal shares of emissions arise from three sources:
manufacturing, banks, and decommissioning.
You can also read