ANNEXURES: DRAFT NATIONAL SPATIAL
    DEVELOPMENT FRAMEWORK
←
→
Page content transcription
If your browser does not render page correctly, please read the page content below
ANNEXURES: DRAFT NATIONAL SPATIAL
DEVELOPMENT FRAMEWORK
Contents                                                                                                                     B4.1
                                                                                                                             B4.2
                                                                                                                                       Spatial Logic.......................................................................................... 23
                                                                                                                                       Spatial Description of Production Heartland, Agri-Enterprise Regions
                                                                                                                             and Eco-Resource Production Regions (As used in NSDF Sub-Frame 3) .............. 24
Annexure A: Background to selected data layers used for the analysis
                                                                                                                             B4.3      Significant plans, studies and sources that informed the spatial specific
of fine grained population, socio economic and climate change                                                                selection of frame elements ................................................................................ 26
analysis and projections .................................................................... 1
                                                                                                                             B5. Additional Spatial Descriptions for National Connectivity
               Supportive Information on Spatial Information and Models ....... 1                                            Network - Sub-Frame 4:........................................................................ 29
                                                                                                                             B5.1      Spatial illustration of national significant energy infrastructure as part
           Regional Spatial Data Frame used for Indicators and Settlement
                                                                                                                             of national connectivity network ......................................................................... 29
     Pattern Analysis ..................................................................................... 1
                                                                                                                             B5.2      Significant plans, studies and sources that informed the spatial specific
           Population Projections and Spatial Settlement Growth Modelling                                                    selection of frame elements ................................................................................. 30
     and Allocation ........................................................................................ 3               B6. Additional Spatial Descriptions for National Ecological
               Climate Change Projections ......................................................... 9                        Infrastructure Network and Natural Resource Base- Sub-Frame 5: ...... 31
                                                                                                                             B6.1          Spatial Description of National Protect Areas ...................................... 31
Annexure B: Spatial Descriptions in Support of National Spatial
Development Framework ................................................................ 12                                    B6.2 Spatial Description of National Protect Areas ............................ 32
                                                                                                                             B6.3      Spatial Illustration of Significant Inter-Basin Water Transfer Lines...... 33
     B1.       Purpose and role of the Spatial Frame Annexure .......................12                                      B6.4      Additional Spatial Description of National Resource Risk Areas (Sub-
                                                                                                                             Frame 5) 35
     B2.       Spatial Descriptions of Inter-regional, national frame (Sub-Frame
                                                                                                                             B6.5      Significant plans, studies and sources that informed the spatial specific
     1)        12
                                                                                                                             selection of frame elements ................................................................................. 36
     B3.       Spatial Descriptions of Settlements Type (Sub-Frame 2) ............13
     B3.1       Significant Urban Regions and Cities ................................................... 13
     B3.2       National Network of Regional Development Anchors ......................... 14
     B3.3       Identification of regional networks of consolidated and well-connected
     rural service centres ............................................................................................ 15
     B3.4       Significant plans, studies and sources that informed the spatial specific
     selection of frame elements ................................................................................ 15

     B4. Spatial Logic for Natural Resource Production and Selection
     Resource Production areas (As used in NSDF Sub-Frame 3) ..................23

                                                                                                                                                                                                                                                i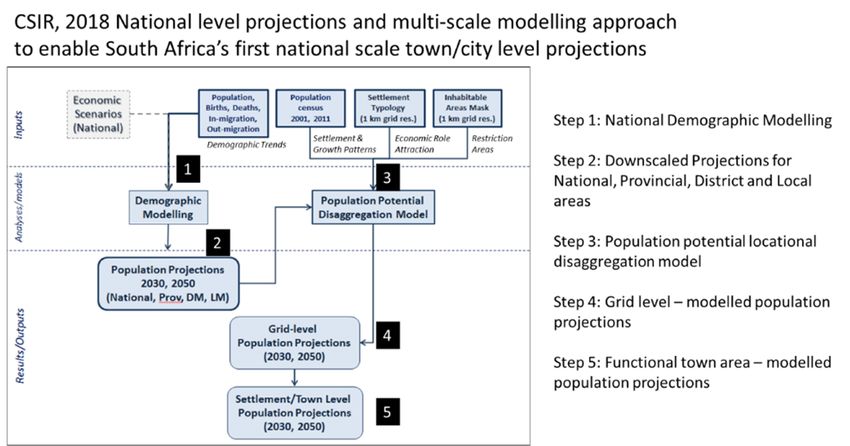
Annexure A: Background to selected data Regional Spatial Data Frame used for
layers used for the analysis of fine grained Indicators and Settlement Pattern Analysis
population, socio economic and climate http://stepsa.org/socio_econ.html for more detail and to
change analysis and projections download data
MESOFRAME
Supportive Information on Spatial Information
The Mesozone data set is referenced several times in the NSDF and was
and Models used for the fine grained spatial analysis of a large number of variables
and indicators. For more information and to download data, please see
This Annexure is not exhaustive and only provides limited information in http://stepsa.org/socio_econ.html
support of the Draft NSDF 2019.
The ‘Mesoframe’ is a demarcation of South Africa into a complete grid
Over the past number of years, the CSIR, together with other role players, of approximately 25 000 spatial units. These mesozones are not uniform in
has invested in building capability to provide spatial planning, analysis, shape but aim to be approximately the same size (~50km2) for improved
modelling and platform support to government, with a focus on comparison of different spaces and more accurate visual representation
strengthening strategic regional, inter-regional and intergovernmental and interpretation of data. The mesozones were created in such a way
planning, resource allocation and monitoring and evaluation in South that they (1) fit within the current municipalities, and (2) are largely
Africa. A key focus was the ability to enable a ‘whole of country’ spatial homogeneous with respect to other significant geo-economic,
relational analysis and comparison of key settlement and population topographic and historic political area demarcations. The zone
data and indicators. boundaries correspond with major travel barriers (such as rivers) as well
as areas demarcated as uninhabited/ sparsely populated
(Mountainous/ wilderness areas) and areas with medium to high levels of
human activity (such as fertile valleys or built up areas).
The population and socio-economic datasets are assigned to
mesozones based on an algorithm developed by the CSIR, which is
based on the principles of dasymetric mapping. This approach is also
used to calculate population distribution at a fine scale. The StatsSA 1996
(Enumerator Areas - EAs), 2001 (Sub Places - SPs), 2011 (SPs) and 2016
(SPs) population figures are used as the input-data for the respective
1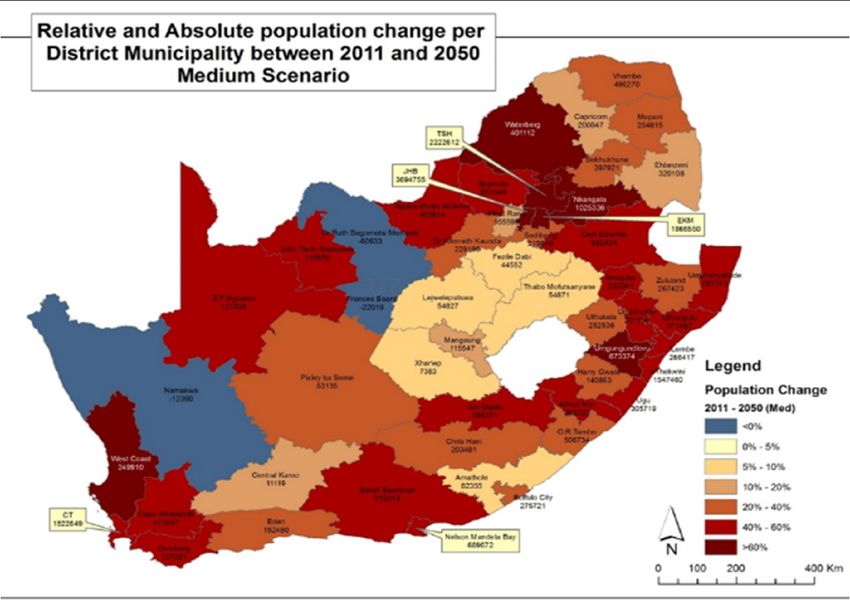
years. These data sets have different spatial demarcations and the data 2010-version of the typology in Chapter 8 in the NDP, 2012; and (2) the
has thus been re-aligned to the mesozones to create a comparable time updated version in the IUDF, 2015, the SACN SOCR, 2016 and the DRDLR
series data set using secondary data. The Spot Building Count (SBC), for Social Facility Toolkit, 2016.
which ESKOM is the data-custodian, is used as the secondary dataset to
assign/ predict the underlying statistical surface of the origin data. In February 2018, the CSIR made available a further update and rework
of the settlement typology that included:
The GVA data for the different economic sectors are produced at local
municipal level by Quantec. The municipal level GVA data has been re- Updated socio-economic indicators based on the CSIR Meso-
assigned to the mesozones using the same principles of dasymetric Frame up to 2016; and
mapping. Secondary data is used to represent the potential points where A derived understanding of potential roles of towns within their
production is occurring to re-assign the economic production data to the regional contexts, including an analyses of national and regional
mesozones. The total employment index per mesozone is derived from gateways and anchors conducted for the Economic
the GVA index by firstly calculating the ratio of GVA production per Development Department in 2014.
sector to the employment per sector for each local municipality. The
employment and GVA data for the different economic sector factor is A finer-grained identification and description of small towns and growing
then multiplied with the economic production values per mesozone. rural settlements, considering their service role within local hinterlands
and not merely based on the population size but also the economy. This
TOWN TYPOLOGY (2010-2018) was further informed by the, CSIR Social Facility Settlement Prioritisation,
2016; DRDLR Social Facility Toolkit, 2016 and the SALGA Small Town
In 2015, the updated CSIR/SACN functional settlement typology that Regeneration Programme, 2017-2018.
provided a mechanism to identify, calculate and analyse a set of
development information and trends pertaining to the range of towns The typology was also updated to include the identification of new and
and cities, as well as high density rural settlements across South Africa was expanding settlement areas by using the unique CSIR Settlement
published. This typology enables an understanding and analyses of the Footprint created in support of the CSIR Green Book, 2019. In this process,
network of settlements, towns and cities and the hierarchical and the built up area of each settlement was demarcated using a
functional relationships between them, especially related to government combination of satellite imagery, housing point data and fine grained
and economic service provision and migration. Given the fact that StatsSA population data sets. This enabled clear demarcation of built-up
spatially comparable administrative information covers wall-to-wall areas that in turn enabled more accurate calculation of population
municipal jurisdiction areas, the functional town area demarcation and numbers and profiling of individual settlements and analysis of changing
town profiling was used extensively as basis to describe and compare settlement dynamics and trends.
cities and towns across South Africa, as well as town growth trends in
support of government policy. This inter alia includes the use of (1) the
2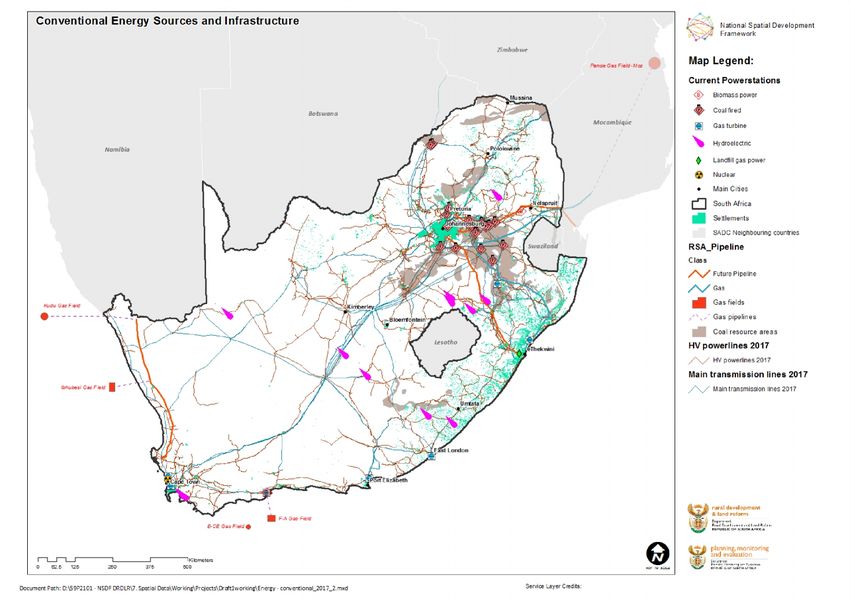
As such, the typology enables calculation of the population and the National population growth projections at country level within
economy of functional town areas (as opposed to municipal area South African-specific context and scientifically verified up to
statistics) and a comparison of town areas relative to non–town areas as 2050 for two growth scenarios. A medium and a high growth
well as the ability to explore regional and spatial inter-relations of scenario were generated by the Green Book 2019 – both verified
settlements as well as the trends within specific types of settlements. The by expert reference groups. After consideration of the scenarios
Typology also enables regional-scale, temporal and spatial comparison and benchmarking against other projections, the NSDF made use
of settlements regardless of administrative boundaries. For access to the of the medium population growth scenario with respect to
spatial frame, and socio-economic indicators, please see ‘Indicator’ planning and implementation.
where the data can also be downloaded. Downscaled medium population growth scenarios developed at
provincial and district scales to understand the most probable
Bibliography: regional growth pressures for 2030 and 2050.
A novel and innovative settlement growth model to derive
For more about the CSIR South Africa Functional Town Typology, see
settlement level population projections. This model has been
van Huyssteen, E. Green, C. Sogoni, Z., Maritz, J. and McKelly, D. South
developed to utilise provincial and district scale population
African Functional Town Typology (CSIR 2018 v2).
growth projections to derive and model growth of individual
settlements. The model utilises a gravity model, based on
“population potential” during the population growth allocation
Population Projections and Spatial Settlement process. The latter is a measure of the “attractive force” of a
Growth Modelling and Allocation particular grid cell for further population growth considers
relational spatial impacts in the model. The expectation of
Population projections and location specific scenario modelling for South different rates of change for the different settlement types was
Africa was undertaken by the CSIR as part of the Green Book (2019) accounted for in the model-making that was done in analysing
process. This was made available for use in the NSDF process and was the spatial attraction of existing agglomeration economies and
used to explore the most likely spatial implication of population growth concentrations based on the CSIR Functional Town Typology,
projections for both low and high in-migration scenarios. This growth 2018 and CSIR Open Settlement Footprint, 2017*.
scenario is a first of its kind to explore the implication of population growth The results of the Population Projections and CSIR Town Growth
taking into consideration migration patterns, as well as spatial-locational Model were used in the NSDF 2018 as a “Without Intervention
attraction and distribution of growth. National Settlement Scenario” of most likely growth pressures for
settlements in South Africa.
In compiling the NSDF, use was also made of the following Green Book The “Without Intervention National Settlement Scenario”
(2018) population modelling outputs: including national growth projections of model results were then
used with the NSDF Vision and implementation frames and the
3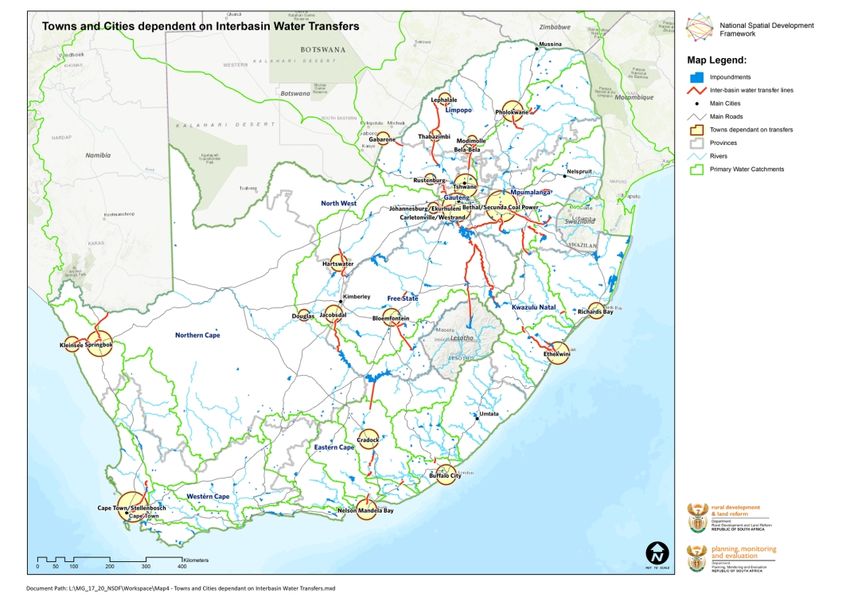
expected impacts of growth and available resources, as #The Settlement Footprint defines the spatial extent of the actual built up areas
highlighted in Part 3 of the Draft NSDF, to construct an alternative of each settlement and differentiates this area from the surrounding rural
hinterland. This layer aims to provide a more accurate GIS based extent of the
envisaged settlement-allocation pattern of the “NSDF
built up footprints of SA settlements. The Settlement footprint was recently
Implementation Settlement Scenario” that is based on a
developed for South Africa, and was defined based on a spatial extent of the
sustainable national settlement growth outcome through settlement footprint created by using a combination of StatsSA small areas and
successful implementation of the NSDF Vision. This alternative main places, the ESKOM spot building count (adapted and corrected) and
NSDF Settlement Allocation Scenario is “a Vision of a preferred land cover related information. Demographic information for the respective
outcome of future spatial patterns given the available settlements has been compiled using the outlined data through a spatial
disaggregation process. The population baseline data made use of StatsSA,
information”, and was informed by (1) significant national
2011 demographic data. For more information see (Maritz et al, 2018 – In
development objectives, (2) the national spatial development
process) Settlement footprint layer 2017, CSIR 2017.
vision, (3) the national spatial development concepts, (4)
resources and outcomes as attractors, and (5) global and Bibliography:
national risks as push factors.
Green Book. 2019. Green Book: Adapting South African settlements to
The CSIR Green Book modelling approach, inputs and high level outputs climate change. www.greenbook.csir.co.za
available are set out in Figure A1 and national level results in Figure A2. Griffin, J. (2012, April 3). The Impact of Climate Change on South Africa .
Retrieved June 13, 2018, from Climate System Emergency Institute:;
The population projections of Prof L. van Tonder, the lead expert for the ttps://www.climateemergencyinstitute.com/cc_s_africa_griffin.html
CSIR, Green Book population projection work, 2018 have been proven to Ziervogel, G., New, M., Archer van Garderen, E., Midgley, G., Taylor, A.,
be consistently accurate over time when compared to World Bank and Hamann, R., et al. (2014). Climate change impacts and adaptation in
United Nations Projections. The modelled national population projections South africa. WIREs Climate Change, 605-620.
for two scenarios, as developed from the model, are indicated in Figure
2. High and medium scenarios refer to differences in international in- Link to the population projections findings:
migration scenarios. National population projections clearly illustrate the Le Roux, A., Arnold, K., Makhanya, S. & Mans, G. 2018. Green Book – South
need to plan for at least a 30% increase in population by 2050, with the Africa’s urban future. Growth projections for 2050. https://pta-gis-2-
medium scenario indicating a population of 75 million by 2050, and the web1.csir.co.za/portal/apps/GBCascade/index.html?appid=5180459a7
higher in-migration scenario, a population of 80 million by 2050. This can 65c4e63bfb3fa527c7302b3 Pretoria: CSIR
have significant spatial implications, with the population projected to
grow primarily in the urban core and secondary cities and large towns.
4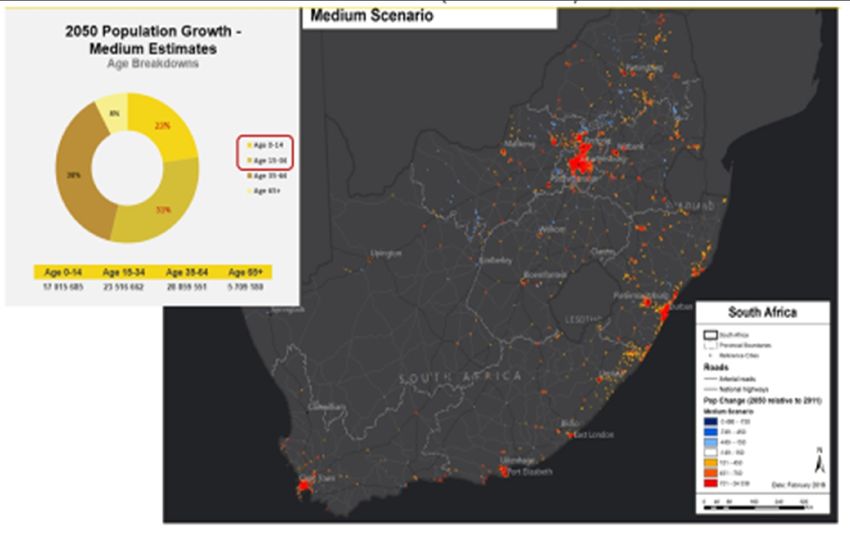
Figure A1: CSIR - National level projections and multi-scape modelling approach to enable South Africa's first national scale town/city level projections

                                                                                                                                                            5
Figure A2: National level projections
Source: CSIR, 2018. Green Book, Population Growth Projections.
Using national level growth projections, provincial and district level allocations were modelled and results can be seen in Figure A 3 and A4. These
were in turn used as inputs for the location-specific modelled results at settlement level using a gravity based model. In addition to demographic
trends the gravity model developed by the CSIR currently enables consideration of:
Past settlement growth patterns,
An economic attraction pull factor depending on the role of a settlement/town or city (using the CSIR, Town Area Typology, 2018 town
demarcations and profiles); and
Location-specific exclusion areas.
6
The projections were downscaled and the methodology tested against a simulation of 2001-2011 population data that provided very high levels of
 accuracy-98% for district level and 95% for settlement level. Please see the diagrams below for examples of downscaled district and settlement
 allocations as used for the “NSDF 2018 Without Intervention National Settlement Scenario” (Medium Population Growth Projections and CSIR Green
 Book Town Growth Model Results). Figure 3 provides information of the downscaled projections at a provincial level.

Figure A3: Provincial level projections (Units shown = millions of people)

Source: CSIR, 2018. Green Book, Population Growth Projections.

                                                                                                                                             7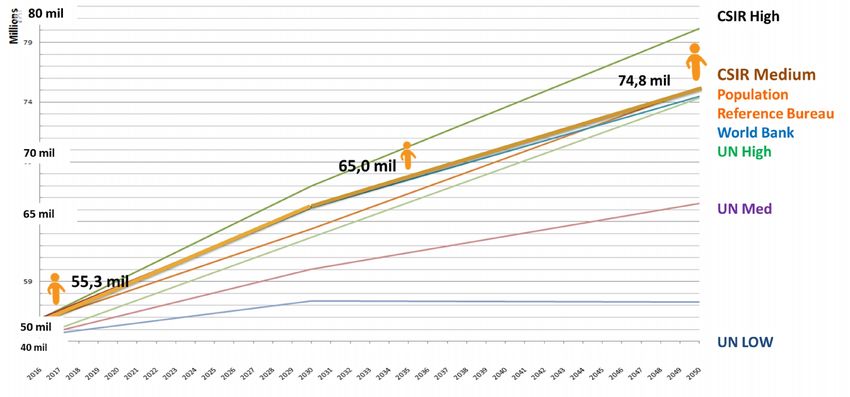
Figure A4: District and Settlement level down scaled medium growth projections: Population change 2011-2050 for “Without Intervention”

 CSIR, 2018 Downscaled Cohort Component Projections at District CSIR, 2018 Downscaled Cohort Component Projections at Settlement
 Scale 2011-2050 Population Growth Estimates Medium Scenario Scale 2011-2050 Population Growth Estimates Medium Scenario (2011-
 (2011-2050)                                                    2050)

  Source: CSIR, 2018. Green Book, Population Growth and Settlement Projections.

                                                                                                                                         8
implications for South Africa discussed. The uncertainty range
Climate Change Projections described by these projections is still to be described within the context
of the much larger, but lower resolution ensemble of AR5 GCM
Climate change is a term that generally refers to a shift in weather projections.
phenomena associated with an increase in global average
temperatures that would have occurred normally over long time Results and Implications
periods. Human intervention, however, is rapidly affecting the average
surface temperatures, which in turn are resulting in changes to climate In order to sufficiently identify the spatial implications of climate
patterns. In compiling the Draft NSDF, use was made of climate change for South Africa, several fine scaled climate change
change projection data from the CSIR Green Book project. projections were recently undertaken as part of a project entitled:
“Settlement design guidelines for climate change adaptation in South
Overview of methodology used for Climate Modelling Africa” (Council for Scientific and Industrial Research, 2016)1. The
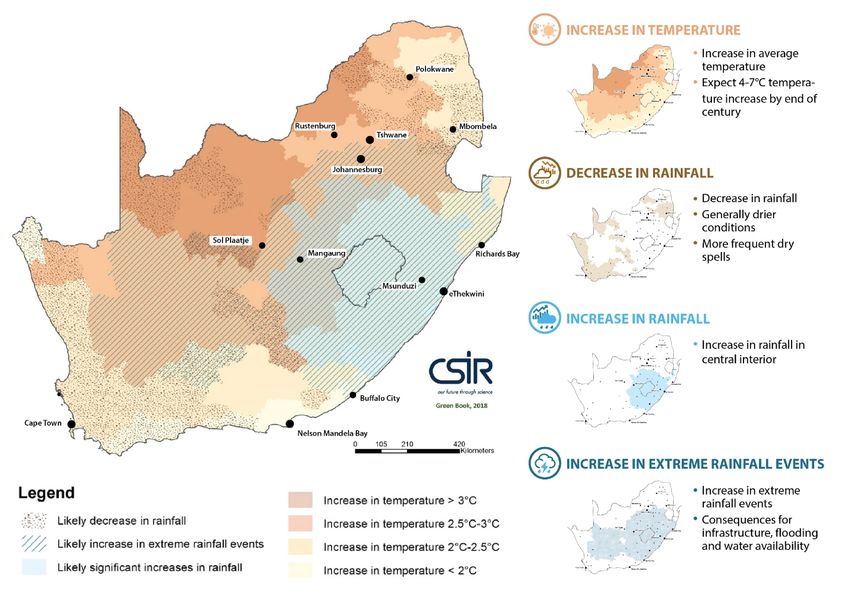
resulting projections generally predict severe temperature increases
Down Scale Climate Modelling at 8 km resolution was conducted by for Southern Africa. It is especially the northern and the western parts
Prof Francois Engelbrecht, CSIR. The 8 km resolution projections were of South Africa that can expect significantly hotter average
obtained by further downscaling of the CSIR’s existing set of 50 km temperatures and more very hot days per year by 2050. By the end of
resolution CORDEX (Coordinated Regional Downscaling Experiment) the century, temperature increases of between 4 and 7°C can be
projections of future climate change. These CORDEX projections are expected over the interior of the country.
for two emission level mitigation scenarios, namely Regional
Concentration Pathway 8.5 (RCP8.5; low mitigation) and RCP4.5 (high Furthermore, generally drier conditions and the more frequent
mitigation). For each of these emission pathways, six global circulation occurrence of dry spells are plausible over parts of the interior as
models (GCMs) that contributed to Assessment Report Five (AR5) of indicated in Figure 7. Areas most affected by decreases in rainfall are
the Intergovernmental Panel on Climate Change (IPCC) were the Western Cape (winter rainfall region), parts of the Northern Cape,
downscaled to 50 km resolution over the globe, as part of the CSIR’s central part of the Eastern Cape and areas in Mpumalanga along the
contribution to CORDEX. eastern escarpment as well as parts of the Limpopo Province.
In the Green Book project, all these simulations (twelve ensemble Increase in annual-average near-surface temperatures are projected
members in total) were downscaled further to 8 km-resolution over to occur over large parts of South Africa, including the western interior
South Africa. The projections were analysed statistically in the Green and northern parts of South Africa. This is critical as the central and
Book of South Africa Climate Change Projection report and the northern parts of the interior are important agriculture production
1
9areas currently. Aligned with the increase in temperatures is the likely suggest an increasingly important role for the central and south-
increase in high fire-danger days, heat-wave days and very hot days eastern part parts of the country for (1) human settlement and (2) food
and drier conditions referred to above. production. To accommodate both, a concerted ‘national spatial
compaction, shrinking, and sharing-drive’ will be required. Changing
For the period 2021-2050, relative to the period 1971-2000, (under low climate could also benefit areas allowing different crops to be
mitigation), rainfall is projected to increase over the central interior and cultivated in areas not previously possible. See consolidated summary
east coast. This is most likely to go hand in hand with extreme rainfall map based on the projections done through the CSIR Green Book
events which have significant implications for infrastructure, flooding (2019) below.
and water availability. Severe climate events are likely to endanger
lives and cause damage to the built environment, which would have Bibliography:
knock-on effects on economic development and negatively impact
service delivery and sustainable development in the areas of greatest Link to the climate change projections findings:
need. The negative impacts are not likely to be limited to the Engelbrecht, F., Le Roux, A. & Arnold, K. 2018. Green Book – Detailed
agricultural sector. The shift in rainfall patterns, together with rising projections of future climate change over South Africa. https://pta-gis-
temperatures and atmospheric carbon dioxide is likely to enhance 2-
vegetation growth in some regions, which could result in bush web1.csir.co.za/portal/apps/GBCascade/index.html?appid=b161b2f
encroachment in Savannah regions – the Kruger National Park is one 892194ed5938374fe2192e537 Pretoria: CSIR
area at risk. This could change ecosystem and population dynamics,
leading to a change in plant and animal communities (Griffin, 2012). Green Book. 2019. Green Book: Adapting South African settlements to climate
change. www.greenbook.csir.co.za
Climate change does pose a significant threat to South Africa’s Griffin, J. (2012, April 3). The Impact of Climate Change on South Africa .
Retrieved June 13, 2018, from Climate System Emergency Institute:;
current water resources, food security, health, established
ttps://www.climateemergencyinstitute.com/cc_s_africa_griffin.html
infrastructure, as well as its ecosystem services and biodiversity.
Considering South Africa’s high levels of poverty and inequality, these Ziervogel, G., New, M., Archer van Garderen, E., Midgley, G., Taylor, A.,
impacts also pose critical challenges for national development Hamann, R., et al. (2014). Climate change impacts and adaptation in South
(Ziervogel, et al., 2014). africa. WIREs Climate Change, 605-620.
Climate change also has serious long-term implications for human
habitation and the productivity of agriculture. These projections
10Figure A7. CSIR, Green Book Climate Change Projections, CSIR (2019
)
Source: Green Book Climate Change Projections, CSIR (2019).
11Annexure B: Spatial Descriptions in Support The Presidency. National Spatial Development Perspective, 2006.
Department of Co-operative Governance. 2016. Integrated Urban
of National Spatial Development Development Framework. A new deal for South African Cities and
Framework Towns.
Department of Co-operative Governance. 2018. Localising the
New Urban Agenda: South Africa Discussion Document.
B1. Purpose and role of the Spatial Frame Economic Development Department. 2011. The New Growth Path
Framework.
Annexure Selection of priority corridors, harbours, ports and trade posts as
well as government investment areas (such as SEZs) and inter-
This Annexure provides some of the spatial specific information and
regional corridors and networks as outlined in:
base considerations in support of the National Spatial Frame and sub-
frames, but does not provide an extensive diagnostic and synthesis
Damon, M. et al. 2014. Spatial Perspective in Support of the
overview. This Annexure is aimed at providing more detail and clarity
New Growth Path. Unpublished Report prepared for Economic
on selected conceptual spatial frame elements, and where relevant,
Development Department;
an indication of spatial specific extent and location.
Transnet, 2016. National ports plan 2016;
TRANSNET. (2016). 30-year Long-term Planning Framework
(Chapter 4 Port Development Plan). Johannesburg:
B2. Spatial Descriptions of Inter-regional, TRANSNET Group; Department of Transport. 2015. National
national frame (Sub-Frame 1) Transportation Plan. Department of Transport;
Amos, S. (2010). The role of South Africa in SADC regional
Significant plans, studies and sources that informed the spatial specific integration: the making or braking of the organisation. Journal
selection of frame elements include, amongst others: of International Commercial Law and Technology, 124-131;
Brand, A. 2017. The use of corridor development as a strategic
Africa Union Commission. (2015). Agenda 2063: The Africa We and supporting instrument towards the development of
Want. national space economies. Potchefstroom: NWU (Unpublished
United Nations. 2016. Habitat III. Quito. 17-20 October 2016. Thesis – PhD); and
United Nations. 2015. Sustainable Development Goals. Brand, A. and Drewes, JE. 2018. Spatial Corridor Model (SCM) –
SADC. (2015). SADC Industrialization Strategy and Roadmap 2015 - structuring economic spaces in South Africa.
2063. Gabarone: SADC.
Southern African Development Community. (2012). Regional
Infrastructure Development Master Plan. Gabarone: SADC.
12B3. Spatial Descriptions of Settlements Type These urban regions and big cities, as priority national nodes on the
urban network, and places within identified growth and transformation
(Sub-Frame 2) corridors, would need to play a critical role for consolidated urban
livelihoods and facilitating a more sustainable and just national spatial
settlement pattern as set out by the NSDF.
B3.1 Significant Urban Regions and Cities
Selection criteria included the following considerations (for studies and
The NSDF spatial frame identifies the urban-regions and cities that are references see B3.4):
foreseen to play a critical role in (1) housing the South African
population and (2) in the national economy and that require focussed Firstly, the spatial extent and densities: High density settlement
intervention (see Table A1). footprint, as well as surrounding functional region that include a
network of linked polycentric urban nodes and surrounding
The three national Urban Regions (identified based on existing densities ‘satellite’ towns, former spatially segregated township areas,
and size, current and projected future population growth (2050), the dense rural settlements and urban social and economic services,
size and diversity of the economy and social and economic reach and characterised by intense socio-economic and daily commuting
inter-regional role), are: interaction. The CSIR Settlement Typology 2018 was used as basis
for demarcation and calculation. The Town Area Typology is based
The Gauteng Urban Region (and surrounding cities in the urban- on a spatial data and indicator framework designed to identify,
innovation belt); track and compare regional and inter-regional spatial and
Cape Town Urban Region (extending towards surrounding urban settlement patterns and trends. The town area extent is based on
clusters); and the ‘GAP Meso Frame’ (2018 Update), an extensive series of spatial
The eThekwini Urban Region (extending to functionally linked areas data indicators derived from StatsSA and verified to enable spatial
within iLembe, Ugu, uMgungundlovu Districts and Msunduzi City). trend analyses, and verified with the fine grained CSIR Settlement
Footprint Layer, 2018 (based on SPOT Building Count, StatsSA
National Urban Nodes include existing and emerging cities identified Enumerator Areas and disaggregated socio-economic trend data
to play a significant role in national and regional development, are: up to 2011).
Secondly, Indicators of size and growth: Population size and growth
Nelson Mandela Bay Metropolitan region; trends, as well as migration attraction indicators;
Mangaung City Area; Thirdly, indicators of economic size and growth, including total
Mbombela City Area; economic output, employment, economic sector specific size and
Rustenburg City Area; growth trends;
Buffalo City Area; Fourthly, inter-regional and national gate-way functions and
Polokwane City Area; services provided, including: administrative functions, ports and
Richards Bay Large Regional Centre; and trade and logistics, and indexes of economic diversity and regional
Msunduzi City Area. economic functional-clustering in terms of international head
offices, the financial sector and international tourism.
13B3.2 National Network of Regional Development Priority regional development anchors were identified from a wide
range of existing and emerging towns, identified as towns that are,
Anchors and could, fulfil a regional function within productive rural regions in
support of national and regional development objectives.
The national network of regional development anchors, that play a key
role in the surrounding rural regions were identified as: The CSIR Town Typology was utilised as basis (See Table A2), to enable
identification of regional settlement nodes. Selection criteria included
the following considerations (for studies and references see B3.4):
Aliwal North Jozini Secunda
Firstly, the location and spatial extent and densities include
Barberton Kokstad Scottburgh/ areas (towns) of dense settlement footprints and surrounding
Beaufort West Kuruman Pennington functional settlement areas that include former spatially
Burgersfort Kroonstad Springbok segregated township areas, and dense rural settlements. As
Bela Bela Ladysmith Swellendam outlined in Annexure A, the Town Area Typology is based on (1)
Bethal Lichtenburg Standerton a spatial data and indicator framework designed to identify,
Bethlehem Makopane/Mmabatho Thohoyandou track and compare regional and inter-regional spatial and
Brits Mossel Bay Queenstown settlement patterns and trends (‘GAP Meso Frame’ (2018
Bushbuckridge Oudtshoorn Upington Update) and (2) an extensive series of spatial data indicators
Butterworth Lephalale Ulundi derived from StatsSA, which was verified to enable spatial
Calvinia Lusikisiki Lydenburg Vredenburg trend analyses. The spatial extent of towns was verified with the
fine-grained CSIR Settlement Footprint Layer, 2018 (based on
Clanwilliam Makhado Vryheid
SPOT Building Count, StatsSA Enumerator Areas and
Cradock Manguzi Welkom
disaggregated socio-economic trend data up to 2011).
Dennilton/Siyabuswa Matatiele Worcester
Secondly, indicators of population and economic size and
De Aar Moorreesburg Vryburg growth: Population and economic size and growth trends, as
Ermelo Musina well as migration attraction indicators; and
Escourt Paarl/Wellington Thirdly, the identification of local and regional size and service
George Phalaborwa/Namakgale reach (including economic, administrative but also social
Grahamstown Plettenberg Bay service facility access) of towns within their unique
Groblersdal Port typographies and diverse development contexts. This enabled
Giyani Shepstone/Margate identification of towns that might be smaller in size but do play
Graaff-Reinet Potchefstroom a significant role in remote regions, or of growing nodes in
Harrismith Pongola dense rural settlement regions with limited access to larger
Piet Retief cities and towns.
Identification of the NSDF national network of regional development
anchors included consideration of expected and projected regional
14trends and desired national spatial pattern. Given current spatial regional service role within their regions. They were identified on the
patterns a specific focus was placed on identification of emerging basis of (1) the CSIR, 2018 Town Area Typology, (2) regional
nodes to support national urbanisation (become the cities of the accessibility, and (3) recently developed priority towns for social
future) in the central, eastern and coastal transformation and
investment within the DRDLR Rural Social Facility Toolkit project.
development corridors.
Regional and rural typography, road distance and access analysis The town area typology is also being used in the identification of
under conditions of improved rural connectivity and distance analyses potential regional roles for medium and small towns in support of
assisted in identifying growth centres that can play the role of SALGA’s Small Town Regeneration Strategy. Furthermore, the role of
strategically located regional and rural development anchors as part towns informs the Integrated Urban Development framework
of the Regional-Rural Development Model and act as spatial levers. Implementation: SALGA Small Town Strategy. Identified points of
growth and/or existing development should act as points of settlement
Provincial plans and strategic focus areas, as well as existing national
investments such as Industrial Development Zones, Spatial Economic consolidation in rural areas especially in areas of high value
Development Zones, Agri-Hubs and Aqua focus areas were also taken agricultural and ecological infrastructure.
into consideration in the identification process. Regional development
anchor-selection was also informed by the network of towns that play
strategic regional roles as identified on the basis of nationally B3.4 Significant plans, studies and sources that
comparative town profiles developed as part of the CSIR, 2018 Town informed the spatial specific selection of
Area Typology. The location of regional development anchors took
into consideration key national transport routes and the relationship to frame elements
the networks of Regional Service Centres and Service Towns identified.
The latter are strategically located to act as government and Department of Co-operative Governance. 2016. Integrated Urban
economic service centres within the surrounding service hinterland Development Framework. A new deal for South African Cities and
areas, and act as attractors of urban consolidation. Service Towns
Towns.
(CSIR Settlement Typology, 2018) form the bulk of the identified Rural
Service Centres. Department of Co-operative Governance. 2018. Localising the
New Urban Agenda: South Africa Discussion Document.
Economic Development Department. 2011. The New Growth Path
B3.3 Identification of regional networks of Framework.
consolidated and well-connected rural National Planning Commission. 2012. National Development Plan,
2030. Our Future – make it work.
service centres National Department of Human Settlements. (2015). Towards a
Policy Foundation for the Development of Human Settlements
Rural service centres (see Table A1 below) across South Africa were
Legislation.
identified to provide a select network of towns that play a strategic
15 National Treasury, City Support Programme. (2012). CSP Guidance regarding national urbanisation patterns, nodes and
Framework. National Treasury. corridors was provided by a range of policies and spatially explicit
Department: Planning, Monitoring and Evaluation. 2017. Research national plans, initiatives and strategies, including:
on the Limited Success of Entrepreneurial Activity by Locals in
Townships and Rural Areas. Seven Dialogue Locations: Townships, Current metropolitan, city and secondary cities (SOCR, 2016; SACN
Rural and Informal Settlement. Research Report conducted for Secondary Cities Work);
Programme Four: National Planning Commission. October. 2017. Existing urban densities and size of population and economy in
Report of the High-Level Panel on the Assessment of Key Legislation functional urban regions (city areas) and cities on the basis of
and the Acceleration of Fundamental Change. (2017). Page 32. nationally comparative town profiles developed in the CSIR, 2018
Commission on the Restitution of Land Rights. (2014/15). Strategic Town Area Typology.
Plan. CRLR. Network of cities with international gateway functions as identified
DRDLR. (2011). Green Paper on Land Reform. using the EU International Gateway Indicators (see Matfield et al.
African National Congress. (2012). Land Reform Policy Discussion 2014 and EDD, 2014 and EU, 2014). These primarily consider:
Document. Johannesburg: ANC. Projected urbanisation and population growth;
Department of Energy (DOE). 2015. State of Renewable Energy in International and national trade, logistic centres (land, sea and
South Africa. [Online] available at: air ports);
http://www.gov.za/sites/www.gov.za/files/State%20of%20Renew
Mining, manufacturing and industrial centres;
able%20Energy%20in%20South%20Africa_s.pdf.
Gateway functions as government services, provincial capitals
Department of Environmental Affairs (DEA). n/d. About the green
economy. [Online] available at: and education centres;
https://www.environment.gov.za/projectsprogrammes/greeneco Knowledge economy and research centres;
nomy/about. Service economy and green economy size and opportunities;
Renewable Energy Independent Power Producer Procurement and
Programme (REIPPP) - International tourism nodes,
http://www.energyintelligence.co.za/reippp-all-you-need-to-
NSDF Spatial vision and settlement pattern scenario based re-
know/
Renewable Energy Development Zones (REDZ) - modelling of regional patterns of projected urban population
https://egis.environment.gov.za/renewable_energy distribution (CSIR, 2018. NSDF Vision Settlement Population Growth
Department of Water and Sanitation (DWS). (2017). Draft National Projection).
Water Plan, DWS (2017: 40-41). SADC. (2015). SADC Industrialization Strategy and Roadmap 2015 -
2063. Gabarone: SADC.
Southern African Development Community. (2012). Regional
Infrastructure Development Master Plan. Gabarone: SADC.
16 Selection of regional growth centres considered regions Southern African Development Community (SADC). (2012).
envisioned to facilitate national urbanisation (central, eastern and Regional Infrastructure Development Master Plan. Gabarone:
coastal regions), and identified growth and development SADC
Southern African Development Community (SADC). (2015). SADC
corridors. (See Frame 1.2 and 1.3).
Industrialization Strategy and Roadmap 2015 - 2063. Gabarone:
The Integrated Urban Development Framework Implementation: SADC.
37 Intermediary City Municipalities are also expected to play a key South African National Biodiversity Institute (SANBI). (2016).
role as future urban regions, cities and regional anchor towns in Framework for Investment in Ecological Infrastructure.
NSDF Spatial Scenario. Selection of priority corridors, harbours, ports and trade posts as
Department of Human Settlements Spatial Master Plan (guiding well as government investment areas (such as SEZs) and inter-
land release and investment through the Housing Development regional corridors and networks as outlined in:
Agency) Transnet, 2016. National ports plan 2016;
International journal of urban and regional research, still to be TRANSNET. (2016). 30-year Long-term Planning Framework
published.Cilliers, J. 2018. Made in Africa: Manufacturing and the (Chapter 4 Port Development Plan). Johannesburg:
Fourth Industrial Revolution. Institute of Security Studies. In Africa TRANSNET Group; Department of Transport. 2015. National
and the Wolrd Report. April. 2018 Transportation Plan. Department of Transport;
Council for Scientific and Industrial Research. (2016). Settlement Amos, S. (2010). The role of South Africa in SADC regional
design guidelines for climate change adaptation in South Africa. integration: the making or braking of the organisation. Journal
CSIR. Pretoria: CSIR. of International Commercial Law and Technology, 124-131.
Snowball, Collins and Tarentaal. (2016). Transformation and job Brand, A. 2017. The use of corridor development as a strategic
creation in the cultural and creative industry in SA, SACO. and supporting instrument towards the development of
South African Cities Network (SACN). (2014). Outside the core: national space economies. Potchefstroom: NWU (Unpublished
Towards and understanding of Intermediate Cities in South Africa. Thesis – PhD);
South African Cities Network: Johannesburg.
Brand, A. and Drewes, JE. 2018. Spatial Corridor Model (SCM) –
South African Cultural Observatory (SACO). (2016). The Role of
Cultural and Creative Industries in Regenerating Urban and Rural structuring economic spaces in South Africa.
Space and Economies in South Africa: A case Study Approach.
Submitted to the Department of Arts and Culture. Spatial analyses informing the selection of regional development
South African Cultural Observatory (SACO). (2016).The mapping of anchors and service centres, included:
the South African creative economy: A baseline. Submitted to the
Department of Arts and Culture. Rural regional anchors and service centres was identified based
South African Cultural Observatory (SACO). (2017).
on a network of towns with strategic regional roles as identified on
Macroeconomic impact assessment and analysis of South Africa’s
the basis of nationally comparative town profiles developed in the
cultural and creative industry (CCI) and creative. Submitted to the
Department of Arts and Culture. CSIR, 2018 Town Area Typology. The town area typology is also
17used for the identification of potential regional roles for medium
and small towns in support of SALGA’s Small Town Regeneration
Strategy. The role of towns informs the Integrated Urban
Development Framework Implementation: SALGA Small Town
Strategy;
SA CSIR MesoZone 2018v1 Dataset: Available at http://stepsa.org.
Available at http://stepsa.org see
http://stepsa.org/socio_econ.html#Indicator
Data was used from the following provincial SDFs in the analyses done
in compiling the Draft NSDF and the proposals put forward in the
framework:
KwaZulu-Natal, Provincial Growth & Development Plan, 2018;
KwaZulu-Natal, Provincial Growth & Development Strategy, 2016;
Eastern Cape, Provincial Spatial Development Plan, 2010;
Free State, Provincial Spatial Development Framework, 2014;
Gauteng, Provincial Spatial Development Framework, 2017;
Limpopo, Provincial Spatial Development Framework, 2016;
Mpumalanga, Provincial Spatial Development Framework, 2013;
Northern Cape, Provincial Spatial Development Framework, 2012;
North West, Provincial Spatial Development Framework, 2016; and
Western Cape, Provincial Spatial Development Framework, 2014.
18Table A1: Description of current and growing urban regions and urban cores as a basis for envisaged NSDF settlement vision.
NATIONAL URBAN REGIONS AND NODES
NSDF national urban regions, cores and nodes have been identified on the basis of existing and projected high growth these include 1. City regions, 2. Cities
and large regional centres and a select few 3. Regional service centres, as defined in the CSIR, South Africa Functional Town Typology – 2018. These
areas will be home to the majority of the population in future. Based on the NSDF Vision they are expected to house 61% of the country’s 2050 population
(CSIR, 2018. NSDF Vision Settlement Population Growth Projection).
URBAN REGIONS NATIONAL URBAN CORES SMALLER URBAN CORES
Population:> 3 million people AND Economic Cities: Population: >500 000 and Economic Very Large Regional Centres: Population:
output > R40 816 mill/yr (2013 - Metros/International output >R7 900mill/yr (2013), >300 000 and Economic output >R4 000mill/yr
Gateways with continuing significant population and (2013)
economic share.
Large Regional Centres: Population: >100 000
and Economic output >R1400mill/yr (2013)
Greater Ekurhuleni Metro; Nelson Mandela Bay Metropolitan region Newcastle Large Regional Centre
Gauteng
Urban City of Johannesburg Mangaung City Area Tzaneen Large Regional Centre
Region
City of Tshwane Metro and Mbombela City Area Emalahleni (Middleburg)Large Regional Centre
Functionally linked areas in West Rustenburg City Area Matlosana Large Regional Centre
Rand, Sedibeng; Bojanala, Fezile
Dabi and Nkangala DM Buffalo City Area
Greater Cape City of Cape Town and Functionally Polokwane City Area Regional Service Centres: Population: >100 000
Town Urban linked areas in Stellenbosch Cape and Economic output >R1100mill/yr (2013)
Region Winelands DM and West Coast DM Richards Bay Large Regional Centre
Greater eThekwini Metro and Msundusi City Area Sol Plaatje
eThekwini Mthatha e
Urban Functionally linked areas in iLembe,
Region Ugu and Umgungundlovu Districts,
up to the Msunduzi City
19Table A2: Description of current settlement network as a basis for envisaged NSDF national network of Regional Development Anchors
Regional Development Anchors
NSDF national network of regional development anchors have been identified on the basis of expected and projected high growth Regional Service Centres and Service Towns
that are strategically located. The basis has been the network of Regional Growth Centres and significant Service Towns within the CSIR, South Africa Functional Town
Typology – 2018.
Regional Growth Anchors are made up of Regional Service Centres and a selection of regionally significant and accessible Service Towns. Selection of the
service towns considered formal economy and population growth.
Population variation between 15 000 to just over 100 000 people and economic output >R270mill (2013)
Expected to house 14% of the country’s 2050 population (CSIR, 2018. NSDF Vision Settlement Population Growth Projection).
REGIONAL SERVICE CENTRES SERVICE TOWNS
Bela Bela Mmabatho Aliwal North Lydenburg
Bethal Mossel Bay Barberton Makhado
Bethlehem Oudtshoorn Beaufort West Manguzi
Brits Paarl/Wellington Burgersfort Matatiele
Bushbuckridge Scottburgh/ Pennington Calvinia Moorreesburg
Butterworth Phalaborwa/Namakgale Clanwilliam Musina
Dennilton/Siyabuswa Port Shepstone/Margate Cradock Piet Retief
Ermelo Potchefstroom De Aar Plettenberg Bay
Escourt Queenstown Giyani Pongola
George Secunda Graaff-Reinet Springbok
Grahamstown Standerton Harrismith Swellendam
Groblersdal Thohoyandou Jozini Ulundi
Kroonstad Upington Kokstad Vryburg
Ladysmith Vredenburg Kuruman
Lichtenburg Vryheid Lephalale
Makopane Welkom Lusikisiki
Worcester
20Table A3: Description of current settlement network as a basis for envisaged regional networks of Rural Service Centres.
Rural Service Centres
This group consists of service towns, small service towns and settlements
Population: Varies in nodal settlement, large population in direct hinterland
Expected to house 5% of the country’s 2050 population. (CSIR, 2018. NSDF Vision Settlement Population Growth Projection).
E.G. Middelburg EC, Mtubatuba, Barkley East, Bizana etc. See next page for detail list.
Other Settlements This category includes the rest of the towns and settlements which were not included in the above
categories and incorporates: small towns, dense rural and spare settlements with the following
characteristics.
Population: Less than 20 000 people in town itself. Even less population hinterland being either
dense/sparse rural hinterland.
Excepted to house 20% of the country’s 2050 population
E.G. Hogsback, St Helena Bay, Tabankulu, See stepSA.co.za for a separate list for a full list of 346 towns and settlements.
Thornhill, Hofmeyer, etc.
21Rural Service Centres Table A3 cont.
Aberdeen Creighton Hartswater Laingsburg Nongoma Stanger
Acornhoek Dalton Harding Lamberts Bay Noupoort Steinkopf
Adelaide Darling Heidelberg-WC Leandra Nqamakwe Stella
Allanridge De Rust Heilbron Lebowakgomo Nqutu Sterkspruit
Amersfoort Dealesville Hendrina Libode Ntambanana Steynsburg
Amsterdam Delareyville Hennenman Lillydale Nwamitwa Stutterheim
Ashton Delmas Hermanus Lindley Ogies Swartruggens
Babanango Dendron/Dikgale Hertzogville Lorraine Olifantshoek Tarkastad
Balfour Dewetsdorp Highflats Lothair Ottosdal Taung
Barkley-West Dimbaza Himeville Louwsburg Ozwathini Thabazimbi
Barkley East Diphuti Hlabisa Mabeskraal Parys Theunissen
Barrydale Dordrecht Hluhluwe Maclear Paterson Trompsburg
Bathhurst Douglas Hoedspruit Madibogo Paul-Pietersburg Tshaulu
Belfast Driekop Hoopstad Magatle Peddie Tshipise
Bergville Driekoppies Hopetown Malmesbury Penge Tugela Ferry
Bethulie Dullstroom Idutywa Mandini Petrus Steyn Tweespruit
Bizana Dundee Indwe Marquard Petrusburg Umphumulo
Bloemhof Edenville Ingwavuma Mbazwana Petrusville Umzinto
Blouberg Ekuvukeni Isithebe Melmoth Phondweni Utrecht
Bochum Elliotdale Itsoseng Memel Piketberg Vaalkop
Bogalatladi Engcobo Ixopo Middelburg (E.C.) Port Alfred Vaalwater
Boshof Engonyameni Iziqolweni Mkuze Port Nolloth Ventersdorp
Bothaville Eshowe Jamestown Modimolle Port St Johns Venterstad
Brandfort Exelsior Jane Furse Mogwase Postmasburg Victoria West
Bredasdorp Ficksburg Jansenville Molteno Prieska Viljoenskroon
Britstown Flagstaff Jeffreys Bay Montagu Prince Albert Villiers
Bultfontein Fort Beaufort Joubertina Mooirivier Raditshaba Volksrust
Bulwer Fouriesburg Kakamas Mookgophong Rebone Vrede
Burgersdorp Frankfort Kamaqhekeza Morgenzon Reddersburg Vredefort
Cala Franschhoek Kathu Morokweng Reitz Vredendal
Caledon Ga-Kgapane Kei Mouth Moruleng Richmond (KZN) Warden
Carnarvon Ga-Mafefe Keiskammahoek Mosate Richmond (NC) Warrenton
Carolina Ga-Mmabasotho Kestell Motswedi Riebeek West Weenen
Cathcart Ga Pila Kirkwood Mount Ayliff Ritchie Wepener
Centane Ganyesa Knysna Mount Frere Riversdale Wesselsbron
Ceres Gcwalemini Koffiefontein Mphakane Riviersonderend Willowmore
Ceza Genadendal Komatiepoort Mpheni Robertson Willowvale
Christiana Grabouw Koppies Mtubatuba Rockcliff Winburg
Citrusdal Greytown Koster Murraysburg Roossenekal Wittlesea
Clocolan Griekwastad Kranskop Mutale Rouxville Wolmaransstad
Clydesdale Groblershoop Kriel Nababeep Sabie Wolseley
Coffee Bay Ha-Mandiwana Kwakhawula Ladismith Ndumu Schweizer-Reneke Xawela
Cofimvaba Hankey Lady Frere Ngodwana Senekal Xitlhtlani
Colesberg Hartbeesfontein (NW) Lady Grey Ngqeleni Seymour Zastron
Coligny Hartbeesfontein-A (NW) Ladybrand Nhlazartshe Smithfield Zeerust T
Hartebeesfontein (LIM) Nkandla Somerset East
22o Renewing the emphasis on ‘transformation-from-below’ for
widespread grassroots impact on poverty and
B4. Spatial Logic for Natural Resource unemployment;
o Facilitating the conversion of underutilized land in
Production and Selection Resource communal areas into small scale and/or commercial
production;
Production areas (As used in NSDF Sub- o Incorporating indigenous knowledge systems for agriculture
Frame 3) in traditional areas in a way that factors traditional spatial
relationships between settlement and agricultural practice;
o Using a spatial targeting approach that factors in the
B4.1 Spatial Logic contextual and comparative advantages of region and
place;
o Picking and supporting commercial agriculture sectors and
Central to the spatial logic of the National Resource Production
regions that have the highest potential for growth and
Regions Sub-Frame 2 are the following:
employment;
o Focusing on strategic agricultural development areas
Maintenance of national agricultural heartlands in the interests of
where expanded irrigation is possible through improved
national food security;
water management and new water schemes;
The prioritisation of lower order agricultural development areas that
o Focusing support on agricultural development areas that
exhibit greater cumulative levels of spatial advantage in terms of:
have a comparative advantage in terms of proximity and
Agricultural productivity, crop suitability and viability;
access to production and consumption chain networks,
Proximity to existing consumption and production chains;
e.g. Regional Development Anchors, Rural Service Centres;
Accessibility to higher order settlement typologies;
and
Accessibility to supporting agricultural infrastructure;
o Providing strategic developmental support for potential
High population densities;
new production and consumption chains in dense rural
Effective agricultural development through agrarian and land
hinterlands.
reform will require recognition of and concerted efforts around
the following:
o Realigning and combining models of agrarian and land
reform at a policy level;
o Defining the role of land reform as an instrument to facilitate
land access and security of tenure for agricultural
development;
o Optimising the role of stakeholder-based land reform;
o Steering land reform policy towards boosting productive
land use among the rural poor;
23Figure A8: Viable small scale farming and transformation from below as B4.2 Spatial Description of Production
key input in shaping significant “agri-enterprise resource regions”
Heartland, Agri-Enterprise Regions and
Eco-Resource Production Regions (as
used in NSDF Sub-Frame 3)
Resource Production Heartland Areas
The frame firstly refers to a central “Heartland” which includes all
identified high value production and high potential agricultural land in
the central part of the country (as used in Figures 9 and 14 of the main
NSDF document and seen in Figure A8 and A9 below). This region is also
characterised by high intensity mining production in selected areas.
The agricultural area is identified based on the following inputs: (1) a
crop fields layer from the National Department of Agriculture, and (2)
the Land Capability data (2018), provided by the National Department
of Agriculture.
24Crop fields with a land capability index value of 8 and more were Agri-Enterprise Resource Regions
selected to represent intermediate to high value agriculture land in the
country. The National Department of Agriculture’s process of updating These are identified areas of high and moderate land capability found
this data layer, was used to guide the demarcation of the high value in, dense settlement areas with water availability and that have high
production areas (see Figure A9). potential for agri-resource enterprise development (see Figure A9).
Figure A9: High Value Agriculture Areas in Central Heartland and Agri- The selection of these areas once again considers (1) crop fields data
Enterprise Regions (Land Capability Layers considered as input) from the National Department of Agriculture, and (2) Land Capability
data (2018) provided by the National Department of Agriculture. Crop
fields with a Land Capability Index Value of 8 and more were selected
to represent intermediate to high value agriculture land in the country.
The identification of Agri-Enterprise Opportunity Areas shown in Figure
18 of the Draft NSDF 2019 considers a number of factors, such as current
productive land, (currently cultivated), as well as market access to
densely settled and new growth areas. These are considered as key
indicators for identifying potential sites for small scale farming schemes
close to markets and with good agricultural potential.
The selection of suitable sites for small scale farming thus considered
the following criteria and factors:
High potential agricultural land based on land capability;
Agriculture infrastructure in existence or planned;
High priority was given to planned Agri-hubs and agro-processing
facilities, proximity to fresh produce markets and other processing
facilities;
Proximity to cities and identified growth regions were of utmost
importance with respect to the sustainability of small scale farming.
Factors considered amongst others proximity of social facilities such
as schools, health facilities and social support services;
Availability of sources of water, e.g. located downstream from
existing dams to ensure good gravity feed;
Source: Department of Agriculture, 2018. Areas where Land Reform and Agriculture Development (LRAD)
programs cluster in proximity; and
Only areas with slopes of less than 6% were selected.
25You can also read