PANEL: THE EVOLVING ROLE OF LOCAL GOVERNMENT IN THE IGFR SYSTEM
←
→
Page content transcription
If your browser does not render page correctly, please read the page content below
PANEL:
THE EVOLVING ROLE OF LOCAL GOVERNMENT
          IN THE IGFR SYSTEM

       Local Government Asymmetry and the
  Intergovernmental Fiscal System in South Africa

                     H. Fast & D . Kallis
                 Financial & Fiscal Comm ission
         12th Floor, Regis Ho use, 124 Adder ley Street
                P.O. Box 1505, Cape Town 8000
                        Tel: 0861 316 710
                       Fax: (021) 426 4935
        Email: hildegar def@ffc.co. za; denverk@ffc. co.za
Abstract This paper describes the historical processes that resulted in the considerable socio- econom ic disparities that are foun d in So uth Afr ica. Owing to the spatial orientation of m uch of apartheid policy, these dispar ities have a distinctive geo graphic form , with signif icant socio-economic contrasts within rural an d ur ban areas and bet ween ur ban and r ur al ar eas m ore bro adly. It was inev itable that these disparities would find expression in asymm etrical circum stances in mun icip alities, particularly the contrasting con ditions of m unicipalities lo cated in the former “white” So uth Africa on the one hand an d the former bant ustan s on the other. It is the purpose of this paper to under stand the various facets of this asym metry and the challen ges it poses for the system of local public finance. The p aper fir st explains how the asymm etry developed over time and describes its specific ram ifications with respect to systems of local governance an d finance. The paper then summ arises the vario us local governm ent reform initiatives and assesses their success in addr essing the issue of asymm etry, and finally it outlines som e challenges that rem ain.
1.       Introduction
The historical processes that shaped South Africa have left their deep imprint on the
physical lan dscape. This is no more appar ent than when one travels acro ss the
country: from ur ban to rural areas, from com mercial farmland to ex-bantustan areas,
from affluent subur bs to sprawlin g sh acklan ds. This is the essence of So uth Afr ica,
past and present.

These disparities ar e characterised by significant differences in levels of economic
activity and poverty, access to capital an d social infrastructure, an d patterns of land
settlement and owner ship. A term that captures these differences is “asymm etrical
dev elopment”, which denotes that different regions of South Africa are at different
levels of dev elopment, owing largely to deliberate government policy un der apartheid.

It is the purpose of this paper to under stand the various facets of this asym metry and
the challen ges it poses for the system of local public finance. The p aper fir st explains
how the asymm etry developed over time and describes its specific ram ifications with
respect to systems of local governance an d finance. The paper then summ arises the
vario us local governm ent reform initiatives and assesses their success in addr essing
the issue of asymm etry, and finally it outlines som e challenges that rem ain.

2.       Differenti al development in South Africa
2.1      Laying the founding: History to 1948

There were significant movem ents of peop les throughout the So uthern Afr ican region
in the centuries leadin g up to the establishment of the first permanent European
settlement at the Cape in 1652. The Europeans were another gro up vying for
reso urces, but their m ilitary technolo gy enabled them to dom inate with respect to
access to lan d and reso urces. By the early 1800 s, m ost of the original inhabitants of
the Cape – who had relied primarily on p astoral activities – had been subsum ed into
the econom y of the Europeans.

As European settlers continued their expansion into the interior of So uth Africa and
                                                                                1
the mining industry began to develop, m ore and m ore black South Afr ican s were
drawn into the colonial economy. Minin g in particular encouraged the m igration of
rural dweller s to the cities hoping to find employment. This migration was reinforced
by vario us colonial policies in the countryside. For example, many African
households were r equired to pay an ann ual hut tax, and the money to pay the tax
                                                                      2
could only be earned if one earned wages within the white-controlled economy.

1
  In this p aper, the terms “ black South A fricans” and “ blacks” refer to p eople who were historically
disenfran chised until 1994 (with the exception of a period in th e old Cap e Colony), and includ es peopl e
classi fied und er apartheid as African (or “ Bantu”), Coloured, and Asian (usually Indi an). The term
“ white” refers to p eople of European background who s ettled in wh at is now South A frica, and who
were classifi ed as “ white” under apartheid .
2
  See footnote 1 above.
By 1910, white people dom inated the in digeno us inhabitants of So uth Afr ica. Colo ur ed people, who se ancestors included the in digeno us huntin g an d her ding inhabitants of the western part of So uthern Afr ica, o wned little lan d compared to many Bant u-sp eaking Afr ican farmers, who wer e still able to practice subsistence farm ing in r eserves proclaimed by the colonial governm ents or on lan d bo ught from whites. In subsequent years, ho wever, the government applied a comprehensiv e program me of racial segregation an d discrimination and gained control over the Afr ican peasantry. The government enforced laws that limited land owner ship by Africans to dem arcated reserves, transform ed blacks who lived in r ural areas o utside the Afr ican reserves into tenant labour ers for wh ite farm ers, and en sured wh ite dominance in the industrial cities and rural to wnships. A significant turning point in the history of So uth Africa was the enactm ent of the Natives Lan d Act in 1913. The Act stipulated that seven percent of the area of the Union of So uth Africa constituted the “Native Reserves,” and it prohibited Africans from purchasin g land outside the reserves from people who were not Africans. In 1936, new legislation created the So uth African Native Trust, managed by whites, which allo wed for more lan d to be bo ught for Africans from funds provided by Parliament. By 1939, the tr ust pur chases had bro ught the augmented African reserv es to 11.7 percent of the area of South Africa. These African r eserves were scattered throughout the eastern half of the co untry. The Transkei was the only substantial blo ck of African territory in So uth Africa. Elsewh ere, even in Zululan d, whites h ad acquired legal title for much of the best land, whereas the Rep ublican governments of the Orange Free State and the Transvaal had set aside relatively little lan d for the exclusive use of Africans. In the ensuin g years, the African reserves declined as a result of the huge concentration of people and livestock. The original vegetation deteriorated, streams and waterholes dried up, and soil ero sion spread. The state net work of railways and roads served the white farm ers but neglected the reserv es, an d the governm ent provided massive assistance to wh ite farm ers but scarcely any to African s. 3 The government left African education to the m issionary societies, whose resources were very limited. The reserves were essentially bein g transform ed into pools of lo w- cost, un skilled labo ur for white farmers an d in dustrialists. Besides dividin g the co untry into wh ite-o wned and Afr ican-owned lan d, the Natives Lan d Act contained clauses designed to reduce all Africans in white-o wned r ural areas into tenant an d wage labo urer s. The Act prohibited Africans from paying rent to absentee lan dlor ds or from having the use of part of a white farm an d sharing the produce with the o wner. The m ost hardship was experienced in the Oran ge Free St ate, where m any farmer s evicted African s from their lan d im mediately after the Act was passed. The So uth African r ural economy thus developed unique characteristics as the governm ent imposed a policy of r acial segregation. 3 L. Tho mpson (2001). A History of South Africa. Third Edition. London: Yale University Press, pages 164 – 165 .
South Africans increasingly m oved to the cities after 1910, esp ecially Johann esburg,
Cap e To wn, Dur ban, Pretoria and Port Elizabeth. They included whites who lo st their
land in the So uth African (An glo- Bo er) War or could not cope with the increasing
com mercialisation of agriculture, an d Africans who were un able to survive in the
reserves. Accor din g to the official census of 1936, the ur ban pop ulation num bered
more than 3 million an d comprised 31 percent of the total population. Of this, abo ut
1.3 million were classif ied as White, 1.1 m illion as African, 400,000 as Colour ed, and
200,000 as Asian. 4

The government tried to control the flow of Africans into the cities with a complex
system of pass laws. Certain pass laws were crafted to ensure that wh ite farm ers
sho uld not lo se their African labo urer s. Other laws wer e design ed to prevent Africans
from living in to wns, except as labour ers for whites.

The government tried to segregate Africans within the ur ban areas. By 1910, there
were laws in the Cape Colony, Natal, and the Transvaal authorisin g the colonial
governm ents to create an d control ur ban “location s” for African s. Ho wever, m any
town ship s, particularly in the larger cities, had areas where white an d black lived next
to each other.

The concentration of people in the urban areas led to slums, increased crim e, and
disease. In 1923, the Sm uts government enacted the Natives ( Urban Areas) Act,
which empowered an ur ban authority to establish an African location. The
governm ent co uld then order all African s in that town, ex cept dom estic serv ants, to
reside in the location.

Over the years, So uth Afr ican to wns acquired a characteristic dual form. The largest
and most conspicuous part was a spacio us modern to wn, con sisting of a business
sector wher e people of all races worked durin g the day and subur bs of detached
houses, ran gin g from opulent to mediocre, o wned by white families and serv ed by
black domestic workers. Separated from the m odern town was a black location, where
mud, clapbo ar d, or corr ugated iron buildings, with earth latrines, stood on tiny plots
of land and were served by water from infrequent taps along unpaved paths and ro ads.

2.1.1     Impact of Segr egation Policies on Local Governm ent

It is evident that the events of the segregation era began to divide So uth Africa into
distinct racial, class, geo graph ic, and other lines. The white population was
econom ically affluent. Most of the economy’s incom e accr ued to them as they were
allo wed the best em ploym ent opportunities an d received support from the
governm ent. As a result, they lived in well- developed an d serviced areas, maintained
by their priv ileged revenue base.

In contrast, blacks were discriminated against an d were subject to laws that preserved
their subor dinate living stan dar ds. Con sequently, the areas in wh ich they resided were
under developed with little service provision.

4
    Report of the Native Laws Commission, 1946 – 1948 . U.G: Pretoria (known as the Fagan Repo rt).
Due to pop ulation gro wth, there was extreme overcro wding in the designated Afr ican
locations, an d this resulted in a num ber of informal settlem ents being established on
the fringes of cities. The follo win g section descr ibes ho w the apartheid governm ent
sought to addr ess this problem and f urther implem ent and enforce laws that
contributed to the current asym metry in local government.
2.2 The Apa rtheid Era
After 1948, wh en the National Party was elected to po wer, it used its dominance in
the governm ental sy stem to fulfil Afrikaner ethnic go als as well as wh ite racial goals.
Simultaneo usly, it system ically abolished ev ery trace of black participation in the
central political system .
Much of the National Party’s initial legislation coor dinated an d extended the racial
laws of the segregation era an d stren gthened the administration of those laws. The
term apartheid soon dev eloped from a political slogan into a harsh, system atic
program me of social en gineerin g.
The National Party government applied apartheid in a n umber of laws en d executive
5
actions. The apartheid system was based on fo ur central ideas:
1. The population of So uth Africa comprised fo ur racial gro ups – White,
Colo ur ed, In dian, an d Afr ican – each with its own inher ent culture.
2. Whites were entitled to have abso lute control over the co untry.
3. White interests sho uld prevail over black interests.
4. The white racial group formed a sin gle nation, with Afrik aans- an d English-
speak in g components, while Africans belon ged to sev eral distinct nations.
This formula m ade the white nation the lar gest in the co untry.
The follo win g is a selection of apartheid laws en acted by the gov ernment:
• Gro up Areas Act of 1950: Forced physical separ ation bet ween races by creating
diff erent residential ar eas for different races. Led to forced removals of people
livin g in " wron g" areas, for example Co lo ureds livin g in District Six in Cape
Town.
• Prevention of Illegal Squatting Act of 1951: Gave the Minister of Native Affairs
the power to remove black s from public or privately owned lan d an d to establish
resettlem ent camps to house these disp laced people.
• Bant u Authorities Act of 1951: Provided for the establishm ent of black
“homelands” an d regional authorities an d abo lished the Native Repr esentative
Council.
• Natives Laws Amendm ent Act of 1952: Narrowed the definition of the category
of black s who h ad the right of permanent residen ce in to wns.
• Natives (Abolition of Passes an d Co-or din ation of Documents) Act of 1952:
Com monly kno wn as the Pass Laws, this ironically n am ed Act forced black
people to carry identification with them at all tim es. No black per son co uld leave a
rural area for an ur ban one without a perm it from the local authorities.
• Bant u Education Act of 1953: Man dated the developm ent of a curriculum that
suited the "nat ure and requirem ents of the black people". Afr ican s wer e to receive
5
As outlined in Thompson, A History of South Africa, pag e 190 .an education designed to provide them with skills to serve their own people in the
bant ustans or to work in labouring jobs un der whites.
• Prom otion of Bantu Self- Governm ent Act, Act No 46 of 1959: Classified black
people into eight ethnic group s. Each group had a Comm issioner-General who
was task ed to develop a bantustan for each ethnic gro up, wh ich wo uld be allo wed
to govern itself indepen dently.
• Bant u Hom elan ds Citizens Act of 1970: Com pelled all black peop le to becom e a
citizen of the “hom eland” that correspon ded to their ethnic group, regar dless of
whether they had ever lived there, and rem oved their So uth Afr ican citizen ship.
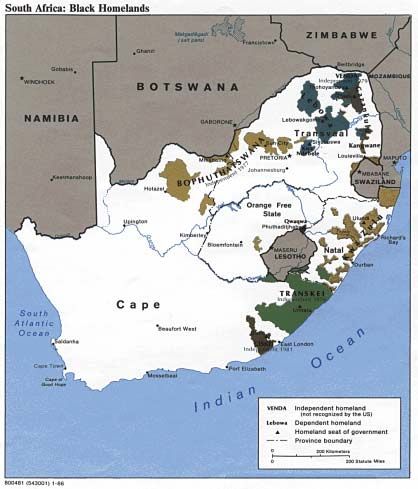
Apartheid incorpor ated rigid controls over all black South Africans, who were forced
into the bantustans, apart from those needed by the white em ployers as labo ur ers. The
governm ent rem oved African squatters from illegal camps n ear the cities, placing
those who wer e em ployed in segregated townsh ips, and sen din g the rest either to the
bant ustans or to the farms where the white owners required their labo ur.
6
The map below sho ws the location of the bantustans.
6
Available online: http://1uptravel.co m/ world maps/south-africa10 .ht ml (June 2004).The Transkei was the first to becom e “indep endent” in 1976, followed by
Bop uthatswana (1977), Venda (1979), an d Cisk ei (1981). Virt ually every bantustan
was made up of several pieces of land, separ ated by white-o wned f arms. For example,
Boph uthatswana had nineteen fragments, with some bein g m any kilometres ap art, and
KwaZulu comprised t wenty-nine m ajor an d forty-one minor fragments.
The forced r em ovals caused an overpop ulation pro blem in the bantustans. The 1950
census indicated that 39.7 per cent of the Afr ican population lived in the bantustans,
7
and in 1980 this figure ro se to 52.7 percent. While the So uth African economy
prospered in the 1950s an d 1960s, the bantustans r em ained economically stagnant.
7
L. Tho mpson, A History of South Africa, pages 194 – 195.Investin g in the bantustans was for bidden and the gov ernments of the bantustans dep ended on subsidies from the central government. Despite all the removals to the bantustans, the African, Colo ured and Asian population of the towns continued to in crease under apartheid, and they were not allo wed to o wn or o ccupy lan d in the wh ite areas. Dorm itory to wnsh ips outside wh ite town s were built for Colo ured an d Asian people (such as Atlantis in Cape Town and Phoenix in Dur ban), an d African to wn ship s wer e generally located even further away. The apartheid governm ent declin ed to build sufficient ho uses to accommodate the growing numbers, especially in Afr ican to wn ship s. Apartheid p lanning distorted ur ban ar eas through separating black to wn ship s from the city centre, industrial areas, and wealthy subur bs. These to wnships h ardly had any social amenities or places to work. As a result, town ship residents had to travel long distances to access their amenities or their workplaces. Black townships within the city were f urther char acterised by in sufficient land, overcrowded ho usin g, m inimal service delivery or investm ent in infrastruct ure, lack of access to social services and facilities, an d lack of formal economic activity. Historically, m ost local government reven ue in ur ban So uth Africa was self- gen erated, largely through prop erty taxes and the delivery of services to residents and businesses. White municipalities benef ited from this as they had sm all populations to serve an d large con centrations of economic reso ur ces to tax. Apartheid regulations bann ed most retail an d in dustrial developm ents in black areas. This limited the reven ue base an d forced residents and retailer s to sp end most of their m oney in wh ite areas. The 1980s gave rise to gro wth in the manufactur ing sector, wh ich began to progressively ch allenge the m inin g sector for superiority. As oppo sed to the mining sector, the man ufacturing sector dem an ded a m ore sophisticated workforce. These dev elopments com pelled the apartheid gov ernm ent to adopt a policy of “orderly urban isation” in 1986. This policy allo wed for expan ded but controlled Afr ican migration into the cities. Together with its new ur ban policy, the governm ent follo wed international privatisation trends an d aban doned its pr evious role of direct housin g provider in town ship s. The result was f urther expanse of shack settlements around So uth African cities, with peri- ur ban settlements gro win g rapidly. During the 1980 s, African to wnships within the city were governed by Black Lo cal Authorities established by the apartheid government. Ho wever, the revenue base within town ship s was limited because property o wnership and econom ic activity had been prohibited by apartheid legislation. Without recourse to traditional sources of municip al finance, Black Local Authorities were compelled to raise rev en ue through increasin g r ent, transport, and serv ice char ges. This resulted in extensiv e rent boycotts and other form s of civil diso bedience in the townships. Concurrently, inv estm ent in infrastr uctur e an d service delivery in the town ship s remained negligible.
2.3      The legacy: im pact of segregation and apartheid on local governance and
         finance

On a practical lev el, the follo win g were the consequences of colonial, segregation,
and apartheid policies:

•     Blacks were deprived of a wide ran ge of employm ent and education opportunities,
      thus relegating the majority of them to relatively low-paid wage labo ur.

•      By restricting urban black people to residential ar eas that were exp ected to be
       lar gely self-f inancin g, black residential areas wer e characterised by poor
       infrastr uctur e and limited tax bases o win g to the low incomes of residents.

•      The increasin g concentration of people in the bant ustan s led to significant
       environmental degradation, making subsistence agriculture difficult. The new
       bant ustans effectively became reservoirs of labo ur for white So uth Africa.
              o As with black ur ban areas, the social and capital infrastructure of
                  bant ustan areas was gener ally very poor an d significantly inferior to
                  that of “white” So uth Africa. Electricity, runnin g water and sanitation,
                  public telephon es, and park s were rar e.
              o By contrast, white South Africans were provided with excellent public
                  services such as schools, ho spitals, parks, public transport, roads, water
                  and san itation, electricity, and telephones.

•      In term s of local governance, each bant ustan was administered by black
       authorities (mainly hereditary chiefs), who governed un der the ultimate authority
       of the central white government. In ur ban areas, the gov ernment established local
       coun cils who se effectiveness was comprom ised by association with the white
       government. There were thus no legitimate institutions able to or gan ise the
       financin g of service provision an d maintenance of ur ban facilities.

2.4      Challenges for system s of local governance and finance

The asymm etry with respect to diff erent settlement patterns and lev els of
dev elopment has posed particular challen ges in the area of local government finance
and p ublic f inance more generally. These challen ges are as follo ws:

•      The significant distances bet ween black residential areas an d the areas in which
       black p eople work an d shop requir e substantial, on- goin g transport subsidies.
       These distances are a feature of both ur ban an d r ur al areas: in ur ban ar eas, the
       (relatively impoverished) African, Colo ured, an d In dian to wnships are far from
       city centres, and in r ural or sem i-rural areas, “dormitory township s” ( usually
       located in the former bantustans) are far from the urban centres to which
       residents m ust com mute on a daily or weekly basis.

•      The various influx control m easures applied to the black population of So uth
       Africa slowed down the r ate of ur ban isation that wo uld otherwise have occurr ed.
       With the significant increase in people resident in ur ban areas, significant
pressure on ur ban to wnship s has resulted in vast shack settlem ents and their
attendant problems (e. g. on health).
o Furtherm ore, the forcible rem oval of black people to bantustan areas
meant that wher e housing and other infrastr uctur e was installed (albeit
of a low quality), it was far from economic centres.
• Taxable economic resources are concentrated in the form erly white ar eas,
requirin g redistribution bet ween an d within local areas. As noted above,
com mercial and in dustrial infrastructur e was located in form erly wh ite areas,
while black ar eas suff ered from deliberate under-investment owin g to ap artheid
legislation. In addition, black people were in m ost cases prevented from own ing
lan d, such that the rates base in black urban areas was significant un der-
dev eloped. The m ain con sequence was that the ability of residents in black
residential areas to pay for services and pay (property) tax to support the general
dev elopment of their comm unities was comprom ised o win g to their limited
econom ic and lan d ownership opportunities under apartheid.
• Sim ilar ly, the local tax base in rural ar eas has been significantly un der- develop ed
owing to the lack of economic activity in the bantustan ar eas. In addition,
freehold title of land was limited to som e bantustan to wns, with rural lan d either
falling un der the jur isdiction of traditional authority or bein g subject to
com plicated lan dho ldin g arran gem ents in “betterment” areas.
This is v ividly dem onstrated by the r evenue per cap ita of a m ajor local
government reven ue so urce, nam ely regional lev ies. These are levies on the total
wage bill and turnover of business enterprises, an d as such they are a good
reflection of economic activity in a region. The table below provides a list of the
metro / district municipalities with the ten highest an d five lowest per capita levy
income in South Africa:
Rank Municipality Province Per Capita RSC
Incom e (Rands)
2002/03
1 Johann esburg Metro Gauteng 325
2 Cape Town Metro Western Cape 226
3 Tshwane Metro Gauteng 205
4 Ekurhuleni Metro Gauteng 169
5 Nelson Mandela Metro Eastern Cape 148
6 Nkangala District Mpu malang a 127
7 Boland District Western Cape 124
8 Sedibeng District Gauteng 114
9 Ethekwini Metro KwaZulu-N atal 104
10 W est Rand District North W est 99
49 OR Tambo District Eastern Cape 13
50 Chris H ani District Eastern Cape 13
51 Zululand District KwaZulu-N atal 13
52 Great er Sekhukhun e District Li mpopo 10
53 U mkhany akude District KwaZulu-N atal 4
As the table demonstrates, the p er capita region al levy in com e is highest in the
metros and in districts situated in the former “wh ite” So uth Afr ica. Significantly,
the districts with the lo west per capita levy income are those in corporatingsubstantial portions of ex- bantustans: OR Tam bo district municipality includes
lar ge parts of the old Tran skei, Chris Han i includes parts of the former Ciskei and
Transkei, Zululan d and Um khanyakude district mun icip alities include lar ge
section s of the former KwaZulu, an d Gr eater Sekh ukh une includes m uch of the
former Lebowa.
• It follows that the level of infrastructure – both the quality and quantity – varies
considerably between areas that were formerly dem arcated as “ white” or “black”
areas ( whether ur ban or r ural). This app lies to both cap ital infrastructur e, such as
roads and buildin gs, and so cial infrastruct ure, such as equipment and hum an
reso urces required to deliver quality health and education services. This has h ad
three m ajor effects:
o Backlogs in service infrastruct ure in the historically un der dev eloped
areas requir e municipal expenditure f ar in excess of the reven ue
curr ently available within the local gov ernment system;
o The human, in stitutional, an d cap ital infr astr ucture backlo gs are
signif icant, especially in ex- bantustan areas. There are substantial
variations in capacity, with some municipalities hav in g little or no pre-
existing institutional fo un dations to build on. This poses consider able
challen ges for the eradication of these backlo gs. It also raises the
question as to the optimal investment plan for eliminating the
backlogs, given the location of econom ic activity;
o On the other hand, the significantly better-quality social an d other
infrastr uctur e in ur ban areas has en couraged p eople livin g in r ural
areas to spen d m uch of their time in ur ban areas.
The follo win g section will outline the various local governm ent reform initiatives and
will assess the extent to which they have been able to address these challen ges.
3. Addressing the as ymmetry: ten years of local g overnment
reform
Since the end of the apartheid era, So uth Africa h as been reform in g its lo cal
governm ent sy stem – like the rest of its govern ance po licy – alon g non-racial lin es.
This process invo lved reform s such as the abolition of racially dem arcated lo cal
authorities, South Africa's first democratic local elections in 1995, and the p ublication
of a White Paper on Local Governm ent in 1998. An underlyin g aim of the reform
process was to address the inequities perpet uated under ap artheid. As noted in the
White Paper of 1998,
Local governm ent has been given a new constitutional mandate to create and
sustain h um ane, equitable and viable h um an settlements. It is do ubtful whether
local government – as presently designed – is adequately equipped to fulfil
this developmental man date. Local government has been dem ocratised, but the
local government system is still struct ured to m eet the demands of the
8
previous era. A f un dam ental transform ation is required.
8
Th e White Paper on Local Gov ern ment , 9 March 1998.This section of the paper assesses how the reforms have addressed the issue of
asym metry. In doing so, the paper ev aluates the main reform initiatives im plemented
in the transform ation of local governm ent.
3.1 The transition process
The local government transformation process took place in three stages:
The Pre-interim Phase (1993 – 1995): Pre-interim councils wer e established and took
decision s necessary to sustain gov ernance an d serv ice deliv ery during that perio d of
transition. This phase focused more on the democratisation of local government than
on its transform ation.
The Interim Phase (Decem ber 1995 - Decem ber 2000): In the interim phase three
important developm ents shaped the transform ation of local governm ent:
• Fir st, the form and structure of the new system of democratically elected
transitional co uncils was tested in practice.
• Second, a n ew policy framework for lo cal governm ent was designed. This was
reflected in the Constitution (1996) and the White Paper on Local Governm ent
(1998).
• Third, new laws were en acted to implem ent the Local Government W hite Paper
and re- dem arcate lo cal governm ent bo un daries. The legislation in cluded the
Local Government Municip al Structur es Act of 1998, the Local Governm ent
Municipal Sy stem s Act of 2000, an d the Local Government Municipal
Dem arcation Act of 1998, all of which are discussed below.
The Final Phase ( December 2000 – on war ds): In the final phase of the transition,
Governm ent has sought to stren gthen policy fr amework s necessary for serv ice
delivery. Durin g this consolidation phase, the sy stem s an d pr actices of developmental
local gov ernment are bein g con solidated in m unicipalities.
3.2 The vision for a new system of local government
The local governm ent reform process set abo ut to address com prehensiv ely the
inequities perpetuated under apartheid. The two most sign ificant documents in this
regar d are the Con stitution an d the Local Gov ernment W hite Paper.
3.2.1 The Constitution
The drafters of the Con stitution took the view that local gov ernment in So uth Afr ica
sho uld be regar ded not as a “ third tier” of government established by statute, but
rather as a sphere of gov ernment that receives its mandate, powers an d f unctions
directly from the Constitution. As a spher e of governm ent, local governm ent is
distinctive from , yet inter dep endent and inter-related with, provin cial an d national
governm ent.
Section 152 of the Constitution of 1996 m andates local governm ent to:
• Provide dem ocratic an d accountable governm ent for local comm unities;
• Ensure the provision of serv ices to comm unities in a sustain able manner ;
• Prom ote social and econom ic development;• Prom ote a safe and healthy environment; and
• Enco urage the involvement of comm unities and comm unity or ganisation s in the
matters of local government.
Section 155 of the Constitution classifies municipalities into three categories, nam ely
Category A (m etros), Category B (lo cal m unicipalities falling within Category C /
district bo undaries), and Category C ( a district includin g more than one lo cal
municip ality).
The Constitution thus provided the foun dation for addressin g the extreme spatial
inequalities that characterised South Africa. It did so in the follo win g ways:
• Municipal coun cils are democratically elected, thus representin g all the residents
in their jurisdiction rather than a priv ileged m inority; an d
• All municipalities have a developmental man date, which requires them to
actively address the so cio-econom ic disparities within their bo undaries.
3.2.2 Local Governm ent White Paper
The White Paper on Local Governm ent of 1998 gave content to the constitutional
vision of developm ent local government. It included the follo win g:
• An outline of the ch allen ges facing municipalities, such as skewed settlem ent
patterns, concentration of taxable r eso urces in formerly white ar eas,
infrastr uctur e back logs, sp atial separ ation, lack of urban an d r ural linkages, and
variations in capacity;
• A detailed v ision for addressing these challen ges, namely dem ocratising,
redistributin g reso urces, prom oting social dev elopment and econom ic growth,
dev eloping mechanism s for integrated plann ing, and inv estin g in infrastruct ure;
• A vision for the in stitutional an d administrative sy stem s required to realise the
vision ( such as service delivery approaches and performance m anagem ent
systems);
• Proposals for new municipal structures that wo uld com bin e previo usly (racially)
separated jurisdictions (“one-tier” m etropolitan local government, ur ban ar eas
that included their inform al fringe settlements, and amalgamated ur ban an d r ural
areas); and
• Proposals for an inter governm ental f iscal sy stem that would be based upon the
principles of equity an d redistribution ( building on the concept of “one city, one
tax base”).
The White Paper marked a signif icant m ilestone in the development of lo cal
governm ent in So uth Africa as it m ade prov ision for “ wall-to-wall” m unicipalities
across South Africa. In eff ect, this m eant that municipalities wo uld encompass the
form er “white” So uth Afr ica as well as the bant ustan areas, and that the integration of
the rural an d ur ban econom ies wo uld be facilitated.
3.3 Im plementing the vision
The vision o utlined in the Con stitution an d the Local Governm ent White Paper was
given effect through a n um ber of key p ieces of legislation an d through the
intergovernmental transfer system . These are o utlined an d assessed belo w.3.3.1 Municipal Dem arcation Act
The Municipal Demarcation Act of 1998 was the first piece of legislation to give
effect to the proposals o utlined in the Local Governm ent White Paper. It provided for
the establishment of the Municipal Demarcation Bo ard and specified a wide range of
criteria to be taken into acco unt by the Boar d in its determ ination of municipal
boun dar ies. Am on g others, these criteria include:
• Patterns of hum an settlement, and existin g an d expected lan d use;
• The mobility of people in an ar ea, i.e. their em ploym ent, com muting an d transport
movements;
• Facilities an d infrastruct ure;
• Factors related to the promotion of integrated areas an d avoidin g sprawls and
fragmentation;
• Finan cial an d administrative viability; an d
• Areas of traditional authority.
The Board was also tasked with reducin g the over all n umber of lo cal authorities in
South Africa. The n um ber of local governm ent bodies in South Africa was r educed
from 1200 to 843 in 1993, and dur ing the demarcation process in 2000 the 843
municip alities were further reduced to 284 m unicip alities (6 m etropolitan, 231 local,
9
and 47 district municipalities). Many existing mun icip al authorities were
amalgam ated (on aver age, bet ween 3-5 municipalities), an d ur ban bo un daries were
expanded to include their r ural hinterland.
Although a ran ge of cr iteria was taken into account in determ inin g the boun daries, the
overall impetus was to ensure that there was a redistribution of resources. These
reso urces were taken to include human resources, institutional capacity, infrastructure,
and revenue base. In this way, the signif icant socio- econom ic an d developm ent
disparities o utlin ed in section 2 above were quite comprehensiv ely addressed in one
stroke, with each new municipal entity typically com prising rural and urban, rich and
poor, and economically well- developed an d un der-developed ar eas.
However, the actual demarcation of municipalities was based upon the assumption
that redistribution sho uld be eff ected through all- encompassin g boun dar ies, rather
than through the transf er system. If two m unicipalities have sign ificantly differing
proportions of low-income residents, then the intergovernm ental fiscal system should
assess the differ ences in expen diture need an d r even ue-r aising capacity an d allocate
reso urces accor din gly. W hile it is too soon to evaluate the efficacy of current
boun dar ies, it m ay well be that the significantly enlar ged m unicipalities will struggle
to cope with the widely diver gent cir cum stances of the vast areas under their
jurisdiction.
3.3.2 The Municip al Str uctures Act and amendm ents
The Municipal Str uctures Act of 1998 clarif ied the status of m unicipalities and
determined the appropriate div ision of powers an d f unctions bet ween local (Category
B) an d district (Category C) m unicipalities. The role of district municipalities was to
9
There are sparsely popul ated areas within a district muni cipality that do not fall within the area o f a
local municipality. These areas are referred to as District Manag ement A reas (DMAs).facilitate co-ordinated plann in g in the district and to deliver services that were district- wide (such as district roads). Lo cal mun icip alities wer e tasked with basic serv ice delivery (such as water, sanitation, ref use removal, electricity distribution, and municip al health services), although the district was r equired to deliver these if a lo cal municip ality lacked the cap acity. The Struct ures Act was am ended in 2001, transferr ing four key service f unction s to district municipalities (nam ely water an d sanitation serv ices, electricity distribution, and m unicipal health serv ices). W hile the status quo for electricity was subsequently retained (that is, lo cal municipalities have contin ued to be the service authorities), a process was embarked upon to assess the capacity of each district and lo cal municip ality to determine where the three functions should lie. The results are quite striking, for with som e exceptions, the division of f unctions bet ween district an d local m unicipalities – and hence their serv ice delivery ro le - mirrors the historical legacy. Generally, local m unicipalities located pr imarily in the old “ white” So uth Africa are better-capacitated an d thus able to fulfil their serv ice delivery fun ctions, an d the districts in which they are located play a co-or dinating role. On the other hand, areas comprisin g significant sections of form er bantustans lack capacity at local level, an d m uch of the respon sibility for basic service delivery on the groun d lies with district municip alities. A po sitive f eatur e of this sy stem is that it has sho wn that So uth Afr ica’ s n ew legislative fr am ework is flexible eno ugh to accomm odate sign ificant differences in capacity. On the other hand, the key criterion used to decide whether a function sho uld be lo cated with a district or local m unicipality was existing capacity, an d there has been no in dication that these fun ctions wo uld shift if capacity were dev eloped over tim e. The difficulty with present arrangements is that it takes insuff icient account of settlement patterns. The Local Gov ernment W hite Paper provided a broad typology of settlement types, and suggested that the new local government system should take acco unt of these. It could be ar gued that the present sy stem does not do so. For example, there are r ural (lo cal) m unicipalities within which there are no to wn s of signif icant size an d infrastructure, an d the question arises as to whether one chooses one small town in which to build the necessary institutional and adm inistrative capacity to facilitate service delivery throughout the entire local mun icip al area, or whether one contin ues with the status quo, whereby the cap acity remains focused on the district municip ality. There is therefore potential for a debate on the development of different models for governance and service delivery o utside the m etropolitan areas and secondary cities, a debate that looks beyond issues of capacity and takes acco unt of issues likely to be relatively p ermanent in nature, such as settlem ent patterns. 3.3.3 Property Rates Act The Property Rates Act of 2004 regulates the levyin g of property rates by all municip alities. In the past, m un icip alities differed in their methods of assessing
property tax liability, with some assessin g the value of lan d only, others assessing
land value as well as im provem ents, but at different rates (called composite rating), or
others assessin g lan d an d improvements at one rate (called un iform rating).

The differen ce in assessm ent methods, and the lack of transpar ency in providing
“rates relief” to som e categories of property and not others, meant that municipalities
could sh ift the bur den of financin g service delivery to other users of services. For
exam ple, property rates could be kept artificially low by incr easing electricity or
water tariff s. Also, if market value was not regular ly updated, owners of lo w-v alue
properties could end up subsidisin g o wners of prop erties that had significantly
increased in value, as happened in Cap e Town.

The Property Rates Act provides for one m ethod of assessment – namely uniform
rating based on market value – wh ich en sures that property taxes are based upon the
value of the property.

3.3.4   Other institutional mechanisms

Other legislation has been en acted to give effect to the proposals contained in the
Local Governm ent White Paper. These include:
• The Municipal System s Act, which o utlines m unicipal adm inistrative
    mechanism s in detail ( such as integrated developm ent planning processes,
    perform ance m anagem ent sy stems, an d the developm ent of tariff and credit
    control policies); and
• The Municipal Finan ce Management Act, which m akes provision for efficient
    systems of fin ance an d budgeting.

3.3.5   Intergovernmental transfer s

The Local Gov ernment W hite Paper outlined the pr inciples that should ch aracterise
the system of intergovernmental transfers to local governm ent, such as reven ue
adequacy an d certainty. It emphasised the role of central government in redistribution,
and noted that the equitable sh are for local governm ent (already provided for in the
Con stitution) should ensur e that all residents had access to basic m unicipal services.
The current system broadly supports these prin ciples, as o utlined below.

Equitable share tran sfer s

Up to 1998, the system of recurrent transfers to local gov ernment was ad hoc and
incoherent. In 1998, the (then) Dep artm ent of Finance introduced a new equitable
share form ula, which was based upon the follo win g:
• A notional allocation for the provision of four services consider ed to be basic,
     nam ely water, sanitation, ref use removal, an d electricity;
• An element that ensures that fun ds are distributed accor ding to the num ber of
     households living in poverty in each jurisdiction.

The FFC has in dicated from 2001 onwar ds that the equitable shar e form ula suff ers
from three major shortcom ings:
• There is a lack of clarity on what serv ices are considered to be basic. If the
purpose of the transfer system is to ensur e that all lo w- income residents have
access to a bask et of basic services, then these services n eed to be sp ecif ied.
• There is no rev en ue-raisin g capacity elem ent in the current form ula.
Municipalities located in the former white So uth Afr ica gener ally have well-
dev eloped revenue bases and are better able to dr aw on their resources to deliv er
services, as opposed to municipalities that are located in primarily rural, ex-
bant ustan ar eas.
• The form ula does not reflect variations in expen diture need among
municip alities. Expen diture need may vary owing to circumstances beyond the
control of municipalities ( such as population density) and to diff erin g levels of
infrastr uctur e for delivering basic serv ices (such as bulk water and sewerage
systems).
These issues are receiv ing attention as the local governm ent equitable share form ula is
reviewed in the com in g year.
In general, however, it sho uld be noted that the curr ent local government form ula h as
a strong redistributive thrust by targeting reso ur ces accor din g to the concentration of
low-income residents. Nevertheless, the inequities of the past cannot be fully
addr essed un less m unicipal reven ue-r aisin g capacity is taken into account.
Infrastructure transfer s
Until recently, there has been a system of infrastr ucture transfer s called the
Con solidated Municipal Infrastruct ure Pro gramm e (CMIP). The aim of the
program me was to channel infr astr uctur e f un ding to areas wher e backlogs were
greatest. The infrastructur e fun din g was provided to provincial governments, which
evaluated app lications for f un din g from m unicipalities and monitored their
expenditur e. The program me specified that a m inimum proportion of fundin g was
spent on rur al infrastructur e.
On the positive side, the programm e has ensur ed that infrastruct ure has been in stalled
in m any areas severely prejudiced by apartheid planning an d investment policies.
However, CMIP has also had its shortcom ings:
• Municipalities with the capacity to complete the app lication process were able to
access f un ds, and these were not necessarily the m un icip alities wher e backlo gs
are greatest;
• Infrastructure backlogs had not been sufficiently calculated for each municipal
jur isdiction owing to data collection pro blems, and this f urther complicated the
targetin g process.
To rem edy these shortcom ings, the Municipal Infrastructure Grant (MIG) has been
introduced, which has been piloted since 2003/04. The MIG is not application- based,
as with CMIP: m unicipalities are allocated f unds accor ding to a form ula, which takes
acco unt of infrastruct ure backlo gs (mostly calculated through Census 2001). The
form ula allocates 75% of fun din g to household infrastructure, an d the remainder to
public infrastructur e (such as community halls) an d busin ess infr astr ucture.In theory, then, the MIG pro gramm e has com prehen sively addressed the need to
ensure that areas that were neglected with respect to infrastructure receive the
necessary funding. By makin g f unds available for businesses, the MIG program me
reco gnises that it is important to m ake provision for econom ic opportun ities as well as
household infrastructure.
3.4 Summ ary: Assessment of Local G overnment Reforms
It is appropriate at this point to return to the historical legacy that the new sy stem of
local government had to addr ess, as outlined in sections 2.3 above, with a view to
assessin g the extent to which these challen ges h ave been addr essed thro ugh policy
instruments.
During the segregation an d (especially) apartheid eras, black people were depr ived of
access to education an d em ploym ent opportunities. They were restricted to liv in g in
dem arcated “gro up areas”, wh ere there were limited business opport unities. The result
was a very skewed pattern of commercial an d business development, with alm ost all
dev elopment in the formerly white areas.
The reform process has addressed this in a number of way s:
• The new mun icip al boun dar ies include both dev eloped and un der- develop ed
areas. Indeed, one of the key con siderations in the dem arcation process was the
need to create one tax base out of such disparate areas;
• The Property Rates Act provides for one uniform (market-value) basis for rating
properties, thereby ensur ing that a significant proportion of local tax resour ces
are drawn from areas that benefited un der the previo us dispensation;
• The intergovernm ental transfer system is struct ured in a way that ensures that
national tax resources ar e distributed to m unicipalities in accor dance with the
principle of redistribution. This includes significant allocations for municipal
infrastr uctur e, wh ich ar e targeted at areas wh ere backlo gs are greatest;
• A wide ran ge of institutional an d administrative mechan isms h as been put in
place to ensur e that municipalities are requir ed to prioritise un der- develop ed
areas for investment and to prom ote efficient an d acco untable service delivery to
all residents.
In sum mary, the policy an d legislative process has been quite successful in
struct urally addr essing the fun dam ental in equities bequeathed by the past. Yet there
remain som e challen ges, which are outlin ed belo w.
4. Remai ning challenges
4.1 Redistribution within municipal boundaries
As noted in section 3 above, the intergovernm ental transfer system and new property
rates dispen sation ensure that taxable resources are made available to municipalities
to addr ess the socio-econom ic disp arities within their jurisdictions. Ho wever, it
remains for the municipal councils an d their adm inistrations to ensure that resources
are, in fact, distributed in a manner that takes acco unt of these disparities.One ex ample of a reso urce (n amely land) that is not being appropr iately allocated is with respect to the plannin g of new settlements. Apartheid planning was ch aracterised by signif icant distances bet ween black an d white areas; in many cases, this has been exacerbated by the p lacement of n ew ho usin g dev elopments in existing black settlements, rather than in areas that wo uld facilitate the integr ation of once- divided com munities. In addition, many municipalities h ave taken their existing expendit ure allo cations as the basis for their budgets, rather than goin g through a re-prioritisation exercise. There are, ho wever, limits to redistributing existing reso urces within m unicipalities, as it may involve the reduction of existing p ublic services an d may lead to the deterior ation of infrastruct ure that underp ins econom ic activity in the m unicipality. Thus, wh ile som e f unding could be freed up by som e trimm ing of municip al services to “rich” parts of m unicipalities and by fin din g new operational efficien cies, it is doubtful wh ether substantial reso urces could be fr eed up through the process of reallo cation. New reso urces will have to be fo un d for municipalities, whether through the development of new reven ue sources, lar ger equitable share allo cations, or econom ic developm ent strategies that gro w the tax base of m unicipalities. 4.2 Investm ent in rural areas As demonstrated in the table in section 2.4, econom ic activity in the ex-bantustan s is very lim ited. There is little commercial agr icult ural activity, and even subsistence farm ing is diff icult given the environm ental degradation. While there has been considerable infrastruct ure investment in ur ban areas over the past ten years, r ural areas h ave lagged behin d. This is o win g to a n um ber of f actors: urban isation has increased, causin g the proportion of peop le livin g in rural areas to decline (bet ween 1996 an d 2001 alone, the r ural pop ulation of South Africa declined from 46% to 42%).10 Related to this, the economies of m any rural towns and hinterlan d are declinin g. This is a ch allenge to policy-makers, for the major ity of So uth Africa’ s poor live in the rural areas. Attempts to channel f unds an d attract investm ent to such areas has not sho wn the desired rate of success, as evidenced in the 13 rural developm ent nodes identified by Governm ent. An on- going policy debate in So uth Africa relates to the extent to which (scarce) reso urces should be used to prom ote economic activity in historically un der- developed regions where population is declinin g and significant econom ic growth is not expected in f uture, but wh ere poverty is concentrated and basic service provision is very lim ited. 4.3 Regional levy reform As the table in section 2.3 dem onstrated, the fiscal capacity of m etro / district municip alities var ies con siderably with respect to regional levy income (between 10 Statistics South Africa, Census 2001. For the reasons outlined in this paper, settlements in South A frica cannot b e easily classified into “urban” and “rural” categories . Th e methodology us ed to determine the p roportion o f urb an and ru ral d wellers is des cribed in Statistics South A frica, Discussion of Rural Definitions (2003).
R225 per capita in Ek urh uleni m etro and R4 p er cap ita in Umkhanyak ude district
municip ality). Regional levies are the only o wn rev enue so urce of district
municip alities, and there is no equalisation system to address these vast differen ces in
fiscal capacity.

There is currently a policy process to review regional levies as a reven ue source, and
it is likely that major reform will take p lace (either ch an ging the nature of the levies or
replacin g them with inter governm ental transfers). This reform process should take
acco unt of both the differences in fiscal capacity and the role the regional levies m ay
be p layin g in addressin g spillover s.

4.4     Transpo rt subsidies

As noted in 2.3 above, the significant distances bet ween formerly black areas and the
areas in which black p eople work an d shop require substantial, on- goin g transport
subsidies. At present, these subsidies are adm inistered by n ational government,
amounting in the fiscal year 2004 /05 to R1.8 billion for comm uter rail subsidies and
R2.1 billion for bus subsidies.

Yet the onus for addressing the spatial legacy of apartheid lies prim arily with
municip al p lanner s, who must integr ate lan dscapes that were (an d contin ue to be)
characterised by former racial division s.

One way to addr ess this is to prioritise under dev eloped ar eas for infrastructure
dev elopment. Indeed, the nodes prioritised for ur ban development recognise the need
to invest in areas in wh ich minimal comm ercial and other infrastructure was in stalled,
rather than to m erely up gr ade and subsidise transport infrastr ucture.

A f urther strategy is to ensure that the location of new settlements makes sen se with
respect to distances an d transport linkages. Ho wever, if m un icip alities can rely on
transport subsidies to continue into the future, they have less in centive to m ake
appropriate plannin g decision s and promote densification, which cuts do wn on
recurrent transport costs.

If m unicipalities were to receive these subsidies directly, they wo uld be able to use
the fun ds to support their lon g-term spatial plan, while at the same tim e the gradual
phasing out of som e portion of the subsidies wo uld provide them with the incentives
to plan appropriately.

4.5     O verall approach to asymmetrical development

In addition to the specific inter governmental f iscal m echanisms that are influen ced by
the local asymm etry in South Africa, it is im portant to develop a flexible approach to
the application of lo cal gov ernment policies so as to ensure that the different
circumstances on the groun d are taken into account.
The Financial and Fiscal Com mission has proposed that the local governm ent system
                                 11
reco gnises these differen ces. In particular, an asym metrical approach co uld be
applied to:
• Local governm ent borro win g: m unicipalities could be classified accor ding to
     their ability to raise loan finan ce and to provide eff ective finan cial management.
     This classification would assist Gov ernment to target their support to
     municip alities for the development of debt management capacity and could also
     provide the basis for concessionary loans to m unicip alities with lim ited or no
     access to loan finan ce.
• Municipal service partner ship s (MSPs): There ar e m any kinds of MSPs, such as
     service contracts an d concessions, an d as they increase in complex ity, so does the
     required finan cial an d management capacity to im plement them . As with
     municip al borrowing, m unicipalities co uld be classified in terms of their ability
     to engage in such partner ships, and this would assist in dev elopin g cap acity-
     buildin g programmes an d in disco uragin g m unicipalities from entering into
     certain types of partner ship until the minimum institutional cap acity is in place.
• Local government reven ue so urces: many municipalities hav e in sufficient
     capacity to develop their local fiscal instruments and to collect reven ue. There
     sho uld be scope for varyin g the mix and nature of reven ue so urces, which co uld
     chan ge over time. Such a “graduated approach” has been suggested with respect
     to regional lev ies (e.g. som e m unicipalities collect the levies, while others receive
     a grant from Governm ent until such time that they are able to effectively m anage
     their o wn reven ue sour ce.

5.      Concl usions
This paper has described the historical processes that resulted in the consider able
socio-economic disparities that are foun d in South Africa. Owing to the spatial
orientation of m uch of apartheid policy, these disp arities have a distinctive geo graphic
form , with significant socio-economic contrasts within r ural areas an d within ur ban
areas, an d also bet ween ur ban an d r ural areas m ore generally. It was inev itable that
these disparities wo uld fin d expr ession in asym metrical cir cumstances in
municip alities, particularly in the diff erin g cir cumstances of municipalities located in
the form er “white” South Afr ica an d the form er bant ustan s.

For the most part, the local gov ernment reform process has been successful in
addr essin g this asymm etry. It has been very effective in ensurin g, through the re-
drawing of m unicipal bo undaries, that proxim ate dev eloped an d un der- dev eloped
areas are encompassed by one bo undary, thereby creating one tax base. The
intergovernmental transfer system has directed recurr ent fun ding accor ding to the
distribution of poverty, and infrastructure transfer s are targeted at m unicipalities with
the greatest infrastr uctur e back logs.

Challen ges r em ain, an d the intergovernm ental fiscal sy stem can play a k ey role in
addr essin g them . First, the local governm ent equitable share requires revision so that
it ensur es that the varying fiscal capacity of municipalities is adequately taken into

11
  Financial and Fiscal Commission, Submission: Medium-Term Expenditure Framework 2004-2007
(April 2003). Pages 107-114.
acco unt, including the f iscal capacity of r egional levies. The transfer system sho uld
also be assessed with respect to the need to address significant spillover s in the
provision of some social and econom ic serv ices. Secon dly, the sy stem of transport
subsidies should be re-examined with a view to ensurin g that m unicipalities have the
reso urces an d incentives to transform the apartheid landscape. Thir dly, incentives
sho uld be p ut into place to ensur e that municipalities redistribute resour ces within
their jur isdictions. An d finally, a differentiated appro ach sho uld be adopted with
respect to other areas of local government, such as borrowing and m unicipal serv ice
partnership s.
References
Finan cial and Fiscal Com mission, Submission: Medium -Term Expenditu re
Fram ework 2004-2007 (Ap ril 2003).
Map sho win g the lo cation of the Bant ustans, av ailable online at
http://1uptra vel. com /worldmaps/south-africa10.html (June 2004).
National Treasury, Intergo vernmental Fiscal Review, 2003.
Report of the Native Laws Comm ission, 1946 – 1948. U.G: Pretoria (known as the
Fagan Report).
Statistics So uth Africa, Cen su s 2001.
Thompson, L. (2001). A History of South Africa. Third Edition. Lon don: Yale
Univer sity Press.
White Paper on Local Governm ent, 1998.You can also read