Local media and geo-situated responses to Brexit: A quantitative analysis of Twitter, news and survey data
←
→
Page content transcription
If your browser does not render page correctly, please read the page content below
Local media and geo-situated responses to Brexit: A
                                                    quantitative analysis of Twitter, news and survey data
                                                    Genevieve Gorrell*1 , Mehmet E. Bakir1 , Luke Temple2 , Diana Maynard1 , Jackie
                                                    Harrison3 , J. Miguel Kanai2 , Kalina Bontcheva1

                                                    1 Department of Computer Science, University of Sheffield, Sheffield, South Yorkshire,
                                                    UK
                                                    2 Department of Geography, University of Sheffield, Sheffield, South Yorkshire, UK
arXiv:1902.06521v2 [cs.CY] 23 Jun 2020

                                                    3 Department of Journalism Studies, University of Sheffield, Sheffield, South Yorkshire,
                                                    UK

                                                    * g.gorrell@sheffield.ac.uk

                                                    Abstract
                                                    Societal debates and political outcomes are subject to news and social media influences,
                                                    which are in turn subject to commercial and other forces. Local press are in decline,
                                                    creating a “news gap”. Research shows a contrary relationship between UK regions’
                                                    economic dependence on EU membership and their voting in the 2016 UK EU
                                                    membership referendum, raising questions about local awareness. We draw on a corpus
                                                    of Twitter data which has been annotated for user location and Brexit vote intent,
                                                    allowing us to investigate how location, topics of concern and Brexit stance are related.
                                                    We compare this with a large corpus of articles from local and national news outlets, as
                                                    well as survey data, finding evidence of a distinctly different focus in local reporting.
                                                    National press focused more on terrorism and immigration than local press in most
                                                    areas. Some Twitter users focused on immigration. Local press focused on trade,
                                                    unemployment, local politics and agriculture. We find that remain voters shared
                                                    interests more in keeping with local press on a per-region basis.

                                                    Introduction
                                                    2016 saw the UK vote to leave the European Union, and Donald Trump elected as
                                                    president of the USA, and with this came a rising concern about truthfulness in politics
                                                    and the quality of information people have available to them (e.g. [37]). A parallel
                                                    issue relates to the way attention is drawn and shaped (e.g. “attention economy” [19]).
                                                    As media and public figures compete for attention, we may fail to notice the cost in
                                                    terms of reduced attention for the practical issues that have more impact on voters’
                                                    lives. When the UK voted to leave the EU on June 23rd 2016, it was unsurprising that
                                                    voters on the border between Northern Ireland and the Republic of Ireland voted to
                                                    remain in the EU. The prospect of a customs border separating Irish people from jobs
                                                    and family is a significant concern for them. However, in other regions of the UK the
                                                    relationship between voting behaviour and local interests requires more analysis in order
                                                    to understand local concerns and priorities. Cosmopolitan, affluent areas were more
                                                    likely to vote to remain in the EU, whereas more rural and less affluent areas voted to
                                                    leave, despite the importance of trade relationships with the EU [44] and the fact that
                                                    the majority of EU funding received by the UK goes to support agriculture and

                                    June 24, 2020                                                                                      1/25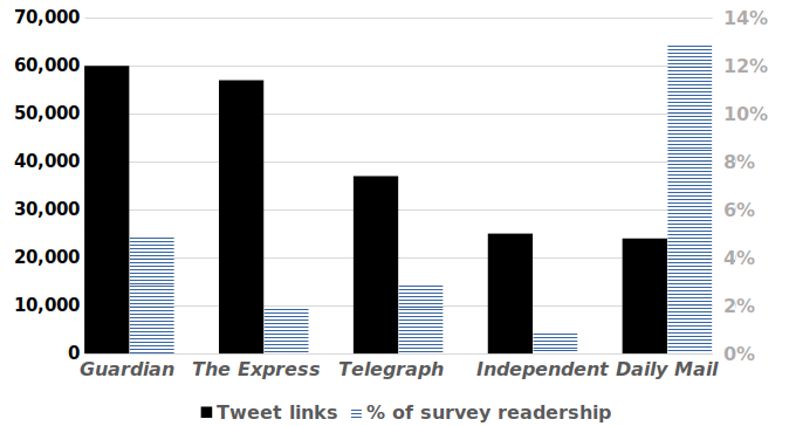
development, making them net financial beneficiaries [26]. The case of Sunderland, in
                the North East of England, perhaps illustrates that receiving funding does not equate to
                a pro-EU attitude [9, 38].
                    Close ties in offline communities increase resistance to propaganda and
                media-promoted ideas [39], and might have offered some ballast against the more
                extreme voices in the Brexit campaign. Yet local newspapers have faced numerous
                challenges over the last two decades due to concentration of media ownership,
                prioritization of shareholder interests above readers through a reduction in the numbers
                of journalists in local newsrooms, a decline in traditional advertising revenue which has
                resulted in cost cutting and redundancies, competition from companies such as Facebook
                and Google, which offer locally targeted advertising, the growth of social media as
                sources of local information, and changing news audience consumption patterns [36].
                The steady loss of traditional local print news sources through the closure or mergers of
                weeklies in local communities, daily newspapers in towns and cities and the demise of
                regional newspapers has led to “news gaps” [7] (unreported areas of concern), raising
                questions about the means by which communities can stay informed about relevant
                local affairs, develop community connections or sustain local identities within a
                geographic proximity [20]. The range and scope of local news coverage contributes to its
                vulnerability, as local news can be both a vital arm of local democracy, but it can also
                be of poor quality, routine, trite and trivial, “frequently terrible and yet also terribly
                important” [34]. Local coverage can range from exposing corruption in local public
                office to the mundane village fete, with relevance and importance coexisting alongside
                entertainment and a prurient fascination with local crime, human interest and lifestyle
                stories. Sources of news in the local setting are generally limited to a “news beat” which
                can lead to routine engagement with a narrow range of local sources such as local
                government and business and the police [18], missing the opportunity for individuals to
                express their views via traditional local media. Despite this decline, many important
                stories originate from the journalism that takes place at ground level in urban and rural
                areas and local news also tends to stay with stories once the national papers have left.
                    In this context, social media are both a problem and a possible solution. Whilst the
                success of digital local news and ultra-local start-ups have been patchy and audience
                take-up limited, the importance of local news has been recognized recently both by
                Facebook and the BBC. Facebook’s Community News Project [47] supports local
                journalism in the UK by enabling the National Council for the Training of Journalists
                (NCTJ) to oversee the recruitment of eighty trainee journalists on a two year scheme.
                The £4.5 million investment aims at increasing local news reporting in areas of the UK
                that have lost their local newspaper. In 2017 the BBC allocated £8m a year to pay for
                150 reporters to work for local news organizations rather than the BBC [5, 45] to cover
                council meetings and public services, both areas increasingly neglected by the local
                press, and to share these stories with the BBC. A 2018 OFCOM (UK broadcasting
                regulator) report of audiences’ use of news media indicates that 23% of news users use
                printed local or regional newspapers, showing that despite its decline in recent years,
                local newspapers still remain an important source of independent journalism about local
                public affairs. There is also evidence that online social networks have a strong local
                component, providing a new channel for localized discussion [4].
                    In this work, we use multiple methods and multiple sources to scope these issues. A
                large corpus of local and national news articles is drawn on to investigate the way in
                which regional interests were covered in the Brexit debate period. We cross-compare
                this with a corpus of Twitter data in which Brexit is discussed, considering how
                interests are reflected and media are amplified. In this corpus, the location and Brexit
                stance of the tweeters have been ascertained, enabling a novel localized, vote-orientated
                analysis to be performed. We also use survey data to ground-truth our findings with a

June 24, 2020                                                                                        2/25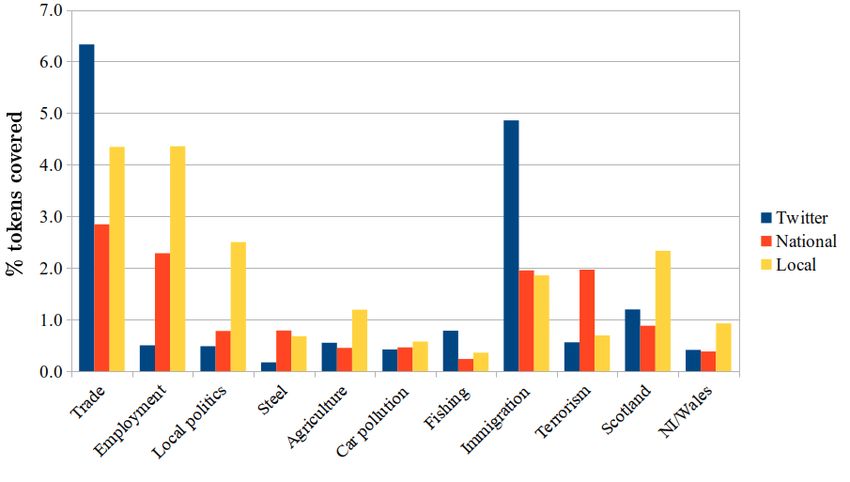
sample of the electorate, particularly with regards to media consumption. These three
                corpora taken together allow a new comprehensive picture to be formed, through
                quantitative investigation using topic modelling and named entity recognition.
                Specifically, our work addresses the following research questions:

                   • What were the main foci in national and local newspaper coverage in the different
                     regions of the UK in the run-up to the referendum, and how did they differ?
                   • How did newspaper coverage compare with what individuals from different regions
                     were discussing on Twitter? What does this say about media representation of
                     real interests?
                   • How do interest patterns and media consumption differ between those who
                     favoured leaving the EU and those who favoured remaining in it in different parts
                     of the country? How do they relate to local and national media?

                Related research
                Social media are increasing in popularity as a way for people to access news [33], and
                this has the potential for widespread impact on global politics. Social media have been
                widely observed to provide a platform for fringe views [3, 12, 35, 41], and political
                asymmetries on social media are a further cause for unease. Research in the US political
                context [1, 41] raises concerns regarding polarized political debates in other countries.
                Ferrara [14] presents findings on the anti-Macron disinformation campaign in the run-up
                to the 2017 French presidential election, and a body of work [23, 28] has begun to
                explore Brexit.
                    Bastos et al. [4] present similar work to ours, in which a sample of Twitter users has
                been classified for Brexit vote intent and situated geographically. They explore network
                structure in mentioning and retweeting to explore the relationship between “echo
                chambers” and geography. They find that remainers often had links to people who were
                further away from them, whereas leavers tended to be more linked to people who were
                geographically closer to them. While our Twitter corpora are similar, our work differs
                from theirs in its focus on local and national media influences. We also include
                evaluation results for our stance and location classification.
                    Gorrell et al. [16] explore the media influences that dominated the Twitter Brexit
                debate. The most linked newspaper is the Guardian, which reflects the majority remain
                stance on Twitter. However, an aggressive minority of leavers tweeted more media links
                in total, most notably to mainstream media such as the Express as well as a plethora of
                alternative media producing materials attracting a strong leave audience. Upheld press
                complaints centred particularly on the Express and other leave media, supporting
                others’ research regarding issues with truthfulness in the campaign [32]. Compared with
                that work, the novel contribution here is the focus on situatedness, as well as the new
                insights enabled by topic modelling of news text. Locating the users geographically, as
                well as enabling investigation of how views relate to location, also makes it more
                possible to give some indicators about whether the impression created by Twitter
                materials is plausible as a reflection of the attitudes and media-related behaviours of the
                populace, or whether it is skewed by, for example, “astroturfing” (campaign accounts
                posing as voters in order to influence) or other distorting influences.
                    Brexit media research is highly relevant here. Research undertaken by
                Loughborough University’s Centre for Research in Communication and Culture showed
                the extent of press bias towards the referendum among main UK outlets, with the
                Financial Times and The Guardian in strong support to remain in the EU, and The
                Sun and Daily Mail supporting the leave campaign [8]. Additional reports from this

June 24, 2020                                                                                         3/25
centre indicate consistency in the issue agendas: both types of outlets covered
referendum conduct, economy/business, and immigration as the three most prominent
issues [27]. Previous analysis [46] has investigated attitudes towards particular Brexit
campaign topics on Twitter. For example, issues related to employment were discussed
much more frequently by remainers than leavers, while issues related to immigration
and democracy were discussed much more frequently by leavers. We add to this through
drawing connections with local and national news. Moore and Ramsay contrast tabloid
and broadsheet coverage [32], and Matsuo and Benoit [30] investigate differences in the
dialogue between leave and remain camps, but little attention so far has focused on the
difference between local and national coverage. This is an important novel contribution
of our work.
More broadly, this research is positioned in the context of a global “information
malaise”, and concerns about the integrity of democracy. In the context of emerging
geographical research on Brexit and underlying patterns of economically left-behind
areas and the discontent of their socially disadvantaged populations vis-a-vis
metropolitan elitism [10, 29], more research is needed to ascertain the degree to which
diverse publics were able to comprehend the regulatory complexities of scale and make
full sense of its implications for their situated life chances. Los et al. [26] provide a
comprehensive review, and the same authors provide an illustrative graph [43] relating
EU exports from a region with their EU membership attitudes. Such research
acknowledges a regional aspect to attitudes, for example around Scottish identity, but
according to Manley et al. [29] geographical variation in Brexit attitudes can be
elucidated as an expression of differences in population such as age and qualification.
We reserve such an analysis for future work.
Corpora
In this section, we describe the three main data sources used in the work. We begin
with the news corpus, before discussing the Twitter corpus and the methods we used to
ascertain location and Brexit stance. Thirdly we introduce the survey data we draw on.
In the following section we present the topic modelling and entity detection approaches
we use throughout the work to profile interests and concerns.
Newspaper corpus
We collected articles from national and regional newspapers that are available in the
Nexis (https://www.nexis.com) database. The selection of national newspapers was
based on those with the highest circulation value that were available in Nexis,
comprising a mix of tabloid and broadsheet papers. We collected articles including any
of the keywords “Brexit”, “EU”, “referendum”, or “article 50” in the body of the text
that were published between February 20th and June 23rd 2016 (the date of the
referendum announcement until the referendum itself). The list of newspapers and the
number of matched articles are given in Tables 1, 2 and 3 of ??. Unfortunately, the
Express was not available for inclusion and could not be accessed in a methodologically
consistent way. Our corpus is large enough, with over 35,000 articles spanning the
political spectrum and including both tabloids and broadsheets, to form a fair
representation of the UK media landscape despite this, and media material has not been
analyzed on a publication-by-publication basis in this work.
These data have been used to form two region-sensitive divisions. Firstly, regional
newspaper articles can be divided according to region of publication. Secondly, both
regional and national articles can be divided according to the location that the article is
primarily about. We identified the location names mentioned in the articles by matching
June 24, 2020 4/25text to a gazetteer list of UK location names extracted from DBpedia
(https://wiki.dbpedia.org/), a structured encyclopedia derived from Wikipedia and
suitable for machine use. The DBpedia location entities are also assigned additional
properties such as the coordinates of the locations. We used the coordinate information
to identify the level 1 Nomenclature of Territorial Units for Statistics (NUTS,
https://ec.europa.eu/eurostat/web/nuts/background) region of locations
mentioned in the articles. In this way, a mention of “Edinburgh”, for example, would be
associated with the NUTS region “UKM”, Scotland. The most frequently occurring
NUTS region in each article was assigned to it. Not all articles mentioned a UK
location, so some articles were unassigned. Table 4 of ?? gives article counts per region.
Twitter corpus
Around 17.5 million tweets were collected using Twitter’s Streaming API from 3rd April
until 23 June 2016. The highest daily volume was 2 million tweets on June 23rd (only
3,300 were lost due to Twitter rate limiting - information that is available via the API),
with just over 1.5 million during poll opening times. June 22nd was second highest, with
1.3 million tweets. The 17.5 million tweets were authored by just over 2 million distinct
Twitter users (2,016,896). The tweets were collected based on the following keywords
and hashtags: votein, yestoeu, leaveeu, beleave, EU referendum, voteremain, bremain,
no2eu, betteroffout, strongerin, euref, betteroffin, eureferendum, yes2eu, voteleave,
voteout, notoeu, eureform, ukineu, britainout, brexit, leadnotleave. These were chosen for
being the main hashtags, and are broadly balanced across remain and leave hashtags.
Almost half a million of these users were able to be classified by Brexit vote intent,
on the basis of tweets authored by them and identified as being in favour of leaving or
remaining in the EU. Partisan hashtags such as “#voteleave” at the end of a tweet
quite reliably summarize the tweeter’s position with regards to the referendum. The
methodology used is described in more detail in Gorrell et al. [16] The end result is a list
of 208,113 leave voters and 270,246 remain voters, classified with an accuracy of 0.966.
Accuracy of the approach was able to be ascertained using a test corpus derived from
formulaic, explicit vote declarations generated in response to a campaign of the time.
Users were allocated to a NUTS1 region on the basis of text in the Twitter location
field. This is a free text field that users may fill in in any way they choose, or choose
not to fill in. As a result of this, users may ignore the field, repurpose it or use it
humorously, so only a limited number of locations could be identified reliably. In total,
162,548 user locations were obtained using the same approach as for the newspaper
articles, in which text is matched to a gazetteer of UK location names from DBpedia,
and the coordinates given are used to assign a NUTS1 region. In addition, a very small
number of Twitter users (0.18% of our sample) had consented to location coordinates
being added to their tweets. These are too small in number to make an impact on the
size of the dataset, but made it possible to tune and evaluate the work to some degree.
The evaluation on a test set of 1016 users with location coordinates achieved a precision
of 0.82, a recall of 0.67 and an F1 of 0.74. The actual accuracy is probably a little
higher than this, since the coordinates may not be especially more reliable than the
location field resolution, as users may have moved around.
Survey data
In order to add context to this study, we profile both the general Twitter user and those
who claim to ’share political information’ on the platform by making use of wave 12
data from The British Election Study 2014-2018 [15]. The study is managed by a
consortium of the University of Manchester, the University of Oxford and the University
of Nottingham, and wave 12 was conducted by the market research firm YouGov
June 24, 2020 5/25between the 5th of May 2017 and the 7th of June 2017. 34,464 of the address-sampled
respondents participated. The questionnaire covers a broad variety of demographic
information, as well as politically relevant behaviours and attitudes including social
media use.
Methods
Two main natural language processing methods have been used to explore the subject
matter in the news and tweet corpora in a quantitative way; a topic view and an entity
view.
Topic modelling
Latent Dirichlet Allocation (LDA) [6] was used to discover topics discussed in the
Twitter and newspaper corpora. In LDA, word frequencies in texts are considered to
arise from a weighted mixture of latent topics. Topics are discovered automatically,
having manually specified the desired number. Deciding on the number of topics is
often done by plotting the coverage provided by the topics against a range of topic
numbers; an “elbow” in the graph shows where increasing the number of topics starts to
give a diminishing return in covering the data. However, since the nature of our work is
to explore meaningful subject areas from a narrative point of view, we were obliged to
increase the number of topics. The reader should bear in mind as we proceed that
varying the topic number can have an unpredictable effect on outcomes, since for
example ambiguous tokens (i.e. words or numbers) may move in and out of topics. It is
for this reason that we use two methodologies (topic modelling and named entity
extraction) in the work.
The final set of 75 topics was derived from the complete news corpus, as this
provided a large enough quantity of material to extract detailed, high quality topics.
The topics discovered covered a broad range of relevant subjects, including energy (0.8%
of tokens) and the “Queen Backs Brexit” story (0.7% of tokens). Higher token coverage
does not necessarily indicate a better topic; the two biggest topics (7.4% and 6.9% of
tokens respectively) capture mainly the background language distribution (five most
salient words in these with λ = 0.5 [40] are “get”, “like”, “think”, “thing”, “know” and
“even”, “may”, “seem”, “yet”, “political”, respectively, for illustration), and it is evident
from the examples given that small topics can be very precise. This same set of topics
was then applied to Twitter material as well as news subsets as necessary, in order to
enable comparisons to be made between the differing datasets.
Of these topics, a number were pre-selected, guided by theory, in order to reduce the
possibility of type one errors that would arise in calculating statistical significance of
relationships across such a large number of topics. The theory was that local coverage
would emphasise practical matters of relevance to local people’s daily lives, whereas
national coverage would emphasise matters such as national identity. We thus identified
a range of topics that were likely to provide a good opportunity to investigate these
points, as shown in Table 1.
Entities
In the entity view, TagMe (https://tagme.d4science.org/tagme/) [13] has been
used to find mentions of entities in the corpora. An “entity” might be a person, place or
organization, or it might be a concept; TagMe matches anything with a Wikipedia
page. Any annotation has an associated value ρ ∈ [0, 1] which estimates the “goodness”
of the annotation with respect to the other entities of the input text. We used this value
June 24, 2020 6/25Topic Five most salient tokens % of tokens Theory
Trade trade single market free britain 3.1 Most Localities
Employment work development need fund skill 2.6 Most Localities
Local politics city council local town park 1.0 Most Localities
Steel steel tata javid talbot port 0.8 Specific Localities
Agriculture farmer farm rural managing broadband 0.6 Specific Localities
Car pollution car pollution vehicle air diesel 0.5 Specific Localities
Fishing fish water vessel fisherman fishery 0.3 Specific Localities
Immigration immigration migration migrant wage immigrant 1.9 National Interest
Terrorism attack brussels airport belgian metro 1.8 National Interest
Scotland scotland scottish snp independence sturgeon 1.1 National Interest
Northern Ireland/Wales ireland northern irish wales belfast 0.5 National Interest
Table 1. Topics selected for study, along with five most salient words (note that the
topic was titled and selected based on the full set of words in the topic, not just the five
shown). The percentages of tokens in the corpus covered by the topics are given,
alongside our theoretical expectations regarding national relevance.
to filter poor annotations, namely those with ρ < 0.10 (We used this value as suggested
in the documentation).
We then derived the entities associated with a newspaper as the aggregation of
entities found in its articles. Using the correspondence between articles and NUTS1
regions described above, we also derived regional entities as the aggregation of
annotations found in articles with same associated region.
In order to effectively extract the “key” topics on both aggregates, we exploited the
following scoring technique to rank entities:
• score(e, A) = articles count(e, A) ∗ max ρ(e, A)
where articles count(e, A) is the number of articles in the aggregate A containing
entity e and max ρ(e, A) is the max value of ρ among the occurrences of entity e in A.
The final rank is obtained by ordering entities according to their scores.
The entity view benefits from TagMe’s ability to disambiguate mentions of entities.
For example, Theresa May might be referred to as “Mrs. May”, or “the UK prime
minister”. Therefore, counts of mentions can be grouped across different ways of
expressing a concept. It also makes it easier to focus on important entities, as only
entities salient enough to have a Wikipedia page are extracted. It is like asking closed
questions; how do people talk about, for example, Brussels? Trade tariffs? Who talks
most about these subjects? The topic view is more like asking open questions; we take
our lead from what the texts themselves focus on. This is important as closed questions
can miss unexpected trends or more subtle effects. For example, subtleties such as
trends toward nationalism in the discourse may be lost in the entity view but might
appear as a topic using LDA. It was possible to select baskets of entities that matched
the pre-selected LDA topics well, enabling various forms of parallel analysis.
Ethics
Ethics approval was obtained for the Twitter data collection from the University of
Sheffield (application number 011934), and Twitter’s terms and conditions for the
collection of such data are complied with. Only publicly shared data are used; however,
due to the sensitive nature of political opinion, the data are held confidentially and for a
limited time duration, as required by the ethics committee. Anonymous aggregate data
are available at https://gate-socmedia.group.shef.ac.uk/wp-content/uploads/
2020/04/brexit-geomedia-shared-data.zip
June 24, 2020 7/25Topic % Toks Topic % Toks
Trade (UK internat.) 3.1 Refugees (Calais) 1.9
The economy 2.9 Football 1.9
David Cameron 2.8 Business 1.8
Brexit campaign 2.8 Terrorism (Brussels) 1.8
Employment 2.6 UK treasury 1.8
UK politics 2.2 Russia/Ukraine 1.7
Immigration 1.9 EU politics 1.7
Table 2. Most significant topics in newspaper corpus
Results
We discuss each research question in turn. First we review newspaper coverage,
considering both overall emphasis and regional foci, as well as contrasting local and
national coverage, and impressions related to particular areas. We then explore
reception via the Twitter corpus, considering regional differences. Finally we relate
findings on a per-region basis to vote declarations on Twitter as well as referendum
outcomes.
RQ1: National and local newspaper coverage
As previously mentioned, topics were derived on the entire newspaper corpus, and used
throughout the work. The two largest topics covered background language distributions,
enabling other topics to uncover semantically coherent areas in contrast. The third most
dominant topic was Brexit itself, which is unsurprising given that the corpus was
deliberately comprised of articles mentioning Brexit. The fourth topic is background
language relating to the business of government and law, and after that we see topics
that give a sense of what the media considered to be relevant issues to Brexit. The
economy and the government feature highly, as do aspects of the Brexit campaign,
supporting Loughborough’s findings [8] about press focus.
The top 14 of these are given in Table 2. Further background language or unclear
topics have been excluded as uninformative.
Fig 1. Topics (from topic modelling) - percentage of tokens covered by selected topics
in national and regional press vs. Twitter, showing differing emphases.
June 24, 2020 8/25In terms of topics, national papers talk about the economy, David Cameron, trade,
employment, refugees, terrorism, and immigration. Regional papers discuss employment,
trade, football, the economy, UK politics, local politics, and Scotland. Notable
differences from national coverage include a greater emphasis on employment, football,
local politics and Scotland, and a reduced emphasis on terrorism. Fig 1 shows the
extent of representation of our pre-selected topics in national and local news articles,
alongside Twitter findings which will be discussed later in the work.
Regional findings
In order to explore how local interests and local foci were reflected in the national
narrative, we looked at topic representation in the different regions. Regional variation
in interests was found. For example, agriculture was mentioned most in local papers in
East Anglia. Steel was mentioned most by local papers in Wales, as well as the North
East, and most by national papers in conjunction with Wales. Choropleths for all
selected topics are available on the project website
(http://services.gate.ac.uk/politics/ba-brexit/) and examples of trade and
Brexit mentioning in local papers are given in Fig 2. Darker green shade indicates more
topic representation in that region. Brexit mentioning pattern in local papers suggests
that a focus on Brexit may have disposed toward voting leave, or reflected local leave
tendencies, a hypothesis that is tested below under research question 3.
Fig 2. Topics mentioned by local papers published in regions. Proportion of topic
tokens on average per article are shown, scaled to the maximum value across the topics
in the figure. Created using JSON map data shared with the authors under a CC BY
license, with permission from Mark Greenwood.
We now compare topics emerging from regional publications with the overall picture
from national papers. It was hypothesized that local interests would be more practical,
and that employment, trade and local government would be more widely mentioned in
local publications than nationally. Steel, agriculture, car pollution and fishing were
expected to be mentioned more than in national publications only in certain regions.
June 24, 2020 9/25Conversely, it was predicted that immigration, terrorism, Scotland and Northern
Ireland/Wales would be mentioned more in national publications (other than, in the
case of Scotland and Northern Ireland/Wales, in the regions themselves).
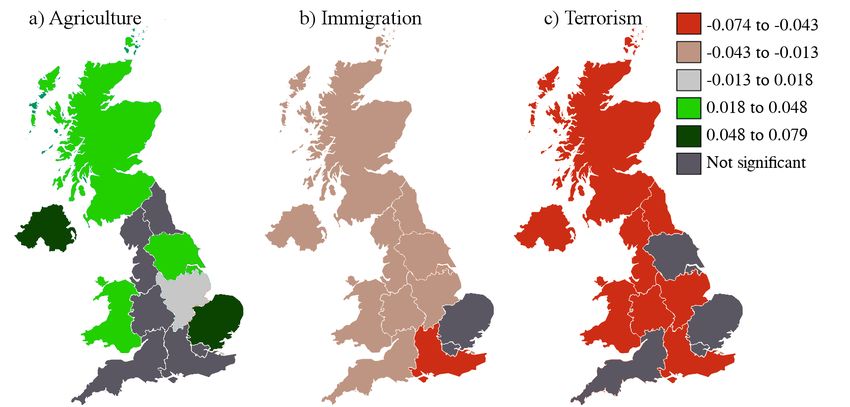
Fig 3. Topic emphasis in local vs. national newspapers. Green indicates that the topic
is mentioned more in local papers. Created using JSON map data shared with the
authors under a CC BY license, with permission from Mark Greenwood.
It was confirmed that employment was mentioned significantly more in most regions
than nationally, as was trade. Agriculture was found to be of more widespread interest
than had been predicted, but was indeed more often mentioned in local publications, as
shown in Fig 3. Local politics was also mentioned more in regional publications. In the
figure, national coverage has been subtracted from local coverage (proportion of tokens
covered by the topic, averaged over articles) to show regional differences in the contrast
with national coverage, grey indicating more similarity. All differences are significant at
pFig 4. Topic emphasis in local vs. national newspapers; further topics. Red indicates
that the topic is mentioned more in national papers, and green, less. Created using
JSON map data shared with the authors under a CC BY license, with permission from
Mark Greenwood.
way for national press to show local sensitivity, perhaps even more than by reflecting
their interests in the national discourse without mentioning the region. Topic
representations in national press articles, divided into regions according to location
mentions, were correlated with topics in local press coverage per-region to determine the
extent to which emphasis agrees. The strongest correlations were for the topics of
Scotland (0.99, pAside from the above, we do not see strong correlations for the other topics, which
means that national reporting does not show a high degree of reflection of regional
differentiation by topic. Agriculture, car pollution and fishing show weak,
non-significant correlations, while terrorism, trade and employment show weak negative
correlations.
Entities
A parallel analysis was performed using entity mentions, on a per-newspaper basis.
Matched entities were used for the pre-selected topics, as mentioned above. Entities
were associated with regions in a similar manner to that described above for topics; i.e.
by associating articles with regions that are mentioned in them (or places in those
regions). However in order to maximize the data, since entity mentions are more sparse,
the entire corpus was used to associate entities with locations according to their being
mentioned in the article, including regional newspaper articles. Representation is
calculated as the average number of entity mentions for the subject in the article.
Observe that the subject of trade is widely associated with a variety of regions,
confirming the observation for topics, as shown in Fig 5. Darker shades indicate a
higher incidence of entity mentioning; findings are scaled against the maximum score for
the figure.
Fig 5. Entities mentioned by national papers (average mentions per article) in
connection with regions. Values are scaled to the maximum value of the figure. Created
using JSON map data shared with the authors under a CC BY license, with permission
from Mark Greenwood.
Fig 6 shows example entities discussed in regional papers. Trade is mentioned
mainly in areas that voted leave, as above, but also in London and Northern Ireland.
Employment was widely mentioned, suggesting substantiation for our hypothesis that
employment was more important in regional papers than national ones. This is further
explored in the subsection on research question 3 below. Again, further choropleths can
be found on the project website.
June 24, 2020 12/25Fig 6. Entities mentioned by local papers in regions (average mentions per article)
scaled to the maximum value for the figure. Created using JSON map data shared with
the authors under a CC BY license, with permission from Mark Greenwood.
Topic Nat. av. Reg. av. p-value Sig.
Employment 0.106 0.106 0.782 -
Agriculture 0.0 0.021 0.020 *
Immigration 0.06 0.025 0.000 ***
Terrorism 0.074 0.02 0.000 ***
Scotland 0.029 0.034 0.003 **
EU politics 0.177 0.151 0.004 **
Trade 0.115 0.097 0.188 -
Local government 0.0 0.047 0.000 ***
NI/Wales 0.052 0.038 0.013 *
Table 4. Mann Whitney tests comparing average entity topic area mentions per article
in national media vs local media. First two columns give the average number of
mentions per article. The p-value and a visual significance indicator are then given.
We now compare local and national papers through the entities lens, in the same
way as we did for topics above. For entities, this was done on a per-newspaper basis to
increase reliability (topics were done on a per-article basis) with the consequence that
findings were not uniformly statistically significant, and generally, entity findings are
more subtle. Immigration and terrorism were mentioned generally less in local coverage,
as illustrated in Fig 7. Scotland was mentioned generally less in local coverage except in
Scotland where it was mentioned more (pFig 7. Entity emphasis in local vs. national newspapers. Red areas are those where the
topic was mentioned more in national newspapers; green, more in local papers. All
findings are significant at at least pTwitter users (1) Political sharers
vs Non-users (0) on Twitter (1)
vs Tw. Users (0)
Age -0.03*** -0.01*
Gender (ref = Male) -0.11* -0.26**
Attended University 0.20*** 0.13
Class (ref = D/E)
- C2 -0.16 -0.70**
- C1 0.05 -0.11
- A/B 0.52 -0.19
Retired -0.30*** 0.28
Ethnic Minority -0.10 0.21
Daily Internet Use (ref =Twitter conversation, originating almost twice as many links per capita as any other
region among leavers, more than five times as many as Northern Ireland leavers, and
around four times as many links at least from remainers as any other region, a result
that echoes the survey findings above with regards to location of Twitter users. Fig 9
however illustrates that the leave campaign on Twitter had markedly more engagement
in other regions of England than the remain campaign, a finding that still holds for
tweet count instead of link count. Further choropleths can be viewed on the project
website (http://services.gate.ac.uk/politics/ba-brexit/).
Fig 9. URLs (in tweets) per capita, split by leave/remain vote intention of the Twitter
account holder. Created using JSON map data shared with the authors under a CC BY
license, with permission from Mark Greenwood.
Overall, the Guardian was the most linked paper across regions/voters (60,472 links,
of which 67% were from remainers), followed by the Express (56,652 links, of which 99%
were from leavers), the BBC (47,577 links of which 59% were from leavers), the
Telegraph (36,729 links, of which 83% were from leavers), the Independent (25,645 links,
of which 58% were from remainers) and the Daily Mail (23,633 links, of which 91% were
from leavers). In most regions, the Express is the most popular link target by some
margin. In the north east and south east however the Guardian edges ahead slightly. In
London, Wales and Scotland, Guardian is the most popular by some margin. Across the
regions, most linked sites are uniformly the Express, the Guardian, the BBC, the
Telegraph, the Daily Mail and the Independent in slightly varying orders. Links to local
papers are much fewer; the Yorkshire Post received 2,388 links (of which 88% were from
remainers) and the Herald, 980 links (of which 54% were from leavers).
Comparing these figures with the readership figures in the survey data reveals an
interesting picture, as shown in Fig 10. The media that attract the most links on
Twitter are not at all the papers that have the highest circulation. The two main online
influences of the Guardian and the Express are both attracting proportionally smaller
June 24, 2020 16/25numbers of people who actually state that they are readers, with the disparity in the
case of the Express being particularly great. The Daily Mail, on the other hand, is
reaching a much wider audience than its Twitter linking figures would suggest. This
raises questions regarding the social meaning of linking to a newspaper on Twitter.
Fig 10. Tweets links from each paper analyzed in study and % of survey readership
who read paper, showing that a news source being linked on Twitter does not provide
an indicator of readership.
Subjects of general interest in the Twitter corpus (which we recall is selected
according to Brexit-related hashtags so can be expected to illustrate subjects mentioned
in conjunction with Brexit) include trade, immigration and football. Subjects that
attracted more interest on Twitter than in the press as a whole include for example the
murder of Jo Cox, the National Health Service (NHS), the rumour that Queen Elizabeth
II supports Brexit, and the former UK Independence Party leader Nigel Farage.
We saw in Fig 1 that over our selection of topics, Twitter interest levels differ from
those in the local and national press. Tweeters are more interested in trade,
immigration and fishing than either local or national press. They are less interested in
employment, local politics, steel, car pollution and terrorism. Tweeters lie in a middle
ground between national (low) and local (high) levels of interest in Scotland, Northern
Ireland/Wales and agriculture. All findings are significant at pTopic Twitter National Regional Leave Remain
Immigration 0.024 0.023 0.02 0.029 0.02
NI/Wales 0.007 0.005 0.009 0.006 0.008
Scotland 0.01 0.01 0.022 0.01 0.01
Terrorism 0.007 0.015 0.006 0.008 0.006
Steel 0.003 0.007 0.007 0.003 0.004
Trade 0.026 0.028 0.042 0.031 0.022
Local gov 0.01 0.007 0.02 0.008 0.01
Fishing 0.006 0.003 0.004 0.007 0.005
Employment 0.013 0.021 0.034 0.011 0.015
Agriculture 0.008 0.005 0.011 0.008 0.009
Car pollut. 0.006 0.006 0.006 0.006 0.006
Table 6. Mean values for the topic representation in different media across
articles/tweeters. Leave and remain columns average across Twitter material from
accounts identified as leave or remain voters.
conjunction with those regions (pleave. Mentioning Scotland in local newspapers correlates with voting remain (p
immigration, but on inspection this is shown to be unrepresentative of Twitter users in
                 general. The unusual distribution of users’ interest levels in immigration, with a large
                “bulge” showing medium to high levels, might be suggestive of campaign activity
                (organized lobbying by a vocal group). Further investigation of this is important future
                work.
                     Newspapers popularly linked from tweets show a very different profile from
                 newspapers that survey respondents say that they read. The Daily Mail was most
                 popular among survey respondents, but on Twitter the Guardian and the Express were
                 most popular, demonstrating that their appeal on that medium is amplified, perhaps in
                 part due to the demographics of Twitter, but maybe also due to a difference in how
                 information is consumed on Twitter, creating a market for stories that support different
                 objectives such as identity signalling or influencing. The Express in particular is
                 anomalous in that although those linking to it are almost unanimously leave voters, the
                 number of survey respondents claiming to read the paper per region does not correlate
                with the overall voting pattern in that region (regions with more Express readers do not
                 have more leave voters). This might suggest that an Express article serves a particular
                 purpose online that it does not serve offline, and this might also be connected to the
                 unusual Twitter activity around immigration–the Express produced an abundance of
                 anti-immigration articles [36]. The extent of a region’s Daily Mail readership is a much
                 better indicator of its likely Brexit stance, and indeed the lack of correlation between
                 Express readership and regional Brexit vote might be explained by the possibility that
                 generally speaking, the country’s leavers find the Daily Mail more reflective of their
                 attitudes.
                     We also find some evidence that remain voters are more aligned with the local press
                 in terms of topic profile than leave voters. This could be seen as supporting
                 Seaton’s [39] suggestion that local press are doing an important job in increasing
                 resistance to “propaganda and media-promoted ideas”, and in keeping with Faris et
                 al’s [12] proposition of network propaganda in that to some extent Twitter sharers and
                 some national press co-operated on an immigration and terrorism-focused narrative that
                 didn’t cover to the same extent as local press a range of practical issues relevant to
                 people’s lives.

                Supporting information
                Acknowledgments
                This work was supported by the UK Engineering and Physical Sciences Research
                Council grant EP/I004327/1 and the British Academy under call “The Humanities and
                Social Sciences Tackling the UK’s International Challenges” and by the European Union
                under grant agreement No. 654024 “SoBigData”.

                References
                    1. Allcott H, Gentzkow M. Social media and fake news in the 2016 election. Journal
                       of Economic Perspectives. 2017;31(2):211–36.
                    2. Antonucci L, Horvath L, Krouwel A. Brexit was not the voice of the working
                       class nor of the uneducated-it was of the squeezed middle LSE Brexit. 2017;.

                    3. Barberá P, Rivero G. Understanding the political representativeness of Twitter
                       users. Social Science Computer Review. 2015;33(6):712–729.

June 24, 2020                                                                                      20/25
Appendix
Newspaper Region Articles
The Northern Echo UKC 405
Sunderland Echo UKC 113
Manchester Evening News UKD 169
Liverpool Echo UKD 321
Lancashire Evening Post UKD 135
The Bolton News UKD 106
Hull Daily Mail UKE 180
Yorkshire Post UKE 873
The Star (Sheffield) UKE 290
Yorkshire Evening Post UKE 192
York Press UKE 358
Bradford Telegraph and Argus UKE 67
Leicester Mercury UKF 248
Derby Telegraph UKF 313
Nottingham Post UKF 219
Stoke The Sentinel UKG 415
Birmingham Evening Mail UKG 362
Coventry Evening Telegraph UKG 225
Eastern Daily Press UKH 336
The Evening Standard (London) UKI 1571
Oxford Mail UKJ 207
Hampshire Chronicle UKJ 24
Bristol Post UKK 218
The Plymouth Herald UKK 204
Bournemouth Echo UKK 258
Daily Post (North Wales) UKL 619
South Wales Evening Post UKL 269
South Wales Echo UKL 267
Aberdeen Press and Journal UKM 509
Herald (Glasgow) UKM 1524
Aberdeen Evening Express UKM 151
Evening Times (Glasgow) UKM 154
Edinburgh Evening News UKM 190
Belfast Telegraph UKN 665
Irish News UKN 657
Total 12814
Table 7. Regional Newspapers Article Numbers
NUTS1 NUTS1 Name Papers
UKC North East (England) 2
UKD North West (England) 4
UKE Yorkshire and The Humber 6
UKF East Midlands (England) 3
UKG West Midlands (England) 3
UKH East of England 1
UKI London 1
UKJ South East (England) 2
UKK South West (England) 3
UKL Wales 3
UKM Scotland 5
UKN Northern Ireland 2
Total 35
Table 8. Regional Newspaper Counts
June 24, 2020 21/25Newspaper Articles
Daily Mail and Mail on Sunday 2041
Daily Star Daily Star Sunday 328
Financial Times (London) 2464
The Daily Telegraph (London) 2719
The Guardian(London) 9709
The Independent (United Kingdom) 6833
The Mirror and The Sunday Mirror 1353
The New Statesman 116
The Observer(London) 587
The Spectator 181
The Sun (England) 3050
The Sunday Telegraph (London) 542
The Sunday Times (London) 1336
The Times (London) 4070
Total 35329
Table 9. National Newspapers Article Numbers
NUTS1 NUTS1 Name Articles
UKC North East (England) 313
UKD North West (England) 485
UKE Yorkshire and The Humber 1384
UKF East Midlands (England) 648
UKG West Midlands (England) 548
UKH East of England 265
UKI London 2464
UKJ South East (England) 368
UKK South West (England) 584
UKL Wales 649
UKM Scotland 1104
UKN Northern Ireland 180
Total 8992
Table 10. Regional Mention Article Counts
4. Bastos M, Mercea D, Baronchelli A. The geographic embedding of online echo
chambers: Evidence from the Brexit campaign. PLoS ONE. 2018;11(13).
5. BBC, https://www.bbc.co.uk/news/uk-38843461, 02 02 2017.
6. Blei DM, Ng AY, Jordan MI. Latent dirichlet allocation. Journal of Machine
Learning Research. 2003;3(Jan):993–1022.
7. Currah A. Navigating the crisis in local and regional news: A critical review of
solutions. University of Oxford, Reuters Institute for the Study of Journalism;
2009.
8. Deacon D, Wring D, Harmer E, Downey J, Stanyer J. Hard evidence: analysis
shows extent of press bias towards Brexit. 2016;.
9. de Freytas-Tamura K, https://www.nytimes.com/2016/06/28/world/europe/
european-union-brexit-sunderland-britain-cameron.html, 27 06 2016.
10. Dorling D. Brexit: the decision of a divided country; 2016.
11. Duggan M. Mobile messaging and social media 2015. Pew Research Center.
2015;19:2015.
12. Faris R, Roberts H, Etling B, Bourassa N, Zuckerman E, Benkler Y. Partisanship,
Propaganda, and Disinformation: Online Media and the 2016 US Presidential
Election. Berkman Klein Center for Internet & Society Research Paper. 2017;.
June 24, 2020 22/2513. Ferragina P, Scaiella U. TAGME: on-the-fly annotation of short text fragments
(by wikipedia entities). In: Proceedings of the 19th ACM Conference on
Information and Knowledge Management, CIKM 2010, Toronto, Ontario,
Canada, October 26-30, 2010; 2010. p. 1625–1628. Available from:
http://doi.acm.org/10.1145/1871437.1871689.
14. Ferrara E. Disinformation and social bot operations in the run up to the 2017
French presidential election. First Monday. 2017;22(8).
15. Fieldhouse E, Green J, Evans G, Schmitt H, van der Eijk C, Mellon J, Prosser C,
https://www.britishelectionstudy.com/data-object/
wave-12-of-the-2014-2018-british-election-study-internet-panel/,
2017.
16. Gorrell G, Roberts I, Greenwood MA, Bakir ME, Iavarone B, Bontcheva K.
Quantifying Media Influence and Partisan Attention on Twitter During the UK
EU Referendum. In: Staab S, Koltsova O, Ignatov DI, editors. Social Informatics.
Cham: Springer International Publishing; 2018. p. 274–290.
17. Greenwood S, Perrin A, Duggan M. Social media update 2016. Pew Research
Center. 2016;11:83.
18. Harrison J. News. Abingdon. MA/Oxon, England: Routledge. 2006;.
19. Harsin J. Regimes of posttruth, postpolitics, and attention economies.
Communication, Culture & Critique. 2015;8(2):327–333.
20. Hess K, Waller L. Geo-Social Journalism: Reorienting the study of small
commercial newspapers in a digital environment. Journalism Practice.
2014;8(2):121–136.
21. Jungherr A. Twitter in politics: a comprehensive literature review. 2014;.
22. Kalogeropoulos A, Negredo S, Picone I, Nielsen RK. Who Shares and Comments
on News?: A Cross-National Comparative Analysis of Online and Social Media
Participation. Social Media+ Society. 2017;3(4):2056305117735754.
23. Lansdall-Welfare T, Dzogang F, Cristianini N. Change-point analysis of the
public mood in UK Twitter during the Brexit referendum. In: Data Mining
Workshops (ICDMW), 2016 IEEE 16th International Conference on. IEEE; 2016.
p. 434–439.
24. Larsson AO, Moe H. Triumph of the underdogs? Comparing Twitter use by
political actors during two Norwegian election campaigns. Sage Open.
2014;4(4):2158244014559015.
25. Li L, Goodchild MF, Xu B. Spatial, temporal, and socioeconomic patterns in the
use of Twitter and Flickr. Cartography and geographic information science.
2013;40(2):61–77.
26. Los B, McCann P, Springford J, Thissen M. The mismatch between local voting
and the local economic consequences of Brexit. Regional Studies.
2017;51(5):786–799.
27. Loughborough University Centre for Research in Communication and Culture,
https://blog.lboro.ac.uk/crcc/eu-referendum/
uk-news-coverage-2016-eu-referendum-report-5-6-may-22-june-2016/,
27 06 2016.
June 24, 2020 23/2528. Mangold L. Should I stay or should I go: Clash of opinions in the Brexit Twitter
debate. Computing. 2016;1(4.1).
29. Manley D, Jones K, Johnston R. The geography of Brexit–What geography?
Modelling and predicting the outcome across 380 local authorities. Local
Economy. 2017;32(3):183–203.
30. Matsuo A, Benoit K, https://blogs.lse.ac.uk/brexit/2017/03/16/
more-positive-assertive-and-forward-looking-how-leave-won-twitter/,
16 03 2017.
31. Mellon J, Prosser C. Twitter and Facebook are not representative of the general
population: Political attitudes and demographics of British social media users.
Research & Politics. 2017;4(3):2053168017720008.
32. Moore M, Ramsay G. UK media coverage of the 2016 EU referendum campaign.
King’s College London; 2017.
33. Newman N, Fletcher R, Kalogeropoulos A, Levy DA, Nielsen RK. Reuters
Institute digital news report 2017. 2017;.
34. Nielsen RK. Local journalism: The decline of newspapers and the rise of digital
media. IB Tauris; 2015.
35. Preoţiuc-Pietro D, Liu Y, Hopkins D, Ungar L. Beyond binary labels: political
ideology prediction of Twitter users. In: Proceedings of the 55th Annual Meeting
of the Association for Computational Linguistics (Volume 1: Long Papers). vol. 1;
2017. p. 729–740.
36. Ramsay G, Moore M. Monopolising local news. Centre for the Study of Media,
Communication and Power, King’s College London. 2016;.
37. Rose J. Brexit, trump, and post-truth politics; 2017.
38. Rushton P. The Myth and Reality of Brexit City: Sunderland and the 2016
Referendum. 2017;.
39. Seaton J. Brexit and the Media. The Political Quarterly. 2016;87(3):333–337.
40. Sievert , Shirley K LDAvis: A method for visualizing and interpreting topics
Proceedings of the workshop on interactive language learning, visualization, and
interfaces 2014:63
41. Silverman C. Lies, damn lies and viral content. Tow Center for Digital
Journalism; 2015.
42. Skinner G, Gottfried G. How Britain voted in the 2016 EU referendum. 2017;.
43. Springford j, McCann P, Los B, Thissen M, https://www.cer.eu/insights/
brexiting-yourself-foot-why-britains-eurosceptic-regions-have-\
most-lose-eu-withdrawal, 13 06 2016.
44. The Conversation, https://theconversation.com/
how-brexit-will-hit-different-uk-regions-and-industries-91287, 09
02 2018.
45. Tsang A, https://www.nytimes.com/2018/12/09/business/
bbc-local-news-partnership.html, 09 12 2018.
June 24, 2020 24/2546. Windsor G, Arnaboldi A, http://www.nesta.org.uk/blog/
network-analysis-top-eu-referendum-tweeters, 08 08 2016.
47. Wrenn N, Cox-Brooker S, https://www.facebook.com/facebookmedia/blog/
facebook-launches-community-news-project-in-the-uk, 19 11 2018.
June 24, 2020 25/25You can also read