You Are What You Tweet: Analyzing Twitter for Public Health
←
→
Page content transcription
If your browser does not render page correctly, please read the page content below
You Are What You Tweet: Analyzing Twitter for Public Health

                                              Michael J. Paul and Mark Dredze
                                         Human Language Technology Center of Excellence
                                           Center for Language and Speech Processing
                                                    Johns Hopkins University
                                                      Baltimore, MD 21218
                                             {mpaul,mdredze}@cs.jhu.edu

                            Abstract                                  Twitter users often publicly express personal information;
     Analyzing user messages in social media can mea-              messages like “I gots da flu” and “sick with this flu it’s taking
     sure different population characteristics, including pub-     over my body ughhhh” are common. Knowing that a specific
     lic health measures. For example, recent work has cor-        user has the flu may not be interesting, but millions of such
     related Twitter messages with influenza rates in the          messages can be revealing, such as tracking the influenza
     United States; but this has largely been the extent of        rate in the United Kingdom and United States (Lampos and
     mining Twitter for public health. In this work, we            Cristianini 2010; Culotta 2010b). While many studies have
     consider a broader range of public health applications        analyzed influenza rates and tracking in Twitter, these have
     for Twitter. We apply the recently introduced Ailment         largely been the limits of mining public health information
     Topic Aspect Model to over one and a half million             from Twitter.
     health related tweets and discover mentions of over
     a dozen ailments, including allergies, obesity and in-
     somnia. We introduce extensions to incorporate prior             We believe Twitter can have a greater impact on public
     knowledge into this model and apply it to several tasks:      health informatics than just influenza tracking. A cursory
     tracking illnesses over times (syndromic surveillance),       examination of health related tweets reveals more detailed
     measuring behavioral risk factors, localizing illnesses       information: the message “Had to pop a Benadryl....allergies
     by geographic region, and analyzing symptoms and              are the worst....ughh” indicates a user suffering from aller-
     medication usage. We show quantitative correlations           gies and treating with Benadryl. “my g-ma is so cute when
     with public health data and qualitative evaluations of        she’s all doped up on Vicadin (sic.) for her foot” indicates
     model output. Our results suggest that Twitter has broad
     applicability for public health research.
                                                                   Vicodin as a treatment for foot pain. Furthermore, tweets
                                                                   are not isolated events: they occur with specific times, lo-
                                                                   cations, languages and users. Aggregating over millions of
                        Introduction                               users could provide new tools for public health research.
Twitter, Facebook and other social media encourage fre-
quent user expressions of their thoughts, opinions and ran-           This paper asks: what public health information can be
dom details of their lives. Tweets and status updates range        learned from Twitter? While previous studies focused on
from important events to inane comments. Most messages             specific questions (influenza rates) with specific models
contain little informational value but the aggregation of mil-     (keyword or statistical classifier for flu tweets), we ask an
lions of messages can generate important knowledge. Sev-           open question with a general model: the newly introduced
eral Twitter studies have demonstrated that aggregating mil-       Ailment Topic Aspect Model (ATAM) (Paul and Dredze
lions of messages can provide valuable insights into a pop-        2011). Previous work introduced ATAM, created a data set
ulation. Barbosa and Feng (2010) classified tweets by sen-         and replicated influenza tracking results. This work im-
timent, a first step towards measuring public opinion, such        proves the model using prior knowledge, and reports results
as political sentiment, which has been shown to track public       for several new applications: geographic syndromic surveil-
political opinion and predict election results (Tumasjan et        lance for multiple ailments (tracking illness over time and
al. 2010; O’Connor et al. 2010). Eisenstein et al. (2010)          location), correlating behavioral risk factors with ailments,
studied lexical variations across geographic areas directly        and analyzing correlations of symptoms and treatments with
from tweets. Others have monitored the spread of news (Ler-        ailments. Our results include quantitative correlations with
man and Ghosh 2010), detected the first mention of news            government data as well as qualitative evaluations of model
events (Petrović, Osborne, and Lavrenko 2010), and moni-          output. To the best of our knowledge, this is the first work to
tored earthquakes (Sakaki, Okazaki, and Matsuo 2010).              use social media sources for a broad range of public health
Copyright c 2011, Association for the Advancement of Artificial    informatics on a range of ailments, rather than a narrow set
Intelligence (www.aaai.org). All rights reserved.                  of applications on one or two ailments.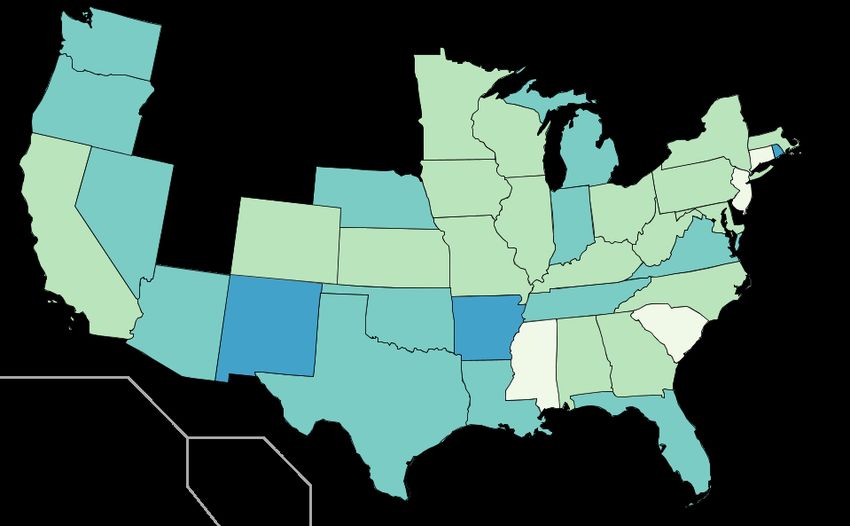
Public Health Informatics and the Web                        incorporate outside information. We first summarize previ-
Syndromic surveillance, the monitoring of clinical syn-           ous work on ATAM and then discuss our modifications.
dromes that have significant impact on public health, im-
pacts medical resource allocation, health policy and educa-       Ailment Topic Aspect Model
tion. Many common diseases are continuously monitored by          Probabilistic topic models, such as latent Dirichlet alloca-
collecting data from health care facilities, a process known      tion (LDA) (Blei, Ng, and Jordan 2003), associate word to-
as sentinel surveillance. Resources limit surveillance, most      kens with latent topics. Documents are distributions over
especially for real time feedback. For this reason, the Web       topics, and topics are distributions over words, oftentimes
has become a source of syndromic surveillance, operating          forming a semantically coherent word set. ATAM, which
on a wider scale for a fraction of the cost. Google Flu Trends    models how users express their illnesses and ailments in
(Ginsberg et al. 2008) tracks the rate of influenza using         tweets, builds on the notion of topics. It assumes that for
query logs on a daily basis, up to 7 to 10 days faster than the   each health related tweet – we discuss how these are iden-
Center for Disease Control and Prevention’s (CDC) FluView         tified below – reflects a latent ailment a, such as flu, aller-
(Carneiro and Mylonakis 2009). High correlations exist be-        gies, or cancer. Similar to a topic, an ailment a indexes a
tween Google queries and other diseases (Pelat et al. 2009),      distribution over words φa . Additionally, an ailment main-
including “Lyme disease” (Seifter et al. 2010). These results     tains a distribution over symptoms and treatments, similar
fall under the area of infodemiology (Eysenbach 2009).            to the Topic Aspect Model (TAM) (Paul and Girju 2010).
   Similar results exist for Twitter, which can be a compli-      The latent variable y ∈ {0, 1, 2} determines which aspect
mentary resource to query logs, but may also contain freely       (general, symptom, treatment) generates each word. We fol-
available and more detailed information; people write de-         low Paul and Dredze (2011) and use a list of keyphrases
tailed messages for others to read. Lampos and Cristian-          to automatically identify possible symptoms and treatments
ini (2010) and Culotta (2010b) correlated tweets men-             (i.e. y is observed).1 In addition to ailments, ATAM includes
tioning the flu and related symptoms with historical data.        a more traditional topic model component – a topic z as a
Similarly, Quincey and Kostkova (2010) collected tweets           distribution over words and a document specific distribution
during the H1N1 pandemic for analysis. Ritterman, Os-             θ over topics drawn from a Dirichlet distribution – since
borne, and Klein (2009) combined prediction markets and           even in tweets about health topics, users also describe ac-
Twitter to predict H1N1. More generally, Chew and Eysen-          tions unrelated to this symptom-treatment structure, such as
bach (2010) evaluated Twitter as a means to monitor public        “sick today so playing video games.” These topic distribu-
perception of the 2009 H1N1 pandemic. Scanfeld, Scan-             tions account for “playing video games.” A switch variable
feld, and Larson (2010) evaluated the public understanding        x ∈ {0, 1} (Binomialy distributed and parameterized by π)
of antibiotics by manually reviewing Tweets that showed in-       determines if a word is generated from an ailment dependent
correct antibiotic use, e.g., using antibiotics for the flu.      distribution φa,y or a non-ailment topic z. This idea is sim-
   The public health community is also considering how so-        ilar to the Twitter conversation+topic model (Ritter, Cherry,
cial media can be used to spread health information, with         and Dolan 2010), where words in a tweet can depend either
applications including risk communication and emergency           on a LDA-style topic model or a message-specific conversa-
response. Vance, Howe, and Dellavalle (2009) analyzed             tion act, though the model structure is different.
the pros and cons of using social media to spread public              A Gibbs sampling algorithm learns ATAM’s parameters.
health information in young adults. Pros include low cost         The collapsed Gibbs sampler marginalizes out the multino-
and rapid transmission, while cons included blind author-         mials, requiring sampling for the variables a, z, x and ` from
ship, lack of source citation, and presentation of opinion as     a distribution conditioned on the current values of all other
fact. Greene et al. (2010) studied how medical information        variables. Details are beyond the scope of this summary.
is exchanged on Facebook, where groups specific to diseases       The topic Dirichlet hyper-parameter is optimized and other
share information, support, and engage patients in their dis-     hyper-parameters are set manually. We used 8000 sampling
eases. Fernandez-Luque, Karlsen, and Bonander (2011) re-          iterations with Z = 15 and A = 20.
viewed different approaches for extracting information from
social web applications to personalize health care informa-       Model Extension: Incorporating Prior Knowledge
tion. The model we use in this paper could be used to ana-        As with topic models, there is little control over what ail-
lyze tweets for health care personalization. Finally, the com-    ments ATAM discovers. While ATAM discovers meaning-
munity is considering the larger impact of how social me-         ful ailments, there are numerous public health resources that
dia can impact health care, where patients can “friend” doc-      could be used to improve model output. We use prior knowl-
tors and constantly share information among thousands of          edge in the form of articles written about diseases, each an
friends (Hawn 2009; Jain 2009).                                   example of words associated with an ailment. We selected
                                                                  20 disease articles likely to appear in Twitter data.2
          A Model for Diseases in Twitter                            1
                                                                      Lists are from the medical website wrongdiagnosis.com.
We apply the Ailment Topic Aspect Model (ATAM) (Paul                 2
                                                                      From WebMD.com: Allergies, anxiety, asthma, back pain,
and Dredze 2011) to created structured disease information        breast cancer, COPD, depression, diabetes, ear infection, eye
from tweets that we use for public health metrics. To im-         health, flu, foot injuries, heartburn, irritable bowel syndrome, mi-
prove the quality of these metrics, we modify the model to        graine, obesity, oral health, skin health, sleep disorders.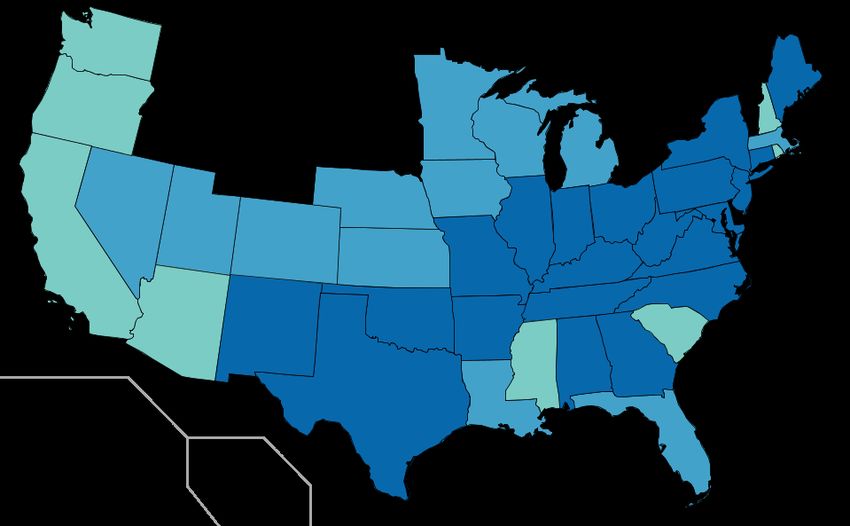
We paired each article with an ATAM ailment and placed        ailments (all coherent) and no cluster was identified by both
a prior distribution over the ailment’s words based on the       annotators as incoherent. Examples of seven of the fifteen
article. Following the LDA framework, the priors over our        ATAM+ ailments with annotator labels appear in Figure 1.
multinomial word distributions are defined by the Dirich-        The remaining ailments were respiratory illness, common
let distribution – the multinomials associated with each ail-    cold, infections, physical injuries, headaches, exercise, skin
ment are sampled from a different Dirichlet. The Dirichlet       problems and insomnia. To improve interpretability of this
distribution can be defined with two parameters, a mean m,       table, we include longer phrases in addition to single words.
which can be thought of as the most likely multinomial to be     For each contiguous sequence of tokens in a tweet assigned
drawn from this Dirichlet, and a precision s, which controls     to the same ailment distribution, we extracted a single phrase
how much a sample multinomial vector can deviate from the        and included it in the ailment distributions. Several high fre-
mean – the lower the precision, the less influence the prior     quency phrases appear in the top of the ailment distributions.
has over the inferred posterior. We set the mean ma as the          The discovered ailments qualitatively match their
distribution over words in the articles for the ailment a. We    WebMD priors (first row of Figure 1), but the discovered
optimize s to maximize data likelihood using the fixed-point     ailments clusters often are more general. For example, the
iteration derived by Minka (2003) to update the precision        ailment with a “foot injuries” prior produced a general in-
given a fixed mean. The definition of the mean and the up-       juries ailment; “knee”, “shoulder”, and “arm” were top gen-
date rule for the precision are:                                 eral words, “crutches” and “physical therapy” were top treat-
                                 cw + λ                          ments. Likewise, the “breast cancer” prior resulted in gen-
                      ma,w = ∗ a                           (1)   eral cancer; while “breast cancer” is the most frequent symp-
                               ca + λW
                                                                 tom, stomach, lung, and skin cancer all appear as top 10
                 ma,w Ψ(nw
            P
                             + sa ma,w ) − ma,w Ψ(sa ma,w )      symptom phrases. Additionally, we observe some confu-
  new
sa = sa w               Pa        ∗
                          w Ψ(na + sa ) − Ψ(sa )
                                                                 sions in the output between ailments with similar treatments
                                                           (2)   or symptoms. For example, the “cancer” ailment also in-
 The mean ma,w is a fixed constant, where cw     a  represents   cludes symptom phrases of “pneumonia” and “heart attack”,
the count of word w in the article about ailment a. We use       and “heart surgery” is the top treatment phrase. These are all
add-λ smoothing (with a small factor λ = 0.01) to ensure         serious illnesses that appear within similar contexts (words
non-zero values for all words. The precision sa is updated       like “pray” and “recovery”) which caused the model to clus-
throughout the sampling process. We use a Gibbs EM pro-          ter them together. In general, this problem occurred more
cedure in which we perform 10 iterations of sampling with        without the prior knowledge used in ATAM+. For example,
fixed Dirichlet parameters, then following Eq. (2) we update     allergies would appear with the “skin problems” ailment in
s based on the current state of the sampler, where nw a is the   ATAM, but ATAM+ kept allergic reactions (e.g. hives and
count of word w assigned to ailment distribution a. We ran       rashes) separate from seasonal allergies.
this model with Z = 20 and A = 20 using the same hyper-
parameters as in the unsupervised setting. We call this new      Comparison to Public Health Articles
model ATAM+.                                                     To evaluate the output interpretability, we compare the
                                                                 ailment distributions with distributions estimated from
                       Evaluation                                WebMD articles – the same 20 articles used as priors. To
We begin with a description of data and a more traditional       separately evaluate the symptom and treatment distributions,
evaluation of model output. We start with a collection of over   we filtered each article for symptoms and treatments using
2 billion tweets collected from May 2009 to October 2010         the keyphrase lists, then built ailment specific uni-gram lan-
(O’Connor et al. 2010), from which we select health related      guage models. We then evaluate how well our ailment clus-
tweets for ATAM training. Culotta (2010a) found simple           ters match the WebMD articles by using these distributions
keyword matching insufficient for filtering tweets (e.g., “I’m   to align the ATAM and ATAM+ ailments with the articles.
sick of this” and “justin beber ur so cool and i have beber         Each article was paired with its corresponding ailment
fever”). Paul and Dredze (2011) use 5,128 labeled mes-           in the model output, as labeled by the annotators – these
sages to train a high precision SVM binary classifier (0.90)     pairings serve as our gold standard alignments – though not
to identify health related messages, which produced a cor-       all articles had a corresponding ailment and vice versa. The
pus of 1.63 million English tweets. We removed punctua-          Jenson-Shannon (JS) divergence was computed between the
tion, stop words, URLs and hashtags. ATAM (fully unsuper-        distributions for each ailment and the distributions for each
vised) and ATAM+ (using WebMD articles as prior knowl-           WebMD disease. To account for ailments that contained very
edge) were trained over these health messages.                   common symptoms and treatments, we measure the standard
   Ailment output was annotated by two people not involved       score: x−x̄
                                                                           σ of the JS divergence, where x̄ and σ are the mean
in running the models or aware of the WebMD articles. Each       and standard deviation of the divergence. This score was
person labeled the 20 ailments with disease names of their       then used to define a ranking of articles for ailments, and
own choosing or as incoherent based on the top 20 words          ailments for articles. Ranking quality was measured as the
for the general, symptom, and treatment distributions. For       percentage of articles/ailments such that the highest-ranked
the 20 ailments, annotators agreed on labels for 17 ATAM         alignment was the correct alignment, as well as with mean
                                                                                                              1
ailments (of which 4 were incoherent). ATAM+ produced            reciprocal rank (MRR), i.e. the mean of rank    , where rank is
more clear and coherent ailments; annotators agreed on 15        the position of the correct article/ailment in the list. Results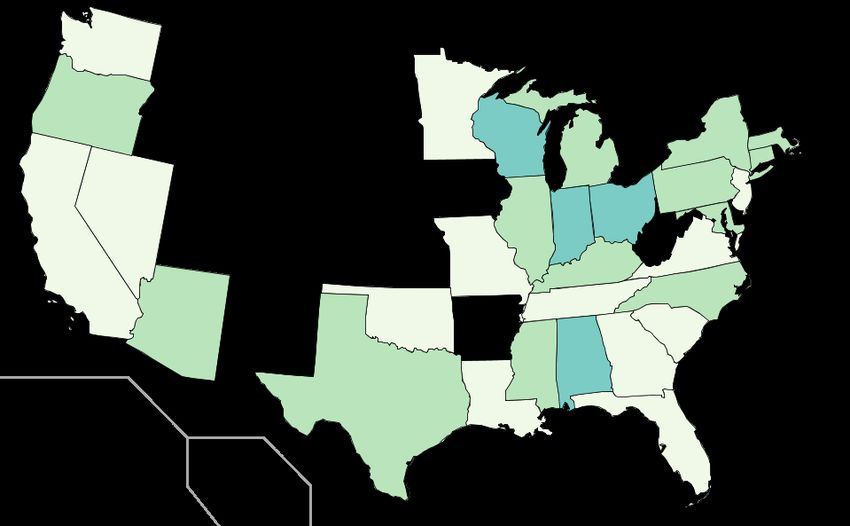
Ailment Allergies Depression Aches/Pains Cancer Obesity Flu Dental
Prior Allergies Anxiety Back Pain Breast Cancer Diabetes Flu Oral Health
Frequency 6.4% 5.8% 10.8% 8.0% 2.3% 8.1% 4.6%
General Words allergies help body cancer blood flu meds
stop dont head pray doctor “swine flu” killers
eyes body need mom high “flu shot” dentist
allergic depression hurts shes meds dont teeth
Symptoms sneezing pain pain pain pressure fever pain
cold anxiety aches sad “high blood cold toothache
coughing stomach stomach “breast cancer” pressure” “sore throat” sore
Treatments medicine surgery massage surgery hospital hospital braces
benadryl treatment “hot bath” hospital diet vaccine surgery
claritin plastic ibuprofen “heart surgery” exercise medicine antibiotics
Figure 1: Seven ailments discovered by ATAM+ represented by their most likely words, symptoms, treatments and the label
independently assigned by two annotators. We also include the disease article used as a prior, and the discovered frequency of
the ailment p(a) in the 1.63 million tweets. Phrased extracted from the output are also shown.
Model Total Correct MRR Correct MRR
(S) (S) (T) (T) 0.7 35
% Specimens Positive for Influenza
Discovered Ailments to Articles
Twitter
ATAM
ATAM+
12
13
2
3
0.33
0.42
4
6
0.51
0.63
0.6 CDC 30
Articles to Discovered Ailments 25
P(Flu | Week)
ATAM 12 0 0.23 0 0.36 0.5
ATAM+ 13 1 0.32 5 0.54 20
0.4
15
Table 1: Results for aligning WebMD articles with discov- 0.3
10
∝
ered ailments using symptom (S) and treatment (T) models.
Correct indicates the number of ailments with the correct an- 0.2 5
swer at rank 1. Higher MRR means better matches between
the articles and the discovered ailments. 0.1 0
12 9
1/0 9
2/1 0
0
0
/09
0
0
10 9
0
0
0
/0
/0
6/1
7/1
6/1
0/1
0/1
/0
4/1
8/1
1/1
/28
/02
9
3
(Table 1) show that ATAM+ outperforms ATAM, showing
3/1
5/2
8/1
6/3
9/2
8/0
9/0
4/2
that the priors produced more coherent ailments. We also Week
find that treatments are more consistent than symptoms, not
an unexpected result given the commonality of symptoms
for many of the ailments. Figure 2: Influenza rate from August 2009 to October 2010
as measured by CDC FluView (measured as percentage of
What Can be Learned from Twitter? specimen’s that tested positive for influenza) and ATAM+’s
“flu” ailment (the normalized probability of the “flu” ailment
Given our evaluations suggesting that Twitter contains valu- given the week): correlation coefficient of 0.958.
able information, we wonder: what public health informa-
tion can be learned from Twitter? Using ATAM+, we explore the United States measured by the CDC, which collects and
several aspects of public health, including temporal and ge- publishes detailed weekly statistics under FluView.4 Results
ographic impacts on medical wellbeing, and investigations with ATAM+ (Figure 2) yielded a Pearson correlation co-
into how the public treats illness. efficient of 0.958; ATAM obtained a correlation of 0.934.
For comparison, we measured the correlation by normal-
Syndromic Surveillance izing using just the health related tweets, which considers
Public health data mining from Twitter has concentrated the percentage of health related messages that discuss the
on syndromic surveillance, which tracks trends in medi- flu. ATAM+ had a correlation of 0.966; ATAM had 0.881.
cal conditions over time. Tracking influenza infections are For comparison, these numbers are in the range of the 0.95
especially conducive to syndromic surveillance since they of Culotta (2010a) and the 0.97 of Lampos and Cristian-
are episodic and widespread. ATAM+ discovers many ail- ini (2010)5 . However, an important difference is that these
ments, one of which is “flu.” We measured the correla- systems are trained to fit government data using regression,
tion between the probability of the flu ailment for each
4
week (using the total tweets for that week) between mid- http://www.cdc.gov/flu/weekly/
August 2009 to October 20103 with the influenza rate in 5
The former considers an unknown number of tweets from
September 2009 to May 2010; the latter considers approximately
3
Earlier time periods contained gaps in the data. 26 million UK-based messages from the second half of 2009.and were designed specifically to find flu tweets. In con- Correlation
trast, our approach discovers many ailments without labeled Risk Factor Ailments ATAM+ ATAM
tweets, of which one is “flu”. Asthma Allergies 0.241 0.195
Diabetes Obesity 0.073 0.203
Finally, since Google Flu Trends (Ginsberg et al. 2008) Exercise All ailments -0.352 -0.394
tracks the rate of influenza using query logs, we compare our Exercise Exercise 0.140 –
Twitter rates directly with their reported rates. We obtained Exercise Obesity -0.201 -0.248
the Google Flu Trends data6 for each week in the same time Health Care Coverage All ailments -0.253 -0.319
period and measured the correlation with our Twitter rates. Heart attack Obesity 0.244 0.341
When normalizing by all tweets, ATAM+ obtains 0.968 and Heart attack Cancer 0.613 0.291
ATAM 0.935. Normalizing by only health related tweets Obesity Obesity 0.280 0.203
yields 0.974 for ATAM+ and 0.872 for ATAM. Obesity Exercise -0.267 –
Tobacco use Cancer 0.648 0.320
Geographic Behavioral Risk Factors
Most work on automated syndromic surveillance focuses Table 2: Correlations between the rate of a behavioral risk
on national health trends. However, syndromic surveillance, factor in a US state using CDC data with the measured rate
which often focuses on seasonal diseases, is only one of a of an ATAM ailment in that state. For example, states with
myriad of measures used to track population wellbeing, like higher obesity rates had more obesity tweets, and states with
tracking behavioral risk factors, such as the rate of cancer higher smoking rates had more cancer tweets. Note: ATAM+
or obesity. Sentinel surveillance collects health statistics for discovered an exercise ailment; ATAM did not.
chronic diseases or risk factors, often based on geography.
people who have had heart attacks since some heart-related
We investigated extracting geographically linked health ailments were grouped into the cancer cluster. Other inter-
statistics from Twitter. For example: are users in some geo- esting correlations include a significant negative correlation
graphic areas more likely to exercise than others? We formu- between exercise and the frequency of posting any ailments,
lated a list of questions based on the behavioral risk factor suggesting that Twitter users are less likely to become sick
surveillance system, run by the National Center for Chronic in states where people exercise. Similarly, there is a nega-
Disease Prevention and Health Promotion at the CDC. For tive correlation between the rate of health care coverage in a
each statistic that could potentially be measured with one or state and the likelihood of posting tweets about diseases.
more ATAM ailments, we measured the Pearson correlation
coefficient between the ailments discovered in each US state
Geographic Syndromic Surveillance
with the state’s risk factor rate. For example, we measured
reported responses to the question “During the past month, So far we have demonstrated the ability to mine public
did you participate in any physical activities?” with the exer- health information both over time (syndromic surveillance
cise ailment for each state. This data was collected through for influenza) and by geographic region (behavioral risk fac-
phone interviews of over 350,000 US adults in 2009.7 tors.) We now seek to combine these to track an ailment over
We assigned a US state to each tweet according to user time and geography. For this experiment, we select seasonal
location by extracting this information from the location allergies, an ailment that is correlated both with time and lo-
field, part of a user’s profile. We searched each location field cation; allergy season ranges over different dates by region.
for the name of a state (California, Wisconsin, etc.), or a We computed the (normalized) rate of the allergy ailment
state abbreviation (CA, WI). The abbreviation had to be ei- by state and by month and plotted four months: February,
ther uppercase, or appear in the format “——, ca”. These April, June, and August (Figure 3). Shading was computed
strict rules reduced the number of false positives.8 We ex- from the mean and standard deviation of all the states’ al-
tracted location information from 12% of the health related lergy rates (over the three months) so that the color scale
tweets (196,000 tweets). We computed the number of each (ranging from lighter to darker) indicates rates that were
ailment occurrences per capita: occurrences divided by the more than a standard deviation below, half a standard devia-
total number of tweets per state. tion below, within half a standard deviation, more than half a
Table 2 shows the correlations between each risk factor standard deviation above, and more than a full standard de-
and the related ailments measured for each state that had viation above the mean. States with less than 50 tweets in a
at least 500 tweets (42 states in total.) The strongest corre- month were excluded (shaded diagonally.) We also show the
lation was for tobacco use (proportion of residents in each top 10 words w most predictive of the allergy ailment a and
state who are smokers) with the cancer ailment. The cancer a given month m, ranked according to p(a, m|w).
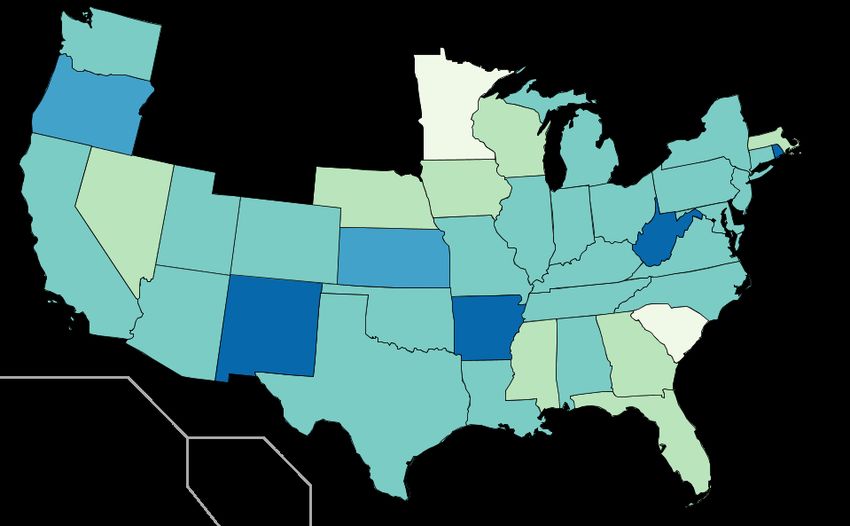
ailment also had a high correlation with the percentage of We observe several known patterns of allergies.9 The pri-
mary allergy season begins in February or March and runs
6
Data Source: Google Flu Trends (www.google.org/flutrends) through May or June, beginning earliest in the South and the
7 West. Observe that these areas have higher rates than the rest
http://apps.nccd.cdc.gov/gisbrfss/
8 of the nation in February, while high rates have appeared in
Many self-reported locations are nonsensical (e.x.: “Fight-
ing Dragons” or “under ur bed”) (Hong 2011), but strict patterns
9
seemed to produce good matches. Twitter provides geocodes, but Seasonal allergy information is taken from the WedMB article
this relatively new feature was missing from much of our data. In on allergies and geography: http://www.webmd.com/allergies/
the future as geocodes increase, we can use them instead. allergy-relief-10/worst-allergy-cities.watery pollen
helsinki zyrtec
mold claritin
watering spring
faucet watering
lolss trees
sneezes watery
sneezy itching
teary bloom
bloom grass
(a) February (b) April
hayfever dust
grass catherine
watering pinche
watery buildings
claritin mold
humidity hadd
zyrtec gato
bonkers cessation
mold meditating
antihistamines ragweed
(c) June (d) August
Figure 3: Rates of allergies discovered by ATAM+ by state for four months in 2010. Darker shading indicates higher allergy
rates; diagonal shaded states lacked sufficient data. Notice that allergy rates peak in the middle of the allergy season (April),
and that in colder weather (February) they are more prominent in warmer climates (West and South). Next to each month are
the top 10 words w most predictive of the allergy ailment a during the month m (p(a, m|w)). Bolded words are those especially
recognized as being associated with particular allergy seasons, e.g. ragweed begins to pollinate in mid-August, tree pollen
season is in full effect in April, and June is often the worst month for hay fever (http://www.gsk.com/infocus/hay-fever.htm).
the rest of the country by April, the peak of the season. The Word Ent. Most Common Ailments
primary allergen in the spring is tree pollen, indicated by vomiting 2.19 Flu (23%), Aches (16%), Insomnia (12%)
the presence of “pollen” and “trees” in April. Grass aller- burn 2.02 Skin (36%), Aches (17%), Headache (2%)
chill 1.95 Headache (28%), Insomnia (18%), Flu (12%)
gies peak in May and June; observe that “grass” is one of fever 1.46 Flu (50%), Cold (24%), Infection (11%)
the top words in June. Weed season begins in August, the pimples 0.72 Skin (84%), Depression (5%)
main contributor of which is ragweed, which is known to be fractured 0.69 Physical injuries (82%), Cancer (12%)
especially prevalent in the Midwest. Notice that “ragweed” toothache 0.61 Dental (83%), Insomnia (9%), Aches (6%)
is associated with August, and that many Midwestern states headache 0.56 Headache (75%), Insomnia (25%)
have the highest rate during this month. tumor 0.22 Cancer (96%)
mood 0.20 Depression (96%), Obesity (4%)
We seek quantitative validation of trends by time and lo-
cation. Returning to the task of influenza tracking, the CDC
provides infection rates by state.10 We compute the influenza Table 3: Common symptom words, their most commonly
rates using the flu ailment as before, but now compute sep- associated ailments, and the entropy of their distribution
arate rates for each state. We measured the rates for the over ailments. Entropy values ranged from 0 to 2.47.
2009-2010 influenza season (12 months from September).
The CDC data uses a numeric value (integer between 1 Analyzing Symptoms and Medications
and 10) indicating the level of flu activity for each week Discovered ailments include both milder, acute illness (in-
in each state. We ignored state/week pairs where the total fluenza, allergies, etc.) as well as more common chronic con-
number of tweets was less than 50, reducing the number of ditions (obesity and insomnia). For many of these ailments,
data points to 39% of the total, yielding 1057 data points. sufferers often do not visit their doctor, instead managing
ATAM+ obtained a correlation of 0.66, and ATAM yielded the illness on their own. Flu patients often stay home, take
0.23. These correlations demonstrate the feasibility of syn- medication and eat soup. Obese people put themselves on a
dromic surveillance within specific geographic regions. diet and exercise regimen. Insomnia suffers resort to chang-
ing their sleeping environment or sleeping aids. Since people
are not seeing health care providers, their illness, symptoms
10
http://gis.cdc.gov/grasp/fluview/main.html and chosen treatments go unreported. Obtaining these statis-Word # Ent. Most Common Ailments we found “penicillin” (entropy 1.64) most commonly ap-
Pain Relief Medication pearing with infections (45%) and “acupuncture” (entropy
tylenol 1807 1.57 HA (39%), IN (30%), Cold (9%) 1.45) most commonly appearing with depression (36%) and
ibuprofen 1125 1.54 HA (37%), DN (21%), Aches (17%) physical injuries (33%). Finally, similar to Scanfeld, Scan-
advil 1093 1.08 HA (61%), Cold (6%), DN (5%)
feld, and Larson (2010), we found that while the most com-
aspirin 885 1.04 HA (69%), IN (10%), Aches (10%)
vicodin 505 1.33 DN (61%), Injuries (11%), HA (10%) mon usage of antibiotics was correctly for infection (68%)
codeine 406 1.94 Cold (25%), DN (19%), HA (17%) and dental (9%) (patients whose wisdom teeth are removed
morphine 206 1.17 DN (59%), Infection (22%), Aches (9%) often receive antibiotics to prevent infection), there were in-
aleve 183 1.10 HA (62%), IN (15%), DN (14%) correct uses as well: common cold (9%) and flu (3%). These
Allergy Medication findings largely confirm the known properties and intended
benadryl 871 1.24 Allergies (64%), Skin (13%), IN (12%) usages of common medications.
claritin 417 0.54 Allergies (88%), HA (5%)
zyrtec 386 0.49 Allergies (90%)
sudafed 298 1.61 Allergies (39%), Cold (21%), HA (20%) The Limits of Twitter
We have investigated a variety of public health data that can
Table 4: Treatment words (medications) for pain relief and be automatically extracted from Twitter. These results sug-
allergies sorted by frequency (#), their most commonly as- gest that public health officials and researchers can both re-
sociated ailments, and the entropy of their distribution over place current more expensive and time consuming methods
ailments. Entropy values ranged from 0.02 to 2.26. Com- and expand the range of what can be easily measured, in-
mon ailments discovered for pain relief medications are cluding both new sources and types of information. How-
headaches (HA), insomnia (IN) and dental (DN). ever, Twitter cannot provide all answers, and it may not be
reliable for certain types of information. We describe some
tics requires extensive polling of a large population. Twitter of the limitations we encountered in this study.
provides an opportunity to quickly and easily measure these We focused on population level metrics, but we had
statistics. Scanfeld, Scanfeld, and Larson (2010) consider wanted to consider analyses on the scale of individual users.
one such application, in which they studied how people used For example, how often does an allergy sufferer have se-
antibiotics by examining tweets. rious allergy problems? What is the recurrence rate of the
For each symptom and treatment w that appeared more flu? Are certain people more likely to have repeated phys-
than 50 times in the health related messages, a total of 413 ical injuries? Are various ailments correlated with differ-
symptoms and 113 treatments, we computed the distribution ent lifestyles? Additionally, we sought to compute statistics
over ailments using ATAM+: P (a|w). Low entropy treat- about the course of acute illnesses. How long do influenza
ments indicate specialized use, such as “sunscreen” (treat- symptoms last? Which medications have the largest impact
ment) and “pancreatic” (symptom). High entropy indicates on symptoms? All of these statistics require that a single
common use, such as “medicine” (treatment) and “painful” user post multiple tweets, and possibly multiple updates over
(symptom). We provide two sets of results based on this the course of an illness. However, in our health related mes-
data. Common symptoms, their entropy, and most common sages, 71% of users have only a single tweet and 97% have
associated ailments appear in Table 3. These distributions 5 or less, insufficient for computing user level statistics.
correspond to common knowledge about symptoms: fevers Our geographic analysis was fairly coarse, providing
are associated with the flu, the common cold and infections, statistics on the state level. More sophisticated geocoding
and toothaches are linked to dental problems, insomnia, and techniques could provide finer grained location informa-
aches. Other terms showed interesting correlations, such as tion, allowing for the detailed analysis as in Eisenstein et
“pimples” and depression, and “mood” (as in bad mood or al. (2010). However, we had too few tweets to consider finer
mood swings) with obesity. grained statistics, e.g. on the county level. We failed to ob-
To evaluate treatments, we selected two common groups tain even sufficient messages for each state. Additionally,
of medications: pain relief and allergy medication. We com- we observed that some tweets, particularly those about more
pare several common medications within these groups in serious illnesses like cancer, were in regards to family mem-
Table 4. The most common ailment for the pain reliev- bers rather than the user. This could throw off geographic
ers is headaches. The three strongest medications, codeine, statistics if the subject of a tweet lives in a different loca-
morphine and vicodin, are all used for more serious ail- tion than the author of the tweet. This issue could perhaps
ments, including dental problems and infections. Tylenol be solved by filtering out tweets that are not about the user,
(acetaminophen) is perhaps the most popular pain reliever for example by using a classifier that is trained for this task.
on the market, and is the most commonly mentioned pain The expression “more data is better data” holds here as
reliever. Additionally, ibuprofen is used to treat aches as it well. Our best results were obtained for influenza tracking
is an anti-inflammatory. The allergy medications are all pri- (high correlation with CDC data) which represented 8% of
marily used to treat allergies. Benadryl is a more generic the 1.63 million tweets. The above limitations are all inher-
cold/allergy medication that causes drowsiness, thus it is ently data limitations, so more data suggests that some of
used for insomnia in addition to allergies. Similarly, Sudafed these goals may be achievable. The initial data set contained
is marketed for sinus headaches, so it appears with the com- 2 billion tweets, which ranged from 1 millions message a
mon cold and headaches. As other examples of treatments, day (mid 2009) to close to 6 million messages a day (late2010.) While 2 billion is a seemingly massive number, it rep- Fernandez-Luque, L.; Karlsen, R.; and Bonander, J. 2011. Review
resents a fraction of the total messages available. Twitter re- of extracting information from the social web for health personal-
ports that users now generate 50 million messages per day.11 ization. Journal of Medical Internet Research 13(1).
Perhaps access to this quantity of data will enable many of Ginsberg, J.; Mohebbi, M.; Patel, R.; Brammer, L.; Smolinski, M.;
these statistics. Furthermore, the usage of mobile devices and Brilliant, L. 2008. Detecting influenza epidemics using search
and geotagging messages has greatly increased, suggesting engine query data. Nature 457(7232):1012–1014.
that more detailed geographical analyses are possible. Greene, J.; Choudhry, N.; Kilabuk, E.; and Shrank, W. 2010. On-
Finally, Twitter user demographics will limit research. line social networking by patients with diabetes: A qualitative eval-
Twitter users tend to be younger (nearly half are under 35) uation of communication with facebook. Journal of General Inter-
and only 2% are 65 or older.12 Twitter is still US centric: as nal Medicine 1–6. 10.1007/s11606-010-1526-3.
of June 2009, 62% of Twitter users were in the US.13 These Hawn, C. 2009. Take Two Aspirin And Tweet Me In The Morning:
impose limitations on mining health information about se- How Twitter, Facebook, And Other Social Media Are Reshaping
nior citizens, or other countries. However, increasing Twit- Health Care. Health Affairs 28(2):361–368.
ter usage may yield sufficient data. Future work will clarify Hong, L. 2011. Tweets from justin bieber’s heart: the dynamics of
what are true limits of this research direction. the “location” field in user profiles. In CHI.
Jain, S. H. 2009. Practicing medicine in the age of facebook. New
Future Directions England Journal of Medicine 361(7):649–651.
Our exploratory study of using Twitter to mine public health Lampos, V., and Cristianini, N. 2010. Tracking the flu pandemic
by monitoring the social web. In IAPR 2nd Workshop on Cognitive
information focused on producing data that correlates with Information Processing (CIP 2010).
public health metrics and knowledge. Twitter clearly con-
Lerman, K., and Ghosh, R. 2010. Information contagion: an empir-
tains many different types of information of value to public
ical study of the spread of news on digg and twitter social networks.
health research on many different ailments. The next step is CoRR abs/1003.2664.
to consider what new information can be learned by study-
Minka, T. 2003. Estimating a Dirichlet distribution.
ing Twitter, potentially supporting new health informatics
hypotheses. We plan to consider more specific applications O’Connor, B.; Balasubramanyan, R.; Routledge, B. R.; and Smith,
with the goal of learning new things from Twitter. N. A. 2010. From Tweets to Polls: Linking Text Sentiment to
Public Opinion Time Series. In ICWSM.
Acknowledgements Paul, M., and Dredze, M. 2011. A model for mining public health
topics from twitter. Technical report, Johns Hopkins University.
We thank Adam Teichert for annotation assistance, and the Paul, M., and Girju, R. 2010. A two-dimensional topic-aspect
anonymous reviewers for their feedback. The first author is model for discovering multi-faceted topics. In AAAI.
supported by a NSF Graduate Research Fellowship.
Pelat, C.; Turbelin, C.; Bar-Hen, A.; Flahault, A.; and Valleron, A.-
J. 2009. More diseases tracked by using google trends. Emerg
References Infect Dis 15(8):1327–1328.
Barbosa, L., and Feng, J. 2010. Robust sentiment detection on Petrović, S.; Osborne, M.; and Lavrenko, V. 2010. Streaming first
twitter from biased and noisy data. In COLING. story detection with application to twitter. In NAACL.
Blei, D.; Ng, A.; and Jordan, M. 2003. Latent dirichlet allocation. Quincey, E., and Kostkova, P. 2010. Early warning and outbreak
Journal of Machine Learning Research (JMLR) 3. detection using social networking websites: The potential of twit-
Carneiro, H., and Mylonakis, E. 2009. Google trends: a web-based ter. In Electronic Healthcare. Springer Berlin Heidelberg.
tool for real-time surveillance of disease outbreaks. Clin Infect Dis Ritter, A.; Cherry, C.; and Dolan, B. 2010. Unsupervised Modeling
49(10):1557–64. of Twitter Conversations. In NAACL.
Chew, C., and Eysenbach, G. 2010. Pandemics in the age of twitter: Ritterman, J.; Osborne, M.; and Klein, E. 2009. Using prediction
Content analysis of tweets during the 2009 h1n1 outbreak. PLoS markets and twitter to predict a swine flu pandemic. In Workshop
ONE 5(11):e14118. on Mining Social Media.
Culotta, A. 2010a. Detecting influenza epidemics by analyzing Sakaki, T.; Okazaki, M.; and Matsuo, Y. 2010. Earthquake shakes
twitter messages. arXiv:1007.4748v1 [cs.IR]. Twitter users: real-time event detection by social sensors. In WWW.
Culotta, A. 2010b. Towards detecting influenza epidemics by ana- Scanfeld, D.; Scanfeld, V.; and Larson, E. 2010. Dissemination of
lyzing twitter messages. In KDD Workshop on Social Media Ana- health information through social networks: Twitter and antibiotics.
lytics. American journal of infection control 38(3):182–188.
Eisenstein, J.; O’Connor, B.; Smith, N. A.; and Xing, E. P. 2010. A Seifter, A.; Schwarzwalder, A.; Geis, K.; and Aucott, J. 2010. The
latent variable model for geographic lexical variation. In Empirical utility of “google trends” for epidemiological research: Lyme dis-
Natural Language Processing Conference (EMNLP). ease as an example. Geospatial Health 4(2):135–137.
Eysenbach, G. 2009. Infodemiology and infoveillance: framework Tumasjan, A.; Sprenger, T. O.; Sandner, P. G.; and Welpe, I. M.
for an emerging set of public health informatics methods to analyze 2010. Predicting elections with twitter: What 140 characters reveal
search, communication and publication behavior on the internet. J about political sentiment. In ICWSM.
Med Internet Res 11(1):e11.
Vance, K.; Howe, W.; and Dellavalle, R. P. 2009. Social internet
11
http://blog.twitter.com/2010/02/measuring-tweets.html sites as a source of public health information. Dermatologic Clinics
12
pewinternet.org/Reports/2009/Twitter-and-status-updating.aspx
27(2):133–136.
13
http://www.sysomos.com/insidetwitter/You can also read