Indoor Air Quality and Health in Newly Constructed Apartments in Developing Countries: A Case Study of Surabaya, Indonesia - MDPI

Page created by Janet Elliott
 
CONTINUE READING
Indoor Air Quality and Health in Newly Constructed Apartments in Developing Countries: A Case Study of Surabaya, Indonesia - MDPI
atmosphere
Article
Indoor Air Quality and Health in Newly Constructed
Apartments in Developing Countries: A Case Study
of Surabaya, Indonesia
Sophia Hildebrandt 1 , Tetsu Kubota 2,3, * , Hanief Ariefman Sani 2 and Usep Surahman 4
 1   Institute of Building Design and Management, Leipzig University, Grimmaische Str. 12,
     04109 Leipzig, Germany; sophia.hildebrandt@posteo.de
 2   Graduate School for International Development and Cooperation, Hiroshima University, 1-5-1 Kagamiyama,
     Higashi-Hiroshima, Hiroshima 739-8529, Japan; hanief.sani@yahoo.com
 3   Research Institute for Human Settlement and Housing, Ministry of Public Works and Housing,
     Bandung 40393, Indonesia
 4   Department of Architectural Education, Universitas Pendidikan Indonesia (UPI),
     Jl. Dr. Setiabudhi No. 229 Bandung, West Java 40154, Indonesia; u_surahman@yahoo.com
 *   Correspondence: tetsu@hiroshima-u.ac.jp; Tel.: +81-82-424-6925
                                                                                                   
 Received: 12 March 2019; Accepted: 2 April 2019; Published: 4 April 2019                          

 Abstract: In times of rapid urbanization, increasing usage of chemicals in buildings,
 and energy saving measures, the topic of indoor air quality (IAQ) demands reinforced attention.
 Nevertheless, especially in developing countries with urgent building construction needs, IAQ has
 hardly been examined. This study investigates the condition of IAQ and health of occupants in
 newly constructed high-rise apartments in contrast to traditional detached houses (Kampongs)
 in Surabaya, Indonesia. Information on building attributes, cleaning and ventilation behavior,
 interior sources, personal characteristics and health, especially multiple chemical sensitivity (MCS),
 was collected through 471 questionnaires. In addition, 76 measurements of TVOCs, formaldehyde
 and 30 measurements of mold risk were carried out. The results showed that the share of people in
 apartments with a very suggestive risk of MCS was twice as high as that in Kampongs (17.6% vs. 6.7%).
 Correlation analysis suggested that for both residential types, health problems, negative smell
 or perception of IAQ, and higher levels of stress determined higher degrees of MCS. For IAQ,
 high concentrations of formaldehyde and TVOCs were measured in apartments and corresponded
 to higher MCS risk, whereas severe mold issues were predicted in Kampongs. This study suggests
 major shortcomings in the indoor environment in newly constructed apartments for the physical and
 the mental health of occupants.

 Keywords: indoor air quality; multiple chemical sensitivity; QEESI; high-rise apartment; residence;
 developing countries

1. Introduction
     Today’s world is facing population growth, urbanization, and climate change, resulting in rapid
building construction, energy efficiency measures, and consequent changes in indoor air quality (IAQ).
This, in turn, has implications for human health. Health outcomes from poor IAQ are an increase in
asthma and allergies, specific infectious diseases like legionella pneumonia and several nonspecific
health complaints, often conceptualized in the terms sick building syndrome (SBS), sick house
syndrome (SHS), or multiple chemical sensitivity (MCS). These concepts comprise complaints about
headaches, muscle or joint pain, depression, fatigue, skin irritation, confusion, dry eyes, dry mucous
membranes, wheezing, etc.

Atmosphere 2019, 10, 182; doi:10.3390/atmos10040182                         www.mdpi.com/journal/atmosphere
Indoor Air Quality and Health in Newly Constructed Apartments in Developing Countries: A Case Study of Surabaya, Indonesia - MDPI
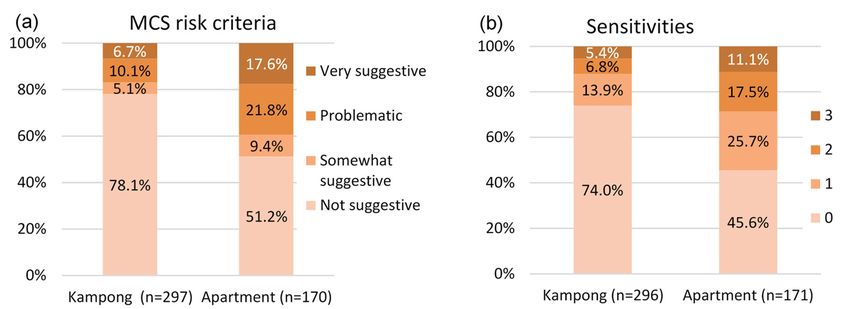
Atmosphere 2019, 10, 182                                                                         2 of 22

      People spend about 80–90% of their time indoors, and 70% of this at home [1].
Consequently, the home environment is particularly important for human health [2]. Still, in contrast
to a large body of literature on IAQ, health and performance in offices, research about residences and
home-related health issues in the general population is lacking [3,4]. Likewise, most research on IAQ
originates from North America and Europe, where research on lung cancer, allergies, SBS, and other
building-related health-issues and their influencing factors such as VOCs, particles, and allergens can
partly be traced back for several years [5,6]. Here, changes in materials and their impact on IAQ and
health partly resulted in the prohibition of certain materials and new standards [7,8]. On the other
hand, in developing countries, most IAQ studies focus on the issue of exposure to biomass combustion,
and thus there are few studies investigating IAQ in urban areas [9,10]. However, population growth
and urbanization take place at the most rapid pace in developing countries [11], where 85% of the
future building stock is predicted to be built [12]. In the case of Indonesia, one of the ten countries
which are projected to contribute to more than half of the world’s foresaid population increase over
the period 2017–2050 [13], home shortages are estimated to have reached 11.4 million by 2017 [14].
The central government reacts by quickly constructing low-cost apartments for rent (Rusunawa) and
for ownership (Rusunami) [15]. But the implementation of such building projects often does not satisfy
the inhabitant’s needs or applies to the existing regulations [16–18].
      This study aims to contribute to the research gap in IAQ research (a) in residences and (b) in
developing countries, particularly in urban areas. It explores the situation of IAQ and health in two
representative types of residential buildings in the city of Surabaya, Indonesia: high-rise apartments
and landed houses (so-called Kampongs). In the newly constructed high-rise apartments, it is assumed
that residents face increased exposure to chemicals in the indoor air, because of reduced ventilation
owing to energy-saving needs associated with the dependence on air-conditioning as described
above. In Kampongs, in contrast, flooding during the rainy season is frequently happening and
affects landed houses with potential problems of mold growth and dampness. Both occupant groups
consequently might suffer from health problems related to their buildings. Recently, SBS and other
building-related health-issues in offices have been investigated in Indonesia [19,20]. For example,
Winarti et al. [19] conducted a survey on SBS in offices of Jakarta in 2002 (n = 240) and reported that
15% of the respondents suffered from headache, although no IAQ measurement was involved in this
study. However, to the best of the authors’ knowledge, no IAQ study has yet been conducted for newly
constructed urban houses in Indonesia. In the following sections, the materials and methods utilized
in the study in Surabaya and its outcomes are described and discussed in comparison to findings from
other studies around the world.

2. Methods
     In 2015, the Indonesian government set the target to develop 1 million affordable homes [21].
Low-cost high-rise apartments for the middle-class, as part of this program, are proposed to a major
extent in Surabaya and Bandung [22]. Surabaya is thus a good starting point for investigation of
high-rise apartments. At the same time, the traditional Kampongs make up most of the city and still
accommodate the majority of people. The investigation includes both building types to make out
differences in IAQ and health status of citizens within the Indonesian urban population (Figure 1).
Atmosphere 2019, 10, x FOR PEER REVIEW                                                                                        3 of 20

area and 2019,
Atmosphere high-rise
               10, 182apartment, five samples were to be taken to cover different locations and building
                                                                                                   3 of 22
situations; second, only houses and apartments with a permission by occupants were measured.

Atmosphere 2019, 10, x FOR PEER REVIEW                                                                                        3 of 20

area and high-rise apartment, five samples were to be taken to cover different locations and building
situations; second, only houses and apartments with a permission by occupants were measured.

                    Figure 1.
                    Figure    (a) Kampongs
                           1. (a) Kampongs and
                                           and (b)
                                               (b) high-rise
                                                   high-rise apartments
                                                             apartments in
                                                                        in Surabaya,
                                                                           Surabaya, Indonesia.
                                                                                     Indonesia.

     In this research, quantitative measurements of specific IAQ parameters provide information on
                         Quantitative measurements                    Qualitative study
indoor air constituents (pollutant levels) and a questionnaire on IEQ and personal behavior identifies
potential influential parameters.
                       IAQ parameters  The questionnaire also  Questionnaire
                                                                    examines personal factors and occupants’
                       •   Air temperature                     • Building attributes
health (Figure 2). The survey took place from September        • 2017   until
                                                                  Interior      February 2018 in 27 Kampong areas
                                                                           sources
                       • Relative humidity
and 14 high-rise apartments.
                       • TVOC    Questionnaires    were  filled•  Behavior
                                                                 during    a  (cleaning, cooling)
                                                                              face-to-face   interview with randomly
                       • Formaldehyde                          • Personal perception of IAQ
chosen Kampong house        and apartment occupants from           the   previously
                                                               • Personal attributes
                                                                                         selected  areas. The average
                       • Mold risk
response rate was 87% in Kampongs and 66% in apartments,       • Health:respectively.
                                                                           MCS inventorySites for the measurements
of IAQ parameters were determined by the following criteria: first, in each Kampong area and high-rise
                                                               Photographs and site visits
apartment, five samples were to be taken to cover different locations and building situations; second,
only houses andFigure   1. (a) Kampongs
                  apartments               and (b) high-rise
                                 with a permission            apartments
                                                      by occupants       werein Surabaya,
                                                                                  measured. Indonesia.
                                     Figure 2. Instruments utilized for data collection.
                             Quantitative measurements                        Qualitative study
     IAQ parameters collected in both living room and                       master bedroom, when available, were total
                                                                        Questionnaire
                         IAQ parameters
volatile organic compounds        (TVOC) and formaldehyde
                         • Air temperature                              • concentrations
                                                                            Building attributes as two of the major indoor air
pollutants [23–25], as •well    as air
                            Relative     temperature and relative
                                      humidity                          • Interior   sources(RH). The present investigation
                                                                               humidity
                                                                        •   Behavior   (cleaning, cooling)
is considered to be a •preliminary
                            TVOC            screening to understand     • Personalthe perception
                                                                                        current conditions
                                                                                                    of IAQ        of IAQ in urban
                         • Formaldehyde
houses of Indonesia, •before                                            •   Personal   attributes
                                   the detailed characterization of indoor VOCs. Hence, real-time direct
                            Mold risk
measurements were adopted instead of widely • used                          Health: MCS inventory
                                                                                   methods such as DNPH-HPLC for
formaldehyde and GC-MS or GC-FID for VOCs. BothPhotographs                formaldehyde          andvisits
                                                                                          and site    VOC measurements were
taken over a period of 2–3 days per room. Formaldehyde concentration was measured by a
commercially available device          (FMM-MD,
                                  Figure       Instruments
                                            2. InstrumentsShinyei     Technology).
                                                                utilized   for data        This portable device is equipped
                                                                               data collection.
                                                                                      collection.
                                 Figure     2.                  utilized   for
with a photoelectrical photometry-based sensor that detects the absorbance change induced by
     IAQ parameters
formaldehyde.             collected
                  The accuracy        in
                                   ofinthe both   living
                                             sensor         room and under
                                                       is ±0.01             master bedroom,          when available,      were  total
     IAQ parameters      collected         both   living   roomppm   and masterthe         air temperature
                                                                                      bedroom,                   of 25 °Cwere
                                                                                                     when available,       with total
                                                                                                                                 50%
volatile
RH.      organic compounds
     Meanwhile,     VOCs    were  (TVOC)
                                   obtained    and
                                                 by  formaldehyde
                                                      using     the  device concentrations
                                                                               with    an         as twoPIDs
                                                                                            advanced       of the(photo-ionization
                                                                                                                   major indoor air
volatile organic compounds (TVOC) and formaldehyde concentrations as two of the major indoor air
pollutants [23–25],
detectors)            as well as air
            sensor (accuracy:       ±0.1temperature
                                            ppm) (ToxiRae  and relative
                                                                     Pro, RAEhumidity       (RH). The
                                                                                     systems).      The present     investigation   is
pollutants  [23–25],  as well as air     temperature        and relative       humidity       (RH). ThePIDs       use
                                                                                                            present    high-energy
                                                                                                                      investigation
considered
photons,     to be a preliminary
          typically                 screening (UV)torange.
                                                       understand       theofcurrent     conditions     ofthe
                                                                                                           IAQ   in urban results
                                                                                                                           houses in
                                                                                                                                   of
is considered   to beinathe   ultraviolet
                          preliminary       screening           The use
                                                           to understand        UVthelight   to excite
                                                                                       current     conditions molecules
                                                                                                                  of IAQ in urban
Indonesia,
the         before
    ionization   of the detailed
                    gas   molecules.characterization
                                         The    resulting    ofions
                                                                 indoor     VOCs.anHence,
                                                                      produce            electricreal-time
                                                                                                    current  direct  measurements
                                                                                                              proportional    to  the
houses of Indonesia, before the detailed characterization of indoor VOCs. Hence, real-time direct
were
signaladopted
       output ofinstead   of widely
                   the detector        used
                                   [26].   Allmethods
                                                 of the      such   as DNPH-HPLC             for formaldehyde        and calibrated
                                                                                                                          GC-MS or
measurements       were    adopted       instead       of said
                                                            widelysensors    (formaldehyde
                                                                          used     methods such     and VOCs)       were
                                                                                                           as DNPH-HPLC           for
GC-FID
by       for VOCs. Bothwithin
    the manufactures         formaldehyde
                                     one yearfor  and    VOC measurements
                                                    before                             were taken over        a specifications
                                                                                                                period of 2–3 days
formaldehyde     and GC-MS or GC-FID                   VOCs.the   Bothstart   of measurements.
                                                                          formaldehyde         and VOC    Themeasurements        and
                                                                                                                               were
per room. Formaldehyde
sensitivities                 concentration        wasinmeasured   Theby     a commercially         available   device   (FMM-MD,
taken  over aof period
                 VOC sensors
                           of 2–3 aredays reported
                                               per room.    [27].          meters
                                                                Formaldehyde         were     placed
                                                                                       concentration    centrally   in the
                                                                                                            was measured    room
                                                                                                                               by toa
Shinyei
avoid    Technology).
       direct  influencesThis  portable
                             from   the     device
                                           walls    oris equipped
                                                         furniture      with
                                                                        and    a
                                                                               at photoelectrical
                                                                                   a  height    of      photometry-based
                                                                                                    about    1.5  m.  If a    sensor
                                                                                                                           standing
commercially available device (FMM-MD, Shinyei Technology). This portable device is equipped
that detects the absorbance change induced by formaldehyde. The accuracy of the sensor is ±0.01
with a photoelectrical photometry-based sensor that detects the absorbance change induced by
formaldehyde. The accuracy of the sensor is ±0.01 ppm under the air temperature of 25 °C with 50%
RH. Meanwhile, VOCs were obtained by using the device with an advanced PIDs (photo-ionization
detectors) sensor (accuracy: ±0.1 ppm) (ToxiRae Pro, RAE systems). The PIDs use high-energy
photons, typically in the ultraviolet (UV) range. The use of UV light to excite the molecules results in
Atmosphere 2019, 10, 182                                                                                                            4 of 22

ppm under the air temperature of 25 ◦ C with 50% RH. Meanwhile, VOCs were obtained by using the
device with an advanced PIDs (photo-ionization detectors) sensor (accuracy: ±0.1 ppm) (ToxiRae Pro,
RAE systems). The PIDs use high-energy photons, typically in the ultraviolet (UV) range. The use
of UV light to excite the molecules results in the ionization of gas molecules. The resulting ions
produce an electric current proportional to the signal output of the detector [26]. All of the said sensors
(formaldehyde and VOCs) were calibrated by the manufactures within one year before the start of
measurements. The specifications and sensitivities of VOC sensors are reported in [27]. The meters
Atmosphere 2019, 10, x FOR PEER REVIEW                                                                                               4 of 20
were placed centrally in the room to avoid direct influences from the walls or furniture and at a height
of about 1.5was
application     m. Ifnota standing
                           possible,application
                                        the meters werewas not     possible,
                                                               placed          the meters
                                                                        by hanging      it fromweretheplaced
                                                                                                        ceilingby      hanging
                                                                                                                   at above     2m it from
                                                                                                                                      from
the ceiling   at  above     2  m   from    the floor.  Data    were   recorded     every    30
the floor. Data were recorded every 30 min. Air temperature and RH were measured by the former  min.    Air  temperature         and    RH
were measured
device  (FMM-MD,     by the    former
                          Shinyei         device (FMM-MD,
                                      Technology)      at the same Shinyei
                                                                       time.Technology) at the same time.
      Fungal    contamination,         a  result  from
     Fungal contamination, a result from dampness, which dampness,       which Kishi
                                                                                  Kishi etet al.
                                                                                             al. (2009)
                                                                                                 (2009) [4]
                                                                                                          [4] consider
                                                                                                               consider ‘one  ‘one ofof the
                                                                                                                                        the
important    risk  factors    for  symptoms      relating   to buildings,    such   as  SHS’   was
important risk factors for symptoms relating to buildings, such as SHS’ was predicted by using a      predicted      by  using   a  fungal
detector
fungal     developed
        detector            by Abeby(1993)
                     developed                   [28]. The
                                          Abe (1993)     [28].fungal     detector
                                                                The fungal           encapsulates
                                                                               detector     encapsulatesdrieddriedfungal     spores
                                                                                                                         fungal        and
                                                                                                                                   spores
nutrients  to  measure       a fungal    index   (Figure   3). The   fungal   index,   defined
and nutrients to measure a fungal index (Figure 3). The fungal index, defined by Abe (1993) [28],  by  Abe   (1993)     [28],  quantifies
the capacitythe
quantifies      forcapacity
                     mold growth         in an growth
                                  for mold      environmentin anbeing     examined,
                                                                   environment           and therefore
                                                                                       being    examined,   it isandconsidered
                                                                                                                        thereforeone   it of
                                                                                                                                          is
the useful   indices    for   evaluating      microclimates     for  potential    mold    growth
considered one of the useful indices for evaluating microclimates for potential mold growth [29]. The[29].  The    sensor     fungi   used
in the investigation
sensor  fungi used ininclude           moderatelyinclude
                              the investigation         xerophilic    Eurotiumxerophilic
                                                                 moderately         herbariorum        J-183, herbariorum
                                                                                                 Eurotium       strongly xerophilic  J-183,
Aspergillus
strongly       penicillioides
           xerophilic               K-712, penicillioides
                           Aspergillus        and hydrophilic      Alternaria
                                                                K-712,            alternate S-78.
                                                                          and hydrophilic             As described
                                                                                                  Alternaria               in Abe
                                                                                                                   alternate    S-78.(1993;
                                                                                                                                         As
2010;  2012)   [28,30,31],     the   measurement        procedure      is as  follows:     (1) a  fungal
described in Abe (1993; 2010; 2012) [28,30,31], the measurement procedure is as follows: (1) a fungal      detector       was   exposed
for two days
detector          to four weeks
           was exposed          for two at each
                                             days survey
                                                   to four location;
                                                              weeks at(2)     after
                                                                           each       exposure,
                                                                                   survey            the detector
                                                                                             location;    (2) after was        placedthe
                                                                                                                         exposure,        in
a container
detector  waswithplaced silica
                            in agel   and thewith
                                  container       development
                                                      silica gel andof hyphae       was terminated
                                                                         the development         of hyphae by desiccation;
                                                                                                                 was terminated    (3) the
                                                                                                                                         by
length of hyphae
desiccation;    (3) theinlength
                           each sensor       fungus
                                     of hyphae     in was
                                                      eachmeasured
                                                             sensor fungusunderwas a microscope
                                                                                       measured in       the Laboratory
                                                                                                      under    a microscope     for in
                                                                                                                                     Mold
                                                                                                                                        the
Prediction, Japan;
Laboratory     for Mold  (4) the    number Japan;
                              Prediction,      of response
                                                       (4) theunits,
                                                                 numberru, was    determined
                                                                             of response           from
                                                                                              units,   ru,the
                                                                                                           was length      of hyphae
                                                                                                                    determined        fromin
each  sensor   fungus;     and   (5)  the   fungal  index   was   calculated    using    the  greatest
the length of hyphae in each sensor fungus; and (5) the fungal index was calculated using the greatest   growth       response     among
the sensor
growth       fungi inamong
         response         the detector.
                                   the sensorThe fungi
                                                  value inof the
                                                             the index    wasThe
                                                                  detector.      defined
                                                                                     valueasofthe thegrowth
                                                                                                       index of was  response
                                                                                                                        defined(ru)     per
                                                                                                                                    as the
exposure
growth   of period
             response  (week)
                           (ru) peras indicated     in Table
                                       exposure period          1 [32].asMold
                                                             (week)               measurements
                                                                           indicated    in Table 1 [32].wereMold
                                                                                                               takenmeasurements
                                                                                                                          in the master
were taken in the master bedroom in January and February 2018, at the same places or,
bedroom     in  January      and    February     2018,  at  the  same    places   as  the   other   measurements           as in
                                                                                                                               thecase
                                                                                                                                     otherof
unavailability of
measurements        or,the
                         in family
                             case of at   that time, in of
                                       unavailability      thethe
                                                                same    areaatorthat
                                                                   family         building.
                                                                                      time, in the same area or building.

                                                  Figure 3. Fungal detector [30].

                                                    Table 1. Fungal index [32].

                              Predicted
            Fungal
Level                       Propagation of                                                 Remarks
             Index
                                Fungi
  A
Atmosphere 2019, 10, 182                                                                                                            5 of 22

                                                  Table 1. Fungal index [32].

                                                      Predicted Propagation
                 Level            Fungal Index                                                    Remarks
                                                             of Fungi
                  A                    15
                                                          propagation            regular cleaning is needed for wet areas,
                                                                                            such as bathroom.

       The questionnaire comprised two versions: one for household representatives and one for 5other
Atmosphere 2019, 10, x FOR PEER REVIEW                                                                                          of 20
 family members. The questionnaire for household representatives included questions about building
 andinterior
and    interiorspace
                   spacecharacteristics
                           characteristicsasas   well
                                               well  asas    cleaning
                                                        cleaning     andand  ventilation
                                                                          ventilation        behavior
                                                                                         behavior     andand     perceived
                                                                                                             perceived    IAQ,IAQ,
                                                                                                                                 the
 the  influential     parameters     of  interest  for  this    study   (independent       variables).
influential parameters of interest for this study (independent variables). In the second part, personal     In  the  second     part,
personal attributes
attributes     and health and status-related
                               health status-related     indicators
                                                 indicators       werewere   gathered.
                                                                         gathered.     TheThe    questionnairefor
                                                                                             questionnaire         forhousehold
                                                                                                                        household
 members, including
members,        includingchildren,
                             children,only   contained
                                          only  contained   thisthis
                                                                  second  part,part,
                                                                      second    since since
                                                                                        livingliving
                                                                                                 conditions     could be
                                                                                                          conditions        derived
                                                                                                                         could    be
 from   the  household      representatives’    questionnaire.
derived from the household representatives’ questionnaire.
       To evaluate
       To   evaluate participants’
                          participants’ well-being
                                           well-being in     in relation
                                                                 relation toto their
                                                                                their home
                                                                                         home environment,
                                                                                                  environment, the     the Quick
                                                                                                                             Quick
 Environmental         Sensitivity  Inventory     (QEESI)      was   applied.  The    QEESI
Environmental Sensitivity Inventory (QEESI) was applied. The QEESI is an instrument to measure is an  instrument      to  measure
 multiple chemical
multiple     chemical sensitivity
                          sensitivity (MCS),
                                       (MCS), oneone ofof the
                                                           the concepts
                                                                concepts that
                                                                           that are
                                                                                 are used
                                                                                       used to
                                                                                             to describe
                                                                                                 describe nonspecific
                                                                                                              nonspecific health
                                                                                                                             health
 complaints due
complaints        due toto poor
                            poor indoor
                                 indoor environmental
                                            environmental quality quality [33].
                                                                           [33]. ItIt has
                                                                                       has been
                                                                                           been used
                                                                                                   used in  in other
                                                                                                               other studies
                                                                                                                       studies on on
 building-related       symptoms    in  various  countries      across  the world    [34,35]
building-related symptoms in various countries across the world [34,35] and its validity and  and   its  validity  and   reliability
 has been tested
reliability    has beenin several  countries
                           tested in            [36–38]. The
                                      several countries            QEESI
                                                              [36–38].  Thehas  beenhas
                                                                             QEESI      developed       by Millerbyand
                                                                                            been developed                 Prihoda
                                                                                                                       Miller   and
 in 1999 in
Prihoda     and    is available
                1999             at www.chemicalexposures.org
                      and is available    at www.chemicalexposures.org      [39]. [39].
                                                                                    In four    major
                                                                                          In four       parts,
                                                                                                    major        information
                                                                                                              parts, information  on
(1)  chemical     intolerances,   (2)  other  intolerances,      (3) symptom     severity,  and
on (1) chemical intolerances, (2) other intolerances, (3) symptom severity, and (4) life impact is (4)  life  impact  is  collected
(Figure 4).
collected       Ten subquestions
             (Figure                  in each part
                        4). Ten subquestions          require
                                                 in each     parta require
                                                                    response   on a scaleon
                                                                            a response      between      0 and 10,0for
                                                                                               a scale between         and example
                                                                                                                             10, for
 evaluating      the  severity  of symptoms      towards       a certain  exposure.     The   fifth
example evaluating the severity of symptoms towards a certain exposure. The fifth part, the masking part,    the masking      index,
 helps   to identify    ongoing  exposures     (e.g.  alcohol,    smoking).   The    subquestions
index, helps to identify ongoing exposures (e.g. alcohol, smoking). The subquestions in this case only in  this case  only   ask  for
 a ‘yes’
ask  for or   ‘no’ or
          a ‘yes’   response.
                        ‘no’ response.

                Figure4.
                Figure    Calculationof
                       4. Calculation ofQuick
                                        QuickEnvironmental
                                              Environmental Sensitivity
                                                            Sensitivity Inventory
                                                                         Inventory (QEESI)
                                                                                   (QEESI) scores.
                                                                                           scores.

       Since the
      Since   the calculation
                   calculationprocedure
                                  procedure of of
                                               QEESI
                                                  QEESIis described  elsewhere
                                                           is described           [39], we
                                                                           elsewhere        would
                                                                                        [39],       just likejust
                                                                                               we would       to mention
                                                                                                                   like to
 that the  ranges   for the  scales and  interpretation   guidelines   suggested    by  Miller and
mention that the ranges for the scales and interpretation guidelines suggested by Miller and Prihoda Prihoda    [40]  have
 beenhave
[40]   applied
            beenfor    evaluation
                   applied          purposes,
                             for evaluation     which are
                                              purposes,      based
                                                           which  areonbased
                                                                         previous    researchresearch
                                                                               on previous     and examined       groups.
                                                                                                         and examined
The   criteria  for  low,   medium,    and   high  scale   scores are   listed  in Table   2, and  the
groups. The criteria for low, medium, and high scale scores are listed in Table 2, and the risk criteria risk  criteria  in
Table
in Table3. Respondents
           3. Respondents   have  been
                               have    categorized
                                     been  categorizedintointo
                                                            oneone
                                                                of four   degrees
                                                                     of four        to which
                                                                               degrees         MCSMCS
                                                                                         to which     is suggested    (risk
                                                                                                           is suggested
 criteria) according     to their symptom     severity,  chemical   intolerance,    and  masking    score
(risk criteria) according to their symptom severity, chemical intolerance, and masking score (see Table     (see Table   3).
This   variable   is  called  ‘Multiple   chemical   sensitivity   (MCS)     risk’ hereafter.   It describes
3). This variable is called ‘Multiple chemical sensitivity (MCS) risk’ hereafter. It describes a person         a  person
 considered sensitive
considered     sensitive toto multiple
                              multiple chemicals.
                                        chemicals.
     Additionally, it was assessed in how many of the three scores ‘symptom severity’, ‘chemical
intolerance’, and ‘other intolerances’ the respondent reached a ‘high’ score (Table 2). The variable
thus ranges from 0, when the respondent did not exceed ‘high’ score criteria in any of the three scales,
to 3, when all three scores reached ‘high’ values. This categorization is in the following called
‘sensitivity’. The respondent’s sensitivity is related closely to MCS risk (since it includes two similar
scores), but rather indicates if the respondent is generally sensitive, not only with regards to
Atmosphere 2019, 10, 182                                                                                                6 of 22

                              Table 2. Criteria for high, medium, and low scale scores [40].

                                                                              Score
                           Scale/Index
                                                        Low               Medium                    High
                    Symptom Severity                    0–19                  20–39                 40–100
                   Chemical Intolerance                 0–19                  20–39                 40–100
                    Other Intolerance                   0–11                  12–24                 25–100
                       Life Impact                      0–11                  12–24                 25–100
                     Masking Index                       0–3                   4–5                   6–10

                                                   Table 3. Risk criteria [40].

           Degree to which MCS
                                         Symptom Severity Score       Chemical Intolerance Score       Masking Score
               Is Suggested
              Not suggestive
Atmosphere 2019, 10, 182                                                                                                         7 of 22

only 9% in Kampongs. Sixty percent of apartments were built within the past five years, and Kampong
houses are rather old with more than 60% of them having been constructed within the past 11–50 years,
which reflects the overall situation in Indonesia.

      Table 5. Profile of respondents and overview of building attributes, interior sources, and perceived
      air quality.
                             K = Kampong, A = Apartment                        K           A         Total      n     p-Value
                                                        Years [mean]          39.7        25.1        34.4      462
measurements, in Kampongs, 80% of the measured houses are categorized within the highest fungal
index, D, an alarming sign, as compared to just 17% of the measurements in apartments (Figure 5).
     In return, apartment occupants report more mite problems (18%) and 61% complain about odor
or smell in their flat, as opposed to Kampongs (6% and 51% respectively) (Table 5). The share of
complaints   about
  Atmosphere 2019, 10, smell
                       182   is higher than in other studies, too. In a Chinese study, only 26.5% report      8 of 22
unpleasant odors in their homes [45] and in an early study in Sweden in the 90s it was 33% [46]. One
reason for larger issues with mites and odors could be the cleaning behavior of apartment occupants,
  3.2. Mold Risk, Mites, and Smells
which is less frequent than that of Kampong residents or reported in other studies. Daily cleaning is
done only   by 28%,inasTable
        As shown           compared
                                5, manyto Kampong
                                          90% in Kampongs.       Cleaning
                                                        houses and          the bedclothes
                                                                     apartment              less than once
                                                                                 units face problems    with per
                                                                                                              mold
week,  as done
  growth   (42%by  and35%,
                        37%has   been associated
                             respectively),  whichwith    increased
                                                     is more         mite levels
                                                              than reported      [47]. Another
                                                                             in Sweden          critical
                                                                                         and Finland     point
                                                                                                       (4%)     is
                                                                                                            [41,42],
that 25%   of  the   ACs   are  never  cleaned,    and   another  15%   only  once  per year.  The
  and China (5%) [43], but close to that reported in Korea: 35% [44]. According to the mold risk     US  Energy
Department    recommends
  measurements,                cleaning
                      in Kampongs,    80%of of
                                            ACstheevery  one tohouses
                                                   measured     two months,    which is within
                                                                       are categorized  done bythe
                                                                                                 less than 40%.
                                                                                                    highest fungal
  index, D, an alarming sign, as compared to just 17% of the measurements in apartments (Figure 5).

                              Figure 5. Measured fungal indexes in (a) Kampongs and (b) apartments.
                        (a)                                                    (b)
                                                                               (b)
                   30
        In return,
           B    C apartment
                        D      occupants report     more
                                               (n=24)
                                                              mite 70
                                                                   problems
                                                                     B     C
                                                                            (18%)Dand 61% complain about   (n=19)odor or
     25 in their flat, as opposed to Kampongs (6% and 51%       60
  smell                                                            respectively) (Table 5). The share of complaints
   Frequency (%)

                                                               Frequency (%)

                                                                50
     20 smell is higher than in other studies, too. In a Chinese study, only 26.5% report unpleasant odors
  about
                                                                40
  in their
     15     homes [45] and in an early study in Sweden in the 90s it was 33% [46]. One reason for larger
                                                                30
  issues
     10 with mites and odors could be the cleaning behavior of apartment occupants, which is less
                                                                20
  frequent
      5      than that of Kampong residents or reported10in other studies. Daily cleaning is done only by
  28%,0 as compared to 90% in Kampongs. Cleaning the             0
                                                                    bedclothes less than once per week, as done
  by 35%,
Atmosphere 2019, 10, 182                                                                                  9 of 22

                                          Table 6. Health and stress variables.

                                             Kampong          Apartment          Total   n     p-Value
          Asthma              [%]               12.8              17.4            14.5   469   0.168 a
          Eczema              [%]               25.3              36.0            29.3   468   0.014 a
          Allergy             [%]               31.6              36.5            33.4   464   0.287 a
         Stress [mean: 0 = no stress,
                                                 2.1               4.3             2.9   464
with an average of 15.3 times/h under open-window conditions, whereas those in apartments were
 averaged at 0.7 times/h [57]. However, in Kampongs, thermal conditions inside are often worse than
 outside conditions. Higher averages in air temperatures and RH have been recorded. Extreme air
 temperatures up to 39 °C were noted and the mean RH (64% to 79%) clearly exceeds the
 recommended
Atmosphere 2019, 10,maximum
                    182     level of 60%, above which increased mold growth and health effects
                                                                                            10 ofare
                                                                                                  22
 generally observed [58].

                                        (a) 40                                                                                                                  (b)100

                                                                                                                                                                Relative humidity (%)
                                         Air temperature (℃)
                                                               35                                                                                                                               80

                                                               30                                                                                                                               60

                                                               25                                                                                                                               40

                                                               20                                                                                                                               20

                                                               15                                                                                                                                           0

                                                                                               Apartment (n=20)

                                                                                                                                             Apartment (n=21)
                                                                    Outdoor

                                                                              Kampong (n=28)

                                                                                                                  Outdoor

                                                                                                                            Kampong (n=14)

                                                                                                                                                                                                                     Outdoor

                                                                                                                                                                                                                                                Apartment (n=19)

                                                                                                                                                                                                                                                                   Outdoor

                                                                                                                                                                                                                                                                                              Apartment (n=21)
                                                                                                                                                                                                                               Kampong (n=28)

                                                                                                                                                                                                                                                                             Kampong (n=14)
                                                                       Dry Season                                   Wet Season                                                                                          Dry Season                                   Wet Season

    Figure 6. Statistical summary of (a) outdoor and indoor air temperature and (b) relative humidity in
     Figure 6. Statistical summary of (a) outdoor and indoor air temperature and (b) relative humidity in
    dry and   wet   season.
     dry and
Atmosphere 2019,wet
                 10, xseason.
                       FOR PEER REVIEW                                                                 10 of 20

3.5. IAQ Measurements
 Emirates     (0.14 ppm) [61], and higher than in China (0.22 ppm*) [62]―and exceeds even the measured
 3.5. IAQ Measurements
 maximum of70.29
       Figures        andppm  8 show
                                   found theinmeasurement
                                                 a study on ‘very  results  for formaldehyde
                                                                       suggestive’    MCS cases in    and   TVOCs
                                                                                                         Japan    [63].of apartments
        Figures
and Kampong        7  and    8  show    the   measurement        results  for  formaldehyde        and  TVOCs       of apartments      and
       For TVOChouses             calculated6by
                         concentrations,            outmean
                                                          of 27(mean    concentration
                                                                 apartment      measurementsof all measurements
                                                                                                     (21.4%) and 7 in     outtheofhomes)
                                                                                                                                   the 28
 Kampong
and    maximum inhouses     calculated
                        (maximum             by   mean
                                          concentration   (mean    concentration      of  all measurements         in  the  homes)     and
 measurements               Kampongs          (25.9%) weremeasured
                                                                above 5 mg/m in the3, homes)
                                                                                       which are concentration.
                                                                                                      assumed to cause  In Kampongs,
                                                                                                                                objective
 maximum (maximum
formaldehyde          concentrations  concentration
                                              exceeded      measured
                                                            the  WHO      in the homes)
                                                                         guideline      of  0.08 concentration.
                                                                                                 ppm     in   9 out   ofIn42 Kampongs,
                                                                                                                              measured
 effects and subjective reports of irritation [64]. The Japanese tentative target of 400 µg/m3 was                                crossed
 formaldehyde
houses     (21%)     atconcentrations
                         leastunits
                                  onceandduringexceeded
                                                     the     the WHO guideline
                                                           measurement        period.    of 0.08  ppm in 9this   out of 42the  measured
 in 79% of    apartment                       78% in   Kampongs       (Figure    7b), farInmore
                                                                                              apartments,
                                                                                                   than in Japan, was where 8%    case   in
                                                                                                                                    of the
 houses
26  rooms   (21%)
              out    at40
                    of    least
                             (65%)onceandduring
                                             the     the measurement
                                                   mean    concentration     period.
                                                                              of        In apartments,
                                                                                 formaldehyde        (0.05   this was
                                                                                                            ppm)     was  the  case than
                                                                                                                            higher   in 26
 buildings were observed with heightened TVOC levels [52] and more than in China (61%) [34]. Just
 rooms out
observed     in of   40 (65%)(0.01
                  Kampongs          and ppm),
                                            the mean      concentration of
                                                    in France                    formaldehyde        (0.05   ppm) was       higher    than
                                                                                                                                       3 in
 as for formaldehyde,            even the       mean   values (0.01–0.02      ppm*)
                                                                 in the apartment      (Values   were
                                                                                         units result   calculated      from
                                                                                                         in a concentration    µg/mof 964
 observed
ppm            in  Kampongs          (0.01   ppm),    in  France   (0.01–0.02    ppm*)     (Values    were    calculated     from
                                                                                                                                ◦   µg/m   3
 µg/mfor    better is
        3, which     coherence
                        thus double  fromthanthe measurements
                                                   original studies,inassuming
                                                                         Kampongs    the(403
                                                                                          indoor
                                                                                               µg/m temperature
                                                                                                      3), in Japanto     be 25 C.)
                                                                                                                      (112–482        [59],
                                                                                                                                   µg/m   3)
 in ppm for ppm*)
Japan            better coherence          from    the(0.03–0.04
                                                       original studies,      assuming      the indoor    temperature of    to 0.34
                                                                                                                               be 25ppm°C.)
 [55,56](0.03              [56,60], and
           or China (360/397            µg/m  China
                                                 3) [34].  The peaksppm) of [34].
                                                                             TVOCs The inmaximum
                                                                                             Kampongs  concentration
                                                                                                            could be explained           by
 [59],isJapan
also     double  (0.03
                    thanppm*)       [56,60],studies—0.15
                            in Japanese         and China (0.03–0.04        ppm)    [34]. The    maximum        concentration      of 0.34
 smoking,      short-term        utilization     of cleaningppm       [56] or
                                                                products,     or0.16
                                                                                  gasppm*     [52]
                                                                                        exhaust     and the
                                                                                                   from       United
                                                                                                           cars  parked  Arab   Emirates
                                                                                                                            close   to the
 ppmppm)
(0.14    also is   double
                [61],          than inthan
                       and higher         Japanese     studies―0.15
                                                in China    (0.22 ppm*)  ppm     [56] orexceeds
                                                                           [62]—and        0.16 ppm*even [52]   and
                                                                                                           the to     the United
                                                                                                                measured      maximumArab
 building     and    entering      from outdoors.          However,     further    investigations      need        be carried     out for
of 0.29 ppm found in a study on ‘very suggestive’ MCS cases in Japan [63].
 verification.

      Figure 7. Statistical summary of indoor air quality (IAQ) measurement results: (a) Formaldehyde and
       Figure 7. Statistical summary of indoor air quality (IAQ) measurement results: (a) Formaldehyde and
      (b) total volatile organic compounds (TVOC).
       (b) total volatile organic compounds (TVOC).

         (a)                      100                                                                                                                           (b)                                         100
                                  90                                                                                                                                                                            90
                                  80                                                                                                                                                                            80
              ive frequency (%)

                                                                                                                                                                                        ive frequency (%)

                                  70                                                                                                                                                                            70
                                  60                                                                                                                                                                            60
                                  50                                                                                                                                                                            50
Figure 7. Statistical summary of indoor air quality (IAQ) measurement results: (a) Formaldehyde and
Atmosphere 2019, 10, 182                                                                                11 of 22
      (b) total volatile organic compounds (TVOC).

        (a)                            100                                            (b)                          100
                                       90                                                                          90
            Cumulative frequency (%)   80                                                                          80

                                                                                        Cumulative frequency (%)
                                       70                                                                          70
                                       60                                                                          60
                                       50                                                                          50
                                       40                                                                          40        Japanese target:
                                                                                                                             400 μg/m3
                                       30         WHO standard:                                                    30
                                                  0.08 ppm
                                       20                                                                          20           × Kampong
                                                                  × Kampong
                                                                  ○ Apartment                                                   ○ Apartment
                                       10                                                                          10                               20000 25000

                                        0                                                                           0
                                             0   0.1        0.2      0.3        0.4                                      0   2000    4000  6000    8000   10000
                                                    Formaldehyde (ppm)                                                                TVOC (μg/m3)

      Figure  8. Cumulative frequency of maximum concentrations
      Figure 8.                                       concentrations of (a) formaldehyde and (b) TVOC.
      These
      These maximum    values were calculated based onon
                       values  were calculated based    thethe measured
                                                             measured 30 30
                                                                         minmin temporal
                                                                             temporal    average
                                                                                      average     values,
                                                                                              values, and
      and therefore
      therefore     considered
                considered     comparable
                           comparable  withwith international/domestic
                                            international/domestic      standards.
                                                                    standards.

      For TVOC concentrations, 6 out of 27 apartment measurements (21.4%) and 7 out of the
3.6. QEESI
28 measurements in Kampongs (25.9%) were above 5 mg/m3 , which are assumed to cause objective
effectsFigure  9 shows reports
         and subjective   the specific   QEESI[64].
                                  of irritation   scale
                                                      Theoutcomes.   Apartment
                                                           Japanese tentative       respondents
                                                                                target  of 400 µg/mgenerally  reach
                                                                                                     3 was crossed
higher
in 79% of scores in chemical
            apartment   units and
                               and other
                                    78% in sensitivities,
                                             Kampongs symptoms,
                                                          (Figure 7b),and  life impact.
                                                                       far more   than inKampong     occupants,
                                                                                           Japan, where          on
                                                                                                          8% of the
the  other   hand,  face more   ongoing     exposures.   Still, though  differing  in  severity, residents
buildings were observed with heightened TVOC levels [52] and more than in China (61%) [34]. Just as         of both
building
for         categories
    formaldehyde,       are the
                      even   sensitive  to similar
                                mean values         chemicals
                                               in the apartment  and other
                                                                   units    exposures.
                                                                         result           Ongoing exposures
                                                                                in a concentration   of 964 µg/mthat
                                                                                                                  3,

which is thus double than measurements in Kampongs (403 µg/m3 ), in Japan (112–482 µg/m3 ) [55,56]
or China (360/397 µg/m3 ) [34]. The peaks of TVOCs in Kampongs could be explained by smoking,
short-term utilization of cleaning products, or gas exhaust from cars parked close to the building and
entering from outdoors. However, further investigations need to be carried out for verification.

3.6. QEESI
     Figure 9 shows the specific QEESI scale outcomes. Apartment respondents generally reach
higher scores in chemical and other sensitivities, symptoms, and life impact. Kampong occupants,
on the other hand, face more ongoing exposures. Still, though differing in severity, residents of both
building categories are sensitive to similar chemicals and other exposures. Ongoing exposures that
can influence people’s sensitivities are mostly the usage of fabric softeners, gas stoves, and scented
products. More apartment respondents make use of scented products (90% versus just around 70% of
Kampong occupants) and are exposed more to other chemicals (60% vs. 43%). Kampong respondents,
on the other hand, more frequently own gas stoves (94% vs. 71% of apartment occupants) and are
exposed more to fumigation (64% vs. 52%) and ETS (45% vs. 13%).
observed in Korea (37%) [65], but in Japan, only 25% of the respondents were categorized in the ‘very
suggestive’ or ‘problematic’ MCS risk groups [63]. Similarly, in the US, the percentage of people with
a high sensitivity in three scales was found to be just about half (6.6% as compared to the apartment
respondent’s 11.1%), and those with high scores in two scales was 15.8% as compared to this study’s
17.5%  [40].
Atmosphere   The
           2019, 10,share
                     182 of high MCS risk groups and people with high sensitivities in Kampongs12isoffar
                                                                                                      22
lower than compared to these.

                       Apartment (n=172)         Kampong (n=297)                                       Apartment (n=172)               Kampong (n=296)
      (a)                                               (b)                           (b)
                          Tobacco                                                **          Alcoholic beverages                                      **
                       Diesel/ gas                                          **                  Allergic reactions                              **
                        Insecticide                                    **                      Chlorinated water
                                                                                                                                           **
                             Paint                           **                           Feeling ill if taking less
                         Gasoline                       **                                        Particular foods
                 Cleaning products                                                          Feeling ill after meals
                                                        **
                 Fresh tar/ asphalt                                                                       Caffeine
                                                        **
                   New furnishings                                                    Fabrics, metal jewelry, etc.
                    Nailpolish etc.                                                             Unusual cravings                       *
                                                   **
                         Perfumes                                                                            Drugs

                                   0    2       4     6     8     10                                                   0       2       4    6      8     10
      (c)                         Chemical intolerance score (0-10)                   (d)                                  Other intolerance score (0-10)
            Stomach and intestines                                **                                     Softener                                          *
                          Emotion                            **                                Scented products                                            **
                          Muscles                                                                    Cooking gas                                           **
                     Head-related                            **                                            Caffein
                         Cognition                           **                              Chemical exposure                                        **
                      Skin-related                           **                                       Fumigation                                       *
      Airway or mucous membrane                          **                                              Smoking
                           Nerves                                                               Passive smoking                                  **
               Heart/chest-related                 *                                                     Alcohole                  *
                           Urinary                                                                          Drugs
                                      0            5                             10                                    0         0.5         1                  1.5
                                          Symptoms score (0-10)                                                               Masking index (0 or 1)

               QEESI scales
     Figure 9. QEESI scales for
                            for (a) chemical
                                    chemical intolerance
                                             intolerance score,
                                                         score, (b)
                                                                (b) other
                                                                    other intolerance
                                                                          intolerance score,
                                                                                      score, (c)
                                                                                             (c) symptoms,
                                                                                                 symptoms,
     and (d) masking index.

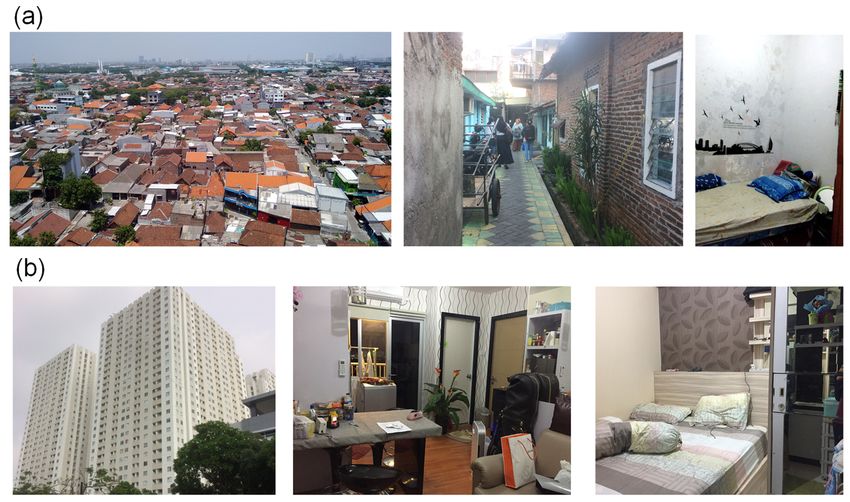
     Overall, MCS risk and sensitivities are significantly higher in apartments than in Kampongs:
39% have a problematic or very suggestive risk of MCS and 29% meet high scores in two or three of
the three scales chemical intolerances, other intolerances and symptoms (Figure 10). 74% of Kampong
respondents did not exceed ‘high score’ criteria in any score and can thus be considered free from
chemical sensitivities. This is the case for only 46% of apartment respondents. A similar picture evolves
when looking at the MCS risk criteria. The QEESI results reveal that the proportion of respondents in
apartments with a problematic or very suggestive risk of MCS is more than two times higher than that
Atmosphere
of Kampongs2019, (39.4%
                 10, x FORvs.
                           PEER  REVIEW
                              16.8%).                                                              12 of 20

     Figure   10. (a)
      Figure 10.   (a) Multiple
                       Multiple chemical
                                chemical sensitivity
                                           sensitivity (MCS)
                                                       (MCS) risk
                                                             risk criteria:
                                                                   criteria: MCS according to MCS risk criteria,
     involving   chemical intolerance,
      involving chemical     intolerance,symptom
                                           symptomand  and masking
                                                         masking      index
                                                                  index      score;
                                                                         score;     (b) Sensitivities:
                                                                                (b) Sensitivities:     number
                                                                                                   number        of
                                                                                                           of scales
     scales that  meet  ‘high’ score criteria, involving chemical  intolerance,  other intolerance,
      that meet ‘high’ score criteria, involving chemical intolerance, other intolerance,            and symptom
                                                                                                         symptom
     severity
      severity score.
               score.

     Both ways
3.7. Factors      of interpreting
             Influencing MCS      the scores thus indicate a significant difference between the health
of Kampong and apartment occupants. Similar shares as the MCS risk in apartments have been
      Tablein7 Korea
observed       shows(37%)
                       the correlation
                            [65], but inanalysis
                                          Japan, results.
                                                 only 25% In of
                                                             apartments,  the strongest
                                                                the respondents         correlation in
                                                                                 were categorized    exists
                                                                                                       the
between higher levels of stress and sensitivity as well as MCS risk. There are studies which suggest
a relationship between mental well-being and reporting of symptoms for MCS. As such, the Robert
Koch-Institut [66] in an extensive study has not found any correlations between reported or attested
MCS and environmental influences, but found a causal connection to psychosomatic problems. Other
studies carried out for workers’ link MCS, SBS, or SHS with mental health, too [67–69]. As the causes
Atmosphere 2019, 10, 182                                                                           13 of 22

‘very suggestive’ or ‘problematic’ MCS risk groups [63]. Similarly, in the US, the percentage of people
with a high sensitivity in three scales was found to be just about half (6.6% as compared to the
 apartment respondent’s 11.1%), and those with high scores in two scales was 15.8% as compared to this
 study’s 17.5% [40]. The share of high MCS risk groups and people with high sensitivities in Kampongs
 is far lower than compared to these.

3.7. Factors Influencing MCS
      Table 7 shows the correlation analysis results. In apartments, the strongest correlation exists
between higher levels of stress and sensitivity as well as MCS risk. There are studies which suggest
a relationship between mental well-being and reporting of symptoms for MCS. As such, the Robert
Koch-Institut [66] in an extensive study has not found any correlations between reported or attested
MCS and environmental influences, but found a causal connection to psychosomatic problems.
Other studies carried out for workers’ link MCS, SBS, or SHS with mental health, too [67–69]. As the
causes for stress are also partly related to the home environment, it can be argued that this home-related
stress (noise, loneliness, apartment too small) has a negative impact such as it has been stated for
asthma in children [70]. For sensitivities, the prevalence of eczema, a worse perception of IAQ and
less frequent cleaning of the bathroom also played a role. This finding corresponds to other studies,
where eczema, asthma, and allergic rhinitis were related to SBS symptoms or negative IAQ perceptions
led to more symptoms reporting [43].
      Moreover, in apartments, MCS risk did not correlate with any building attributes,
interior characteristics, IAQ, or behavioral variables. However, a highly significant difference
in MCS risk and sensitivities exists between females and males, which has also been found in
other studies [8,45,56,71,72]. An investigation of the gender differences revealed that for females,
stress correlated strongly, but water leakage and disturbing smell also negatively affected MCS risk.
Men with asthma had significantly more sensitivities, and men who are exposed to fumigation are
categorized into higher MCS groups. The influence of incense sticks, which may be a comparable
exposure, has been found to result in headaches and neurologic effects [61]. Cleaning behavior in
men had a slightly contradictory influence on MCS risk and sensitivities; whereas a more frequent
cleaning of the rooms led to heightened MCS risk, the opposite was true for bathrooms. One possible
explanation could be the utilization of cleaning products or the quite frequently used scented products
for rooms. Frequent cleaning can have as much negative impact on health as smoking 20 cigarettes per
day [73]. It is also possible, on the other hand, that people with more symptoms try to reduce those
through improved ventilation and cleaning behavior. More research is needed to investigate if the
correlations are truly relevant, and if so, which cleaning products are used and to what extent.
Atmosphere 2019, 10, 182                                                                                                              14 of 22

                                         Table 7. Results of correlation analysis.

                R = MCS Risk                   All            Kampongs                             Apartments
               S = Sensitivities                                                     All                 Controlling for gender
                  f = female             R            S       R       S
                  m = male                                                                                 R                   S
                                                                              R             S
                                                                                                     f          m        f          m
             Personal attributes
                Age group a            0.004         0.004   0.047   0.047   0.312         0.312   0.402       0.435   0.561       0.241
                    Sex a              0.146         0.179   0.474   0.885   0.032         0.009
                  Income b             0.000         0.000   0.000   0.000   0.496         0.372   0.209       0.723   0.223       0.495
                Occupation a           0.001         0.002   0.001   0.001   0.778         0.936   0.730       0.723   0.732       0.304
                 Psychology
                                       0.000         0.000   0.000   0.000   0.004         0.000   0.031       .217    0.001       0.034
                   Stress b
                   Health
                  Asthma a             0.080         0.004   0.041   0.012   0.740         0.309   0.444       0.289   0.321       0.008
                  Eczema a             0.000         0.000   0.000   0.000   0.055         0.012   0.113       0.518   0.018       0.138
                  Allergy a            0.007         0.003   0.031   0.053   0.117         0.076   0.302       0.205   0.193       0.541
               Masking index
            Smoking and/or ETS a       0.004         0.001   0.022   0.201   0.488         0.126   0.865       0.516   0.750       0.277
                Fumigation a           0.257         0.239   0.947   0.535   0.015         0.108   0.371       0.004   0.531       0.002
          Exposure other chemicals a   0.004         0.001   0.046   0.030   0.475         0.150   0.291       0.862   0.562       0.174
             Scented products a        0.052         0.079   0.472   0.722   0.682         0.394   0.551       0.924   0.436       0.229
              Fabric Softener a        0.197         0.010   0.239   0.045   0.492         0.263   0.321       0.207   0.018       0.805
             Building attributes
           Living in home [years] b    0.000         0.000   0.405   0.804   0.474         0.701   0.663       0.187   0.246       0.081
          Windows_masterbedroom b      0.049         0.041   0.004   0.002   0.924         0.827   0.868       0.260   0.114       0.839
           Windows_living room b       0.000         0.000   0.000   0.000   0.280         0.077   0.173       0.670   0.558       0.891
                     AC a              0.000         0.000   0.007   0.000   0.608         0.147     -           -       -           -
                     Fan a             0.001         0.001   0.509   0.351   0.526         0.716     -           -       -           -
               Modifications a         0.394         0.290   0.017   0.123   0.987         0.942   0.360       0.231   0.609       0.396
               Water leakage a         0.065         0.151   0.387   0.161   0.143         0.152   0.013       0.601   0.069       0.832
                   Interior
                    Mold a             0.296         0.579   0.005   0.010   0.660         0.772   0.842       0.809   0.624       0.667
                    Mite a             0.007         0.030   0.921   0.919   0.107         0.238   0.263       0.064   0.718       0.224
           Furniture_living room b     0.257         0.154   0.014   0.015   0.177         0.317   0.461       0.228   0.253       0.592
                   IAQ
                  Smell a              0.064         0.043   0.024   0.029   0.160         0.551   0.032       0.430   0.674       0.007
                IAQ rating b           0.324         0.302   0.893   0.998   0.056         0.024   0.111       0.196   0.159       0.029
                OAQ rating b           0.027         0.022   0.089   0.106   0.148         0.095   0.057       0.906   0.135       0.399
                Behavior
      Window-opening_bedroom b         0.000         0.001   0.416   0.696   0.063         0.141   0.341       0.926   0.121       0.522
      Window-opening_livingroom b      0.008         0.005   0.773   0.959   0.457         0.853   0.185       0.886   0.644       0.639
          Cleaning of rooms b          0.000         0.000   0.012   0.001   0.060         0.354   0.922       0.031   0.658       0.681
         Cleaning of bathroom b        0.030         0.001   0.976   0.570   0.280         0.030   0.922       0.042   0.348       0.001
      ap-value of Chi-Square test, b p-value of Spearman rho, red: Correlation is significant at the 0.01 level (2-tailed),
      green: Correlation is significant at the 0.05 level (2-tailed).

     To see if there is a correlation between these indoor air chemical concentrations and multiple
chemical sensitivities, the four MCS groups were merged into two by joining the somewhat suggestive,
problematic, and very suggestive group of respondents into one, and the not suggestive group
into the second group. It became obvious that respondents with an MCS risk were exposed to
significantly higher formaldehyde and increased TVOC concentrations (Figure 11), just like other
studies reported [51].
Atmosphere 2019,
Atmosphere 2019, 10,
                 10, 182
                     x FOR PEER REVIEW                                                                              13
                                                                                                                    15 of
                                                                                                                       of 20
                                                                                                                          22

                                                            (a)

                                                                                                  *

                                                   *

                                                            (b)
              Figure 11. IAQ levels by different MCS risk groups, (a) formaldehyde and (b) TVOC.
              Figure 11. IAQ levels by different MCS risk groups, (a) formaldehyde and (b) TVOC.
     For Kampongs, more variables correlate with MCS risk and sensitivities (Table 7).
     For Kampongs,
Influential                more variables
             personal attributes     are age correlate    with MCSand
                                              group, occupation,        riskincome.
                                                                             and sensitivities
                                                                                       Government  (Table   7).and
                                                                                                        (50%)    Influential
                                                                                                                      private
personal attributes
employees      (17%) andare age  group,
                            retired      occupation,
                                      people   (20%) are andmostly
                                                              income.affected
                                                                         Government      (50%) and
                                                                                 (categories           private employees
                                                                                                ‘problematic’       or ‘very
(17%) and retired
suggestive’   of MCS). people
                          There(20%)    are mostly
                                 is a possibility     affected
                                                   that the two(categories
                                                                  former groups‘problematic’
                                                                                     are exposedor to‘very  suggestive’
                                                                                                        chemicals          of
                                                                                                                     or other
MCS). There
exposures        is a possibility
             during    their work. that theconclusion
                                      This   two formercan  groups   are exposed
                                                               be derived    because  tothose
                                                                                         chemicals
                                                                                               who or     otherexposure
                                                                                                      report     exposures to
during
other    their work.
      chemicals           This aconclusion
                    also have     higher MCS  can   be In
                                                 risk.  derived    because
                                                          Indonesia,   more those
                                                                              than 50% whoofreport     exposure
                                                                                             office workers         to other
                                                                                                                 experience
chemicals
SBS,        also have
     as estimated     in a2008
                           higher   MCS
                               by the     risk. In Indonesia,
                                        Association              more than
                                                       of Indonesian          50%
                                                                         Public     of office
                                                                                 Health        workers
                                                                                           Expert         experience
                                                                                                    (IAKMI)     [20]. SBS,
as estimated    in 2008
     A very clear         by therelationship
                       positive   Association exists
                                                 of Indonesian
                                                         betweenPublic
                                                                    income  Health
                                                                              and MCSExpert   (IAKMI)
                                                                                           risk  as well[20].
                                                                                                           as sensitivities
in Kampongs. This is surprising, as usually higher income is associated with improved health.
In this case, a higher income goes      Table  7. Results
                                           along           of correlation
                                                    with the   possession  analysis.
                                                                             of ACs, which is found to be another
significantly    influential
        R = MCS Risk          factor   detrimental
                                       All             for  health.
                                                      Kampongs        Especially     the age   groups between 20–29,
                                                                                           Apartments
30–39, Sand   above 50 years have higher MCS risks. AlthoughAllhigher age inControlling
         = Sensitivities                                                                        other studies      has been
                                                                                                           for gender
associatedf = with
              femaleincreased healthR        S this R
                                         risks,        does not S explain the cause for the     R younger generations.
                                                                                                                    S
                                                                         R       S
           m = male                                                                        f          m       f       m
      Personal attributes
Atmosphere 2019, 10, 182                                                                          16 of 22

Here, the degree of stress is higher, and the respondents in these groups also more often have eczema.
These two variables, in turn, have an impact for the prediction of MCS risk. For the psychological
variable ‘stress’, 40% of those who indicate a score of 7 or more on the range between 0 (no stress) to
10 (very stressed) also have a problematic or very suggestive MCS risk, whereas among respondents
who feel less or not stressed (a score below 4), only 10% are likely to have MCS. Also, people with
health-issues such as asthma, eczema, or allergies are more suggestive of MCS. Twenty percent of the
very suggestive MCS risk cases have asthma, and 60% have eczema or allergies (as compared to an
average of 13%, 25%, and 32% respectively). This fits into findings of other studies as mentioned before.
In smoker households, less people face MCS risks (18% problematic and very suggestive respondents)
as compared to nonsmoking households (30%). The reason behind this reverse relationship between
smoking and/or ETS and MCS risk in Kampongs remains unclear, but it might be that people with
chemical intolerances automatically refrain from smoking and dislike the smell. Also, fabric softener
usage influences sensitivities (more).
     When it comes to the parameters connected to IAQ, two variables show a highly significant
correlation with MCS risk and sensitivities in Kampongs: ownership of an AC and observation of
mold growth in the house (Table 7). Eleven percent of occupants confronted with mold growth face
very suggestive MCS risks as compared to 3% of occupants in mold-free homes. Mold is a well-known
cause for respiratory diseases and SBS symptoms. This outcome confirms this finding once more.
The share of problematic or very suggestive risk of MCS within AC-owners is double of those who
do not have an AC (28% against 13%). Why exactly the possession of ACs is a risk factor needs to
be investigated. Possible explanations could be the spread of bacteria and viruses due to a lack of
maintenance or reduced or no ventilation in order to save energy and consequently the accumulation
of pollutants in the room.
     Other relevant factors in Kampongs are the number of furniture items in the living room (the more
furniture, the higher the share of MCS risk cases), modifications (20% of occupants in homes with
modifications have a problematic or very suggestive risk of MCS versus 10% within those who did
not modify their rooms), smell (the share of people with MCS who report a disturbing smell in their
homes is larger than those who do not), and the frequency of cleaning the rooms (18% of respondents
who clean every day have a problematic or very suggestive MCS risk, but 50% of those who clean
only once a week or less). However, regarding this point it must be noted that only 10% of Kampong
occupants indicate a less frequent cleaning than once per day. Similar findings were obtained in other
studies: SBS problems were associated with redecoration in China [43], odor or negative perception of
IAQ [74], and relieved in the case of regular cleaning [47].
     Lastly, indoor air concentrations of formaldehyde in Kampongs were inversely correlated with
MCS risk when it is assessed by the maximum values (see Figure 11): not suggestive respondents
were exposed to higher levels than some problematic and very suggestive respondents. It is possible
that formaldehyde concentrations, which in the case of Kampongs usually had lower long-term
averages than apartments but instead suddenly reached exceptionally high peaks, have a smaller
effect on the health of occupants than the more long-term exposure in some of the apartment cases.
Further investigation is recommended.

4. Conclusions
     The survey in Surabaya revealed that IAQ in apartment units and Kampong houses appears
to be poorer than in other countries. Formaldehyde and TVOC concentrations in apartments are
especially critical and exceed standards in many units. Owing to the hot, humid climate in Indonesia,
apartments and Kampong houses are confronted with high humidity and outdoor temperatures,
which impede thermal comfort and facilitate mold growth. Therefore, mold growth is highly
predicted in around 40% of the homes, with severe situations particularly in Kampongs. In Kampongs,
the occurrence of ETS potentially adds up to higher indoor air pollution.
Atmosphere 2019, 10, 182                                                                          17 of 22

      Asthma, eczema, and allergy prevalence were found to be worse in this sample of Indonesian
residents than in other studies around the world. For the prevalence of MCS and eczema, living in
a high-rise apartment in Indonesia is a risk factor, just as suggested in a study in Shanghai on allergic
diseases [53]. In apartment units, 39% are categorized as problematic or very suggestive of MCS,
whereas Kampong respondents’ level of MCS risk is comparable to other studies or even lower (17%).
      The results imply that the trend towards high-rise buildings is coupled with decreasing health.
Heightened chemical concentrations in indoor air and elevated stress levels are the major risk factors
found in this study, as well as people reporting asthma and eczema or negatively perceiving IAQ and
smells. Neglected cleaning also contributes. Meanwhile, stress, personal health condition (asthma,
eczema, allergies), and reports of smell make up strong factors for MCS risk in Kampong respondents.
Several additional building, interior, and behavioral factors are also influential. More windows and
daily room cleaning had a positive impact on health. ACs, mold reports, and more pieces of furniture,
on the other hand, resulted in higher MCS risk. Particularly interesting is the observation that people
with higher incomes were more affected, which is partially explainable by elevated stress levels in
higher income groups.
      This study attempted to be inclusive and raise awareness of the complex nexus between
sustainable development of buildings with regard to residential indoor air quality, energy efficiency,
and the health of occupants. However, the scale of the research in Surabaya and the aim to find
comparable studies on a world-wide scale led to only brief evaluations and more aspects need
to be analyzed and discussed in depth. All in all, shortcomings in the indoor environment in
high-rise apartments for the physical as well as the mental health of occupants have been identified.
Still, more investigations need to be carried out on the potential sources of the high TVOC and
formaldehyde concentrations, and which other environmental factors may increase occupants’ stress
at home. Enlarging the sample size, especially for measurements, is also essential for better reliability
and representativeness. To our knowledge, this is the first study of such an extent to be carried out in
Indonesia. It provides a broad basis for future studies.
      Nevertheless, there are several points in our study that need to be noted. First, the samples
of respondents in Kampongs and apartments differ a lot and it is thus difficult to compare them
directly. This problem was solved partly by evaluating the health and impacting factors of the two
building categories separately, but there is still a lack of information for a great part of occupants.
The interviewed apartment occupants are mainly aged between 20 and 29 years, which makes general
statements about the situation of all apartment residents questionable. Health impairments such as
asthma and allergies are relatively new developments, mostly affecting children and people of younger
ages, when they are exposed to certain triggers. This could be one reason for the high share of asthma
and allergies in the sample. More age groups above 30 years need to be included in future studies on
apartments, which most probably will also lead to a more heterogeneous sample of occupations.
      Second, interviewing people also relies on their ability to remember symptoms and actively
perceive characteristics of their indoor environment. This could lead to reporting bias, just as an
influence from the interviewer’s side by talking about the aim of the study cannot be fully excluded.
      Third, some instruments and evaluations require improvements. For QEESI, as the screening
instrument for MCS, the application of the American cut-off points can be questioned. Just as Hojo
et al. [63] suggest for the utilization of QEESI for the Japanese population, it could be necessary to
determine different cut-off points for the Indonesian population. Therefore, more studies are needed.
For IAQ measurements, it is important to conduct more detailed investigations to analyze quantitative
information about the constituents of air contaminants.
      This study focused on IAQ, but it could be informative to collect data on indoor environmental
aspects, too. Complaints of apartment respondents that they feel lonely, are disturbed by noise, or find
their flat too small are hints that there might be larger dissatisfaction with the housing conditions
in high-rise buildings in Indonesia. The study has revealed the first hints of questionable IAQ and
compromised health of occupants in apartments, which showcases the need for more sustainable and
You can also read