CHAPTER 6.1: MACROECONOMIC IMPACT AND POLICY
←
→
Page content transcription
If your browser does not render page correctly, please read the page content below
CHAPTER 6.1:
                      MACROECONOMIC IMPACT AND POLICY

ABSTRACT
In the decade before the Covid-19 pandemic, the South African economy had already been bedevilled
by sluggish growth, severe unemployment, extreme poverty and inequality, and low levels of saving
and investment. The pandemic, and the lockdown measures that followed, amplified these challenges
in an unprecedented manner, with real GDP per capita falling to levels last seen in 2005. The lockdown
sharply reduced consumption and production in various sectors, especially during the initial hard
lockdown phase in the second quarter of 2020. Overall, real gross domestic product fell by 7% in 2020
– the largest annual contraction in a century. Gross fixed capital formation fell by 17,5%, as investors
predictably reduced their spending. The various restrictions on activity necessitated by the pandemic
led to a significant loss of livelihoods and a loss of business and investor confidence, as reflected by
the poor economic growth and jobs numbers for 2020. However, at a sectoral level, the impact of the
pandemic was profoundly asymmetrical, with stark differences between relative ‘winners’ and
‘losers’. The fiscus, which had already been in a precarious position, experienced a sharp reduction in
revenue because of lower levels of economic activity. This, combined with Covid-19 containment and
stimulus spending demands, caused the budget deficit to widen even further. Monetary authorities
responded by cutting interest rates to historic lows. The repo rate was rapidly reduced from 6,25%
pre-lockdown to 3,5% in July 2020, where it has remained. Despite these and other policy
interventions, the economic costs and fallout of the pandemic and lockdown restrictions will likely be
felt for many years to come, as the government struggles with a heavily constrained budget and
stubborn inefficiencies in the implementation of key policy reforms. Finally, it should be noted that
any conclusions in this chapter on the Covid-19 response are still preliminary and will be refined based
on stakeholder consultations and feedback from readers.

DISCLAIMER
 This Country Report on the measures implemented by the South African government to combat the impact
 of the Covid-19 pandemic in South Africa (including individual research reports that may be enclosed as
 annexures) were prepared by various professional experts in their personal capacity. The opinions expressed
 in these reports are those of the respective authors and do not necessarily reflect the view of their affiliated
 institutions or the official policy or position of the South African government.

Chapter 6.1. Macroeconomics                   DRAFT 23/05/2021                                                      i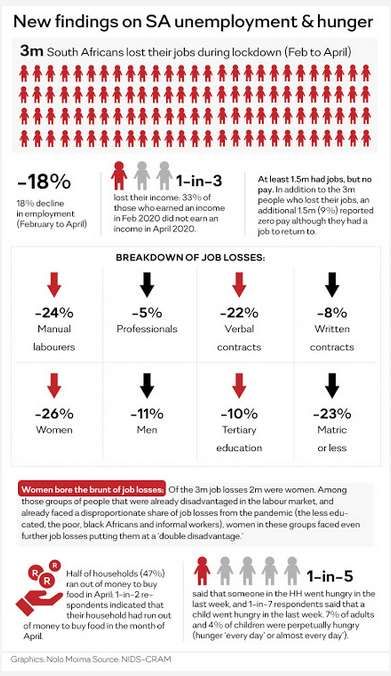
ACKNOWLEDGEMENTS
This research paper was prepared by:

 Name                      Designation and affiliation                                  Sector and role
                           Associate Professor: Public Policy, Finance and Economics,
 Prof. Tania Ajam                                                                       Economics (2020)
                           School of Public Leadership, University of Stellenbosch
                           Associate Professor: Department of Economics, University
 Prof. Heinrich Bohlmann                                                                Economics (2021)
                           of Pretoria

How to cite this report:
Ajam, T. & Bohlmann, H. R., 2021. Macroeconomic impact and policy. South Africa Covid-19 Country
Report [Interim draft]. DPME (Department of Planning, Monitoring and Evaluation), GTAC
(Government Technical Advisory Centre) & NRF (National Research Foundation), Pretoria: May.

Chapter 6.1. Macroeconomics                DRAFT 23/05/2021                                                ii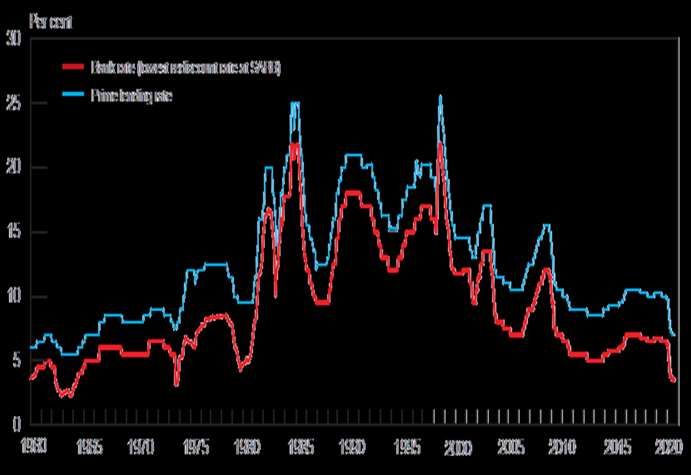
ABBREVIATIONS AND ACRONYMS
CPI             consumer price index
EPWP            Expanded Public Works Programme
GDP             gross domestic product
MEC             Member of the Executive Council
MTBPS           Medium Term Budget Policy Statement
NIDS-CRAM       National Income Dynamics Study Coronavirus Rapid Mobile [survey]
PPE             personal protective equipment
SARB            South African Reserve Bank
SARS            South African Revenue Service
SME             small or medium enterprise
TERS            Temporary Employee/Employer Relief Scheme
UIF             Unemployment Insurance Fund

Chapter 6.1. Macroeconomics              DRAFT 23/05/2021                          iii
CONTENTS
Introduction ...................................................................................................................................... 1

Macroeconomic impacts ................................................................................................................... 2
Economic growth .............................................................................................................................. 2
Labour market ................................................................................................................................... 7

Government’s Covid-19 economic response .................................................................................... 10

Monetary measures and costs ......................................................................................................... 11

Fiscal measures and costs ................................................................................................................ 14
February 2020 Budget ..................................................................................................................... 14
June 2020 Covid-19 Supplementary Budget ..................................................................................... 14
October 2020 Medium Term Budget Policy Statement .................................................................... 15
February 2021 Budget ..................................................................................................................... 17
Targeted interventions .................................................................................................................... 18
     Temporary Employee/Employer Relief Scheme ......................................................................... 18
     Covid-19 social relief of distress grant ....................................................................................... 19
Constraints ...................................................................................................................................... 19
     State capacity ............................................................................................................................ 19
     Grants to non-profit organisations ............................................................................................ 19
     Procurement ............................................................................................................................. 20

Preliminary lessons learnt................................................................................................................ 21

Immediate interventions ................................................................................................................. 22

References ...................................................................................................................................... 24

Annex 6.1.1: Expenditure by function .............................................................................................. 26

Chapter 6.1. Macroeconomics                                 DRAFT 23/05/2021                                                                      iv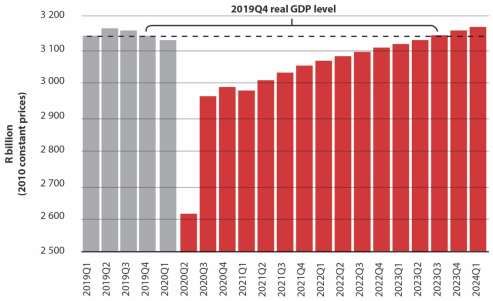
LIST OF TABLES
Table 6.1.1: Impact on key macroeconomic variables and projections, 2017 to 2023 (%) .................. 3
Table 6.1.2: Economic response measures ....................................................................................... 10
Table 6.1.3: SARB monetary response measures.............................................................................. 11
Table 6.1.4: Covid-19 Supplementary Budget, main budget framework, 2020/21 ............................ 14
Table 6.1.5: Consolidated expenditure by function, 2020 MTBPS ..................................................... 16
Table 6.1.6: Main budget framework, 2021 Budget Review ............................................................ 17
Table 6.1.7: Consolidated expenditure by function, 2021 Budget Review......................................... 26

LIST OF FIGURES
Figure 6.1.1: Real economic growth per quarter, 2018 to 2020 (%) ................................................... 2
Figure 6.1.2: International comparison of annualised economic growth, Quarter 2 2020 ................... 3
Figure 6.1.3: Real economic growth and projections, 2010 to 2023 (%) ............................................. 3
Figure 6.1.4: Sectoral growth, 2020 (%) ............................................................................................. 4
Figure 6.1.5: Anticipated recovery in real GDP ................................................................................... 6
Figure 6.1.6: Deviations from baseline GDP forecast .......................................................................... 6
Figure 6.1.7: Impact on employment, 2014 to 2020 .......................................................................... 7
Figure 6.1.8: NIDS-CRAM Survey Wave 1 ........................................................................................... 8
Figure 6.1.9: Labour market transitions, February to October 2020 ................................................... 9
Figure 6.1.10: Ten-year government bond yield, September 2019 to November 2020 ..................... 12
Figure 6.1.11: Interest rates, 1960 to 2020 (%) ................................................................................ 12
Figure 6.1.12: Inflation rate, 1960 to 2020 (% change over 12 months) ............................................ 13
Figure 6.1.13: Rand-US$ exchange rate, January to September 2020 ............................................... 13
Figure 6.1.14: Rand effective exchange rate, 2016 to 2021 .............................................................. 13
Figure 6.1.15: Main budget interest as % of revenue, Covid-19 Supplementary Budget ................... 15
Figure 6.1.16: Debt outlook scenarios, June 2020 Covid-19 Supplementary Budget ......................... 15
Figure 6.1.17: Debt outlook scenarios, 2020 MTBPS and Covid-19 Supplementary Budget............... 16
Figure 6.1.18: National government gross loan debt, 2006/07 to 2028/29 (% of GDP) ..................... 18

Chapter 6.1. Macroeconomics                           DRAFT 23/05/2021                                                               v
INTRODUCTION
In the decade before the Covid-19 pandemic, the South African economy had already been bedevilled
by sluggish growth, severe unemployment, extreme poverty and inequality, and low levels of saving
and investment. The pandemic, and the lockdown measures that followed, amplified these challenges
dramatically. The various channels through which the health and economic fabric of the country were
simultaneously affected placed policymakers in uncharted territory, having to manage the most
unenviable of balancing acts. The economy was hard hit by supply and demand shocks that disrupted
domestic production, international trade, and investor spending. The initial hard lockdown phase
sharply reduced the consumption of many goods and services, while productive activities in sectors
deemed non-essential ground to a halt. This led to a significant loss of livelihoods and a further loss of
business and consumer confidence. The net result was the largest contraction in economic activity in
over a century, with the real gross domestic product (GDP) falling by 7% in 2020. The fiscus, which had
already been in a precarious position, experienced a sharp reduction in revenue because of the
reduced economic activity. This, combined with Covid-19 containment and stimulus spending to
mitigate the worst of the health and economic fallout, caused the budget deficit to widen even further.

It has been difficult to disentangle the costs of the pandemic itself from the disruption associated with
behavioural responses and lockdown regulations, both nationally and internationally. At this stage,
therefore, this analysis considers the overall impacts and trends. The quantum of the economic costs
depends on the trajectory of infections, the effectiveness of response measures, the extent of the
lockdown, and the exit strategy employed. Some of these costs were felt immediately; others are
becoming clearer over time (Ajam, 2020).

The impact of government measures differed across sectors, depending on whether these sectors
were deemed essential or non-essential, for example. The pandemic necessitated large, coordinated,
targeted and timely fiscal and monetary measures in three main areas:
•   Funding was needed for public health and related interventions, such as emergency care, mass-
    based testing, and processing; the procurement of personal protective equipment (PPE), medical
    equipment (e.g., ventilators), and supplies; surveillance, tracking and contact tracing; quarantine
    accommodation; and public communication. Related support functions, such as temporary field
    hospitals, public order policing, and the deployment of the defence force also required funding.
•   Interventions were needed to mitigate the economic fallout of the lockdown and social distancing
    on companies and workers. Government provided bridging liquidity to sustain companies as going
    concerns to facilitate a fast post-lockdown recovery, prevent insolvencies and lay-offs, and
    provide wage support. Monetary authorities responded swiftly, with the South African Reserve
    Bank (SARB) reducing the repo rate from 6,25% before the pandemic to 3,5% by July 2020. Various
    banks and financial institutions granted distressed individuals and companies loan payment
    holidays and other forms of accommodation. The Presidency launched the Reconstruction and
    Recovery Plan to stimulate the economy and boost its ailing infrastructure.
•   Social safety nets were provided to prevent hunger and ensure food security.

Chapter 6.1. Macroeconomics                DRAFT 23/05/2021                                             1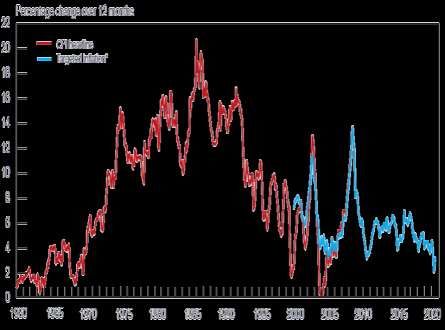
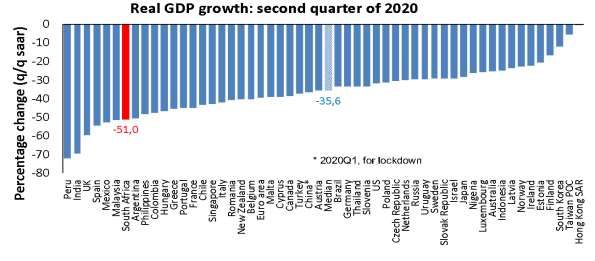
This chapter considers the impact of the pandemic on the overall economy, along with the fiscal and
monetary policy responses. Its sectoral impact is discussed in Chapters 6.2 to 6.5. Any conclusions on
the strengths and limitations of the Covid-19 response are still preliminary and will be refined based
on stakeholder consultations and feedback from readers. Also, this report focuses on the first and
second waves of the pandemic. Policy responses during the further progression of the pandemic will
be discussed in the second edition of the Country Report.

MACROECONOMIC IMPACTS
This chapter draws on official secondary data sources, including the National Treasury, the SARB, and
the Auditor-General of South Africa, up to the end of 2020.

ECONOMIC GROWTH
South Africa’s economy had already been in technical recession before the pandemic (Figure 6.1.1) as
real GDP contracted in three consecutive quarters (-0,8%, -1,4% and -1,8% respectively) until the first
quarter of 2020 (National Treasury, 2020c). More worrying was that in per capita terms, real GDP had
been declining since 2015, leaving little or no buffer for the working class to accommodate another
economic shock.

Figure 6.1.1: Real economic growth per quarter, 2018 to 2020 (%)

Note: Quarter-on-quarter, seasonally adjusted and annualised figures
Source: National Treasury, 2021

After the hard lockdown started on 27 March 2020, real GDP in the second quarter plummeted by
17,1% quarter-on-quarter or 51% on a seasonally adjusted, annualised basis – the country’s largest-
ever recorded decline in economic activity.1 It dwarfed that of the global economic crisis, which saw
annualised growth rates fall to -2,3% in the last quarter of 2008 and to -6,1% and -1,4% in the first two

1
  When an economy experiences large temporary shocks or rebounds, looking at annualised quarterly growth
figures may well be misleading. For example, the annualised growth figures for the South African economy showed
an exaggerated 51,7% drop in the second quarter of 2020, followed by a 67,3% recovery in the third. Statistics
South Africa has since decided to place less emphasis on annualised figures for headline growth indicators.

Chapter 6.1. Macroeconomics                  DRAFT 23/05/2021                                                2
quarters of 2009. Also, as Figure 6.1.2 shows, this quarterly contraction was among the most severe
in the world, well above the median (-35,6%) and exceeded by only six other countries in the sample,
such as Peru, India, the United Kingdom and Spain (SARB, 2020).

Figure 6.1.2: International comparison of annualised economic growth, Quarter 2 2020

Source: SARB, 2020

As expected, economic growth bounced back strongly in the third quarter of 2020 when lockdown
restrictions were eased. However, the recovery in the third and fourth quarters of the year did not
fully offset the initial decline. In March 2021, it was revealed that the economy had contracted by 7%
in real terms in 2020. Gross fixed capital formation and exports had been particularly hard hit, falling
by 17,5% and 10,3%, respectively (Stats SA, 2021a; SARB, 2021a).

By March 2021, lockdown restrictions had largely been lifted, but the travel and hospitality industries
remained severely affected by international travel restrictions and a loss of traveller confidence
(Chapter 6.3). The National Treasury currently expects economic growth of 3,3% for 2021 and 2,2%
for 2022 (Figure 6.1.3 and Table 6.1.1). Whilst growth above 3% would be the highest South Africa has
achieved since 2011, it would not be nearly enough to repair the damage of 2020 in a reasonable time.

Figure 6.1.3: Real economic growth and projections, 2010 to 2023 (%)

Source: National Treasury, 2021

Chapter 6.1. Macroeconomics               DRAFT 23/05/2021                                            3
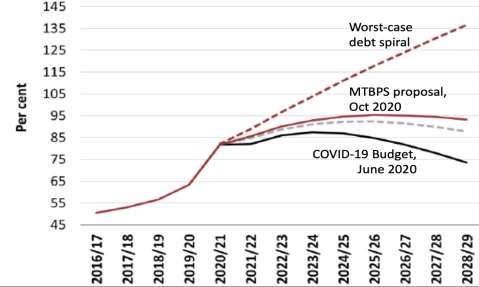
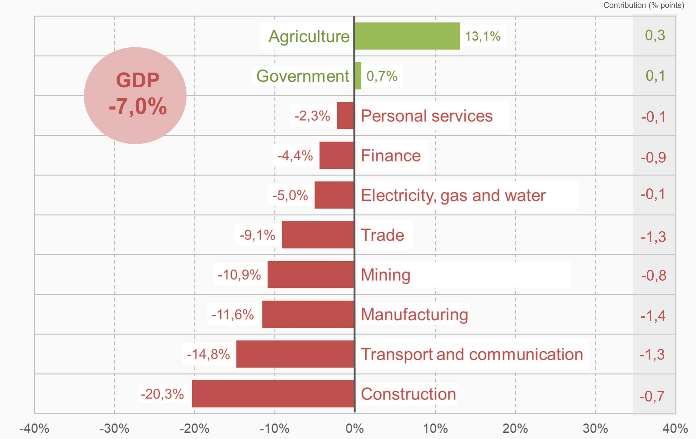
Table 6.1.1: Impact on key macroeconomic variables and projections, 2017 to 2023 (%)

Source: National Treasury, 2021

Sectoral growth figures for 2020, shown in Figure 6.1.4 provide additional insight into the asymmetric
economic effects of the pandemic. Only the agricultural sector emerged a relative winner in 2020 on
the back of a good rainfall season and the comparatively minor restrictions during lockdown (Chapter
6.2). The slight growth in the government sector was accompanied by a large increase in debt. Future
government spending will now have to strike a careful balance between supporting the recovery effort
(especially in heavily affected sectors such as construction, transport, and tourism) and the general
socio-economic and development needs of the country that existed before the pandemic. Apart from
the agriculture and government sectors, all other sectors declined in real terms; the construction,
transport (Chapter 6.4), and hospitality industries (Chapter 6.3) performed worst because of their
unique exposure to the lockdown regulations and subsequent economic fallout.

Figure 6.1.4: Sectoral growth, 2020 (%)

Source: National Treasury, 2021

At present, conservatively projected growth will only see South Africa return to pre-pandemic levels
of real GDP by the end of 2023 – one of the slowest anticipated recoveries among the G20 group of

Chapter 6.1. Macroeconomics               DRAFT 23/05/2021                                          4
countries. This is mainly due to the negative momentum in the economy that predated the pandemic.
With real GDP per capita sinking to 2005 levels by the end of 2020, average South African income
levels have effectively been set back more than a decade.

As with investment, international trade was heavily affected in the first and second waves of the
pandemic. Both imports and exports fell significantly in 2020, by 16,6% and 10,3% respectively (SARB,
2021). The impact peaked during the second quarter of 2020, when most of the global economy faced
lockdown restrictions that either directly limited trade or caused significant disruption to the supply
chain. South Africa reported its first current annual account surplus since 2002 on the back of strong
export commodity price growth and depressed import demand. Interestingly, despite the large
increase in the government borrowing requirement, for the first time in nearly 20 years domestic
savings was sufficient to meet the investment financing demand.

Inflation, as measured by the consumer price index (CPI), was predictably subdued during 2020,
coming in at 3,3% for the year, as a result of lockdown restrictions and limited demand-side pressure.
Inflation is projected remain muted and below the SARB’s mid-range target of 4,5% over the medium
term, suggesting that low interest rates should be sustainable over this time horizon.

The effects of the lockdown were exacerbated by extensive load shedding that persisted into 2021,
despite the easing of demand-side pressure; worse, there is little hope of improvement in the near
term (Chapter 6.6). However, other conditions are conducive to a recovery: production will be boosted
in 2021 by a reversal of the steep destocking that occurred in 2020, a recovery in business investment,
and the apparent buoyancy of the global recovery. Also, prices for export commodities have risen, and
relief from drought in many areas has increased agricultural exports (Chapter 6.2). At the end of 2020,
South Africa’s terms of trade was quite favourable (SARB, 2020).

These conducive conditions notwithstanding, the negative impact of the pandemic is expected to
persist, as noted. Figure 6.1.3 and Table 6.1.1 above, which show the short-term economic forecasts
produced by the National Treasury in the February 2021 Budget Review, indicate that although output
should rebound somewhat, it may only return to pre-pandemic levels in 2023. Figure 6.1.5 shows
these projections on a quarterly basis. Whilst great uncertainty dominates these forecasts, the slow
and protracted nature of the recovery projected in these estimates highlights the cautious approach
authorities are currently forced to adopt (National Treasury, 2021).

The Treasury also published a sensitivity analysis to these projections, as per Figure 6.1.6. Scenario A
assumes better than anticipated implementation and pace of fiscal and essential economic reforms,
while Scenario B reflects the impact of another wave of Covid-19 infections, with a weaker vaccine
response failing to stem further infections. As can be seen in this analysis, downside risks weigh heavily
on the already poor outlook. The deviations shown in Figure 6.1.6 should be interpreted relative to
the projected baseline growth shown in Figure 6.1.3 of 3,3%, 2,2% and 1,6% for 2021, 2022 and 2023,
respectively.

Chapter 6.1. Macroeconomics                DRAFT 23/05/2021                                             5
Figure 6.1.5: Anticipated recovery in real GDP

Source: National Treasury, 2021

Figure 6.1.6: Deviations from baseline GDP forecast

Source: National Treasury, 2021

A final note on economic growth relates to the Presidency’s Reconstruction and Recovery Plan
announced at the end of 2020. Whilst this is discussed in more detail later, it is worth noting the
potential contribution of this plan to a recovery in investment. South Africa’s ailing infrastructure is
set to receive a huge boost, with particular emphasis on energy and green economy ventures. The
combination of short-term spending stimulus and long-term productivity benefits is ideal for
improving the economic growth prospects of the country in the wake of Covid-19.

Chapter 6.1. Macroeconomics               DRAFT 23/05/2021                                            6
LABOUR MARKET
Figure 6.1.7 shows the impact of the lockdown on the labour force in terms of employment. This data
from the Quarterly Labour Force Survey indicates that over 2 million jobs were lost during the second
quarter of 2020, when strict lockdown measures were in place. The majority of people who lost their
jobs were informal sector workers and those in sectors hit hardest by the restrictions, such as
construction and tourism. By the end of 2020, total employment was still down nearly 1,4 million
(8,5%) relative to levels at the end of 2019.

Figure 6.1.7: Impact on employment, 2014 to 2020

Source: Stats SA, 2021b

As did the annualised GDP growth figures, unemployment figures initially caused confusion because
of the way the official ‘narrow’ definition of unemployment is calculated. With unemployed workers
unable to actively look for work – a requirement to be considered part of the labour force – during
the second quarter of 2020 because of lockdown restrictions, official unemployment actually fell,
despite the massive number of jobs lost. This anomaly was reversed once lockdown restrictions had
been eased. The official unemployment rate reached a record high of 32,5% during the fourth quarter
of 2020. In terms of the expanded definition, which adds discouraged work seekers, unemployment
was an even more depressing 42,6% (Stats SA, 2021b).

The National Income Dynamics Study (NIDS) ran the first Coronavirus Rapid Mobile (CRAM) survey in
June 2020, asking questions about February and April 2020. Wave 2 asked questions about the
experience of the 6000 adult respondents during June 2020. It found that employment may have
fallen by up to 3 million people (-18%) from 17 million in February 2020 to only 14 million in April 2020
(Figure 6.1.8). Also, the jobs lost between February and April had not returned by June. In addition to
the people who lost their jobs, 1,4 million were furloughed – they did not work or receive salaries but
could return to their jobs at a later stage. By June 2020, the number of furloughed workers had
returned to pre-Covid levels, with half being ‘re-employed’ and about 40% being retrenched.

Chapter 6.1. Macroeconomics                DRAFT 23/05/2021                                            7
Figure 6.1.8: NIDS-CRAM Survey Wave 1

Source: Spaull, Ardington et al., 2020

For many people, childcare was a significant problem during lockdown. About 3,4 million female and
1,7 million male respondents reported that looking after children in June 2020 either prevented them
from going to work or made work very difficult. Similar numbers said they struggled to work their
usual hours or search for jobs for this reason.

Chapter 6.1. Macroeconomics               DRAFT 23/05/2021                                        8
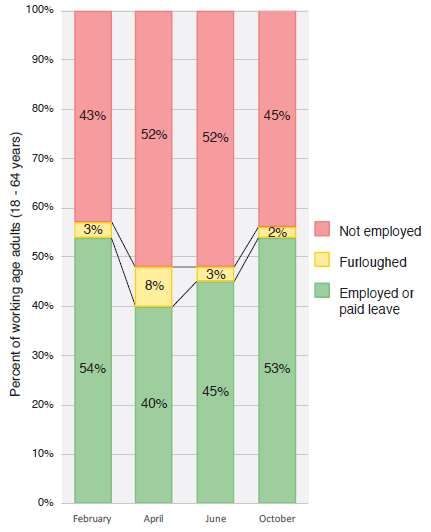
Vulnerable employees (especially women, young, rural, unskilled manual and less-educated workers)
bore the brunt of the job losses. The poorest 50% of workers saw a net decline of 31% in employment,
whereas the figure for the richest 25% was only 3%. Informal workers experienced a net 14% decline,
twice that of workers in the formal sector (Spaull, Oyenubi et al., 2020).

About 30% of newly retrenched or furloughed people had no access to social grants (Chapter 5.3).
About 47% of respondents said they had run out of money to buy food in a single month (April), up
from 21% of households before the pandemic. By end-June, a UNDP (2020) study concluded that the
stimulus package might be insufficient, given that households would lose at least 40% of their income
even if they qualified for the special Temporary Employee/Employer Relief Scheme (TERS).

The third wave of the NIDS-CRAM survey (Wave 3) was conducted in October 2020. It showed
evidence of a strong labour market recovery as lockdown restrictions were progressively eased. These
findings were supported by the results of Statistics South Africa’s Quarterly Labour Force Survey for
the period. Although the survey did not show quite as strong a recovery as did NIDS-CRAM, this might
be due to timing and coverage effects. As Figure 6.1.9 shows, in Wave 3 the percentage of people
employed was much closer to its pre-pandemic level in February 2020, albeit still fractionally lower.

Figure 6.1.9: Labour market transitions, February to October 2020

Source: Spaull, Daniels et al., 2021

Chapter 6.1. Macroeconomics               DRAFT 23/05/2021                                              9
GOVERNMENT’S COVID-19 ECONOMIC RESPONSE
Before the lockdown, government announced a raft of initiatives to cushion the impact of the
pandemic (Table 6.1.2). It aimed to contain the virus, extend a social safety net, reduce job losses, and
prevent a collapse in wage payments. The fiscal and monetary measures, however, amounted to only
R3,7 billion (0,1% of 2018 GDP or US$4 per capita) if the costs of direct health interventions were
excluded. In April 2020, President Ramaphosa announced a more substantial package of R500 billion.
The first R310 billion comprised tax relief, a credit guarantee scheme, and wage protection. The Covid-
19 Supplementary Budget, tabled on 24 June 2020, set out another R145 billion, financed mainly from
reprioritised spending (e.g., delaying infrastructure projects) and loans from the International
Monetary Fund, the New Development Bank, and the African Development Bank. By the end of 2020,
the Presidency published the basic details of its formal Reconstruction and Recovery Plan, which aims
to stimulate the economy. The plan promises large-scale investment in basic infrastructure, with an
emphasis on promoting energy security and the green economy. The February 2021 Budget prioritised
significant resources and funding in this regard, although final details are still being worked out.

Table 6.1.2: Economic response measures
 1    The Unemployment Insurance Fund (UIF) provided a Temporary Employee/Employer Relief Scheme
      (TERS) of over R30 billion to enable companies to pay employees directly and avoid retrenchment.
 2    The Employment Tax Incentive was expanded to provide a subsidy of up to R500 per month for four
      months for private sector employees earning less than R6 500. Also, the payment of employment tax
      incentive reimbursements was to be accelerated.
 3    From 1 April, social grants for older persons and disability grants increased to R1 860 and those for war
      veterans and persons older than 75 years to R1 880. Foster child grants rose to R1 040 per child, care
      dependency grants to R1 860, and child support grants to R440 per child.
 4    R500 million was allocated to assist distressed small and medium enterprises (SMEs), using a simplified
      application process.
 5    R3 billion was allocated to industrial funding for vulnerable firms and fast-track financing for companies.
 6    R200 million was allocated for SMEs in the tourism and hospitality sector.
 7    The Industrial Development Corporation allocated R3 billion in funding to allow firms that produce
      essential goods to scale up operations.
 8    Tax-compliant businesses with a turnover of less than R50 million were permitted to delay 20% of their
      pay-as-you-earn liabilities between April and July 2020, along with a portion of provisional corporate
      income tax payments, without penalties or interest over the next 6 months.
 9    The South African Future Trust was established to provide a further R1 billion in zero-interest funding to
      distressed SMEs. Government provided seed funding – R100 million from the National Treasury and
      R50 million from the National Lottery.
 10   Employer contributions to the Skills Development Fund were suspended for four months.
 11   The Compensation Fund was to pay employees who fell ill through exposure at their workplace.
 12   All major banks announced options for payment holidays and debt restructuring for SMEs and
      individuals unable to meet their obligations.
 13   Commercial banks were exempted from provisions of the Competition Act to enable them to develop
      common approaches to debt relief and other necessary measures.
 14   The Presidency’s Reconstruction and Recovery Plan was announced at the end of 2020, promising large-
      scale infrastructure and energy investments to help stimulate economic growth and job creation.

Chapter 6.1. Macroeconomics                   DRAFT 23/05/2021                                                  10
MONETARY MEASURES AND COSTS
The Reserve Bank is the monetary authority, the macro- and micro-prudential regulatory authority for
the financial system, and the banker to the central government. Table 6.1.3 outlines the SARB’s Covid-
19 response, which includes more accommodative monetary policy, a temporary relaxation of macro-
prudential requirements, and a loan guarantee scheme, among other measures.
Table 6.1.3: SARB monetary response measures
1 Cut the repurchase (‘repo’) policy rate by 100 basis points to 5,25% on 20 March 2020, and again to
3,5% in July 2020, thereby injecting much-needed liquidity.
2 Signalled a more accommodative monetary policy stance, thereby influencing expectations.
3 Protected the functioning of financial markets, particularly the bond market, by purchasing government
bonds across the entire yield curve on illiquid secondary markets. This supported liquidity, bolstered
confidence in the bond market, and lowered long-term interest rates by reducing the bond supply.
4 Enabled temporary debt service relief to firms and individuals by temporarily amending Directive 7 of
2015 to lower the minimum capital requirements for banks relating to credit risk.
5 Helped sustain access to term credit by temporarily relaxing macro-prudential regulatory requirements:
lowering the liquidity coverage ratio from 100% to 80%; temporarily reducing the systemic risk buffer
(Pillar 2A) requirement to zero; and allowing banks to draw down on their capital conservation buffer of
2,5% as per regulation 38(8)(e)(iv)(D). This aimed to facilitate the extension of bank credit to sectors in
need of liquidity, particularly households and small businesses.
6 Initiated a debt relief programme by issuing guidelines on 25 March 2020 for debt relief to bank
customers. By 28 September 2020, commercial banks had extended R33,61 billion in payment breaks
on credit agreements as voluntary relief (BASA, 2020).
7 Launched a loan guarantee scheme to incentivise banks, through a risk-sharing arrangement, to extend
guaranteed loans at preferential rates (prime) to distressed businesses with an annual turnover of less
than R300 million for operational expenses (e.g., salaries and rents). Firms should have been in good
standing before the pandemic, be registered for taxes, have insufficient borrowing capacity to fund
monthly operating expenses, and have been adversely affected by the lockdown. Banks get funds from
the SARB at the repo rate plus 0,5% and on-lend to firms at the repo rate plus 3,5%, with 5 years for
repayment and a 6-month payment holiday (National Treasury, 2020a). Any losses from loan defaults
are first offset against margins earned on the portfolio of Covid-19 loans. Subsequent losses are offset
against a guarantee fee payable to the National Treasury by banks, set at 0,5% of the loan. Any further
losses are shared, with the first 6% absorbed by the banks and the rest by the National Treasury. See
Chapter 6.5 for a more detailed discussion of this scheme.
Figure 6.1.10 shows that the day after the lockdown was announced on 23 March 2020, yields on long-
term bonds shot up from 9% to 13%. The SARB took the unprecedented decision to inject liquidity into
secondary bond markets by buying government bonds (as per Table 6.1.3). The bond markets
stabilised, with yields dropping to around 11,4% in nominal terms and 8% in real terms. However,
yields remained much higher than those for risk-free assets in comparable emerging markets; this
potentially undermined the sustainability of debt servicing. Nominal yields continued to decline,
reaching 9,5% by November 2020, although rates remained fairly stable in real terms.
By adhering to prudent monetary policy and maintaining a flexible exchange rate, the SARB has helped
maintain macroeconomic stability. It kept the repo rate at 3,5% from July 2020, where it remains in
Chapter 6.1. Macroeconomics DRAFT 23/05/2021 11May 2021 – the lowest since its inception in 1998. This was appropriate given that inflation had also been well below the SARB’s mid-range inflation target since 2020 (Figure 6.1.11). Figure 6.1.10: Ten-year government bond yield, September 2019 to November 2020 Source: Trading Economics, 2020 Figure 6.1.11: Interest rates, 1960 to 2020 (%) Source: SARB, 2020 The inflation rate is shown in Figure 6.1.12 and the exchange rate in Figure 6.1.13: March to May 2020 saw rapid depreciation of the nominal rand-US dollar exchange rate, which dropped to a record low of R19,36 to the US dollar on 6 April. Although the currency has since appreciated, it remains slightly weaker than pre-pandemic levels, fluctuating between R14,50 and R15,50 to the US dollar during 2021. The strong recovery of the rand since the second half of 2020 is illustrated in Figure 6.1.14, which shows the effective exchange rate. The South African currency outperformed all other emerging market currencies during this period up to the end of the first quarter of 2021, further damaging the country’s beleaguered manufacturing sector (Chapter 6.5). Chapter 6.1. Macroeconomics DRAFT 23/05/2021 12
Figure 6.1.12: Inflation rate, 1960 to 2020 (% change over 12 months)

Source: SARB, 2020

Figure 6.1.13: Rand-US$ exchange rate, January to September 2020

Source: SARB, 2020

Figure 6.1.14: Rand effective exchange rate, 2016 to 2021

Source: SARB, 2021

Chapter 6.1. Macroeconomics             DRAFT 23/05/2021                13
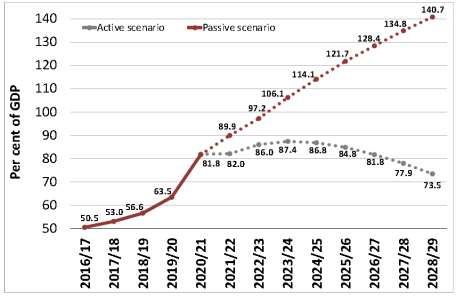
FISCAL MEASURES AND COSTS
The next section provides a broad timeline of fiscal measures during the Covid-19 pandemic, from the
February 2020 Budget to that of 2021. Some specific relief measures are discussed – the UIF’s TERS
and the Covid-19 social relief of distress grant; this is followed by a brief look at some of the non-
financial constraints in the provision of fiscal support.

FEBRUARY 2020 BUDGET
Despite government’s stated commitment to fiscal consolidation for the better part of the last decade,
the fiscus faced significant sustainability challenges even before the pandemic. The February 2020
Budget anticipated a budget deficit of 6,8% of GDP for the 2020/21 fiscal year even before the effects
of Covid-19 started to unfold, up from an already precarious 5,7% the previous year. With economic
growth stagnating, and falling in per capita terms since 2015, tax revenues had already been under
pressure. Notwithstanding the structural deterioration in the economy, significant fiscal consolidation
has long been deferred to fund, for example, transfers to state-owned enterprises (e.g., Eskom), new
entitlements (e.g., free university education), and the escalating costs of the public service wage bill.

JUNE 2020 COVID-19 SUPPLEMENTARY BUDGET
By June 2020, the fiscal situation had deteriorated significantly. The Covid-19 Supplementary Budget
anticipated a main budget deficit of 14,6% for 2020/21 (Table 6.1.4) and a consolidated deficit
(including municipalities, state-owned entities, and social security funds) of 15,7% of GDP. It envisaged
a sharp rise in debt service costs to nearly 22% of main budget revenue (Figure 6.1.15) and 11,6% of
consolidated expenditure in 2020/21. The debt-to-GDP ratio was expected to increase from 64% in
2019 to 82% in 2020/21. If a passive approach were followed, the debt ratio could spiral to 141% by
2028/29. To mitigate this risk, the minister of finance proposed an ‘active’ debt stabilisation trajectory
which aimed to cap the debt-to-GDP ratio at a peak of 87% in 2023/24 before reducing it to under
74% by 2028/29 (Figure 6.1.16).

Table 6.1.4: Covid-19 Supplementary Budget, main budget framework, 2020/21

Source: National Treasury, 2020b

Chapter 6.1. Macroeconomics                DRAFT 23/05/2021                                            14
Figure 6.1.15: Main budget interest as % of revenue, Covid-19 Supplementary Budget

Source: National Treasury, 2020b

Figure 6.1.16: Debt outlook scenarios, June 2020 Covid-19 Supplementary Budget

Source: National Treasury, 2020b

OCTOBER 2020 MEDIUM TERM BUDGET POLICY STATEMENT
By October 2020’s Medium Term Budget Policy Statement (MTBPS), the outlook for economic growth
had been reduced from -7,2% to -7,8% in 2020/21. Instead of the three-year fiscal consolidation
proposed in June 2020, the consolidation period was extended to five years, with a debt-to-GDP ratio
of 81,8%, as against the 87% anticipated in June 2020 (Figure 6.1.17). Whereas the revised 2020/21
outcome in the MTBPS was largely the same as in the Covid-19 Supplementary Budget (Table 6.1.4
above), the main budget deficits over the medium term were projected at -10,1%, -8,6% and -7,3% of
GDP in the next three years.

Chapter 6.1. Macroeconomics             DRAFT 23/05/2021                                         15
Figure 6.1.17: Debt outlook scenarios, 2020 MTBPS and Covid-19 Supplementary Budget

Source: National Treasury, 2020c

Table 6.1.5 shows medium-term expenditure priorities from the 2020 MTBPS. Learning and culture
(19,5%), social development (15,5%) and health (11,1%) are the largest expenditure items in 2020/21,
accounting for almost half of consolidated spending (including the June 2020 adjustments). Next
largest are the national debt service obligations. Debt is the fastest-growing expenditure item,
escalating by about 16,1% a year between 2021/22 and 2023/24.

Table 6.1.5: Consolidated expenditure by function, 2020 MTBPS
                                      2019/20   2020/21    2021/22   2022/23     2023/24 Average
                                     Outcome    Revised2     Medium-term estimates             annual
                                                                                              growth
                                                                                             2020/21 –
R billion                                                                                     2023/24
Learning and culture                   383.4      398.3     399.0      406.7         411.3       1.1%
Health                                 223.2      226.2     235.3      242.0         246.3       2.9%
Peace and security                     212.8      216.8     210.7      213.3         214.5      -0.4%
Community development                  197.0      208.2     221.1      232.2         236.4       4.3%
Economic development                   196.7      211.3     224.7      236.3         242.0       4.6%
General public services                 66.2       69.8      71.0       70.4          71.2       0.6%
Social development                     298.7      315.4     312.2      329.9         335.7       2.1%
Payments for financial assets            66.0       86.5      42.9       26.2       23.7           –
Allocated by function                 1 644.0    1 732.6   1 716.7    1 757.0    1 781.0         0.9%
Debt-service costs                     204.8      225.9     271.8      317.6         353.1     16.1%
Contingency reserve                        –          –       5.0        5.0           5.0         –
Consolidated expenditure              1 848.8    1 958.4   1 993.5    2 079.6    2 139.2         3.0%
Consolidated expenditure including    1 848.8    2 037.8   1 993.5    2 079.6    2 139.2         1.6%
June 2020 budget adjustments
Source: National Treasury, 2020c

Chapter 6.1. Macroeconomics              DRAFT 23/05/2021                                                16
Given that total consolidated spending over the medium term is expected to grow by only 1,6% per year, the increasing interest costs will crowd out other expenditure. The next-fastest growth is in economic development (4,6%) and community development (4,3%), mainly because of above- inflation growth in spending on road infrastructure and access to basic services, in line with the economic recovery plan. Spending on health, learning and culture, and social development is expected to decline in real terms over the medium term (National Treasury, 2020c). FEBRUARY 2021 BUDGET By February 2021’s Budget Review, more certainty was provided about the projected budget balances in the wake of the pandemic (Table 6.1.6). The National Treasury’s latest projections saw the main budget deficit revised to 12,3% for 2020/21 and recovering somewhat to 6,5% by 2023/24, largely in line with estimates from the MTBPS. The Budget Review also confirmed the dire debt projections discussed above, with the debt-to-GDP ratio expected to stabilise at 88,9% in 2025/26. Figure 6.1.18 shows the recent increases in the debt-to-GDP and projections as of March 2021. Table 6.1.7 in Annex 6.1.1 shows the latest available expenditure priorities from the 2021 Budget Review. The structure of expenditure in the 2021 Budget was largely similar to that presented in the 2020 MTBPS (National Treasury, 2021). Table 6.1.6: Main budget framework, 2021 Budget Review Source: National Treasury, 2021 Chapter 6.1. Macroeconomics DRAFT 23/05/2021 17
Figure 6.1.18: National government gross loan debt, 2006/07 to 2028/29 (% of GDP)

Source: SARB, 2021

TARGETED INTERVENTIONS
Temporary Employee/Employer Relief Scheme
The UIF’s TERS plan covered workers who tested positive for Covid-19, who needed to be quarantined
because of exposure, or whose work time or benefits had been reduced (Chapter 5.3). The benefit
was made available to employers who had registered with the UIF and made the required monthly
UIF contributions. It was payable for the shorter of the national lockdown period or three months,
with subsequent extensions announced in 2021. The minimum benefit was equal to either the
national minimum wage of R3 500 per employee or the sectoral minimum wage, and the maximum
was R6 370.

At the start of the scheme, only employers could claim for their employees, and employees were paid
through either the employer or the relevant Bargaining Council. As of June 2020, employees, including
workers not registered with the UIF, could claim the benefit directly. By February 2021, the scheme
had disbursed R57 billion to over 4,5 million beneficiaries from over 931 000 employers (National
Treasury, 2020c & 2021). Some elements of the stimulus that were due to expire were extended in
the February 2021 Budget. However, it should be recognised that administrative difficulties and delays
caused significant frustration for many beneficiaries. For example:
•   Disbursements were made long after the months for which they were paid. A well-designed
    employee/employer relief scheme should be able to respond more quickly.
•   There were long delays in government decisions on extensions during later lockdown periods.
•   The various revisions to the directives contributed to disputes and differences of interpretation.
•   There was a tension between the TERS and the National Treasury’s wage incentive supplementary
    benefit – employers could not claim both, and the TERS payment had the effect of undermining
    the tax benefit.

Chapter 6.1. Macroeconomics              DRAFT 23/05/2021                                           18
This is a good example of poor policy coordination. This experience has served as a telling reminder of the need to modernise the social insurance system in South Africa. Possible integration of the administration of this system with the South African Revenue Service (SARS) should be investigated. Covid-19 social relief of distress grant The June 2020 Supplementary Budget formally appropriated monthly increases to existing social grants for six months (many until October 2020). A special R350 social relief of distress grant was appropriated over the same period to help compensate for income lost because of lockdown restrictions on economic activity. Child support beneficiaries received an extra R500 between June and October, and other grant beneficiaries were given R250. The MTBPS noted that government would discontinue these payments but allocated R6,8 billion to the Department of Social Development to extend the Covid-19 social relief of distress grant until 31 January 2021. Another R500 million was earmarked for direct food relief and R589 million for social workers and early childhood development workers, given how badly the sector had been affected by the pandemic (National Treasury, 2020c). By the end of 2020, the social relief of distress grants had reached around 7 million people. The UIF supported another 4 million beneficiaries (National Treasury, 2021) and existing social grants about 17,8 million (12,8 million child support grants; 3,6 million old-age pensions; 1 million disability grants; 340 000 foster care grants; and 155 000 care dependence grants) (National Treasury, 2021). Adding these three numbers suggests that over 35 million payments for social support were made in 2020 during the pandemic, supporting a critical mass of vulnerable people in the economy (Stats SA, 2020). CONSTRAINTS State capacity Programmes that used existing infrastructure (e.g., child support and tax relief) were faster at rolling out relief, whereas new programmes (e.g., the social relief of distress grant) had ‘teething problems’ and took longer to become functional (National Treasury, 2020b). Social development services were also constrained by the lockdown and distancing requirements. Lines for support have been long, as have waiting lines for food parcels, with reports of older people dying in these queues. There have also been allegations of corruption in the distribution of food parcels, leading some to advocate the use of vouchers (WBG, 2020). This suggests that especially in the early part of the pandemic, state capacity and corruption were more of a constraint on social relief than were finances per se. Grants to non-profit organisations Another constraint was the delay in or non-payment of grants by provincial social development departments to non-profit organisations for social welfare services. In a judgment handed down in October 2020 by Judge Nicolene Janse van Nieuwenhuizen of the Gauteng High Court, the minister of social development and provincial Members of the Executive Council (MECs) for social development (except the Western Cape) were ordered to pay all early childhood development centres 100% of the Chapter 6.1. Macroeconomics DRAFT 23/05/2021 19
intended subsidy regardless of whether they were operational. Previously, only operational centres
were paid, leaving others both unable to operate without subsidies and unable to access subsidies
because they were not operating.

Procurement
After the national state of disaster was announced in March 2020, the National Treasury issued three
instruction notes to regulate the emergency procurement of critical health supplies. The third note
allowed more flexibility with suppliers to speed up delivery. Soon allegations of fraud and corruption
in the procurement of PPE were widely reported in the media (National Treasury, 2020b; see also
Chapter 3.2). On 19 August 2020 the Special Investigation Unit announced that it was probing 658
contracts worth R5,08 billion, or almost half the R10,4 billion PPE expenditure reported to the
National Treasury.

The Auditor-General issued the first real-time audit report of R147,41 billion in Covid-19 expenditure
up to 31 July 2020 (R135,92 billion of the R500 billion fiscal relief package and R11,49 billion in other
funds). It noted that procurement controls had been compromised. Poor-quality PPE had been
supplied at between double and five times the national prescribed prices, and to companies without
tax clearance certificates or that were not registered on the central supplier database, for example.
Via the Expanded Public Works Programme (EPWP), the Department of Public Works and
Infrastructure (with the Independent Development Trust as implementing agent) was allocated
R771 million to source 25 000 workers to help the Department of Health with screening, testing and
educational campaigns. The Auditor-General found that by end-June, only 8229 workers had been
recruited and R26 million spent on management, administration, and PPE for participants. Because
the initiative had been delayed, no payments had yet been made to workers (AGSA, 2020). This does
not augur well for scaling up the EPWP for the Covid-19 recovery phase.

Of the 139 companies awarded PPE tenders, the SARS is now investigating 22 tenders (R1,1 billion)
that benefited ‘politically exposed persons’ (the term used in the Financial Intelligence Centre Act for
politically connected individuals). Sixty-five of the 139 companies should have been disqualified
because they were not tax compliant. Other offences include not being registered for value-added tax
or having outstanding tax returns. Some were listed as pubs, car washes, property letting companies
or bakeries but were still awarded tenders. The SARS Commission even found that a R60 million
contract had been awarded verbally (Merten, 2020).

The National Treasury withdrew the emergency regulations and required all government bodies to
revert to an open-tender system. It published the details of Covid-19-related procurement, including
the names of companies awarded contracts, and law-enforcement agencies are investigating cases of
criminal behaviour. The Treasury also collaborated with the Auditor-General to publish Preventative
Control Guidelines, a toolkit to identify fraud, corruption, and misappropriation of funds.

Chapter 6.1. Macroeconomics               DRAFT 23/05/2021                                            20
PRELIMINARY LESSONS LEARNT
There were significant problems in policy coordination and consistency in responding to the economic
fallout of the pandemic across sectors, individual businesses, their workers, and households in
general. This is highlighted by the number of stimulus and recovery plans announced since March
2020 that have not been implemented properly or failed to mitigate the economic effects of the
pandemic as envisioned. Many small business and individuals were left frustrated as promised support
either never materialised or was heavily delayed in a time of great distress.

The design of these programmes has been flagged as the most common concern. As noted, in some
cases, dubious allocation of resources and awarding of tenders have drained key resources. This is not
completely surprising – the combined health and economic shock has been unlike anything the world
has witnessed in about a century. There was, at least initially, much uncertainty about the pandemic
and which course of action could simultaneously mitigate against the health and economic effects of
the pandemic and the resulting lockdown restrictions. Typical oversight and procedural scrutiny were,
understandably, partially set aside given the magnitude of the shock and the urgency of the required
response. This inevitably led to weaknesses in planning and implementation, which could be exploited
by bad actors. An in-depth and cross-cutting analysis into how to improve the coordination of complex
emergency policy responses and to ensure officials are held accountable in the implementation of
such policies should be conducted as a matter of urgency.

The lessons learnt about the policy response to the pandemic in the year since the start of the
lockdown are difficult to disentangle from lessons about the general state of the economy. South
Africa’s macroeconomy entered the pandemic in an extremely fragile state. Institutions and state-
owned enterprises were weakened by state capture, and confidence among both business and
investors was generally low. GDP per capita had been falling since 2015, unemployment was already
at near-record levels, and the fiscus was under severe pressure. These factors combined from the
outset to hamstring the country’s ability to respond effectively to the demands of the pandemic.

The initial hard lockdown regulations in March 2020, which aimed to give heath facilities time to
prepare and help flatten the curve of Covid infections, were met with general support from the public.
However, this support soon turned to frustration as it became clear that many health facilities
remained ill-equipped and ill-prepared to cope with successive waves of the pandemic despite the
lockdown and the vast sums of money allocated to PPE and other equipment. The qualifying criteria
for government support also left many disillusioned, especially small business owners. Other policies,
such as the alcohol and cigarettes ban, were also questioned (Chapters 6.2 and 6.5). Apart from the
fact that these policies cost the already constrained fiscus billions in excise revenue, their effectiveness
in achieving their stated goals has not been proven; the costs may well have outweighed the benefits,
at least from an economic point of view.

It is still truly difficult to know what has and has not worked in terms of South Africa’s Covid-19 policy
response. However, a few key lessons have emerged:

Chapter 6.1. Macroeconomics                DRAFT 23/05/2021                                              21
•   Much better coordination is needed both between authorities and with the private sector. It seems
    clear that South African policymakers were not prepared for a shock of this magnitude. Using the
    well-established infrastructure of SARS to help administer grants should be strongly considered.
    The loan guarantee scheme was also less effective than envisioned, with only 10% of allocated
    funds distributed, partly because of a lack of coordination with private sector loan extensions
    (Chapter 6.5). All round, authorities must improve their planning and structures for future shocks.
    This pandemic has highlighted many weaknesses in implementation. Long-overdue administrative
    ‘modernisations’ (e.g., the UIF or collaboration between the health department and private health
    providers and hospital groups) need to be prioritised. Government should immediately identify
    and rectify problems that undermine the efficiency of its emergency policy response.
•   Lockdowns need to be smarter and more targeted. Blanket bans and across-the-board lockdowns
    may not have struck the correct balance between protecting lives and protecting livelihoods.
    South Africans generally complied with mask-wearing mandates, and for the most part social
    distancing was well implemented in urban areas. Policymakers should learn from areas in which
    these basic mitigation measures were more successful, as this may allow for more a nuanced
    implementation of restrictions.
•   Stringent oversight of emergency spending and tender processes must be maintained, and harsh
    penalties or sanctions must be imposed on corrupt officials. Despite promises in this regard, South
    Africans were left fuming when tenders were flagged as corrupt or irregular, especially for the
    distribution of PPE in the early days of the pandemic. Such issues ultimately erode trust in
    government, which in turn undermines the implementation of policy and other measures to
    address the health and the economic fallout of the pandemic.
•   The need for the macroeconomy to be in a general state of readiness to deal with crises should
    not be underestimated. South Africans were woefully exposed to the effects of the pandemic
    because of the fragile state of the economy and the inability of the fiscus to provide greater
    support. This has also played a role in the slow rollout of vaccines, with significant delays in
    securing supplies and other infrastructure necessary for the most important step in overcoming
    the pandemic – a successful vaccination drive that will help South Africa achieve herd immunity
    and allow a return to a normally functioning health and economic system (Chapter 5.1). Ensuring
    that the macroeconomy is robust and better able to cope with large shocks will require stronger
    institutions, smart reforms and greater accountability.

IMMEDIATE INTERVENTIONS
Policymakers are limited in their ability to add new stimulus interventions on top of existing policies
because of the constraints on the fiscus. However, areas where emergency response funds have been
misallocated or underused should be examined with a view to reallocating the funds. Bottlenecks in
the application or payment process of support to businesses or individuals should also be addressed
as a matter of urgency.

Chapter 6.1. Macroeconomics              DRAFT 23/05/2021                                           22
You can also read