Cars and Civilization - Jesse H. Ausubel - William & Myrtle Harris Distinguished Lectureship in Science and Civilization
←
→
Page content transcription
If your browser does not render page correctly, please read the page content below
Cars and Civilization
Jesse H. Ausubel

William & Myrtle Harris Distinguished Lectureship in Science and Civilization

Beckman Institute Auditorium,
California Institute of Technology
30 April 2014
Revised 18 May 2014
Cars and Civilization

    Jesse Ausubel is Director, Program for the Human Environment, The Rockefeller
University, 1230 York Avenue, New York, N.Y. 10021. http://phe.rockefeller.edu/. This
talk draws occasionally on J.H. Ausubel, C. Marchetti, “The evolution of transport,” The
Industrial Physicist 7(2): 20-24, 2001. The results and insights presented here come from many
years of cooperative research with Nebojsa Nakicenovic, Cesare Marchetti, Arnulf Gruebler,
Perrin Meyer, Iddo Wernick, Alan Curry, and others. Thanks to all, and to the Office of Net
Assessment for encouraging the new work on peak use. This talk followed an opening
address by Nebojsa Nakicenovic on the history of transport technology. This version
includes more material than the time of the oral presentation allowed.

Title page photo credits: Sotheby’s 2013

Suggested citation:
Ausubel, Jesse H. “Cars and Civilization.” William & Myrtle Harris Distinguished
  Lectureship in Science and Civilization, California Institute of Technology, 30 April 2014.
  Revised 18 May 2014. http://phe.rockefeller.edu/docs/Cars and Civilization.pdf.

                                                       2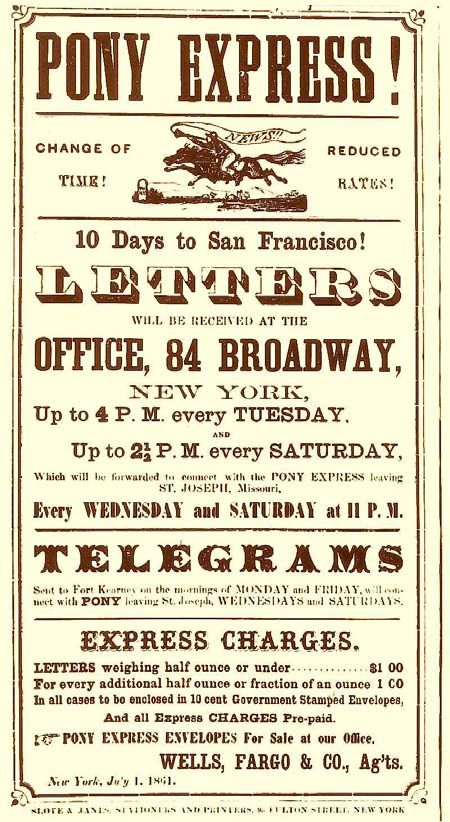
Jesse H. Ausubel
   Thanks to the Harris Family and the Cal Tech community, especially Jed Buchwald and Diana
Kormos Buchwald, for the honor to speak with you about “Cars and Civilization.” The first speaker,
my long-time research partner Nebojsa Nakicenovic, concluded his remarks with the transition
from sail to rail about 1830. My title page shows both a horse-drawn coach, the Brewster Park Drag,
custom made in 1892 for the Vanderbilt family, who made their fortune in shipping and railroads,
and the 1964 Chevrolet research vehicle CERV II with a top speed of 320 km/h (200 mph), and the
power of 500 horses. In November 2013 Sotheby’s auctioned the horse-drawn coach for $253,000 and
the Chevy for $1,100,000.
    As the second speaker, I will offer some theory to              sees how much we owe to the imperative of mobility.
help explain the observations about travel behavior                 Following Immanuel Kant, one might even say the
that Nebojsa has told, and then zoom into where cars                categorical imperative, though Kant famously never
now fit in the evolution of mobility. In the end I will             traveled more than 16 km (10 miles) from his home in
conclude, with some relief, that America is peaking                 Koenigsberg, two to three hours on foot.
in its use of cars and petroleum. I will also conclude                  These few premises let us see that human mobility
with nostalgia and respect, because cars multiplied                 is visceral. The basic instincts descend from the
human mobility 50-fold, reorganized civilization, and               evolution of humanity. And four of them allow us to
provided some of the greatest cultural expressions of               make sense of the complex use that humans make of
the twentieth century. The Vanderbilt coach and the                 transport.
Chevy flag the start and the peak of the car race.                      The number one instinct is to stick to the budget
                                                                    of time spent in mobility. Humans reside in a
Travel instincts                                                    protected base, be it a cave, condo, or dorm room.
    I begin earlier than the Vanderbilt coach, and                  Like all animals having a protected base, we measure
even earlier than Nebojsa, two to three billion years               carefully the time in which we expose ourselves to
ago, with bacterial civilization, and the essentials                the dangers of the external world, be they wildfires,
of mobility. In a spatially inhomogeneous system,                   drunken drivers, or narco-traffickers such as Los
mobility favors a living organism. A couple of billion              Zetas.
years ago bacteria were already equipped with                           Travel time was accurately measured in various
rotating flagella, stirred by electric micromotors of               parts of the world by the late Yacov Zahavi, a leader
the kind we today call step motors, capable even of                 of research about transport for the World Bank and
traveling in reverse. The ancient, ubiquitous E. coli               the U.S. Department of Transportation in the 1970s. I
bacteria of the gut swim, run, and tumble in three                  tend to trust data from Japan and Switzerland, which
dimensions (Figure 1).                                              perform meticulous surveys, and explain outliers
    When sufficient oxygen permitted multicellular                  by differences in methods or definitions. As you
architecture, mobility was assured with specialized                 can see from Figure 2, many surveys give similar
structures, the muscles. Pterosaurs were flying 200                 results, which allow us to assert a Law of Constant
million years ago.
    Predators develop in every ecosystem,                      110

including that of monocellular organisms,                                                                                California
                                                                                                                         (over age 11)
                                                               100
and so sooner or later, fast long-distance
management becomes imperative, and with it                         90
                                                                           Lima, Peru
the premises for a nervous system to evolve. The
gazelle must be faster than the lion and perceive                  80                                       Tokyo
the chance to run. Human primacy in the                                    44 U.S. cities
                                                         Minutes

biosphere is tied to the nervous system, so one                    70

                                                                   60                                     Swiss

                                                                   50
                                                                                                                                         U.S.
                                                                   40                                 131 Japanese cities
                                                                           W. Germany

                                                                   30
                                                                        1965        1970    1975   1980           1985            1990          1995

Figure 1. E. coli motion.                                           Figure 2. Travel time budget (minutes of travel per day,
Source: http://www.mit.edu/~kardar/teaching/projects/               various studies).
chemotaxis%28AndreaSchmidt%29/finding_food.htm.                     Source: Ausubel, Marchetti, and Meyer, 1998.

                                                             3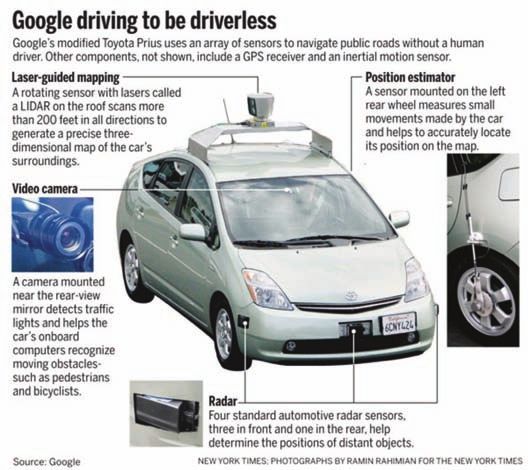
Cars and Civilization

Travel Time. Measured over the year and the whole               double counting, reported a mere 51 minutes daily
adult population, humans spend about one hour                   for travel. In 2014, the 154 minutes for “Watching
per day on travel. Figure 2 shows one report from               TV and Videos” and 43 minutes for “Reading”
California notably higher than the U.S. average, and            would be largely applied to activities involving the
the high number may reflect a phenomenon known                  Internet, smart phones, and tablet computers. Robert
to sociologists as “time deepening.” One can think              Herman, one of the founders of traffic science and
of it as multitasking or partial attention, for example,        also a discoverer of the cosmic background radiation,
eating a hamburger or talking on a cell phone while             used to call time the “disgusting coordinate of the
driving.                                                        Universe,” and the meager daily budgets of 25
     Here let me digress briefly on civilization. In the        minutes for child and pet care and 18 minutes for
1960s and 1970s, a comedy group from Los Angeles                hobbies show reasons we express disgust at time.
called the Firesign Theatre made several popular                    By the way, telecommuting fails to save energy
albums, starting with “Waiting for the Electrician or           or traffic because when we travel fewer minutes to
Someone Like Him.” One of their funniest sketches               work, we travel equally more minutes for shopping
was a quiz show about death called Beat the Reaper.             and leisure.
It was not good for a contestant to lose. Anyway,                   The number two instinct is to return to the lair
people try to beat the reaper by time deepening,                in the evening. As seen in Figure 4, even sunlit
but deepening is risky, as partial attention tends to           Californians spend almost two-thirds of their time
increase accidents and miscues.                                 at home indoors. Trips almost all depart from the
     I will show later that the travel time budget              home, the center of one’s world, using the best means
was also about an hour 5,000 years ago, but first               of transport. The homing instinct lies at the core
I cite a 1995 survey of how the average American                of the success of airlines. Airbus found that about
divided his or her daily time over a week (Figure 3).           60 percent of the air passengers in Europe do their
This survey, which did not allow for deepening or               business and return in the same day, notwithstanding

Figure 3. American time budget. Sleep, not included here, accounts for 7 hours 25 minutes, or 445 minutes, per day.
Source: NY Times/NPD Group.

                                                            4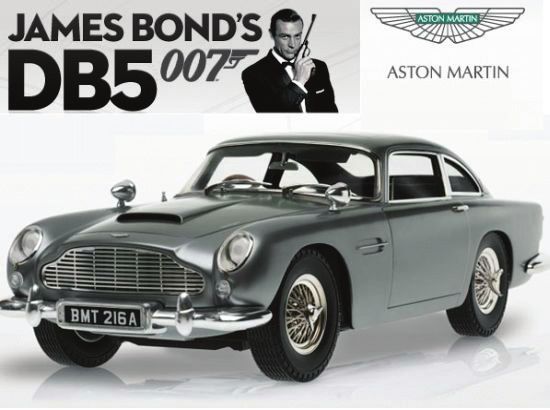
Jesse H. Ausubel
Indoors not
at home 25%
Indoors
at home 62%
Enclosed transit 7%
Outdoors 5%
Outdoor transit 1%
Figure 4. Percentage of time spent in major locations by Californians (over age 11)
Source: Wiley et al., 1991.
Table 1. Travel expenditures. Percent of disposable income, various studies. high European fares. I would guess
the air shuttles operating from Los
1963–1975 13.2% Angeles carry the same proportion
United States
1991 14.75% of day-trippers. The costly revival
of the Amtrak trains, which do not
1972 11.7%
United Kingdom comfortably permit a roundtrip
1991 15% day-return between Los Angeles and
1971–1974 11.3% San Francisco, has barely scratched
West Germany the airplanes, which appreciatively
1991 14% charge more than $400 for a one-way
1970 14% fare.
France To the instincts associated with
1991 14.75%
dangers of staying away from home,
Source: Zahavi, 1979; Schaefer and Victor, 1997. add the number three instinct: the
travel money budget. Families
spend about 12 to15 percent of their
disposable income for mobility (Table 1). Zahavi’s
team measured the phenomenon 40 years ago, and
1,600 12 recent checks show the same. Figure 5 shows the 10
percent of GDP spent on mobility during 1995–2011
in the USA, a measure that by definition runs a bit
1,200 9
lower than the fraction of disposable income. The
chart shows strong persistence, as the 2008 recession
800 Billions of nominal dollars 6 caused only a temporary dent.
Percent GDP The fourth and final instinct stems from the fact
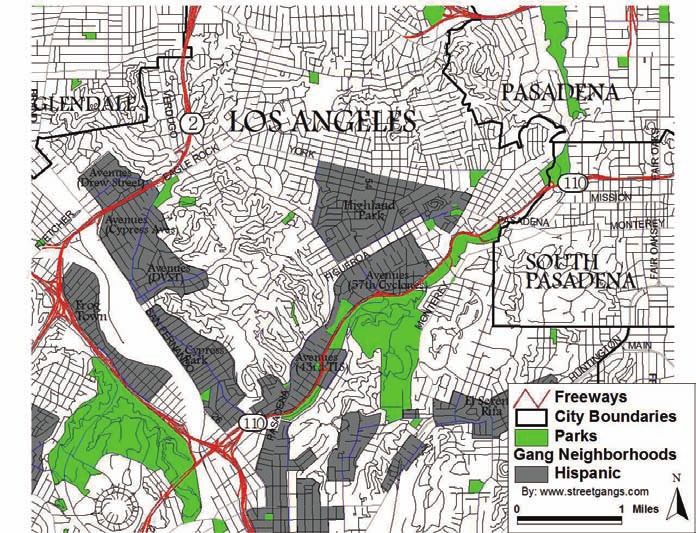
400 3 that humans are territorial animals. I do not need
to spend much time to explain it. Most history is a
bloody testimony to the territorial instinct. Think of
0 0
1995 1997 1999 2001 2003 2005 2007 2009 2011
Ukraine or the Bloods and Crips in South LA, or the
gang neighborhoods near Pasadena shown in Figure
Figure 5. U.S. transportation spending, 1995–2001. Travel 6 from the fascinating Web site Streetgangs.com. The
money budget: 10% of GDP (or somewhat higher fraction objective of the territorial animal is to have a territory
of disposal income). as large as possible, within the natural limits of the
Source: U.S. Department of Transportation, Research possibilities of acquiring and managing it.
and Innovative Technology Administration, Bureau of For humans a large, accessible territory means
Transportation Statistics, National Transportation Statistics, greater liberty in choice of the three points of gravity
table 3-9, available at www.bts.gov as of October 2013. of our lives: the home, the workplace, and the school.
5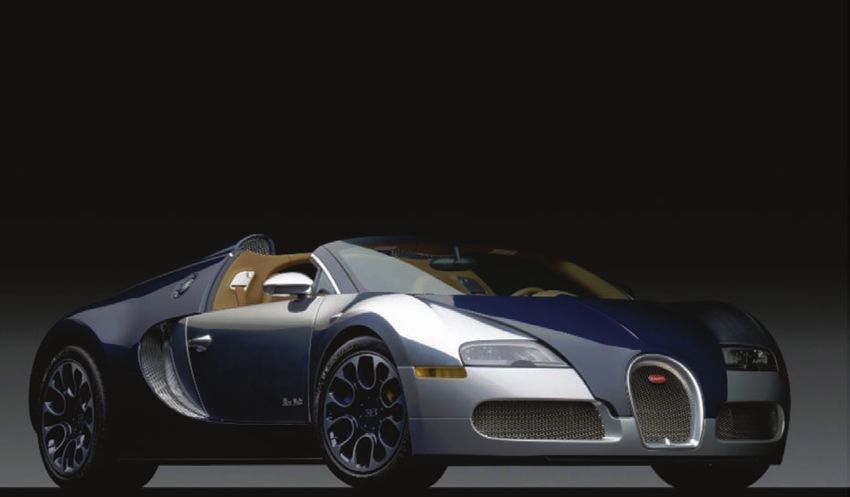
Cars and Civilization

                                                                                 Four-fifths of all mobility ends in
                                                                                 this triad.
                                                                                     With these requirements of
                                                                                 travel time and money budgets,
                                                                                 the nightly return home, and
                                                                                 maximization of territory, we can
                                                                                 begin to interpret the world of
                                                                                 movement and its substrate of
                                                                                 geography.

                                                                                 Speed
                                                                                     Now turn to the speed that
                                                                                 connects the requirements. By
                                                                                 foot, a pedestrian, covers about
                                                                                 5 km in an hour. Going and
                                                                                 returning home, a pedestrian’s
                                                                                 territory has a radius of 2.5 km
                                                                                 and thus an area of about 20 km2.
                                                                                 We can define this area as the
                                                                                 territorial cell of the individual on
                                                                                 foot, exemplified by Kant, known
Figure 6. Streetgangs.com map of nearby neighborhoods.                           for his clockwork habits. Maps
                                                                                 of settlements and communities
                                                                                 until about 1800 (and even for
                                                                                 much of the world today) show
                                                                                 territory that is paved by tiles
                                                                                 with cells of about 20 km2, often
                                                                                 with a village at the center. So, the
                                                                                 Law of Constant Travel Time has
                                                                                 operated for thousands of years.
                                                                                     When the career of a village
                                                                                 flourishes and it becomes a city,
                                                                                 the 20 km2 progressively fills
                                                                                 with people. However, its borders
                                                                                 are not breached. Numerous
                                                                                 examples of belts or walls of
                                                                                 ancient cities show that they
                                                                                 never exceeded 5 km in diameter.
                                                                                 Even imperial Rome spanned
                                                                                 only about 5,000 yards, or 20
                                                                                 km2, as Figure 7 shows. Vienna
                                                                                 started with a small medieval
                                                                                 wall, its Ring, and then around
                                                                                 1700, after its victory against
                                                                                 the Turks, made a triumphal
                                                                                 second belt, the Guertel, at 5 km.
                                                                                 Pedestrian Venice is elliptical,
                                                                                 with a maximum diameter of
                                                                                 about 5 km.
                                                                                     As Nebojsa showed, the
Figure 7. Imperial Rome.                                                         human situation remained
Source: http://www.best-of-rome-italy.com/support-files/ancient_rome_map1.pdf.
                                                                                 remarkably pedestrian, almost
                                                                                 stationary, until about 1800. There
                                                                                 were horses, but few relative
                                                                                 to riders because of their cost.
                                                                                 Horses served as an exhibition

                                                         6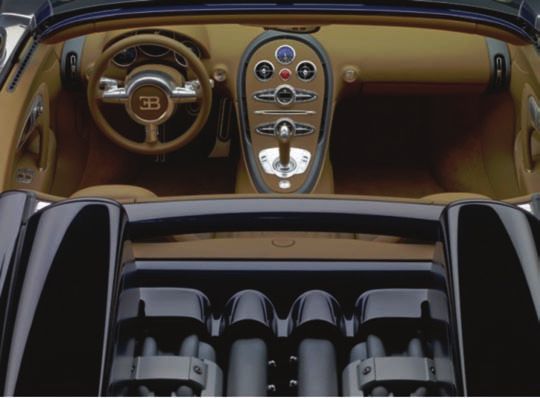
Jesse H. Ausubel

of riches and an instrument of military power and
communication. As Figure 8 shows, horses could be
quite fast. In 1861 after a hybrid journey involving
a telegram from New York, the Pony Express could
carry a letter from Missouri to San Francisco, about
3,100 km (1,900 miles), in 10 days, with a respectable
average speed of 13 km/h. Alas, the 120 riders, 184
stations, and 400 horses cost a customer $1.00 to ship
a half ounce, or $26 in current money, about 50 times
a present first-class stamp. Horses of course also
provided energy in agriculture. In fact, most horses
worked on farms. Around 1815, Sweden appears to
have topped horse ownership with about one per six
people, while the rich, imperial UK had only about
one per 10. Around 1900 in the USA, where hay
was cheap (as gas soon would be), horses per capita
peaked at about one horse for four people. Compare
that ratio to today’s four motor vehicles per five
Americans. Notwithstanding many paintings and
sculptures of riders and galloping mounts, horses did
little for human mobility.
     Thus, horses did not make cities grow. Augustan
Rome had about one million inhabitants. Istanbul,
Europe’s largest city in 1700, had about 700,000.
London, which would become number one in size,
had only 676,000 in 1750. Basically, a city remained
the area one could span in an hour, and as long as
speed remained pedestrian, city span and population
were capped. In 1800 the great networks of roads
created by the Romans still served much of Europe
for the administrative messengers and the movement
of goods and also troops. Infantry, foot soldiers, made
up the armies; cavalry were precious and few.
     Starting about 1800, new machines for transport                  Figure 8. This 1861 poster advertises the Pony Express
entered the field. They permitted ever-higher speed                   reduction in rates from $5 per half ounce to $1.
and revolutionized territorial organization. As                       Source: Wikipedia and originally Smithsonian National
Nebojsa described, the highly successful machines                     Postal Museum.
are few — the train, auto, and plane, introduced
in successive arcs over 200 years. Inside cities,                    100
                                                                                   Total (average per decade)
subspecies such as the bicycle, electric tram, bus,                                Regression line (2.7% per year)
and subway are also important for the internal
organization of the city and its dimensions.                                  10
                                                                                                                             Cars ( + buses + motorcycles )

     The diffusion of the train, car, and plane
technologies has been slow. Each has taken from 50 to
                                                          Miles (log scale)

                                                                                                                                                  Air
100 years to saturate its niche. Each machine carries                                                       Walking
a progressive evolution of the distance traveled daily                         1

that surpasses the 5 km of biological mobility by foot.
                                                                                                             Trains
     Figure 9 shows on a semilogarithmic scale how
matters proceeded in the USA from 1880 to 2000. The                      0.1
pattern resembles the even longer span for France
plotted by Arnulf Gruebler (1990) shown by Nebojsa.                                    Horses
The dashed line indicates that American mobility
grows on average about 2.7 percent per year, a                    0.01
                                                                     1880               1900         1920             1940     1960          1980         2000
doubling about every 25 years. I wonder if physical
mobility is a deeper indicator of social change, and                   Figure 9. U.S. passenger travel per capita per day (range).
                                                                       Source: http://phe.rockefeller.edu/green_mobility/.

                                                          7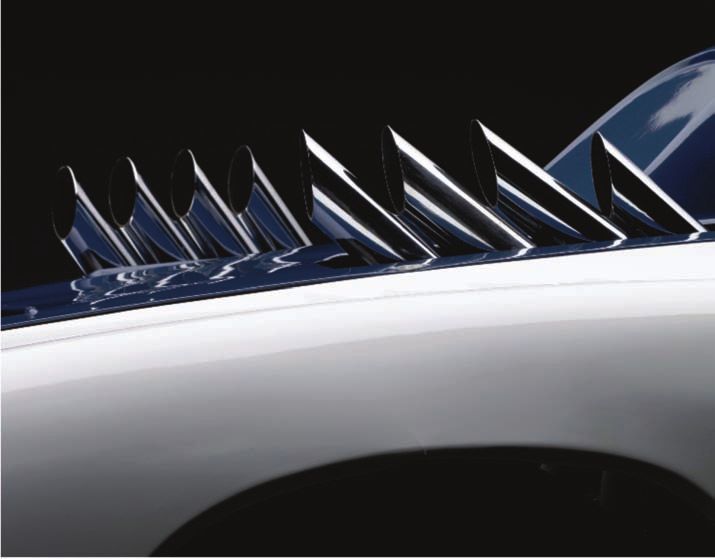
Cars and Civilization

even progress, than many other indicators more often              Age of the car
reported.                                                             Rather than complain about smog, I would like
    As we see from Figure 9, cars surpassed trains                now to offer an interlude honoring the car, more
and feet in America by 1920 to become the number                  precisely half a dozen cars auctioned at Sotheby’s in
one means of mobility. Nevertheless, since about                  November 2013 in addition to the Chevy. Engineers
1920, the time of Henry Ford’s big success, cars have             and designers as well as businessmen and consumers
an average speed in most countries of about 35–40                 understood the importance of the car and lavished
km/h. That is, all the kilometers cars travel each year           artistry and money on it. When people in future
divided by all the hours that cars travel each year               centuries ponder the twentieth, the car may well
equals about 35 km/h. A hundred improvements                      symbolize our civilization. In 2000, cars still provided
in vehicle and road design ranging from headlights                Americans about seven times as much mobility as
and windshield wipers to lane demarcation and                     planes for all travel and about four times as much for
roundabouts only conserve our speed. Given that                   intercity travel.
one hour is the daily budget of the traveler and that                 Let’s begin in 1912 (Figure 10) with a Stutz
car owners on average now use their cars 55 minutes               Bearcat, the car in which the author of The Great
per day, daily mobility in California or Europe is little         Gatsby, F. Scott Fitzgerald, and his wife Zelda sped
more than 35 kilometers per day. The escape from                  back and forth between country and city. The car
these rigid boundaries, as I will explain later, is by air.       came to symbolize the Roaring Twenties in America.
    Angelenos know that the automobile and its                        The 1930s brought a new streamlined look, and
mechanical cousins destroyed the village and                      few cars surpassed the elegant French Delahaye 135S
invented the megalopolis. If the use of the Ford                  Teardrop Coupe. Buying and storing one would have
gives a mobility of about 35 km/h, then it affords a              been a good investment, as the recent auction price
territory of about 1,000 km2, 50 times greater than               was $2.4 million (Figure 11).
the 20 km2 of the pedestrian city. Mexico City, for                   The 1938 French-Italian Talbot-Lago Teardrop
example, is based on the auto as the instrument                   Cabriolet with a long wheelbase and an aerodynamic
of mobility. Its official population today exceeds                form would have been an even better investment, as
21 million. Fitting an equation to its growth, one                the model elicited more than $7 million in the same
extrapolates development to a saturation of about 50              sale (Figure 12).
million. In principle, 50 times the territory equals 50               In the 1950s, cars began to feel the competition of
times the population, although practical problems as              planes, and designers offered cars like the 1956 Aston
well as cultural changes in family size are likely to             Martin Supersonic (Figure 13). That year the car sold
keep the numbers lower.                                           for about 3,000 British pounds (about $100,000 today)

 Figure 10. Stutz Model A Bearcat, 1912, $770,000.

 Figure 11. Delahaye Type 1355 Teardrop Coupe 1936, $2,420,000.
                                                                                             Photo credits: Sotheby’s 2013

                                                              8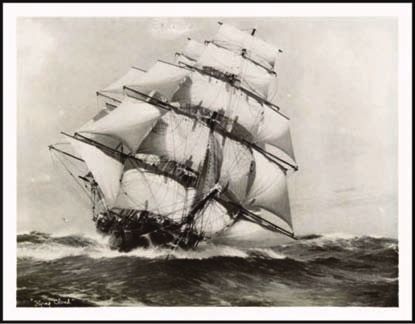
Jesse H. Ausubel

and auctioned for $2.3 million last November. Aston           poised to compete. Rated at 370 kW, the single car
Martins glorified drivers, such as James Bond in the          had more horsepower than the 400 horses of the
1964 film Goldfinger.                                         Pony Express relaying a cargo from Missouri to San
    Returning to the USA, General Motors symbolized           Francisco a century earlier.
American affluence and comfort in 1958 with a                     By 1970, car culture had diversified into humor
126.5-inch-wheelbase Oldsmobile with a V8 engine,             and fully merged with other popular culture.
power steering, air suspension, electric clock, color-        Chrysler introduced the Plymouth Road Runner
accented wheel disks, abundant chrome, and interiors          with a protruding nosecone, rear wing, and a horn
that could be ordered in a variety of colored leathers        that sounded like the beep-beep of the popular Road
(Figure 14).                                                  Runner in cartoons (Figure 15).
    Humans began traveling in space in the early                  The giddy, carefree run, indeed overshoot, of cars
1960s, and the 1964 Chevy on the title page looked            in America, came to an end about this time. The horn

 Figure 12. Talbot-Lago T150-C SS Teardrop Cabriolet 1938, $7,150,000.

 Figure 13. Aston Martin DB2/4 MK II Supersonic 1956, $2,310,000. The gentleman’s rocketship.

 Figure 14. Oldsmobile Ninety-eight convertible, 1958. Ultimate American automobile of Detroit’s “Chrome Age,” $258,500.

 Figure 15. Plymouth Road Runner Superbird, 1970. Muscle car known as The Winged Warrior, $363,000.
                                                                                     Photo credits: Sotheby’s 2013

                                                          9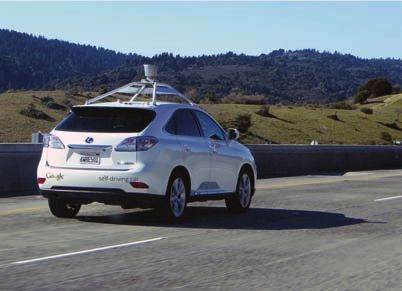
Cars and Civilization
also sounded for air pollution in 1970, as the USA Naturally one wonders about consumption in
legislated its Clean Air Act roughly marking peak other nations. As Figure 20 shows, Japan’s experience
pollution, and the first oil crisis of 1973–74 abruptly matches America’s very closely in time, while Korea’s
brought higher gas prices and introspection about peak followed in 1996. The saturation levels for these
automobility.
4500
Today, in the developed countries there is a motor
vehicle for nearly every licensable driver. The mode 4000
of transport is saturated. When we fit a logistic curve 3500
to the number of personal vehicles in the USA since
Kilograms per capita
3000
1900, the result shows 90 percent saturation (Figure 1955 Lincoln
16). Not only are Americans near peak cars, we are 2500
also at peak vehicle miles traveled with personal 2000
vehicles (Figure 17). For the past decade more cars do 1500
not mean more vehicle miles traveled. Per capita
1000
Gasoline consumption in America also peaked,
but somewhat surprisingly about 40 years ago at 500
4,000 kilograms per capita per year. From 1900 to 0
1970, it looked like the sky was the limit, as cars like 1900 1920 1940 1960 1980 2000 2020
the 1955 Lincoln in Figure 18 guzzled ever more gas Figure 18. Historic U.S. petroleum growth.
per person. In Figure 19 we again fit a logistic curve, Data sources: USDOE Energy Information Administration,
and see the overshoot of the 1970s, the oscillation 2013. Ausubel, Wernick, and Curry, 2014.
around a plateau from about 1980 to 2010, and the Photo credit: Sotheby’s 2013
recent decline to about 3,000 kg per capita in 2012, 4500
fully a quarter below 1970.
4000
300 3500
Kilograms per capita
3000
250
Millions of vehicles
2500
200 Per capita
2000
PC logistic
150 99%
1500
90%
100 50%
1000
50
10% 500
1%
1920 1960 2000 2040 0
1900 1920 1940 1960 1980 2000 2020
1900 1920 1940 1960 1980 2000 2020 2040 2060
Figure 19. U.S. peak petroleum, logistic fit. Per capita
Figure 16.Vehicles in USA, approaching peak car. apparent consumption.
Source: Garrison and Levinson, 2014. Data sources: USDOE Energy Information Administration,
2013. Ausubel, Wernick, and Curry, 2014.
3000
ROK Japan India China
2500
Kilograms per capita
2000
1500
1000
500
0
1950 1960 1970 1980 1990 2000 2010
Figure 17. Peak vehicle-miles traveled in personal vehicles,
USA, 1971–2013. Figure 20. Petroleum use in four Asian nations. Per capita
Data source: U.S. Department of Transportation, Federal apparent consumption.
Highway Administration. http://www.fhwa.dot.gov/ Data sources: USGS, British Geological Survey. Ausubel,
policyinformation/travel_monitoring/14martvt/. Wernick, and Curry, 2014.
10Jesse H. Ausubel
3000 3000
Republic of Korea
Kilograms per capita
Japan
2500 2500
2000 2000
1500 1500
1000 1000
500
500
0
0
1950 1970 1990 2010 1940 1960 1980 2000 2020
1000 300
Kilograms per capita
China India
800
200
600
400
100
200
0 0
1950 1980 2010 2040 2070 1950 1980 2010 2040 2070
Per capita x PC logistic
Figure 21. Estimated saturation of petroleum use in four Asian nations.
Data sources: USDOE Energy Information Administration, 2013; British Geological
Survey, International Energy Agency. Ausubel, Wernick, and Curry, 2014.
nations were about 2,500 kilograms per capita per petroleum to natural gas, but these may not suffice.
year, about 30 percent less than the American 3,500. The electric alternative of 300 million large batteries
China and India appear early in their growth, and in the USA made with poisonous metals such as lead
Figure 21 suggests their peaks will come in about or cadmium poses materials recycling and disposal
2040 and 2050, respectively, but at much lower levels. problems.
If the forecasts are right, Chinese per capita oil use One answer is the zero-emission fuel cell, where
will saturate about one-third the Japanese and Korean compressed hydrogen gas mixes with oxygen
level and India one-eighth. from the air to give off electric current in a low-
Arnulf Gruebler (1990) has established this temperature chemical reaction that also makes water.
pattern of later adopters saturating at lower levels for If refining is directed to the making of hydrogen,
many technologies. For example, no one built rails its cost should resemble that of gasoline. Moreover,
as densely as the exuberant British, who began the the electrochemical process of the fuel cell is
craze about 1830. The passage of time and associated potentially 20 to 30 percent more efficient than the
learning allow later adopters to extract superior thermodynamic process of today’s engines. Toyota
services with more efficiently designed and operated and other manufacturers now plan to penetrate the
systems as well as integration of new alternatives. market by about 2020 with various forms of fuel
Of course, carmakers may try to sell more cars cell and hydrogen cars. Because of the large, lumpy
until we each have a second car at our second home investments in plant required, the traditional 10-year
and a third as a fashion accessory or tailored for lifetime of cars, time for diffusion of refueling and
particular errands. However, the added cars will not service infrastructure, and gradual public acceptance,
lift our mobility, as we already hit the limit of our it will take two to three more decades before the
travel time budget, as Figure 17 suggested. winners in the renewed competition of motors and
By the way, subways or metros can flourish if they fuels become fully apparent.
beat the average speed of the car, the 35 km/h door- While newer motors and fuels are clean and
to-door inclusive travel time. We reject forms of mass efficient, they do not enhance speed. Some increase
transit, carpooling, and other modes that slow our in the speed of the fleet might come from intelligent
travel time, which includes walking to the bus stop transport systems, that is, total computerization of
and waiting for the bus or a friend for a ride share. the vehicle and its context. I am inclined to think
Environmentally, the one-license, one-car equation these systems will mostly pack more vehicles safely
means that each car on average must pollute little. into the system at the same speed. Let’s not forget
Incremental efficiency gains to internal combustion that more than one million people die each year in the
engines will help and so might a fuel shift from global bloodbath called traffic.
11Cars and Civilization
Figure 22. Google Chauffeur: self-driving car.
Nevada passed a law on June 29, 2011, permitting operation of
autonomous cars.
In August 2012, the team announced that they have completed over
300,000 autonomous-driving miles (500 000 km) accident-free.
A car also traversed San Francisco’s Lombard Street, famed for
hairpin turns.
Actor Sean Connery as James Bond, with the
Aston Martin DB5 from Goldfinger.
Systems such as Google Chauffeur’s self-driving of us do. Thus, a huge rise of our national average
car (Figure 22) could reduce accidents and will is doable without breaking our health. And rising
allow time deepening, i.e., multitasking. The car can incomes mean a higher travel money budget that can
become an office, café, or bedroom. The driverless accommodate airfares.
car shifts the drama of car travel from James Bond at If everyone flew 30 minutes per day, however,
the steering wheel to a programmer who writes the present infrastructures would be violently stressed
code or possibly a drone pilot with a joystick and to by a rise in traffic of 30 times in the USA or 60
the backseat. It will also eliminate millions of jobs for 10 2 99%
drivers of taxis, buses, and trucks. Manufacturers will
compete to sell more bits rather than horsepower.
With the actual state of travel technologies, we
Passenger-kilometers (F / 1 – F)
10 1 90%
Cars
can seriously augment our mobility, that is, our 76.6%
Percent of saturation
average speed, only by augmenting the present
quota spent in the air. The mean speed of a plane is 10 0 50%
600 km/h, more than an order of magnitude faster 21.2%
than a car. As Figure 23 shows, air has been gaining
Air
in the competition for intercity passengers, but in 10 -1 10%
2000 still accounted for only about one-fourth of
the U.S. passenger kilometers (or miles) that cars Buses 1.5%
Maglev ?
Trains
did. Amazingly, in the USA our daily air time is still 10 -2 1%
1950 1960 1970 1980 1990 2000 2010 2020 2030
only about one minute, while Europeans (in 27 EU
nations) fly only about half a minute daily. A mere Figure 23. U.S. domestic intercity passenger traffic, fitted
100,000 km (or 60,000 miles) by air per year means with logistic substitution model.
a person flies about 30 minutes per day, as many Source: http://phe.rockefeller.edu/green_mobility/.
12Jesse H. Ausubel
2
times in Europe. Until recently, the system held up 10 99%
well in large part by augmenting the productivity
of the planes in proportion to the traffic, that is, Roads
1
10 Railways 90%
the passenger kilometers per hour of flight, or the
capacity divided by velocity. The Airbus 380 with
F / (1 – F)
twin decks and four aisles is certified up to 853 0
10 50%
passengers. Replacing old planes with larger and
faster ones held the core (Western) commercial Airways
fleet constant around 4,000 planes until about 1980. -1
10 Canals 10%
According to Boeing, the in-service fleet of Western-
Maglevs ?
built commercial single-aisle planes alone soared to
over 13,000 in 2013 and jammed the air and airfields -2
10 1%
1850 1900 1950 2000 2050
as cars jammed roads in an earlier cycle.
For the present airports, growing high-speed Figure 25. U.S. infrastructure, fitted with logistic
transport will be hard. Even with more efficient substitution model.
airports, environmental and safety problems loom. Source: Ausubel, Marchetti, and Meyer, 1998.
Airplanes will consume a big fraction of the fuel of
the transport system, a fact of interest to both fuel beautiful, as Figure 25 shows. Clearly, air will be the
providers and environmentalists. Today’s jet fuel may big winner for the next decades.
not pass the environmental tests of future air traffic
volumes. Future modes of transport
We need a high-density mode with the But the twenty-first century should also prove
performance of top airplanes without the problems. fecund for a new mode of transport. According to
The key is a new mode of transport. In the last 200 our studies, the best bet is on magnetically levitated
years the system has given birth to a new means of systems, or maglevs, “trains” with magnetic
transport every 60 years or so, integrated with larger suspension and propulsion. Elon Musk has proposed
economic and technical pulses. Figure 24 shows a variant called the hyperloop that would speed
the smoothed historic growth rates of the major between Los Angeles and San Francisco at about
components of the U.S. transport infrastructure. 1,000 km/h, accomplishing the trip in about 35
Canals came with hay and horses to tow the barges. minutes and thus comfortably allowing daily
Rails came with coal and steel for steam engines. The round trips, if the local arrangements are also quick
telegraph was the nervous system. Roads came with (Figure 26).
gasoline and cars and internal combustion engines. The maglev is a vehicle without wings, wheels,
The phone was the nervous system. Air came with and motor, and thus without combustibles aboard.
turbines and advanced materials and radio in various Suspended magnetically between two guard rails that
wavy forms, and may require cleaner fuel, eventually resemble an open stator of an electric motor, it can be
hydrogen, to achieve its full extent. propelled by a magnetic field that, let’s say, runs in
One can view these infrastructures as products front and drags it.
competing for market share. The secular evolution is Hard limits to the possible speed of maglevs do
4% not exist, above all if the maglev runs in an evacuated
10 7
Total growth tunnel or surface tube. Evacuated means simulating
Canals
10 6
Roads
the low pressure that an airplane encounters at
Kilometers
3% 10 5 Rail Air
10,000 to 20,000 meters of altitude. Tunnels solve the
problem of permanent landscape disturbance, but
Growth rate (percent)
10 4
10 3 Canals tubes mounted above existing rights of way of roads
10 2
or rails might prove easier and cheaper to build and
2% 1800 1850 1900 1950 2000
maintain.
Rail Spared a motor and the belly fat called fuel, the
Air Maglev ?
1836
Roads maglev could break the rule of the ton, the weight
1%
Dt =
1946
Dt = 65 years
(2002)
Dt = (70) years
rule that has burdened mobility. The weight of a
30 years 1891
Dt = 55 years horse and its gear, a train per passenger, an auto
which on average carries little more than one
0%
1800 1850 1900 1950 2000 2050
passenger, and a jumbo jet at takeoff all average about
one ton of vehicle per passenger. The maglev could
Figure 24. Idealized growth of U.S. transport infrastructure.
slim to 300 kg, dropping directly and drastically the
Source: Ausubel, Marchetti, and Meyer, 1998.
cost of energy transport.
13Cars and Civilization
Figure 26. California Hyperloop.
Source: http://www.dailymail.co.uk/news/article-2390672/Elon-Musks-Hyperloop-SuperTube-shoot-LA-San-Francisco-30-
MINUTES.html.
Maglevs also offer a way for electricity to model of the Internet. In the end, a maglev system
penetrate transport, the sector from which it has is a common carrier or highway, meaning private as
been largely excluded. French railroads, of course, well as mass vehicles can shoot through it.
are already powered cleanly and cheaply by nuclear Let me come back to Pasadena at this point and
electricity. For a decade maglevs have routinely synoptically review my picture of mobility. Humans
shuttled between Shanghai Airport and the center search for speed because, with a fixed travel time,
city, and now begin in Korea too. speed gives us territory and its access to resources.
Will maglevs make us sprawl? This is a legitimate A person on foot has 20 km2, while a person in a car
fear. In Europe, since 1950 the tripling of the average has 1,000 km2, and that makes a difference. The jet set
speed of travel has extended personal area tenfold, can have a continent. Cost affects choices for mobility
and so Europe begins to resemble Los Angeles. In through incomes. As a rule, the choice is to consume
contrast to the car, maglevs may offer the alternative both the time and disposable money budgets,
of a bimodal or “virtual” city with pedestrian islands maximizing the distance, that is, the speed.
and fast connections between them. Maglevs can Rising incomes mean rising speed at all social
function as national and continental-scale metros, at levels. The rich, of course, accelerate more than
jet speed. the poor. While poor means slow, even the slow
Looking far into the twenty-first century, we can today speed when compared with Queen Victoria.
imagine a system as wondrous to today’s innovators In industrial countries, a poor man has a car and
as our full realization of cars and paved roads would mobility superior to an ancient nobleman and at least
seem to the maker of the Stutz Bearcat. Because the equal to the Great Gatsby. When new travel modes
maglev system is a set of magnetic bubbles moving are introduced, such as supersonic Concorde planes
under the control of a central computer, what we or maglevs, they will first be the province of the rich.
put inside is immaterial. It could be a personal Old technologies can persist, fight back, and
or small collective vehicle, starting as an elevator sometimes revive. After steamships had operated
in a skyscraper, becoming a taxi in the maglev for 50 years, clipper ships, whose towering masts
network, and again becoming an elevator in another supported vast sails, could speed faster than 16 knots
skyscraper. The entire bazaar could be run as a (30 km/h) in good winds, and enjoyed their golden
videogame where shuffling and rerouting would lead age in the 1850s. Like carriage makers building the
the vehicle to its destination swiftly, following the elegant Vanderbilt coach in 1892, designers will still
14Jesse H. Ausubel
make extravagantly beautiful and powerful cars like we began to apply brakes to cars and shift to other
the 1,000 horsepower 2011 Bugatti Blue Night or their modes for speed that better fit our basic instincts,
drone successors (Figure 27). Artistry attracts buyers. namely travel time and money budgets, the nightly
Still, though a car can now equal 1,000 horses, return home, and the maximization of territory.
peak car and peak petroleum have passed in the In conclusion, we see that the drive for mobility is
USA. The fast 1964 Chevy looks like the inflection one of the deepest human drives and elicits some of
point of the growth of the automotive age. Soon after, our cleverest solutions, which we call civilization.
Figure 27. Bugatti Veyron 16.4 Grand Sport Bleu Nuit,
20l1, top speed of 400 kph, 750 kW, 1,000 hp, $2,310,000.
A clipper ship of cars?
Clipper ship Flying Cloud held the record for
fastest passage between New York and San
Francisco, 89 days 8 hours,1854–1989.
After print by Jack Spurling, 1926.
Photos: Sotheby’s 2013
15Cars and Civilization
References
Ausubel, J.H., and C. Marchetti. 2001. “The Schaefer, A., and D.G. Victor. 1997. “The Future
evolution of transport,” The Industrial Physicist Mobility of the World Population.” Discussion
7(2): 20–24. Paper 97-6-4, Massachusetts Institute of
Ausubel, J.H., C. Marchetti, and P.S. Meyer. 1998. Technology, Center for Technology, Policy, and
“Toward green mobility: The evolution of Industrial Development, Cambridge, Mass.
transport.” European Review 6(2): 143–162. 1996.
Ausubel, J.H., I.K. Wernick, and A. Curry. 2014. U.S. Department of Energy, Energy Information
“Progress report: When will Asian resource Administation (USDOE, EIA). 2013. http://
demand satiate?” Program for the Human www.eia.gov/.
Environment, The Rockefeller University, Wiley, A., J.P. Robinson, T. Piazza, K. Garrett, K.
17 April 2014. Cirksena, Y.T. Cheng, and G. Martin. 1991.
Garrison, W. L., and D.M. Levinson. 2014. The Activity patterns of California residents, California
Transportation Experience: Policy, Planning, and Survey Research Center, University of
Deployment, 2nd edition. Oxford University California, Berkeley.
Press. Zahavi, Y. 1979. The “UMOT” Project. U.S.
Gruebler, A. 1990. The Rise and Fall of Infrastructure: Department of Transportation Report No. DOT-
Dynamics of Evolution and Technological Change RSPA-DPD-20-79-3, Washington, D.C.
in Transport. Heidelberg: Physica.
Chevy CERV II, 1964.
Photo: Sotheby’s 2013
16You can also read