NEWFOUNDLAND AND LABRADOR BUDGET 2018 - MEASURING WHAT MATTERS FEBRUARY 2018
←
→
Page content transcription
If your browser does not render page correctly, please read the page content below
NEWFOUNDLAND AND LABRADOR
BUDGET 2018

 MEASURING WHAT MATTERS >

FEBRUARY 2018
The Newfoundland and Labrador Federation of Labour (NLFL) represents
25 affiliated unions, 500 union locals and 65,000 working women and men
in every sector of our economy, in every community in our province.

Newfoundland and Labrador Budget 2018: Measuring What Matters

February 2018

The Newfoundland Federation of Labour acknowledges research
support provided by David Thompson and Diana Gibson of
PolicyLink Research and Consulting.

Graphic design by Nadene Rehnby, Hands on Publications

P. O. Box 8597 Stn. A, 330 Portugal Cove Place
2nd Floor, NAPE Building, St. John’s, NF, A1B 3P2

t: (709) 754-1660
f: (709) 754-1220
e: fed@nlfl.nf.ca

www.nlfl.nf.ca

Contents
Contents

     EXECUTIVE SUMMARY....................................................................... 5

     INTRODUCTION............................................................................................8
                   Report overview........................................................................................ 9

     INADEQUATE INDICATORS...................................................................... 10
                   GDP .............................................................................................................10
                   Official unemployment rate................................................................11
                   Annual budget balance.........................................................................12

     INDICATORS FOR A BETTER FUTURE..................................................... 15

             RICH IN GOOD JOBS........................................................................ 15
                   Rich in good jobs — budget indicators...........................................15
                   Rich in good jobs — outcomes...........................................................17

             FAIR ..................................................................................................... 19
                   Fair — budget indicators.......................................................................20
                   Fair — outcomes......................................................................................21

             SUSTAINABLE.................................................................................... 22
                   Sustainable — budget indicators.......................................................22
                   Sustainable — outcomes......................................................................23

     CONCLUSIONS............................................................................................ 24

     NOTES           ..................................................................................................... 25
FIGURES

          Figure 1:    GDP per capita (2015)............................................................................................. 10

          Figure 2:    Median income of individuals, as a percentage of GDP per capita....... 11

          Figure 3:    Part time work........................................................................................................... 12

          Figure 4:    Temporary employment....................................................................................... 12

          Figure 5:    Revenues per GDP................................................................................................... 13

          Figure 6:    Changes in NL net debt-to-GDP ratio............................................................... 14

          Figure 7:    Focussing on too few indicators can be misleading................................... 14

          Figure 8:    Public sector employees by population.......................................................... 16

          Figure 9:    Public sector employees by GDP........................................................................ 16

          Figure 10:   Sketching a general model of job quality (EU).............................................. 18

          Figure 11:   Job quality framework (OECD)............................................................................ 18

          Figure 12:   Economic diversification index........................................................................... 19

          Figure 13:   Income inequality (Gini coefficient).................................................................. 19

          Figure 14:   Social expenditures as a percentage of GDP (OECD).................................. 20

          Figure 15:   Top income bracket tax rate................................................................................ 20

          Figure 16:   Progressivity of personal income tax................................................................ 21

          Figure 17:   Poverty up sharply in 2015................................................................................... 22

          Figure 18:   Federal backstop carbon pricing schedule.................................................... 23

4   NEWFOUNDLAND AND LABRADOR BUDGET 2018: MEASURING WHAT MATTERS
Executive summary
Executive Summary

WHAT GETS MEASURED MATTERS. The media, and the voting public, pay attention                  We call on the
to numbers, and the government is motivated to adopt policies that “move the dial” on        government to
those numbers.                                                                               develop broader
                                                                                             indicators, and to
In budget discussions the government of Newfoundland and Labrador — like others — has
                                                                                             give them a greater
emphasized a few narrow numbers, like GDP, unemployment, debt and annual deficits.
Downplayed or entirely absent from the mainstream conversation are important indica-         emphasis than
tors such as inequality, the quality of jobs, or the debt to GDP ratio, among others.        the traditional
                                                                                             indicators, in order
The province is in a crisis; we cannot afford misinformed policies that do more harm.        to move them
                                                                                             into the centre
With the right focus, the provincial 2017-2018 budget can put the province on a path
to a jobs-rich, fair, and sustainable future. To do that, we need better indicators and a    of the media and
balanced debate.                                                                             public discussion.

Inadequate indicators

Gross domestic product (GDP) has long been recognized as a limited metric. It measures
activity in the economy, but not how it is distributed, for example between incomes for
the people as opposed to corporate profits. This matters for Newfoundland and Labrador.
GDP per capita is third highest among the provinces, and the highest by far in Atlantic
Canada. However, the proportion of that going to people, measured by median income,
is third lowest among the provinces, and is the very worst in Atlantic Canada.

The official unemployment rate (R4) is very high at over 14 per cent, and has been rising
even as Canada’s rate drops. This number — as bad as it is — includes only those actively
looking for work, not those who have given up. The more inclusive R8 rate is 18.5 per
cent. In 2018 it will exceed 20 per cent — one in five.

Employment numbers also don’t tell us what kinds of jobs are being created. Part time
work has doubled in the last 40 years and Newfoundland and Labrador leads the nation
for temporary work — both of which are associated with lower wages and worse or
non-existent benefits.

                                                            NEWFOUNDLAND AND LABRADOR FEDERATION OF LABOUR     5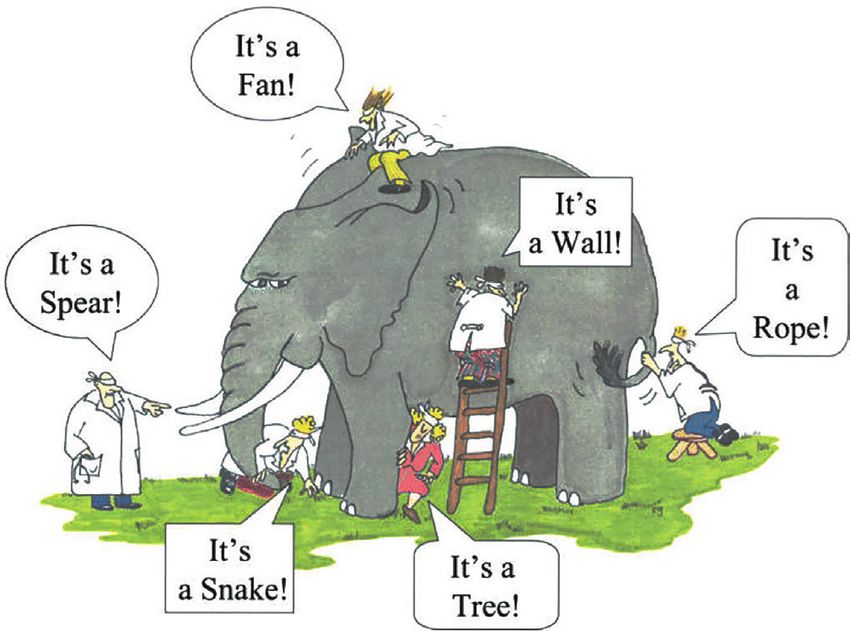
Deficits

                              Deficit obsession can lead to misguided spending cuts, and draws attention away from
                              important things like the strength and resilience of the economy. Canadian debt levels
                              are among the lowest in the G7. The government is forecasting a return to a fiscal surplus
                              in 2022-23, and the debt-to-GDP ratio will decline.

                              Deficits are about both spending and revenues. Newfoundland and Labrador has yet
                              to reinstate taxes for the wealthy and corporations, and has the lowest revenue per
                              GDP in Atlantic Canada.

                              Indicators for a better future

                              This report aims to increase government emphasis on indicators for a more jobs-rich,
                              fair, and sustainable economy. These include:

For too long, the             Jobs rich indicators:
government and
                                 ■■   Direct and indirect employment impacts of budget decisions and business
media conversation
                                      spending.
has centred on a few
narrow indicators,               ■■   Public sector employees per capita — NL is middle of the pack among provinces
                                      and has the lowest public sector employment to GDP in Atlantic Canada.
such as GDP, ‘official’
unemployment,                    ■■   Targets for tuition reduction and elimination, based on reversing cuts and ramping
and fiscal deficit.                   up post-secondary spending.
                                 ■■   Targets and a timeline for policies to address the job impacts of automation and
                                      how it can lead job creation when the private sector doesn’t.
                                 ■■   Measures of precarious employment, decent and fair incomes, unionization
                                      (targets should be set for higher: e.g., it is it is 91 per cent in Iceland, 67 per cent
                                      in Sweden, but only 37 per cent in NL), economic diversity (NL is the worst in
                                      Canada), and resilient rural areas.

                              Fairness indicators:

                              Income inequality is a defining issue of our time. Newfoundland and Labrador has the
                              third-worst level of income inequality among the provinces, and the worst in Atlantic
                              Canada.

                              While social spending is consistent with the other provinces, that’s not saying much;
                              Canada ranks near the bottom of the OECD on social expenditures per GDP.

                              The government should be leading a robust public conversation with data on fairness,
                              for instance:
                                 ■■   Tax rates on top incomes — the province has the lowest rate (but not for average
                                      incomes).

 6      NEWFOUNDLAND AND LABRADOR BUDGET 2018: MEASURING WHAT MATTERS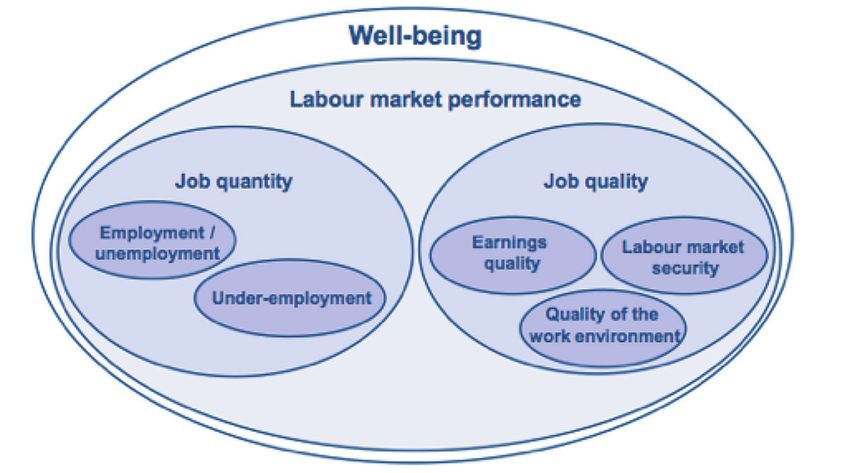
■■   Other revenue indicators, e.g., relative trends in personal income tax versus
        corporate income tax revenues.
   ■■   Spending indicators, like the ratio of the Income Supplement to the poverty line,
        and various poverty measures, which are quickly trending upward.

The government should also publish a budget impact indicator that shows the financial
impact of budget decisions on disadvantaged individuals, and indicate when it will
enact pay equity.

Sustainability indicators:

Climate change is another defining issue of our time, and recent policies adopted by
the federal government and other provincial governments represent real progress in
tackling this issue.
   ■■   The government of Newfoundland and Labrador should publish independent                   There are many
        assessments of its climate policies and whether they will achieve their GHG              important
        reduction targets. The federal government has adopted a backstop carbon price            measurements that
        that will reduce emissions, while providing the province with very large revenues.       the government
        The provincial government could adopt rates above those in the federal schedule,         needs to be
        as Alberta and B.C. have done, reducing emissions faster while raising more funds.       emphasizing with
   ■■   The government should adopt a schedule for boosting the funding and pace of              the public, such as
        energy efficiency programs that reduce energy wastage and the cost of living,            the full details of the
        while creating good green jobs. It should track and publish progress indicators,         jobs crisis, inequality
        such as the percentage of older, less efficient buildings upgraded.                      and tax fairness, and
   ■■   The government should lead a discussion of prices that the citizens (owners)             whether its response
        are getting for sale of their non-renewable resources, compared to leading               to climate change
        jurisdictions and to what the companies are taking.                                      will be adequate.
   ■■   The government should lead a public discussion of the harvest rates and
        sustainable yield of renewable resources, including fish and forests.

Conclusions

What gets measured matters in terms of budget decisions and other policies. For too
long, the government and media conversation has centred on a few narrow indicators.

There are many important measurements that the government needs to be emphasiz-
ing with the public, such as the full details of the jobs crisis, inequality and tax fairness,
and whether its response to climate change will be adequate.

We need to ensure that the government, the media, and the public conversation are
focusing on what really matters to Newfoundlanders and Labradorians, and that what
really matters gets measured.

                                                                 NEWFOUNDLAND AND LABRADOR FEDERATION OF LABOUR       7
Introduction

WHAT GETS MEASURED IS WHAT MATTERS. Those in                 misdiagnosis, the policies that result can do more harm
the medical field know that it is important to look at the   than good to the economy. A focus on the deficit instead
right symptoms and test results to avoid a misdiagnosis      of the unemployment crisis or a focus on spending per
that can do harm. It is the same with the budget.            person instead of spending relative to income can lead
                                                             to spending cuts that would make the unemployment
The media, and the voting public, tend to pay attention
                                                             crisis far worse — undermining the foundations of tax
to numbers. The numbers that get discussed in the
                                                             revenues and making it more difficult to reduce the
public gain an added level of emphasis when govern-
                                                             deficit. It also matters who we compare ourselves to.
                           ments are making deci-
                                                             We can compare ourselves to our neighbours who may
In discussions of          sions. This in turn means
                                                             be choosing bad policies or we can look to places with
the budget and             that governments are more
                                                             outcomes that we want to emulate.
the economy the            strongly motivated to adopt
government of              policies that “move the dial”     The province is in a crisis. In response, this report aims
Newfoundland and           on these numbers.                 to help steer the discussion of the provincial 2017-2018
Labrador — like                                              budget — and future budgets and policies — toward
                            So it matters a great deal
others — has                                                 creating a jobs-rich, fair, and sustainable future. To
                            which numbers get dis-
emphasized a few                                             do that, the government needs to emphasize a fuller,
                            cussed. In discussions of the
                                                             more balanced, and more meaningful set of indicators.
narrow indicators.          budget and the economy
                                                             This report builds on previous budget analyses of the
                            the government of New-
                                                             Federation of Labour, and on the work of Common
foundland and Labrador — like others — has empha-
                                                             Front Newfoundland and Labrador, to hold dialogues
sized a few narrow indicators, like GDP, unemployment,
                                                             to develop a vision of a better future for the province.1
and annual deficits, instead of inequality, quality of
jobs and precarious work, or the debt to GDP ratio,          We call on the government to develop broader indica-
for example. The mainstream media in turn tends to           tors, and to give them a greater emphasis than the
focus public debate and its evaluation of government         traditional indicators, in order to move them into the
performance on those narrow indicators. In turn, govern-     centre of the media and public discussion. Note that
ments tend to emphasize budget and economic policies         some of the indicators discussed in this report are
that are aimed at achieving success on those indicators.     collected by governments, but are buried in statistical
                                                             tables; the point is to bring them into the mainstream
While these oft-reported indicators are useful, they
                                                             conversation. We call on government to adopt targets
are incomplete at best, and can be misleading; like a
                                                             and policies to improve outcomes related to that broader

8     BUILDING A BETTER FUTURE FOR NEWFOUNDLAND AND LABRADOR: BUDGET INDICATORS
The province is in a crisis. In response, this report aims to help steer the discussion
of the provincial 2017-2018 budget — and future budgets and policies — toward
creating a jobs-rich, fair, and sustainable future. To do that, the government needs
to emphasize a fuller, more balanced, and more meaningful set of indicators.

set of indicators, and to use such indicators to assess both
                                                                                                                     FINAL REPORT

(a) its budgets and related policies, and (b) longer-term
outcomes in achieving a jobs-rich, fair and sustainable
economy.2
                                                                           A Better Future
                                                                           Building a jobs-rich, fair, and sustainable
                                                                           economy for Newfoundland and Labrador

Report overview
                                                                           DECEMBER 2016

The next section of this report discusses what’s wrong
with the narrow focus on indicators like GDP, official
unemployment, and deficits.

In the second section, the report then considers indicators              This report builds on
for a jobs-rich economy. It suggests that the government                 previous budget analyses
publicly emphasize indicators that help assess whether                   of the Federation of
its budgets are steering the economy toward being richer                 Labour, and on the
in good jobs in the short term, and indicators to assess                 work of Common
whether the economy is becoming richer in good jobs                      Front Newfoundland
in the longer term. Later sections suggest government                    and Labrador, to hold
emphasize both short-term budget indicators and longer                   dialogues to develop a
term outcome indicators in relation to the goals of fairness             vision of a better future
and sustainability.                                                      for the province.
A brief section on conclusions follows at the end of the
report.

                                                                                                                                    9
Inadequate indicators
FOCUSSING DISCUSSION on just a few indicators their neighbours? No. The percentage of GDP received as
omits a great deal of information, and tends to reduce income by people (as opposed to corporate profits4) is
the government’s ability to adequately address the third lowest among the provinces, and is the very worst
broader range of social issues. Prime examples of the in Atlantic Canada (Figure 2).5
overdone indicators are GDP, official unemployment
This is just one illustration of why GDP and GDP per cap-
rate, and annual budget balance. While each of these
ita as indicators are limited and potentially misleading.
indicators is important, they are also inadequate without
As has been noted elsewhere, GDP also fails to assign
a broader context.
any value to work typically done inside the home, or to
volunteer activities, even though these are very import-
ant to the economy. It also assigns positive value to sets
GDP of activities that are harmful, for example, pollution or
vandalism that require clean up.
Overall economic activity is typically measured by GDP
(gross domestic product). GDP is often expressed on a
Figure 1: GDP per capita (2015)
per-population basis (GDP per capita), in order to allow
for comparisons over time and across differently sized $60,000
jurisdictions.
Why is GDP or GDP per capita an incomplete indicator?
It measures economic activity without any regard to
$40,000
who benefits. Thus while GDP or GDP per capita may
be increasing, it doesn’t mean that everyone benefits.
It can grow while the rich and corporations take an
increasing proportion of wealth and leave the rest of
$20,000
us behind — and this is exactly what has happened in
Canada since the 1980s.
In Newfoundland and Labrador, GDP per capita is rela-
tively high — third highest among the provinces, and the $0
highest by far in Atlantic Canada (see Figure 1).3 So, are Newfoundland Prince Nova New
and Labrador Edward Scotia Brunswick
Newfoundlanders and Labradorians all rich compared to Island
10 BUILDING A BETTER FUTURE FOR NEWFOUNDLAND AND LABRADOR: BUDGET INDICATORSFocussing discussion on just a few indicators omits a great deal of information,
and tends to reduce the government’s ability to adequately address the
broader range of social issues. Prime examples of the overdone indicators
are GDP, official unemployment rate, and annual budget balance.
In Newfoundland and Labrador, GDP per
Official unemployment rate
capita is relatively high, but the percentage
of GDP received as income by people (as
An economy rich in good jobs means two things: (a)
opposed to corporate profits) is third lowest that few people are out of work; and, (b) that the jobs
among the provinces, and is the very worst in that do exist are high quality jobs. Unfortunately, the
Atlantic Canada. This is just one illustration most-discussed jobs-related indicator — the official
of why GDP and GDP per capita as indicators unemployment rate (also known as the “R4” rate) — fails
are limited and potentially misleading. to provide a complete picture.
The official R4 unemployment rate in Newfoundland and
As an indicator of the economy and economic growth, Labrador is very high at over 14 per cent, and has been
GDP is helpful. However, it misses a lot, and can some- rising even as Canada’s rate drops. Yet this number — as
times be misleading in what it does capture. bad as it is — fails to include people who have been
unemployed for so long that they have given up on
Figure 2: Median income of individuals, looking for work (“discouraged searchers”). So in long
as a percentage of GDP per capita (2015) periods of high unemployment, the official unemploy-
ment rate can actually drop when people have given up
80% looking for work. The statistic suggests there is declining
unemployment, while the reality is the opposite, and
this type of unemployment is actually worse as it tends
60% to be longer term.
The official rate also ignores people who are not working
40% but are waiting for work (recall, replies, long-term future
starts), and people who want full-time work but can only
get part-time work. Adding in these people and the
20% discouraged searchers gives us the “R8” rate.
The 2016 official R4 rate was 13.4 per cent. But the more
0 inclusive R8 rate was much higher, at 18.5 per cent.6 RBC
Newfoundland Prince Nova New
and Labrador Edward Scotia Brunswick forecasts the official (R4) rate to rise in 2018 to 16.3 per
Island cent. The more complete R8 rate is likely to exceed 20
NEWFOUNDLAND AND LABRADOR FEDERATION OF LABOUR 11Unemployment is at a crisis level in this province.
per cent — one in five people of working age. Unemploy- Figure 4: Temporary employment
ment is at a crisis level in this province. % of total employment, 2016
While the unemployment level captures headlines, the
25%
troubling shift toward part-time work is less discussed.
Part-time work is associated with lower wages, and
often reduced or non-existent benefits such as ex- 20%
tended health care and pensions. In Newfoundland and
Labrador, part-time work has grown significantly. As a
percentage of overall employment, part-time work has 15%
doubled in the last 40 years (see Figure 3).7
10%
Figure 3: Part time work
% of total employed
5%
20%
0
Canada NL PEI NS NB QC ON MB SK AB BC
15% 16.3%
Clearly there is much more to the province’s labour
10%
picture than the official employment rate. Precarious
work is a significant issue.
7.8%
5%
Annual budget balance
0
1976 2016
Historically, a great deal of media attention has been
Newfoundland and Labrador also ranks high among given to the annual budget balance as an indicator of
Canadian province for temporary work (Figure 4). Tem- fiscal health, and whether the government is currently
porary workers also tend to be paid less and have fewer in surplus or deficit. While this is a useful indicator, the
and poorer benefits than regular permanent workers. level of attention to this one indicator has been vastly
inflated. Part of this is inertia, part is laziness, and part is
Is Newfoundland and Labrador’s high level of temporary
scaremongering by certain lobbies and the conservative
work just a result of overwhelming numbers of seasonal
movement, which stoke deficit fears in order to advocate
workers in the fishery, construction, or oil and gas sec-
for cuts to social services and income redistribution.
tors? No. Those sectors combined represent less than 15
per cent of employment in the province. Moreover, less The budget balance chorus only seems to subside when
than 30 per cent of temporary workers in the province governments are in surplus, at which point the ultimate
are seasonal (the lowest proportion in Atlantic Canada); goal — tax cuts — comes to the fore, and deficits and
70 per cent are contract, term, or casual. Less than 7 per debt are downplayed. Taxes are then cut, which reduce
cent of the province’s overall workforce is seasonal.8 revenues and creates the next deficit, at which point the
12 NEWFOUNDLAND AND LABRADOR BUDGET 2018: MEASURING WHAT MATTERSbalanced budget chorus resumes. This cycle played out Economists have been clear that government
in Newfoundland and Labrador starting with the tax cuts budgets do not need to be balanced every
in 2007, which predictably led to a revenue problem and year. Annual deficits can be sustained over
annual deficits. The current government has correctly
a period of many years. The response to
noted that those tax cuts were not sustainable, and that
the 2008 financial crisis showed that deficit
they created several billions of dollars of debt.9 Recent
moves to mitigate the budgetary impact of some of
spending during a recession is desirable in
those tax cuts have not solved the revenue problem. order to protect the economy, and that the
As reported by RBC Economics, the province now has only balancing needed, if any, is over the
the lowest revenue per GDP in Atlantic Canada (Figure multi-year business cycle — not annual.
5).10 And of course calls for deep spending cuts have
resumed. To its credit, the government has dismissed
such calls.11
economy, which is essential to supporting revenues that
are needed to reduce deficits.
Figure 5: Revenues per GDP
Economists have been clear that government budgets
Share of economic output collected through taxes do not need to be balanced every year. Annual deficits
can be sustained over a period of many years. The
30%
response to the 2008 financial crisis showed that deficit
27.5% spending during a recession is desirable in order to pro-
25% 26.8%
tect the economy, and that the only balancing needed, if
24.1% 24.9%
any, is over the multi-year business cycle — not annual.
20%
Indeed the budget can permanently be in annual deficits
if its GDP growth is adequate. The debt-to-GDP ratio and
15% the trend in that ratio are more important indicators.
Advocates for cuts are currently emphasizing debt-to-
10%
GDP comparisons, partly because Newfoundland and
Labrador’s debt-to-GDP ratio is currently relatively high
5% within Canada, at 49.9 per cent. However, for context,
Canadian debt levels are among the lowest in the G7.14
0% There are many jurisdictions with a far higher debt-to-
Newfoundland Prince Nova New GDP ratio, and there is no evidence that ratios of even
and Labrador Edward Scotia Brunswick
Island 80 or 90 per cent affect economic growth.15 Post-war
Britain had a ratio of 200 per cent and experienced solid
Not only is the attention paid to the annual budget bal- economic growth.
ance inflated, but it is somewhat misguided. Indeed it
can contribute to foolish goals like striving to balance the The province’s debt to GDP ratio has not reached the
budget every year. This can include so-called “balanced levels of the past — almost 70 per cent in the late
budget laws,” which are typically swept aside when no 1990s — and is not forecast to do so. The upward move-
longer convenient (for example, Saskatchewan’s Wall ment has already tapered significantly, with the next
government repealing its balanced budget law in 2016,12 forecast increase being 2.3 per cent (Figure 6) — less than
a month before releasing financial statements showing a fifth of the annual increase that followed the global oil
it ran a deficit13). price crash in 2015.16 The government is forecasting a
return to a fiscal surplus in 2022-2317 and for GDP growth
Deficit obsession also draws attention away from to be positive in 2018 and 2019.18 This means that the
important things like the strength and resilience of the debt-to-GDP ratio will be shrinking soon.
NEWFOUNDLAND AND LABRADOR FEDERATION OF LABOUR 13Figure 6: Changes in NL net debt-to-GDP ratio Figure 7: Focussing on too few
indicators can be misleading20
15%
10%
5%
0%
-5%
2010 2011 2012 2013 2014 2015 2016 2017
-2011 -2012 -2013 -2014 -2015 -2016 -2017 -2018f
Thus, while the government does need to pay attention
to the debt, and needs to increase revenues to address
it, it is not a crisis in the way that unemployment is.19 Existing data and proposals
Indeed, it appears that by focusing on recent and for improvements
current annual deficits, and not looking at forecasted
Statistics Canada, the Newfoundland and
debt-to-GDP ratios, spending-cut lobbies are being
Labrador Statistics Agency, and other
opportunistic — perhaps in order to bolster their claims
government bodies gather and publish a wide
before the indicators turn positive.
range of statistics. Of course, not all relevant
The government should be emphasizing in its fiscal indicators are gathered or reported. And
reporting and discussions with the public and media moreover, the focus of public discussion, led
the numbers that matter more, such as debt-to-GDP by governments, is centred on a few.
ratio medium-term and long-term forecast, and how it
There are many initiatives that aim to improve
compares with other industrialized jurisdictions.
the indicators that government and others
To sum up, public discussions that focus on just a few use, each having different goals, methods,
indicators like GDP, official unemployment rate, and etc., such as the Genuine Progress Indicator,21
annual budget balance leave out a lot of valuable infor- the Canadian Index of Wellbeing,22 the Social
mation. Also they can be misleading — causing some to Progress Index,23 the Inequality-Adjusted
draw the wrong conclusions about what is happening Human Development Index, and the Gender
(see Figure 7) and what matters most. As a result, a Development Index.24
narrow discussion focussed on such indicators creates
Like these other initiatives, this report does
skewed incentives for government when it establishes
not attempt to provide a single, universal,
goals, sets budgets, and makes other policies. The nar-
comprehensive indicator. It aims to increase
row indicators don’t point the way to a better future.
government emphasis on indicators related
Unfortunately, what matters is not always what gets to a more jobs-rich, fair, and sustainable
measured or discussed by government. economy.
14 NEWFOUNDLAND AND LABRADOR BUDGET 2018: MEASURING WHAT MATTERSIndicators for a better future
THIS SECTION discusses indicators and directions that The indicators discussed in this section are not
could help lead Newfoundland and Labrador toward intended to be exhaustive or conclusive, but
a future that is rich in good jobs, fair, and sustainable. rather to point the way toward a broader public
These discussions are not intended to be exhaustive or dialogue that can result in a more complete
conclusive, but rather to point the way toward a more and useful set of indicators being discussed
complete and useful set of indicators being discussed by government, media, and the public.
by government, media, and the public.
initiatives. But are they really set up to maximize good
jobs? The government should be discussing with the
Rich in good jobs public its decision criteria and indicators, for example
whether the spending is:
The government needs to lead and support a fuller and ■■ Conditional — made conditional upon actual
more meaningful conversation about employment. This good job creation in this province;25
will require the government to regularly discuss with the ■■ Local — directed to locally-owned businesses,
media and the public a set of indicators that will track the which tend to employ more local people
full numbers on unemployment and underemployment per dollar invested (e.g., in sustainable food
and the quality of jobs in Newfoundland and Labrador, production, sustainable tourism, Indigenous arts
and to implement policy that supports improvement and crafts, hospitality, and retail); and
in those areas.
■■ Bang-for-buck — directed to sectors that tend
to create a high ratio of jobs per dollar invested
Rich in good jobs — budget indicators (e.g., green jobs in energy efficiency, and
pollution reduction26).
The government’s budgets, and other policy decisions,
can encourage the creation of more and better jobs. The government needs to emphasize indicators of both
What budget indicators could help focus attention on direct and indirect employment impacts of budget
the right budget policies? decisions. Governments can destroy jobs with budget
cuts — not just the announced layoffs and attrition, but
Government spending on businesses — whether also contracting out, privatization, and general spending
direct spending (e.g., normal public procurements, and cuts that don’t mention job losses but will likely require
P3s) or tax expenditures (e.g., small business preferential them to be carried out by departments, agencies, boards,
income tax rate) — are often justified as job creation and commissions. The impacts of such spending cuts will
NEWFOUNDLAND AND LABRADOR FEDERATION OF LABOUR 15also be felt in the private sector, as indirect and induced Figure 8: Public sector employees by population
job losses when governments and laid-off workers spend Employees per 100 population
less. The government needs to conduct full and frank
public discussions about all the direct and indirect job 13
12 12.7%
impacts of its budget decisions.
11.8%
11 11.4%
Some claim public sector employment is “too high” 10.8%
10
based on ratios of public sector employment to private
9
sector employment or total employment.27 A narrow
8
focus on this topic tends to ignore rural and demographic
7
realities of the province, and the fact that the civil service
6
provides a stabilizing employment counterweight that
smooths the economic 5
Governments can ups and downs caused 4
destroy jobs with by global commodity 3
budget cuts — not price swings. 2
just the announced 1
In addition to thinking
layoffs and attrition, 0
more broadly about the Newfoundland Prince Nova New
but also contracting topic, there is a need to and Labrador Edward Scotia Brunswick
out, privatization, and think about the indicator
Island
general spending cuts used to measure it. The Another indicator of the number of public servants is
that don’t mention ratio of public sector em- based on the capacity of the economy to sustain those
job losses but will ployees to other workers workers. The number of public sector employees per
likely require them is not the only indicator, GDP in this province is the lowest in Atlantic Canada
to be carried out. and it may not even be (Figure 9).29
the most useful. Public
servants actually need to serve the entire population, not The government needs to not only discuss with the
just workers. Indeed, significant portions of the public public indicators of the right topics, but also to discuss
service need to serve specifically non-workers (e.g., the adequate indicators of those topics.
elderly, the unemployed, and children) more than they
need to serve workers. Figure 9: Public sector employees by GDP
To measure the ability to deliver needed public services, Employees per $ million GDP
a more useful indicator is the ratio of public sector em- 400
ployees to overall population. And it turns out that the
province is middle of the pack among the 10 provinces.
300
B.C., Alberta, Ontario, and Quebec have the lowest 301
ratios of public sector employees per population. Those 268
240
provinces also have very large populations (eight to 20 200
times the size of Newfoundland and Labrador), and thus 195
can be expected to have lower ratios due to economies
of scale. When we look at the smaller provinces (under 100
4 million), Newfoundland and Labrador actually has
the second-lowest ratio of public sector employees per
0
population in Canada, and second lowest in Atlantic Newfoundland Prince Nova New
Canada (Figure 8).28 and Labrador Edward Scotia Brunswick
Island
16 NEWFOUNDLAND AND LABRADOR BUDGET 2018: MEASURING WHAT MATTERSGovernment targets for improving education, train- technology (e.g., a company pays a portion of
ing, and transitions can help build a workforce that the taxes that the replaced worker would have
is attractive to a diverse range of employers, and help paid in personal income tax);
residents of Newfoundland and Labrador to acquire jobs ■■ A capital tax, and/or a higher income tax rate for
available and strengthen the economy. The government corporations that employ relatively more capital
needs to be providing information to the public on: and less labour;36 and
■■ Target dates for tuition reductions and ■■ Taxing capital gains at the same rate as earned
elimination, based on ramping up post- income (it is now effectively taxed at half the
secondary spending plans; and rate, and the first $800,000 is tax-free).
■■ Percentage of dollars restored by reversing
funding cuts (e.g., to Memorial University
of Newfoundland (MUN), to apprentice
Rich in good jobs — outcomes
scholarships, and to the department of
Advanced Education, Skills and Labour).30
What longer-term indicators can the government discuss
Automation can eliminate jobs and reduce wages,31 and with the media and the public, to help focus attention on
according to a number of forecasts will affect as many developing an economy rich in good jobs, and to help
as 40 to 50 per cent of jobs in developed economies in measure progress toward that goal?
coming decades.32 This is an emerging reality, and we
are not prepared. It is being discussed, but governments The government needs to provide greater emphasis to
have yet to plan and develop policies for implementation the full unemployment picture, including those who
over the medium and long term. have given up looking for work. It needs to discuss the
full number of unemployed (including those who have
The government needs to launch a data-supported given up looking for work, involuntary part-timers) and
discussion with citizens on automation, the appropriate underemployed people, presented alongside the official
indicators and forecasts of local job and wage losses, and unemployment rate, and with greater emphasis than
how it is preparing for the changes to come. Government the official rate.37
can help the transition by providing re-training and
education upgrades, financial support during transi- As important as the number of jobs in the economy is the
tions, employment standards enforcement, and other quality of jobs. The government should be reporting
important public services. Such an expanded program with emphasis on:
can be financed, and at the same time encourage ■■ Precarious employment,38 including the
industries to employ more people and bolster wages, percentage of jobs that are a standard
by implementing an automation taxation strategy. employment relationship, i.e. full-time,
Automation taxes are increasingly being discussed by permanent, continuous employment, as
tech entrepreneurs,33 elected officials,34 and others. opposed to precarious jobs; and
South Korea was first to introduce one.35
■■ The proportions of workers with and without
The government should be discussing targets and a standard benefits, like pensions, sick leave,
timeline for developing an automation tax structure. vacation leave, severance, and extended health
Such a structure could include, for example: insurance.
■■ Excise taxes on sale or import of worker- There is a well developed international body of literature
replacement technology, e.g., retail kiosks, on indicators for job quality that can be used as a starting
industial robots; point by the government. For example, a detailed study
■■ Surtaxes on profits arising from labour cost commissioned by the European Parliament in 2009
reductions associated with worker-replacement reviewed the many indicators available at the time and
NEWFOUNDLAND AND LABRADOR FEDERATION OF LABOUR 17created a model for the EU (see Figure 10) and the OECD The government needs to be drawing greater attention to
has a set of indicators for which data has been collected indicators of decent and fair incomes, which are essential
since 2005 (see Figure 11).39 to individual and social well-being, for example:
■■ The wage gap for women and minorities; and
Figure 10: Sketching a general ■■ The living wage, and how far the minimum wage
model of job quality (EU) is below it.
Studies by the International Monetary Fund (IMF), Or-
ganization for Economic Cooperation and Development
(OECD), and others have clearly found that union density
is associated with quality jobs and working conditions as
well as lower inequality and more democratic engage-
ment.42 As in other provinces, union density has fallen in
Newfoundland and Labrador — from 45 per cent in 1981
to less than 37 per cent in 2017.43 It could be much higher;
for example, it is 91 per cent in Iceland, 67 per cent in
Sweden, and 65 per cent in Finland (but with 89 per cent
collective bargaining coverage) — all countries that are in
the top 10 (with Canada) for quality of life.44 The province
should set clear targets on key indicators for boosting
union density and workplace protections, including:
■■ Goals for increased union density by public/
private sector, gender, and industry;
■■ Employment standards enforcement, including
reasonable time required to respond to and
resolve complaints, numbers of workplace
inspectors, manageable caseloads, successful
prosecution of violations, etc.; and
Source: Muñoz de Bustillo et al. 200940 ■■ A range of other quantitative and qualitative
indicators.45
Figure 11: Job quality framework (OECD) It is important for the economy to maintain and create
good jobs in diverse and resilient sectors and rural
areas, and for the government to establish targets for
improvements. The government could develop indicators
and discuss with the public targets and progress on:
■■ Diversity of the economy overall, e.g., with a
diversification index. According to the Northern
Economic Diversification Index,46 Newfoundland
and Labrador has the least diversified economy
among all provinces, and far lower than the
Atlantic Canada average (Figure 12).
■■ Proportion of GDP that is due to locally owned
businesses (which tend to be relatively diverse as
Source: Cazes et al. 201541 a whole, and to create more jobs);
18 NEWFOUNDLAND AND LABRADOR BUDGET 2018: MEASURING WHAT MATTERS■■ Local value-added production in resource
sectors, compared to exports of raw resources Fair
extracted (from farming and fisheries to oil and
gas); and
■■ Percentage of jobs in sectors vulnerable to Income inequality is one of the defining issues of our
global price shocks versus those in the rest of time, with higher income individuals capturing a greater
the economy. and greater percentage of wealth. Newfoundland and
Labrador has the third-worst level of income inequality
among the provinces, and the worst in Atlantic Canada
Figure 12: Economic diversification index (2015) (see Figure 13).48 Inequality matters, because it is as-
sociated with slower economic growth as well as worse
94
outcomes on a range of issues, irrespective of whether
the jurisdiction is wealthy or poor, for example:
92 ■■ Child well-being;
■■ Educational attainment;
90 ■■ Trust and community life;
■■ Physical and mental health;
88 ■■ Obesity;
■■ Drug abuse;
86 ■■ Social mobility;
■■ Teen pregnancies;
84 ■■ Violence; and
Canada MB NB QC BC ON NS PE SK AB NL
■■ Imprisonment levels.
Government steps toward Figure 13: Income inequality (Gini coefficient)
diversification and indicators
0.32
The provincial government has been taking
0.314
initial steps to increase diversification, and
sector-specific targets or indicators. For 0.30
example, the government aims to “double 0.298
food self-sufficiency through increasing
agricultural activity, which could double direct 0.28
0.279
farm employment” and is “investing in high 0.273
performing businesses and working with
0.26
technology companies to grow knowledge-
based firms.”47
The government can build on these early efforts, 0.24
Newfoundland Prince Nova New
developing additional output and employment and Labrador Edward Scotia Brunswick
goals and indicators in newer and labour- Island
intensive sectors that provide employment in The Gini coefficient calculates the extent to which the distribu-
areas of need (e.g., rural and small towns). tion of income among individuals deviates from an equal dis-
tribution. The higher the coefficient, the greater the inequality.
NEWFOUNDLAND AND LABRADOR FEDERATION OF LABOUR 19Figure 14: Social expenditures as a percentage of GDP (OECD, 2015)49
Furthermore, the province’s social spending, while rela- Government revenue progressivity. Revenues can be
tively consistent with other provinces due to equaliza- made more progressive overall, so that those less able
tion and transfers, is low compared to other developed to support public spending make a smaller contribu-
countries; Canada is near the bottom of the OECD on tion, and those more able make a higher contribution.
social expenditures per GDP (Figure 14). Government taxes and transfers can significantly reduce
inequality. However, even after the latest personal
It doesn’t need to be this way. With a GDP per capita
income tax increase, Newfoundlanders and Labradorians
above the Canadian average, there is no need for
who are most able to make a higher contribution (those
anyone in this province to be forced into poverty, and
in the top personal income bracket) pay the lowest
nobody should lack adequate health care, education,
marginal income tax rate in Atlantic Canada (Figure 15).50
or other important services. Pay equity is long overdue.
The poorest child born in Newfoundland and Labrador
Figure 15: Top income bracket tax rate
should have a realistic chance of a good life. To bring due
policy attention to these issues, the government should 21
be leading a robust discussion of inequality indicators 21%
and policies that can move them.
20 20.3%
Marginal tax rate %
Fair — budget indicators
19
The government’s budgets, and other policy decisions,
can encourage the creation of a fairer economy — one
18.3% 18.37%
that protects those most in need, and relies on those 18
most able to help. The government can set real goals
for a fair economy, establish policies, and provide the
indicators to measure progress. What indicators could 17
Newfoundland Prince Nova New
help focus attention on budget policies that build a and Labrador Edward Scotia Brunswick
fairer economy? Island
20 NEWFOUNDLAND AND LABRADOR BUDGET 2018: MEASURING WHAT MATTERSComparing that top bracket rate to the rate for the Government spending indicators can provide informa-
average earner gives a measure of the progressivity or tion on poverty and steps taken to support lower and
regressivity of the rate structure. The higher the ratio, the middle income people, for example:
more progressive; the lower the ratio, the less progres- ■■ Ratio of the poverty level to:
sive. By this ratio, Newfoundland and Labrador has the
least progressive income tax rate structure in Atlantic ■■ the Income Supplement (which currently
Canada (Figure 16).51 provides a very low level of income support);
and
■■ the income threshold for low income
Figure 16: Progressivity of personal income tax
individuals and families to be exempt from
Marginal rates for top income bracket/ income taxes;
NL average ($44,000 per year)
■■ Ratio of early childhood education costs
1.45 compared with the lowest in Canada; and
■■ Extent to which the population is protected by
1.40 a guaranteed basic income. We already have
1.40
a basic income for people with children (the
1.35 1.37 new Canada Child Benefit, which has reduced
poverty significantly) and for seniors (Old Age
1.33 Security + Guaranteed Income Supplement).
1.30
Extending it to people who currently fall
through the cracks could significantly reduce
1.25 1.26 poverty and inequality, and their social and
economic costs.
1.2
The government also should develop and publish a
Budget Impact Indicator that forecasts the financial
1.15 impact of provincial budget decisions on traditionally
Newfoundland Prince Nova New disadvantaged individuals, e.g., women, low-income,
and Labrador Edward Scotia Brunswick
Island LGBTQ, and racialized groups. It also should include
in budget legislation (and other statutes as needed)
More complex and complete measures would compare provisions to enact the House of Assembly’s unanimous
the actual taxes paid, rather than the marginal rate, as adoption of MHA Gerry Rogers’ motion on pay equity.53
a proportion of income, at various income levels; such
a measure would likely result in findings of generally
lower progressivity.52
Fair — outcomes
In addition to various indicators of the progressivity of
personal income taxes, the government could also be What longer-term indicators can the government discuss
leading public discussions on comparative ratios and with the media and the public to help focus attention
ratio changes through time of other revenue streams, on developing a fair economy, and to help measure
for instance: progress toward that goal?
■■ Personal income tax revenues to corporate
Income inequality overall is typically measured using
income tax revenues; and
the Gini coefficient, discussed above, as well as other
■■ Personal income tax to regressive revenues from indicators. However, the numbers need to be provided
individuals (e.g., sales tax, user fees). in context, measuring trends over time and comparisons
not only within Canada, but also against developed
NEWFOUNDLAND AND LABRADOR FEDERATION OF LABOUR 21countries with a high quality of life, as well as inequi- The government should be emphasizing relevant indica-
ties among workers (e.g., the persistent gender and tors in public discussions, including both trends over
racialized worker wage gaps54). The government needs time, and comparisons with other provinces and OECD
to be talking with the public about income inequality countries, such as:
and what reductions targets it is setting, the policies to ■■ Percentage of residents living in poverty,
achieve those targets, and indicators for progress along including the working poor;
the way.
■■ Child poverty;
The provincial government made strides to reduce
■■ Food bank usage;
poverty in the days of easy oil money. Two years ago,
it announced that the province had the lowest level of ■■ Homelessness;
poverty of any province in Canada — based on the most ■■ Economic mobility;
recent available data (from 2013). However, the data now
■■ Percentage of the population with above-
available (from 2015) shows an increase of 22 per cent
poverty level pensions;
over 2014 levels in the percentage of people living in
poverty (Figure 17),55 and Newfoundland and Labrador ■■ Access to affordable housing; and
is no longer lowest. Data for 2016 and 2017 likely will ■■ Student and household debt loads.
show that the poverty rate has continued to increase.
Note that Figure 17 employs the low-income cut off
measure for poverty, as this was the measure that the
government used. Other measures, such as the market-
basket measure (MBM) and the low income measure Sustainable
(LIM) show significantly higher levels of poverty, as well
as the recent increase.
The government needs to discuss with the public
Figure 17: Poverty up sharply in 2015 indicators and results through clear, consistent, annual
Percentage of NL population living in poverty, 2010 reporting of its policy progress and outcomes progress
to 2015 (LICO-AT) on key sustainability issues, including greenhouse gas
(GHG) emission reductions.
7%
6%
Sustainable — budget indicators
5%
The government’s budgets, as well as its complementary
policy decisions, can create positive incentives to save
4%
money and boost profits by reducing emissions and
other environmental harm.
3%
The highest priority issue area is that of climate change.
2%
Recent projections of Canadian emissions had Canada
failing to meet its 2030 emission targets. However,
projected emissions are significantly lower than previ-
1%
ous projections, due to new climate policies adopted,
uptake of electric vehicles, expansion of renewable
0%
2010 2011 2012 2013 2014 2015 electricity generation, and other factors. Furthermore,
the Pan-Canadian Framework on Climate Change56 of
22 NEWFOUNDLAND AND LABRADOR BUDGET 2018: MEASURING WHAT MATTERSlate 2016 notes announced measures, including carbon An indicator of good budget policy to save energy is a
pricing, that will take Canada’s emissions much closer to schedule for expanding the funding and accelerating
target — to 567 MT. the pacing of energy efficiency programs59 that reduce
energy losses and the cost of living, while creating good
A key indicator of effective budgetary policy to address
green jobs.60
climate change is the schedule for a steadily-escalating,
predictable carbon price that encourages ongoing Non-renewable resources such as oil and gas, once
emission reductions, and finances rebates to low- and extracted, are gone. The citizens, who own them, need
middle-income families.57 The federal “backstop” pricing to have confidence that their assets are being sold at
schedule (see Figure 18) will apply to provinces that fail the market price, i.e., the maximum price that buyers
to implement their own price, but the vast majority of are willing to pay. Ensuring the maximum price is
Canadians live in provinces that have already designed received will also help to conserve these resources. The
carbon pricing policies to suit their own needs. Alberta government should be publishing and discussing the
and B.C. are proceeding with pricing schedules that rise royalties, taxes, leases, sales, equity, and other “rents” that
above the federal backstop schedule. Newfoundland and Labrador is receiving, compared to
what other governments are receiving, and compared
to rents that the companies are taking. This transparency
Figure 18: Federal backstop carbon pricing
and a public discussion will help governments focus on
schedule58
obtaining the best deal they can for their citizens.
Year $ per ton
2018 10
Sustainable — outcomes
2019 20
2020 30 What longer-term indicators can the government
2021 40 emphasize with the media and the public to help focus
2022 50 attention on developing a more sustainable economy,
and to help measure progress toward that goal?
2023+* 50+?*
Newfoundland and Labrador failed to achieve its 2010
NL revenues from federal carbon pricing schedule target of reducing climate change emissions to 1990
$500 levels.61 As of the most recent projections, the province
was not on track to meet its 2020 target (10 per cent
$400 below 1990 levels),62 though the Pan-Canadian Frame-
work may enable the province to do so. The province’s
millions
$300 2050 target (75 to 85 per cent below 2001) will require
major reductions. An appropriate indicator for the
$200 provincial government to be discussing with the public
would be annual forecasts of emissions that are linked
$100 with independent, credible assessments of whether
government GHG emission policies adopted to date
$0 will enable the province to achieve its reduction targets.
2017 2018 2019 2020 2021 2022
The province has expanded its support for energy ef-
*The federal price after 2023 has not yet been established. ficiency building upgrades, which will help lower energy
The provincial government can set a higher price to more
waste and the cost of living, while creating jobs. An ap-
effectively reduce pollution, and bring in more revenues.
propriate indicator would be the percentage of building
NEWFOUNDLAND AND LABRADOR FEDERATION OF LABOUR 23with low efficiency (e.g., pre-1970 buildings) that
have been upgraded or scheduled for upgrades.
Newfoundland and Labrador residents have a
proud history of renewable natural resource
harvesting. Unfortunately, poor regulation resulted
in unsustainable harvest of the cod fishery, and
eventual collapse. Important indicators for the
government to discuss publicly include: estimates
Conclusions
of natural capital (e.g., fish, forest) stocks, harvest
rates, and sustainable yield; resource population
WHAT IS MEASURED MATTERS for developing
targets; policies to achieve those targets; and
publicly supported goals, implementing policy, and
milestone indicators.
attaining outcomes. Like many governments, the gov-
ernment of Newfoundland and Labrador issues reports
containing a variety of indicators of economic and social
well-being. However, the conversation routinely focuses
on a narrow range of indicators such as GDP, official
unemployment levels, and annual deficit. This report
illustrates that those indicators are incomplete, can be
misleading, and can lead to policy decisions that are
harmful to the economy.
Unemployment is at crisis levels in the province and
needs urgent attention. The government needs to be
setting goals for a future with more quality jobs — as
well as greater fairness, and greater sustainability. To do
that, the government needs to draw public attention
to a more meaningful set of indicators for monitoring
progress.
This short paper has suggested key areas where more
focus is needed, and in some of those areas has sug-
gested example indicators. The data is available for most
of these indicators, and others can be obtained by the
government.
The government of Newfoundland and Labrador needs
to work toward a better future for its citizens. An essential
part of that is identifying what to measure and how to
measure it, discussing those measures with the public,
and putting in place the policies that bring us toward
that better future.
We need to ensure that the government, the media,
and the public conversation is focusing on what really
matters to Newfoundlanders and Labradorians, and that
what really matters gets measured.
24 NEWFOUNDLAND AND LABRADOR BUDGET 2018: MEASURING WHAT MATTERSYou can also read