Country Profile: USA California - 2020 Producer country profile produced by CIRAD, The Centre De Cooperation International En Recherche ...
←
→
Page content transcription
If your browser does not render page correctly, please read the page content below
2020           Country Profile: USA California

Producer country profile produced by CIRAD, The Centre De Cooperation International
En Recherche Agronomique Pour Le Développement.

                                                        www.hassavocadoboard.com
World avocado production prospects

     California
       In transition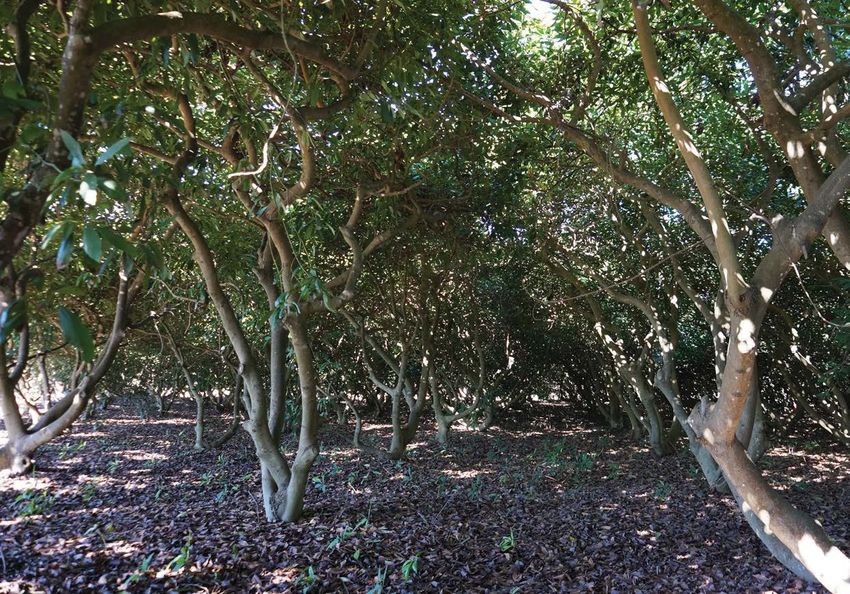
Acknowledgements
                   This publication is the fruit of a partnership between the Hass
                   Avocado Board and the CIRAD Market News Service. The editorial
                   team would like to thank all the professionals who have contributed
                   to drawing up this country profile.
                   Photo credits: Carolina Dawson, Eric Imbert, Mission Produce,
                   CAC, USC Digital Library, California Historical Society Collection,
                   University of Southern California

                                                 © January 2020

Exemption clause: the opinions expressed in the present document are solely those of the authors, and under no
circumstances may be considered as stating the official position of CIRAD or the HAB. The contents were drawn up in
all good faith. However, the authors cannot guarantee the exhaustiveness or accuracy of the information provided, nor
that this information is up to date, or appropriate for specific purposes.
The avocado in California
 A pioneering and innovative origin in many fields, both technical and marketing,
 the Californian avocado industry remains to this day the world number four in
 terms of planted areas, extending over approximately 55 000 acres. Since the
 early 1990s it has faced growing problems of competitiveness, in a context
 of rampant urbanization. The production system and structure have remained
 mainly traditional, while the costs of the main production factors have
 boomed, to become the highest in the avocado world. Nonetheless, the drastic
 shrinkage trend of the 2000s has given way to stabilizing planted areas, with
 the production zone situated to the north of Los Angeles holding up better than
 the southern zone, under greater stress.

                                 World avocado production prospects – CALIFORNIA    1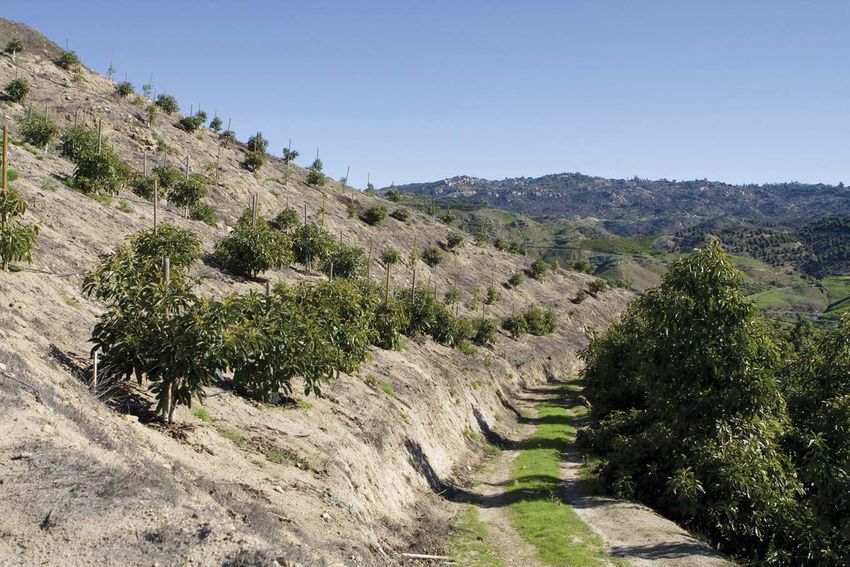
History
The Californian avocado industry is pioneering in more
than one respect. First of all, let’s take the literal meaning.
The avocado tree is not a native plant: reports of the first
documented specimen, imported from Nicaragua and
planted in a San Gabriel orchard, date from 1856. However,
California was one of the first zones in the world where
industrial plantations were set up, starting in 1908 in San
Marino (east of Los Angeles). The Californian industry was
also a pioneer in technical terms, bringing major innova-
tions in key fields such as varietal creation and propagation,
with Popenoe’s prospecting work supported by the USDA
in the early 20th Century, the selection of Fuerte, and then of
Hass by Rudolph Hass in the 1920s and the development of
clonal plants thanks to the technique of etiolation. Another
                                                                          from neighbouring Mexico, implemented in 1914, indirect-
key field was managing the first pathology to hit the world
                                                                          ly enabled the industry to take off in an uncompetitive con-
industry, namely Phytophthora, with Zentmyer’s work lead-
                                                                          text. On the other hand, a variety well suited to Californian
ing to the development of a combination of tolerant plant/
                                                                          winters, sometimes cool, was selected from the beginning
chemical treatment. The Californian industry also laid the
                                                                          of the 20th Century, Fuerte – a natural selection. This culti-
foundations of modern avocado marketing, by develop-
                                                                          var was the only one able to withstand the severe frosts of
ing a ripened fruit offering in the early 1980s (Henry in San
                                                                          1913. Finally, professionals managed to get organised at a
Diego), and then setting up a local and then federal pro-
                                                                          very early stage to defend their interests and work together
motion system, based on a mandatory assessment paid by
                                                                          on marketing, promotion and improving production tech-
industry stakeholders.
                                                                          niques by creating the California Avocado Association in
The solid bases on which the industry was able to develop                 1915, with the support of Riverside University in terms of
were laid from the beginning of the 20th Century. On the                  the technical aspects. Planted areas started to grow consid-
one hand, the ban on imports, for sanitary reasons, of fruit              erably from the mid-1920s. The industry’s centre of gravi-
                                                                          ty at the time was in the far south of the State: the area of
                                                                          San Diego and southern Los Angeles still accommodated
                                                                          90 % of the cultivation area in the early 1950s. The more
                                                                          northern counties of Santa Barbara and Ventura made up
                                                                          just 370 to 500 acres in the aftermath of WW2. The culti-
                                                                          vation area gradually expanded thereafter, at an irregular
                                                                          rate. New very hard-hitting pathologies appeared, such
                                                                          as Phytophthora in the 1930s, and further severe frosts oc-
                                                                          curred (1922, 1937, 1949). The dynamic also followed eco-
                                                                          nomic cycles, with considerable expansion in planted areas
                                                                          in the mid-1920s, and then the late 1940s. This expansion

                                                                                    California avocado - Evolution of planted areas
                                                                                             (in acres | sources: CCLR, CAS, CAC)

                                                                          90000
                                                                          80000
                                                                           70000
                                                                          60000
                                                                           50000
                                                                           40000
                                                                           30000
                                                                           20000
                                                                           10000
                                                                                0
                                                                                    1920
                                                                                     1927

                                                                                    1962
                                                                                    1969

                                                                                    1990
                                                                                     1997

                                                                                     2011
                                                                                    2018
                                                                                    1955

                                                                                    2004
                                                                                    1934
                                                                                     1941
                                                                                    1948

                                                                                    1983
                                                                                     1976

2                                      World avocado production prospects – CALIFORNIA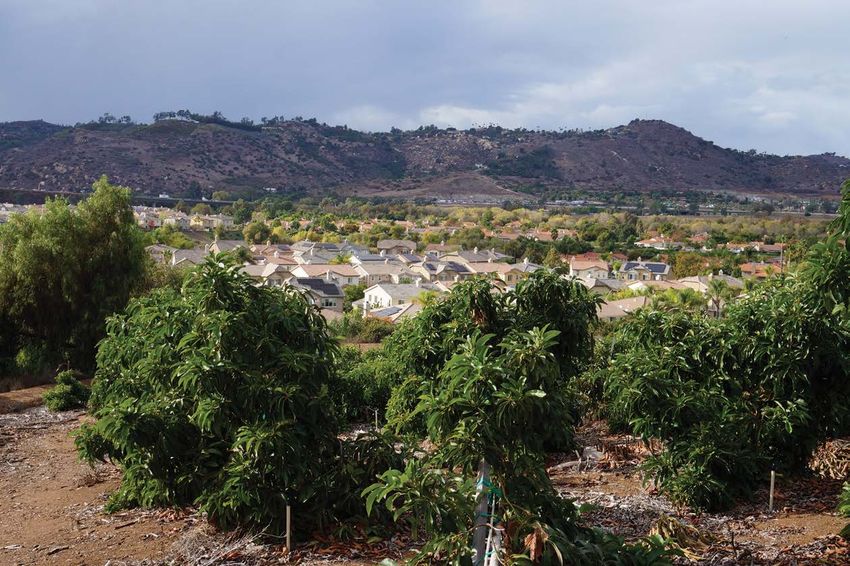
California in a few figures:
          With a GDP of nearly 3 trillion USD, California is the world’s 5th biggest economy. It is the most populous State in the
          USA, and the 3rd biggest in the world in terms of planted area.
          •• Population: 39.5 million inhabitants in 2019                Value of main agricultural crops
            (source: United States Census Bureau)                        (source: California Department of Food and Agriculture, 2018):
                                                                         •• Grape: 6.25 billion USD
          •• GDP/capita: 75 949 USD/year in 2018
                                                                         •• Almond: 5.47 billion USD
          •• Agriculture: 1.5 % of state GDP (far behind finance,        •• Pistachio: 2.62 billion USD
             real estate, technology, tourism, trade, etc.)              •• Strawberry: 2.34 billion USD
             and employs 3 % of the workforce                            •• Orange: 1.12 billion USD
                                                                         •• Avocado: 383 million USD

was followed in both cases by a period of stagnation due
to pressure on prices exerted by the increase in production.
The industry rallied to tackle these crises, by streamlining
the very wide varietal range around Fuerte (creation of a
Variety Committee within the CAA), organising the market-
ing (creation of the California Avocado Grower Exchange in
1924, which became Calavo in 1927) and launching promo-
tion actions, which in 1961 led to the establishment of a
California Hass Avocado Marketing Order, imposing a con-
tribution from all industry players. New markets were also
opened up (East Coast from 1926, and export from 1927).

Growth greatly gathered pace from the early 1970s, when                    its peak in the early 1990s, encompassing more than 75 000
the cultivation area comprised approximately 25 000 acres.                 acres and 8 000 growers. Another overproduction cycle
This new Gold Rush had three main origins, according to                    appeared thereafter, intensified by increased international
analysts: the implementation of a fiscal policy favorable for              competition, with the arrival of Chilean Hass, which sup-
agricultural investment, higher agricultural water availa-                 planted local varieties, and then the gradual entry of Hass
bility thanks to the execution of major infrastructure work,               from Michoacán, from 1997. Planted areas shrank, especial-
and the arrival in the USA of innovative irrigation tech-                  ly with 1990 bringing a hard frost in the north and with the
niques from Israel, which meant that cheap sloping terrain                 water stress starting to weigh very heavily in the south, as
(Chaparral zones) could be used. A great many “gentlemen                   California water quota from the Colorado fell. Furthermore,
farmers”, often alien to the crop and even the world of ag-                new stricter rules on food safety and orchard sanitary prac-
riculture (liberal professions, Navy personnel based in San                tices appeared, driving some of the lower-tech growers to
Diego, pensioners, etc.), acquired a few acres, thereby cre-               abandon the crop. The implementation in 2001 of a larg-
ating a wide base of very small growers with limited tech-                 er-scale promotion programme, with creation of the HAB,
nical know-how, especially in the San Diego region. The                    enabled not only a real consumption boom in the USA, but
industry also focused on Hass, a more productive variety                   also helped halt the shrinkage of avocado planted areas in
with a longer season, and more resistant in the post-har-                  California, by providing growers with better revenue. The
vest phase. Its centre of gravity started to shift gradually               Californian avocado planted area has stabilized at approxi-
northward, with large cultivation areas being set up in the                mately 55 000 acres since 2004-2005, and currently has ap-
counties of Ventura and Santa Barbara. The sector reached                  proximately 3 650 growers.

                                                       World avocado production prospects – CALIFORNIA                                    3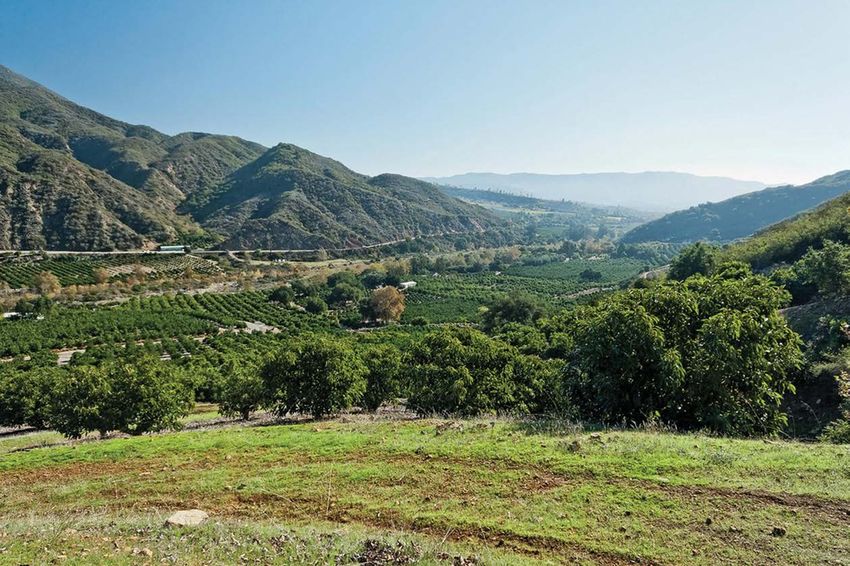
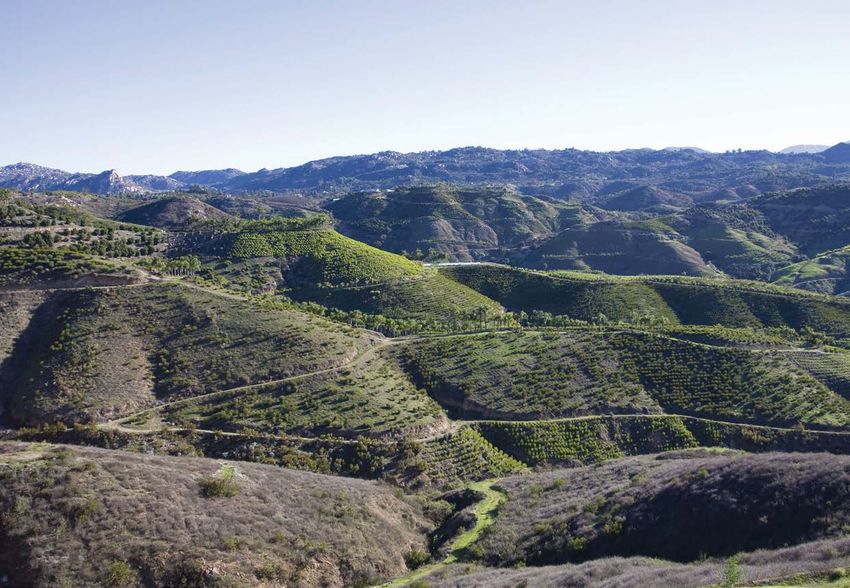
Current extension of the cultivation area, and location
A huge southern cultivation area, stabilizing after a long period of decline
Extending over an estimated 55 000 acres in 2018, the                      temperate zones in the north and other semi-arid zones in
Californian avocado cultivation area is the fourth largest                 the south, though the frost risk remains present. California
in the world. It is currently the only one of significant pro-             is increasingly exposed to extreme climate risks, especial-
portions in the country. The Floridian industry, which spe-                ly droughts, uncontrollable large-scale fires and hot winds
cialises in West Indian varieties and covered approximately                among others. Conversely, rainfall is low, which means that
11 500 acres at its height in the late 1980s, was practically              irrigation is required across the board. Planted areas, fall-
decimated after a major spell of frost in 1989 and Hurricane               ing steeply until 2015, are now tending to stabilize, with
Andrew in 1992. California’s place as the national avocado                 the cultivation area’s centre of gravity gradually shifting
number one illustrates this agricultural State’s specializa-               northward. Hence the production area located north of Los
tion in fruit: if the Mid-West is the breadbasket of the USA,              Angeles (Ventura and Santa Barbara, with additional plant-
the “Golden State” is its fruit basket, providing nearly two-              ed areas in counties further north such as San Luis Obispo)
thirds of the national fresh fruit and dried fruit supply (avo-            now encompasses approximately 30 500 acres, i.e. just over
cado, citruses, strawberry and other berries, almond, pista-               half of the State’s total planted areas. Meanwhile, the his-
chio, etc.). Californian avocado production is concentrated                toric production zone of San Diego and the other counties
in the south-west of the State, on the strip of land varying               situated south of Los Angeles has shrunk, with the cultiva-
in width between the coastal strip and the sea, mainly be-                 tion area recently dropping below the 24 000-acres mark.
tween Morro Bay in the north and the Mexican border in                     Alternate bearing is highly marked, resulting in production
the south. This zone has a very suitable climate, due to the               fluctuating between 220 000 and 500 000 pounds since
predominance of a hot Mediterranean climate, with more                     2010, with an average of approximately 330 000 pounds.

4                                       World avocado production prospects – CALIFORNIA
m in
ge
a
Ra
Dea
s
t
ng
R
e
an
th
ge
t
Amargos
Tem
rn
San
rk Ke
an
Ju
Fo
Morro Bay
Cr.
S.
blo
a Ra
R
Isabella L.
San Luis Obispo
r R
nge
Kern
Arroyo Grande
an
Bakersfield
a
Am
g
ar g
sa
e
Twitchell Res.
o
Santa Maria
Cu
yam
n
a
S is
S
qu
a
oc
n
a
g
R
fa
M o j a v e
el
M e hap
i Mt
s
ts Tehac
L. Cachuma
Gaviota
Sespe C
r.
s
Santa Barbara Ojai
Carpinteria D e s e r t
ve
Santa Paula Fillmore
Moja
Ventura
Somis Moorpark
San Gab Bu
iel M lli
ts on
M
Los Angeles Sa
ts
The avocado
n
San Bernardino B
e
rn
Riverside a
Long Beach
in California
rd
in
Santa Ana
o
M
Pa
ts
ci fic
Oc San Clemente Temecula
ea
n Fallbrook P
M alom
ou
Pauma Valley nta ar Salton
Sa
in
n
Fel
Valley Center Sea
ipe
Escondido
Avocado production zones
Major zones Poway
Lag
Other zones
San Diego
una
El Cajon Alpine
Mts
0 km 30 60 90 km
Avocado – California – Planted areas by county in 2018
Breakdown by county in acres share
San Diego 17 661 32 %
Riverside 5 175 9%
Other southern counties 1 474 3%
Total, South 24 311 44 %
Ventura 19 500 36 %
Santa Barbara 6 479 12 %
San Luis Obispo 4 004 7%
Other northern counties 362 1%
Total, North 30 345 56 %
Total 54 656
Source: CAC
World avocado production prospects – CALIFORNIA 5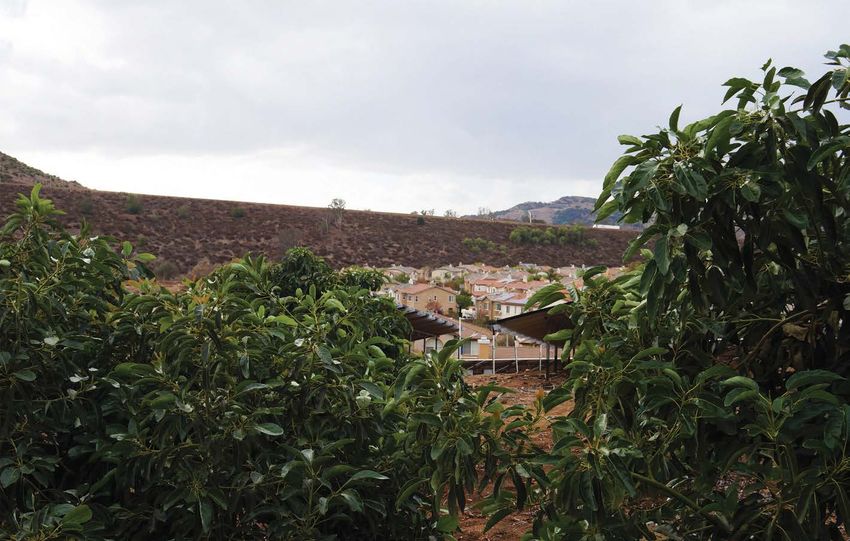
Production system
Highly traditional alongside high-tech
The small size of the orchards is one of the main charac-                 (once a year). Conversely, those growers with large or-
teristics of the Californian production system. The aver-                 chards use modern production techniques (higher densi-
age planted area owned by a grower in 2019 is around                      ty, annual pruning, fertirrigation, etc.). It is reported that
15 acres. We can estimate that only around twenty plan-                   approximately 10 % of planted areas are organically culti-
tations cover more than 500 acres, with the latter repre-                 vated. The technical management of this cropping mode
senting approximately one third of total planted areas. The               is not very complex in the dry Californian climate (except
statistics from the 2017 survey reveal that more than 50 %                for weed control). Conversely, economic returns are often
of orchards cover less than 10 acres, with medium-large                   lower than for the conventional segment.
orchards (more than 20 acres) representing only just over
25 % of planted areas. Planted areas are even more limit-
ed in the south than in the north. Hence the production
fabric is highly heterogeneous, based in large part on
“gentlemen farmer” smallholders, often alien to the world
of agriculture. They are alongside a minority of arboricul-
ture professionals, with larger orchards and often cultivat-
ing the lemon in addition to avocado. The technical level
of the plantations is proportional to their size. Cropping
practices among smallholders are highly traditional. The
average age of the trees is high, though the plant stock
is good quality (big share of clonal plants). The planting
density is rather low (approximately 109 to 130 trees/acre).
Annual pruning is rather scarce, although it has tended to
increase over the past fifteen years. Fertilization practic-
es are variable, ranging from fertirrigation to a very basic
system of manual application, sometimes very infrequent

6                                     World avocado production prospects – CALIFORNIA
Water resource – Irrigation: the number 1 constraint, especially in the south
Irrigation is essential in all the zones, with the limited pre-          mental protection measures also tending to limit their use
cipitation level not covering requirements: 22 inches in the             and increasingly tough competition for use (agricultural or
wettest part located in the north. The agricultural water sup-           domestic, with the population having grown by 10 million
ply system is complex, and involves considerable local spe-              in 30 years), the public authorities are tending to impose
cificities. It is based on two main sources, their respective            control measures. Water has become the main expense in
proportions varying between regions: groundwater pump-                   calculating the variable production cost, with a price of up
ing and the public supply network. The latter is supplied                to 1 500 USD/acre foot in the San Diego region. This bur-
by large-scale infrastructures made in the 1970s, bringing               den is endangering the economic survival of certain plan-
water from the north of the State or neighboring States,                 tations. On top of the lack of availability, water quality is
with the quality varying between sources. Agricultural wa-               often problematic in certain zones. Requirements vary be-
ter availability has always been under strain throughout                 tween zones (from 2 to 5 acre foot/acre). The doses applied
the production zone. However this constraint, increasing-                often do not enable production to reach its full potential.
ly prominent since the 1990s, has become a major factor                  The irrigation technique used in nearly all plantations is
since the drought of 2014-2015. It is particularly severe in             micro-spraying. It is not the most water economic, but is
southern Los Angeles, supplied by hard-hit supply sources.               well-suited to the problem of salinity and to the fairly sandy
In the face of increasingly restricted water sources, environ-           nature of the soils, while requiring limited investment.

Labor: a major problem, with a two-fold negative impact
The cost of labor exerts a lot of pressure on operating expenses.
The minimum hourly wage varies in agriculture between counties
and, as of 01/01/2020, is 12 USD for less than 26 employees and 13
USD for 26 or more employees. However it is generally between
25 and 30 USD including bonuses: a record for the agricultural
world! Labor availability remains problematic. The pay is unat-
tractive compared to the high living costs and wages offered in
other sectors of the economy. Most harvesting is done by farm
labor contractors through which small growers can access the
workforce. There is also the problem of replacing a high propor-
tion of older workers about to retire. Finally, the tougher measures
on receiving immigrant workers are weighing increasingly heavily,
with the vast majority of employees coming from Mexico or oth-
er South American countries. These constraints have a two-fold
negative impact on production costs, by directly increasing ex-
penses and forcing growers to opt for low labor-intensive cultiva-
tion practices, which conversely reduce productivity and increase
the alternate bearing phenomenon (annual pruning reduced or
non-existent, low-density planting, no selective picking).

                                                     World avocado production prospects – CALIFORNIA                                  7
Phytosanitary problems:
low constraints Metalaxyl injection
There are few sanitary problems, especially because of the
dry climate. The main pathology is Phytophthora, with two
strains present: Phytophthora citricola Sawada, which in-
fected approximately 20 % of trees in the late 1990s, and
Phytophthora cinnamomi Rands, by far the most common
and problematic with 60 to 75 % of trees affected at the
same period. It is controlled thanks to a locally developed
technique: using a combination of metalaxyl injections
and resistant rootstocks (clonal rootstocks such as Duke 7,
Toro Canyon and Dusa). There are other diseases present,
but their spread is limited (sunblotch, Verticillium wilt, oak
root wilt). There are also few pests: mainly thrips and the
persea mite (controlled thanks to one annual treatment,
generally applied in early spring). Herbicide is generally
applied three times a year (February, May and August).
Soils Varieties: Hass predominant
The soils vary greatly in their nature. Nonetheless, some Hass is by far the dominant variety, with 95 % of planted
common traits can be distinguished. They generally have areas planted in 2017-2018. Lamb, a later variety, comes
low depth (often less than 20 inch). Sandy-loamy is the in second position with approximately 3 % of plant-
most common texture, though there is often a layer of clay ed areas, declining in recent years. The other varieties
limiting drainage. The organic matter content is generally represented less than 2 % of the avocado planted area.
low (1 to 3 %). Nonetheless, Gem is rising fairly rapidly, representing ap-
proximately 25 % of plant sales in 2019. This variety, de-
veloped by University of California Riverside, is patent free
in California. It is of particular interest to fairly high-tech
growers, who apply a high planting density. It appears to
be slightly more cold-tolerant than Hass, an important as-
set in certain production zones in the State.
Gem variety
8 World avocado production prospects – CALIFORNIAYields: big margins for improvement
Despite the region’s good pedoclimatic attributes, the aver-
age yield of California’s avocado plantations is low, at 6 000
pounds/acre from 2010 to 2019 (ranging from 4 200 to 8.5
pounds/acre). However, there is high variability, given the
great heterogeneity of the production systems. Productivity
fluctuates between 8 800 and 9 680 pounds/acre on or-
chards with a decent technical level. It can be as high as
14 000 to 16 000 pounds/acre for the best managed sys-
tems, a level reflecting the real productivity potential of this
region, blessed with good natural attributes. The alternate
bearing phenomenon is generally highly marked. Control
cropping practices, such as pruning, are not yet widespread.
Furthermore, the harvest period is often late for market-
ing-related reasons (strong competition from Mexico until
June) or physiological reasons in certain cool zones (north-
ernmost production areas, such as San Luis Obispo).
Production costs
Production costs in California have set record levels for the irrigation can vary from 600-1 200 USD/acre to more than
avocado world, and are constantly rising, mainly because of 6 000 USD/acre in the most extreme cases. Labor costs are
the water and labor costs. The cost of irrigation water varies also among the highest in the world, with an official min-
greatly between production zones and supply sources. In imum rate of 12 USD/hour, often rising to 25 to 30 USD/
certain northern zones, where groundwater is available for hour due to worker bonuses and incentives in a context
free, the irrigation cost may be restricted to that of the elec- of strong competition from other sectors of the economy.
tricity required for pumping, which varies between 250 and Conversely, because of a low phytosanitary pressure, the
500 USD/acre foot for average requirements of 2 to 3 acre cost of treatments has little impact. Hence the total pro-
foot/acre. In the southern zones (San Diego County), the duction cost can vary greatly according to the context:
cost of imported water can climb to more than 1 500 USD/ estimates for the northern regions lie between 4 000 and
acre foot for the much higher requirements, sometimes in 5 000 USD/acre, while for the south they are in excess of
excess of more than 4 acre foot/acre. Hence the total cost of 8 100 USD/acre.
World avocado production prospects – CALIFORNIA 9N
North of Los Angeles production area
e
This zone has become the State’s leading production area in recent years, now
accommodating nearly 60 % of planted areas. The cropping system is traditional, and
the plantations remain limited in size, through production costs are lower than in the
south, especially thanks to the presence of free groundwater and to a productivity level
above the State average. Furthermore, local real estate regulations have helped preserve
agricultural land from rampant urbanisation. The shrinkage trend has been interrupted,
with the cultivation area actually gaining a few hundred acres in recent years.
C
D
Location: Ventura, Santa Barbara and San Luis Obispo
ia
bl
The cultivation area, covering nearly 30370 acres (i.e. approximately 57 % of the State’s
o
total planted areas), was not spared by the general planted area shrinkage trend of the
Sa
o
1990s. Nonetheless, in recent years it has tended to stabilize, or even expand slightly.
nt
R a
The California Land Conservation Act, in force in this part of California, is playing its
a
part. Production is concentrated mainly in three counties. Ventura is by far the main
a
Lu
production centre in this zone, and in recent years has become the country’s and
n g
ci
State's biggest too. It has approximately 20 000 planted acres, divided between three
a
main zones: Santa Clara valley (from east Ventura to Fillmore), the Las Posas and Simie
Ra
s
valleys, situated further south just the other side of the Santa Susana mountains (from
ng
Somis to Simi Valley, by way of Moorpark), and a bit further north in Ojai valley.
e
t
Tem
San
an
Ju
California avocado
Cr.
Morro Bay
blo
North Los Angeles
R
Evolution of producing areas
r R
(in acres | source: CAC)
San Luis Obispo
Kern
Arroyo Grande
an
Bakersfield
Pa cean
a
cifi
O
20000
ge
c
Twitchell Res.
18000 Santa Maria
Cu
yam
n
a
16000 S is
S
qu
a
oc
n
14000
a
g
R
Ventura fa
12000
Santa Barbara North el
M e a p iM
ts
h
Tehac
10000 San Luis Obispo ts L. Cachuma
8000 Los Angeles s
Gaviota Sespe C
avocado
r.
6000
Santa Barbara Ojai
4000
2000
production area Carpinteria
Ventura
Santa Paula Fillmore
Somis Moorpark
0
Main production
2009
2010
2011
2012
2013
2014
2015
2016
2017
2018
zones
0 30 km
Other zones
10 World avocado production prospects – CALIFORNIAStrengths:
•• Excellent climate conditions.
Santa Barbara county comes in second position, with ap- •• Lucrative local market, and proximity of consumption areas.
proximately 6 650 acres, with plantations concentrated
in the strip of land situated between the Pacific Ocean •• Free, high-quality ground water.
and Santa Ynez mountains (from Goleta to Carpinteria). •• Later production calendar, less exposed to the competition.
The rest of the cultivation area is located primarily in San
Luis Obispo county (approximately 4 100 acres), main-
ly near the coast between Santa Maria in the south and Challenges:
Morro Bay in the north, by way of Arroyo Grande. Some
recent plantations representing anecdotal areas are sit- •• Production costs high, and rising.
uated further north (250 acres or so around Monterey •• Small plots, often on sloping ground.
and Salinas), and in San Joaquin valley (100 acres or so
in Tulare county). The climate is Mediterranean, with
•• Traditional production techniques.
temperate to cool summers, in the three main counties, •• Extreme climate events more frequent (drought, fires, frost).
with average temperatures of 59 to 61°F. The rainfall lev-
el, of between 15 and 20 inches, is higher in the north
than in the south, unlike the temperatures. The rainy sea-
son is concentrated between October/November and April.
The mountainous barrier situated behind the production centres maintains the
ocean’s influence over the climate, and also provides partial protection against
heatwaves or cold spells coming from the east or north. Conversely, the zone is
exposed to large-scale fires which are hard to control, occurring from May and
above all between September and October.
Production structure: average planted areas
and a generally moderate technical level,
albeit above average for the State
The average plantation size is above average for the State, but is still small (ap-
proximately 20 acres as opposed to 15 acres). It is slightly bigger in San Luis
Obispo county than in Ventura and Santa Barbara (30 acres as opposed to 20 to
20.5 acres). Besides the historical reasons mentioned above, a law limiting land
parcelling in successions has been in force since 1986. The orchards are often
located in sloping zones, generally on the upper part (last zones available for
this “recent” crop, often also less exposed to frost). Anti-frost machines are often
installed in the lowest zones. A significant proportion of growers also produce
lemons. The average technical level of the plantations remains moderate, but is
still above average for the State.
California avocado - North Los Angeles - Production structure
(source: CAC)
35000 Planted areas (acres) 30.0
28.0
Number of producers 30 370
30000 Areas/producers (acres) 25.0
25000 20.4 20.2 20.5
20.0
19 523
20000
15.0
15000
10.0
10000
6 479 5.9
5000 4 005 5.0
958 1 484
321 143 363 62
0 0.0
Ventura Santa Barbara San Luis Obispo Others Total North
World avocado production prospects – CALIFORNIA 11Irrigation: a two-fold comparative
advantage, in an evolving
regulatory framework
The region has big comparative advantages in terms of ir-
rigation over the production situated south of Los Angeles.
On the one hand, water requirements are more limited,
and around 2 to 3 acres feet/acre/year). On the other hand,
while the pressure on the water resource is rising, availa-
bility is higher, the cost lower and quality better overall.
Agricultural water comes primarily from groundwater
pumping, itself supplied by rainfall (more than 80 % of re-
quirements in 2013). Its cost is limited to that of the energy
required for pumping (variable with depth, and around 250
to 500 USD/acre foot). The quality of this water is tending
to deteriorate, due to the intrusion of salt water into parts
close to the sea, but remains decent overall. In 2014 the
public authorities launched a programme aimed at regu-
lating use of this groundwater (Sustainable Groundwater
Management Act). At present, there are only measures
prohibiting digging new wells in so-called “stressed” zones,
but the introduction of quotas is under examination. The
remainder is mainly supplied by those reservoirs present
(Lake Casitas, Lake Cachuma and Lake Piru). In this zone,
agriculture makes little use of water from the public net-
work, highly expensive. It comes primarily from snow melt
from the Sierra Nevada, and is carried from the north by
the California Aqueduct (an infrastructure built under the
State Water Project – a large-scale hydroelectric project).
12 World avocado production prospects – CALIFORNIACalendar earlier in the south
than in the north
Overall, the zone is later than in the south of Los Angeles.
This is a comparative advantage in commercial terms, with
the competition from Mexico stronger during the first part
of the season. There is a maturity gradient going from south
to north, due to a temperature differential. Schematically, in
the cooler San Luis Obispo/Monterey
California avocado – North of Los Angeles – Hass production calendar zone, the harvest extends from April
to January, with a peak from May to
Counties M A M J J A S O N D J November. The calendar runs from
Ventura, Santa Barbara March to November in the Ventura/
Santa Barbara zone, with a peak from
San Luis Obispo, Monterey April to October.
World avocado production prospects – CALIFORNIA 13South of Los Angeles production area
This historic area, formerly number one in terms of production, has declined to become
the State number two, with approximately 40 % of planted areas. Loss of competitiveness
has become a major challenge, since the zone is highly dependent on irrigation water
imported from North California or from other States, prices of which have soared. In
addition, its production system and structure are more traditional than in the north. The
sector has lost a great deal of land to the high urban pressure. Nonetheless, the drastic
shrinkage trend of the 2000s has given way to a gentler decline in planted areas.
Location: a large main zone, straddling
San Diego and Riverside counties
The historic production area situated south of Los Angeles
has seen a big decline, with its planted area practically
halving over the past twenty years. While it is no longer S
dominant, it nonetheless maintains a major role, with
planted areas of around 25 000 acres (i.e. approximately
45 % of the State’s planted areas). The cultivation area is
concentrated in a strip of land 30 to 60 miles wide, be-
tween the Pacific Ocean and the coastal mountain barri-
er formed from south to north by the Laguna Mountains,
Long Beach
Palomar Mountain and the San Bernardino Mountains.
Pa cean
cifi
O
California avocado
c
South Los Angeles
Evolution of production areas
(in acres | source: CAC)
San Clemente Temecula
22500
Fallbrook P
M alom
20000
17500
South Pauma Valley
ou a
nt r
ain
15000
Los Angeles Valley Center
12500
Escondido
production area
San Diego
10000 Riverside
7500
Poway
5000
Lag
2500 Production zones
una
0
San Diego El Cajon Alpine
2009
2010
2011
2012
2013
2014
2015
2016
2017
2018
Mts
0 30 km
14 World avocado production prospects – CALIFORNIAStrengths:
•• Good climate conditions.
The zone ranging from Escondido in the south to •• Lucrative local market, and proximity of consumption areas.
Temecula in the north, straddling San Diego and
Riverside counties, is the largest. The orchards
are located either side of the “avocado high- Challenges:
way” (Highway 15), near the districts of Poway,
Escondido, Valley Center, Pauma Valley, Fallbrook, •• Very high water stress.
Temecula and Murrieta) from south to north. There •• Production cost high, and continuing to rise.
are also significant planted areas east of San Diego
(between El Cajon and Alpine), and in Riverside •• Small plots, often on sloping ground.
county around Moreno Valley. The climate, hot- •• Very traditional production techniques.
ter and drier than in northern Los Angeles, ranges
from Mediterranean, with hot summers, to semi-ar-
id, with an average temperature of 63 to 64°F. Rainfall
lies somewhere between 10 and 14 inches per year, and
is concentrated mainly from November to March (a few
California avocado - South Los Angeles
inches in April and October). The zone is often subject to
hot winds in autumn (Santa Ana winds), though fires are Production structure
less frequent than in the north of Los Angeles. (*Orange and San Bernardino counties | source: CAC)
30000 Areas (acres) 30.0
Sa Production facilities: a larger proportion 25000
Number of producers
24.6 24 311 25.0
n Areas/producers (acres)
B of smaller and lower-tech orchards 20000 20.0
e than in the north 17 662
rn 15000 15.0
a
The plantations are small in size, and below average for 11.4
9.4
11.3
the State (10 acres per grower, as opposed to 15 acres). 10000 10.0
rd
Riverside county’s plantations are slightly smaller than San 5 175
Diego’s (7.5 acres as opposed to 10 acres). Consequently, 5000 5.0
in
1 548 1 474 2 159
the technical level and cropping practices are on average 551 60
o
more basic than in the north. The average slope of the 0 0.0
plantations is greater than in the north. San Diego Riverside Others* Total South
M
ts
Sa
nFel
ipe
World avocado production prospects – CALIFORNIA 15Irrigation: supply sources, and a much greater constraint than in the north The water stress is high, both in terms of volumes available and water quality or cost. It is more of a burden for grow- ers than in the north of the State. On the one hand, due to the lower rainfall and higher temperatures, water require- ments are greater (3.5 to 4.0 acre foot/acre, or even 5 acre foot/acre). On the other hand, the local supply sources are very limited, in terms of both surface water and ground- water. Hence irrigation is based practically entirely on wa- ter imported from the north of the State or neighbouring states, via the main water systems in place (more than 90 % in 2015). Two sources are exploited: water from the Colorado, arriving mainly via the Colorado River Aqueduct, which represents approximately three-quarters of the sup- ply, and water from the north of the State via the California Aqueduct under the State Water Project. Unlike the ground- water supply, use of which is still under-regulated, and ac- cess to which is free, imported water is paid for. Its price has soared as pressure on the resource has risen, in both California and other States using water from the Colorado. Southern California is particularly hard hit, since the region is at the end of the line. The price per acre foot can be as much as 1 500 USD, with the irrigation item representing up to two-thirds of the total production cost. Quality is also posing problems. Saline sediments, present in the Colorado basin, are dissolved in the water, affecting its quality (salini- ty, approximately 650 mg/l in 2014, is twice the salinity un- der the State Water Project). 16 World avocado production prospects – CALIFORNIA
Calendar: a hotter and earlier zone
Since temperatures are higher, the region has
an earlier calendar than the north. The harvest
runs from February to September, with a peak
from March to August.

        California avocado – South of Los Angeles – Production calendar
               J      F     M     A     M      J      J      A       S       O
 Hass

                                                    World avocado production prospects – CALIFORNIA   17
California avocado
Marketing Breakdown by outlet
(estimate | sources: US Customs,
CAC, professionals)
A premium product, on a mainly 2%
Industry
89%
local or regional market Local
10%
The local and regional market takes in 90 % of production, Exports
forming the industry’s natural outlet. Sales are concentrat-
ed in the State of California and the neighboring West Coast
States: Nevada, Arizona, New Mexico, Colorado, Oregon and
Washington. In the rest of the USA, California can be ob-
tained solely from a few select supermarkets. Thanks to the
predominance of category 1 fruit (95 %), the proximity be- costs in the world. Nonetheless, on its core regional and lo-
tween the production zones and consumption centres and cal markets, the Californian avocado can be obtained from
to the CAC’s marketing strategy focused on freshness and all supermarkets, whether mid-range or top-end. Californian
local consumption, California stands out from its competi- fruit occupies the same market segments as fruit from com-
tors due to its top-end positioning, resulting in a price pre- peting origins, with segmentation under-developed in the
mium (sometimes + 0.30 USD/pound on average), which is USA (loose, ripened or ripen-at-home, and net bag, which
essential in order to cover the highest avocado production has seen great growth in recent years). The Californian av-
ocado can also be found in the food service chains, which
procure direct from the packers or via intermediaries.
The proportion of exports is low, fluctuating between 5 and
10 % depending on the scale of production, i.e. approxi-
mately 17.6 to 37.5 million pounds in recent years. Since
2015, an increasing proportion of volumes is aimed at the
highly lucrative Asian markets (South Korea, Japan, Hong
Kong). These destinations represent a useful high add-
ed-value alternative, particularly at the beginning of the
season (in March), when the competing import origins still
have a strong presence on the local market. The export cost
to Asia is 6 000 USD/container out of the port of Los Angeles,
with an estimated voyage of 15 to 20 days.
The processing sector is limited, in view of the small vol-
umes produced. In addition, the fresh market is highly at-
tractive and sorting rejects are low (just 1 to 2 %). The State
has an oil factory.
Avocado - United States - Exports Avocado - United States
(in million pounds | source: US Customs) Exports: volumes and production share
(million pounds | sources: US Customs, CAC)
Asia
35
North America Volumes
Others 60 12%
30 Production share
50 10%
25
20 40 8%
15 30 6%
10 20 4%
5 10 2%
0 0 0%
2008-09
2010-11
2015-16
2017-18
2011-12
2013-14
2014-15
2018-19
2009-10
2012-13
2016-17
2008-09
2010-11
2015-16
2017-18
2011-12
2013-14
2014-15
2018-19
2009-10
2012-13
2016-17
18 World avocado production prospects – CALIFORNIAPacking
Whether for the local or export market, the fruit is
primarily packed in 25-pound lugs, although there
is also a 12.5-pound version. The sizing is shown
in number of fruits per 25-pound lug, generally
28 to 84, with 40 representing the equivalent of a
size 14 in 4-kg boxes. Use of RPCs (Reusable Plastic
Containers) and display cartons (14-17-kg boxes
with bags) is a devel-
oping trend among
certain retailers. Nearly
50 % of volumes is mar-
keted ripe and sold
either in top-end su-
permarkets, or on the
Players
growing food service
sector.
There are sixteen regis-
tered players in the world of
Californian packing. However,
the supply is relatively con-
centrated, with the top three
covering 50 % of the sup-
ply. Then come five intermedi-
ate-sized operators, followed by ten or so modest-sized ones.
For historical reasons, the sector’s traditional big packers are also produc-
tion players in California. However, their volumes are derived primarily from
purchasing from other Californian producers. There is no annual contract be-
tween growers and packers. Fruit is purchased on a weekly basis. Growers
assign their available volumes depending on the price lists published every
week by the packers. Nonetheless, relationships are a big factor, and grow-
ers are often loyal to a particular packer (especially since certain growers are
shareholders in the packing stations). The major Californian players have be-
come major players in the world avocado trade, to harness growth in con-
sumption in the USA while topping up their trade calendar, and to obtain
a return on the often high-tech facilities. They have practically all become
importers, firstly of fruit from Chile in the 1980s, and then from Mexico, Peru
and more recently Colombia. The biggest have invested in production in
these countries, where they are often major players.
World avocado production prospects – CALIFORNIA 19Prospects
Methodology
The Californian avocado industry has major assets, the main able is the planting level. This makes it possible to anticipate,
two being favorable pedoclimatic conditions and a local under certain hypotheses (long-term yield, rate of attain-
market where the Californian origin is rated more highly than ment of prime production) but with a degree of reliability,
its competitors. Nonetheless, it also has to face multiple con- the production until the maturity of the trees (i.e. over a peri-
straints, set out in the first part of this document. Hence, un- od of 7 to 8 years in general). Hence the planting level when
like most big producer countries on the planet, planted and the projection is made represents a solid basis for projecting
producing areas are tending to shrink. Over the last decade, the medium-term evolution of production. Conversely, when
the producing area went from approximately 50 160 acres in the industry is shrinking, the dominant variable is the shrink-
2010 to 45 467 acres in 2018 (- 4 700 acres), according to CAC age rate of the cultivation area. Unlike planting, the effect of
statistics. This particularity increases the uncertainty of the this variable is not gradual, but immediate. Evolution of pro-
projection. When the industry is growing, the dominant vari- ductivity is also a major factor for analysis.
1. Estimating evolution of producing areas
This is a more qualitative than quantitative approach. It is based on analysing the trends from the last few years, and on the
evolution of constraints weighing down on the industry.
Evolution trend of the Californian cultivation area
California avocado
As stated above, the producing area has shrunk over the past decade, Evolution of total producing areas
going from approximately 50 160 acres in 2010 to 45 467 acres in 2018 (in acres | source: CAC)
(- 4 700 acres). However, the downward trend seems to have eased off
60000
since 2017. On the one hand, the decline is less intense in the south, and
on the other hand a minor bounce-back has been seen in the north. This 50000
trend is in accordance with plant sales. The State’s main nursery, which on
its own accounts for nearly 90 % of plant stock production, has registered 40000
record sales in recent years. However, this recovery seems insufficient in 30000
scale to represent a real turnaround in trend. The plant volumes in ques-
tion remain relatively modest, also in part since the production capacity 20000
of the nurseries is currently limiting. According to CAC statistics, in 2018
the State had less than 4 448 acres of young orchards (corresponding to 10000
planting carried out between 2015 and 2018, i.e. over 4 years). Hence 0
professionals surveyed believe that these volumes are only enough to
2010
2011
2012
2013
2014
2015
2016
2017
2018
offset orchard losses, which have also increased (aggravated problems of
profitability, as well as the impact of fires, devastating significant planted
areas in certain zones). California avocado
Evolution of producing areas by zone
(in acres | source: CAC)
30000
25000
20000
15000
10000 North
5000 South
0
2010
2011
2012
2013
2014
2015
2016
2017
2018
20 World avocado production prospects – CALIFORNIAEvolution of constraints
Water availability
Water has been a major constraint in recent years, with the
State going through a severe period of drought, especially Avocado – California – Evolution of producing areas in acres
between 2011 and 2017. However, the situation appears to Hypothesis: zero growth in the north, and 4 % decrease in the south
be very changeable, since the rainfall level in 2019 was very
good. So projections seem to be a fairly complex matter. Years 2018 2019 2020 2021 2022 2023 2024
The models consulted (UCLA in particular) are reckoning on
an increase in temperatures, which could cause higher pre- Total 47 158 46 300 45 500 44 700 43 900 43 200 42 500
cipitation levels but more concentrated in time, with an ac- North 26 597 26 600 26 600 26 600 26 600 26 600 26 600
companying accentuation of dry periods. While evolution
of availability remains rather hazy, evolution of demand is South 20 561 19 700 18 900 18 100 17 300 16 600 15 900
much clearer. All the demographic projections are reckon-
ing on an ongoing growth trend in California’s population,
i.e. in urban water requirements. The temperature increase
trend should also increase requirements, in terms of both Land availability
agricultural and urban water. Furthermore, the increase in Pressure on the coastal zones, where climate conditions
water salinity (aquifers and also water from the Colorado) are favorable for the crop, will continue to increase, with
should also lead to an increase in irrigation dose require- the ongoing population growth trend. The price of ag-
ments. Finally, the regulatory framework should continue ricultural land is already in excess of 80 000 to 100 000
to evolve, with in particular the implementation of stricter USD/acre in these zones. In this context the risk of chang-
controls on water use from aquifers in the north (quotas), es in agricultural land use in favor of real estate remains
under the SGMA. very high in unprotected zones. Furthermore, big finan-
cial groups have made major investments in avocado
Labor availability plantations in recent years, which could eventually be
earmarked for real estate.
The current administration has implemented stricter con-
trol measures on migrant workers, who make up the bulk of Overall, availability of the three main production factors
the agricultural workforce. In this context, there should not should not see any major changes, and will remain re-
be any increase in the labor supply, which will continue to stricted. Furthermore, climate models are reckoning on
be attracted mainly by operators with the biggest planta- an increase in extreme phenomena (violent winds, fires,
tions - since they are able to offer regular work, the accom- etc.). Conversely, plant availability could be a bit less lim-
modation necessary for a temporary work contract, and can iting than at present (up to two years’ wait), with at least
deal with these additional administrative constraints. Also one major grower establishing their own nursery. So
minimum wage will continue to increase until it reaches 15 overall, we have favored a hypothesis of the current trend
USD per hour in 2023. There is a twofold adverse impact for continuing for the north (stability), and of a slowdown in
small growers, who will not have the human resources re- the rate of decrease in the south (4 % shrinkage instead
quired to develop their production system. of the 7 % registered over the period 2013-2018).
World avocado production prospects – CALIFORNIA 212. Evolution of productivity
The current State average yield, of around 5 300 to 6 150
pounds/acre in recent years, does not reflect the very good
pedoclimatic potential of the Californian industry (8 800 to
9 700 pounds/acre, with a medium technical package, and
14 000 to 15 800 pounds/acre if the system is more advanced,
not to mention cutting-edge orchards). So production has
a big growth lever. There is a considerable modernisation
trend in the industry, at least in medium to large orchards.
Nonetheless, productivity exhibited a rather downward
trend in the first part of the 2010s, with a degree of stabili-
Salinity symptom sation arriving in recent years. On the one hand, cyclical fac-
tors played a very unfavorable part (severe drought). On the
other hand, a good many of the many smallholdings, which
to this day represent a large proportion of the production fa-
cilities, are barely modernising (gentleman farmers growing
California avocado - Evolution of productivity it as a cash crop, reinvesting little or nothing in the orchards).
Smoothed over 2 years So we have adopted the following hypotheses:
(* forecast | in pounds/acre | source: CAC)
9000
Nominal yield
8000 We considered two scenarios, relating to the rainfall level
which is evidently a crucial variable. The first reckons on on-
7000 going drought, following the trend of recent years. The sec-
6000 ond considers a return to a less restricted rainfall level, as cur-
5000 rently seems to be the case.
4000
3000
Evolution of productivity
2000 We opted for the hypothesis of productivity picking up in the
coming years, due both to the modernisation trend on me-
1000
dium to large plantations, and to some of the smallest and
0 most fragile plantations closing down, in the face of increas-
2013/14
2014/15
2018/19
2012/13
2016/17
2019/20*
2010/11
2017/18
2011/12
2015/16
ingly tough profitability problems, in particular in the south.
Avocado – California – Nominal and potential productivity in 2024 under two hypotheses
Nominal yield Potential productivity in 2024
Hypothesis 1 Ongoing drought 5 500 pounds/acre (2015-2018 average) 6 100 pounds/acre
Hypothesis 2 Rainfall less limited 6 100 pounds/acre* 7 300 pounds/acre
* Projected yield for 2019-2020 (back to more abundant rainfall), factoring in a positive alternate bearing swing
22 World avocado production prospects – CALIFORNIA3. Summary
According to the hypotheses above, long-term pro- Extension of the crop to zones
duction (2024) could vary between 287 and 344 mil-
lion pounds according to the rainfall, i.e. practically un-
in the State which are cooler
changed from the period 2015-2018, or a rise of around but with a better water supply
60 million pounds. and less expensive land
However, certain factors could have a considerable im- Trials are currently underway in San Joaquin Valley. For
pact, in the medium and long term: now, the results seem to be mixed with the present
plant stock. Gem could maybe provide additional cold
tolerance and a parallel gain in productivity.
Structural change
in irrigation practices Evolution of citrus HLB
Drip irrigation, associated with cropping practices aim-
This serious citrus pathology present in California is cur-
ing for better water use (mulching, etc.), has proven ef-
rently contained. Its spread could lead to conversion of
fective for at least one large-scale grower (good yield
some of the big citrus orchards present in the avocado
level and water saving). The nature of the Californian
zone (in particular in Ventura County). However, the
soil requires several rows of drippers, while the salini-
lemon, which makes up the bulk of citrus plantations
ty requires regular servicing (clogging). This technique
in this zone, is less sensitive to HLB than sweet citruses.
could considerably mitigate the water constraint, which
weighs heavily on both yields and production costs.
California avocado - 2024 production forecast
(source: CIRAD)
344 million
287 million pounds
280 million
pounds pounds
Hypothesis 1: Ongoing Hypothesis 2: Rainfall 2015-2018 average
drought less limited
World avocado production prospects – CALIFORNIA 23You can also read