DISTRIBUTION PATTERNS AND POPULATION SIZE OF THE ASHY STORM PETREL OCEANODROMA HOMOCHROA
←
→
Page content transcription
If your browser does not render page correctly, please read the page content below
193
Ford et al.: Distribution of Ashy Storm Petrel off western California and Mexico 193

               DISTRIBUTION PATTERNS AND POPULATION SIZE OF THE
                 ASHY STORM PETREL OCEANODROMA HOMOCHROA
           R. GLENN FORD1, SCOTT TERRILL2, JANET CASEY1, DEBI SHEARWATER3, STEPHANIE R. SCHNEIDER2,
                   LISA T. BALLANCE4, LINDA TERRILL2, MARGOT TOLLEFSON1 & DAVID G. AINLEY2*

                                1RG Ford Consulting, 2735 NE Weidler Street, Portland, Oregon 97232, USA
               2
                HT Harvey & Associates Ecological Consultants, 983 University Avenue, Los Gatos, California 95032, USA
                                                     *(dainley@penguinscience.com)
                                3
                                  Shearwater Journeys, Inc., PO Box 190, Hollister, California 95024, USA
           4
             National Marine Fisheries Service, Southwest Fisheries Science Center; current address: Marine Mammal Institute,
                                          Oregon State University, Newport, Oregon 97365, USA

                                             Received 02 April 2020, accepted 27 February 2021

                                                                  ABSTRACT

FORD, R.G., TERRILL, S., CASEY, J., SHEARWATER, D., SCHNEIDER, S.R., BALLANCE, L.T., TERRILL, L., TOLLEFSON, M. & AINLEY,
D.G. 2021. Distribution patterns and population size of the Ashy Storm Petrel Oceanodroma homochroa. Marine Ornithology 49: 193–204.

The Ashy Storm Petrel (ASSP) Oceanodroma homochroa population has been surveyed intensively, both at sea within the California Current
and on the adjacent breeding grounds. Nevertheless, colony-based estimates of breeding populations have significantly underestimated the
species’ abundance, especially in the northern portion of its range compared to the southern portion. The species has been described as abundant
in central-northern waters, whereas it is considered rare or uncommon in the southern portion. We analyzed aerial and ship tracks from 1980 to
2017 (~497 000 km covering 91 267 km2), to estimate total ASSP population size and at-sea distribution. Modeling the results of these formal
surveys (7211 ASSPs seen) led to an estimated total population of about 13 445 ASSPs (95% confidence interval = 10 128–27 820), with 62%
of the population frequenting the northern portion of the range, i.e., north of Point Conception (especially Monterey Bay north through the
Gulf of the Farallones to Cordell Bank), compared with 38% in the south (especially waters around the northern Channel Islands). Based on
over a thousand well-organized bird-watching surveys, almost the entire population can occur in a single flock in the northern portion during
the California Current’s autumn Oceanic Period. These flocks occur in trophic hotspots: areas where submarine canyons cut into the shelf.
Such large “molting flocks” have been shifting north from Monterey Bay to Cordell Bank since about 2007, but reasons for the northward
shift remain a mystery. The apparent mismatch in at-sea vs. colony-based population sizes likely involves the non-breeding portion, which is
especially difficult to estimate because it includes immature individuals as well as “floating” individuals: adults capable of breeding but denied
access to breeding sites, which are limited by intraspecific competition.

Key words: at-sea aerial surveys, California Current, hotspots, seabird rafts, at-sea vessel surveys, world population size

INTRODUCTION                                                               were evident, and various threats were mostly localized (USFWS
                                                                           2013). The status of this species is under continuous discussion among
The Ashy Storm Petrel (ASSP) Oceanodroma homochroa is endemic              agencies (e.g., Parker 2016, Nur et al. 2019).
to the central and southern portions of the California Current
System (CCS), where it is found year-round. It breeds on coastal           The ASSP range is divided into five regions, most of which are in
rocks and offshore islands within that portion of the CCS having a         California. From north to south: Region 1 covers Cape Mendocino
Mediterranean climate, that is, from north-central California, USA         to Point Año Nuevo, Region 2 covers Point Año Nuevo to Point
to central Baja California, Mexico (Carter et al. 2008, Howell 2012,       Conception, Region 3 covers the northern Channel Islands, and
Carter et al. 2016a, Ainley et al. 2019). The IUCN has listed ASSP         Region 4 covers the southern Channel Islands. Region 5 is in Mexico
as an endangered species whose population is decreasing, and the           and covers Coronado to the San Martin islands (Fig. 1). The total
California Department of Fish & Wildlife lists it as a Species of          world breeding population of ASSP is concentrated in the center of
Special Concern based on several factors: 1) relatively small global       the species’ range, at the northern Channel Islands and the Farallon
population size, 2) restricted range, 3) purported (but unsubstantiated    Islands (i.e., Point Conception in Region 3 northward to Bodega Bay
long-term) decreasing population trend, 4) vulnerability to at-sea         in the southern portion of Region 1; see Fig. 1 and Table 1). The total
pollution, 5) disturbance at some breeding colonies, and 6) predation      breeding population has been estimated to be ~8200 birds, with a range
by natural and alien predators introduced to breeding locations            of 3000–13 250 birds as of 2015 (Carter et al. 1992, 2008, 2016a;
(Carter et al. 2008, 2016a). A petition to have ASSP listed under          Table 1), though the USFWS puts the total at 7559 birds (USFWS
the US Endangered Species Act was submitted, but the US Fish &             2009). Arriving at these estimates has taken several decades and studies.
Wildlife Service (USFWS) determined that such a designation was not
warranted because the species was widely distributed within its range      Population estimates from colony counts indicate that a near-equal
and because most of the breeding sites were protected. According to        proportion of the population currently breeds in the southern portion of
them, neither a change in range nor any decreasing species-wide trends     their range at the Channel Islands, compared to the northern portions

                                                    Marine Ornithology 49: 193–204 (2021)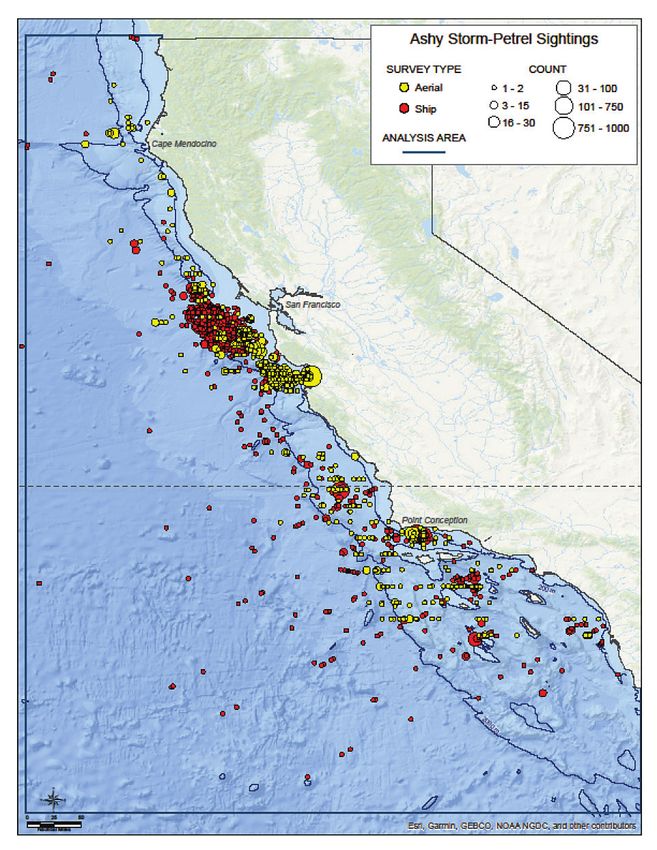
194 Ford et al.: Distribution of Ashy Storm Petrel off western California and Mexico
of their range, at the Farallon Islands. Based on surveys during (Carter et al. 2016a; Table 1). There are no colony-based data to
1979–1980, Sowls et al. (1980) initially estimated 5187 breeding indicate whether the size of ASSP breeding population at the Channel
birds for California, with ~4000 (77%) at the Farallon Islands (Region Island colonies have changed since this most recent estimate. In
1; Ainley & Lewis 1974) and most of the remainder at the Channel contrast, multiple population estimates derived from colony counts
Islands (Region 3; Hunt et al. 1981). After additional surveys, Carter have been published for the Farallon Islands. In 1992, Sydeman et
et al. (1992) estimated 7209 breeding birds for California, adding al. (1998) estimated that the Farallon breeding population had shrunk
to the much earlier estimate of ~4000 breeding birds (55%) for the to ~2600 breeding birds, though the estimate was likely negatively
South Farallon Islands and reasoning that earlier counts at the Channel affected by anomalous ocean conditions during their year of study,
Islands should be elevated. Most recently, colony-based estimates for specifically the El Niño-Southern Oscillation. During this time, higher
the Channel Islands have further increased to 6375 breeding birds numbers of birds were reported at sea (Ainley & Boekelheide 1990,
Ainley & Hyrenbach 2010), in accordance with reduced breeding
-126° -124° -122° -120° -118° -116° -114°
incidence and presence on the island. Therefore, there was likely no
OREGON
such change, as reported by Sydeman et al. (1998). Most recently in
Ashy Storm-Petral
Breeding Distribution 2012, Nur et al. (2013) estimated 5768 “resident” ASSP at the Farallon
42°
42°
No. Pairs Islands, an estimate that included both breeders and established non-
1 - 100 0 50 100 Miles
False Cape Rocks 101 - 1,000
breeders. (Residency was defined as being captured at least twice
Sugarloaf Island
Steamboat Rock Cape Mendocino 1,001 - 5,000 0 50 100 Kilometers within a year or in multiple years.) Nur et al. further noted that the
40°
40°
Kibesillah Rock
Caspar - Point Cabrillo Rock Fort population had increased between 2000 and 2005–2006, followed by
Stillwell Point Rock Bragg
Casket - Wharf -
Franklin Smith Rock
a decrease to about one third of the peak by 2012. Consistent with that
Bird Rock
Point Reyes Headlands
Bodega Bay C increase was an increase in number of ASSP observed at sea (Ainley
A
& Hyrenbach 2010).
38°
38°
Chimney Rock
L
South Farallon Islands IF
Stormy Stack San Francisco O
REGION Steep Ravine R
Alcatraz Island
N
1 San Pedro Rock Monterey IA A different picture of ASSP abundance has been derived from
Año Nuevo Island Pt Pinos
scientific at-sea surveys, which reveal that ASSP are relatively sparse
36°
36°
Castle - Hurricane -
Bench Mark 227x
2
Pt Piedras Blancas
south of Point Conception, including in the vicinity of the Channel
Vandenberg AFB Ventura Islands. Summarizing available information, Howell (2012: pp. 417–
San Miguel Island Los
3 418) deemed the species to be “fairly common to locally abundant
34°
34°
Santa Rosa Island Angeles
Santa Cruz Island
CHANNEL Anacapa Island
San
year-round over continental slope and adjacent offshore waters…
ISLANDS Santa Barbara Island
4 Santa Catalina Island Diego in central California,” but “uncommon to rare off southernmost
San Clemente Island
California and Baja California.” Briggs et al. (1987), who repeatedly
32°
32°
Coronado Islands
C
5
A
Todos Santos Islands
surveyed the coastal waters off California by air during 1976–1983,
B FO
L
I
A
PA C I F I C O C E A N encountered at most 1400 ASSP individuals in waters south of
J AR N
San Martin Island
Morro Bay/Point Conception (i.e., 175 birds encountered per year).
30°
30°
IA
Similarly, during repeated and intensive ship-based surveys of waters
-126° -124° -122° -120° -118° -116° -114°
south of Pt. Conception, as part of the California Cooperative Oceanic
Fig. 1. Known breeding locations (black dots) of the Ashy Storm Fisheries Investigations (Cal-COFI) program during 1987–2006, only
Petrel Oceanodroma homochroa in California, USA and Baja 1026 ASSP individuals were encountered (i.e., 51 birds per year). An
California, Mexico (updated from Carter et al. 1992, 2008; map aerial survey south of Point Conception (1999–2001; Mason et al.
altered from Carter et al. 2016a). The five regions are described in 2007) also found few ASSPs (density range: 0.02–0.20 birds/km2,
Table 1; Region 1 begins with northernmost colony and Region 5 depending on season). Therefore, the scientific at-sea counts of ASSP
ends with southernmost colony. Note, the current paper questions do not appear to match the colony data reported for south of Point
the validity of population sizes among the northern Channel Islands. Conception (Regions 3–5 in Fig. 1). Moreover, during 1987–1998,
TABLE 1
Frequency of known Ashy Storm Petrel Oceanodroma homochroa breeding sitesa by size and estimates
of the number of breeding birds by regionb, as of 2015 (updated from Carter et al. 1992, 2008, 2016a)
Colony size range Number breeding birds
1–25 26–100 101–500 501–1000 1001–5000+ Total sites Minimum Middle Maximum
Region 1 5 8 1 14 1 214 3 570 5 925
Region 2 5 5 5 65 125
Region 3 5 6 7 1 19 1 369 3 297 5 225
Region 4 6 2 8 208 679 1 150
Region 5 1 3 1 5 180 503 825
Total 22 17 10 1 1 51 2 976 8 114 13 125
a
“Breeding site” is defined as a distinct geographic location. Some of these could be clumped enough to constitute a “colony,” but given
evidence of Ashy Storm Petrel intercolony movement (Ainley et al. 2019), we used the term “breeding site” instead.
b
Region 1 – Cape Mendocino to Point Año Nuevo; Region 2 – Point Año Nuevo to Point Conception; Region 3 – northern Channel
Islands; Region 4 – southern Channel Islands; Region 5 – Coronado to San Martin islands (see Fig. 1).
Marine Ornithology 49: 193–204 (2021)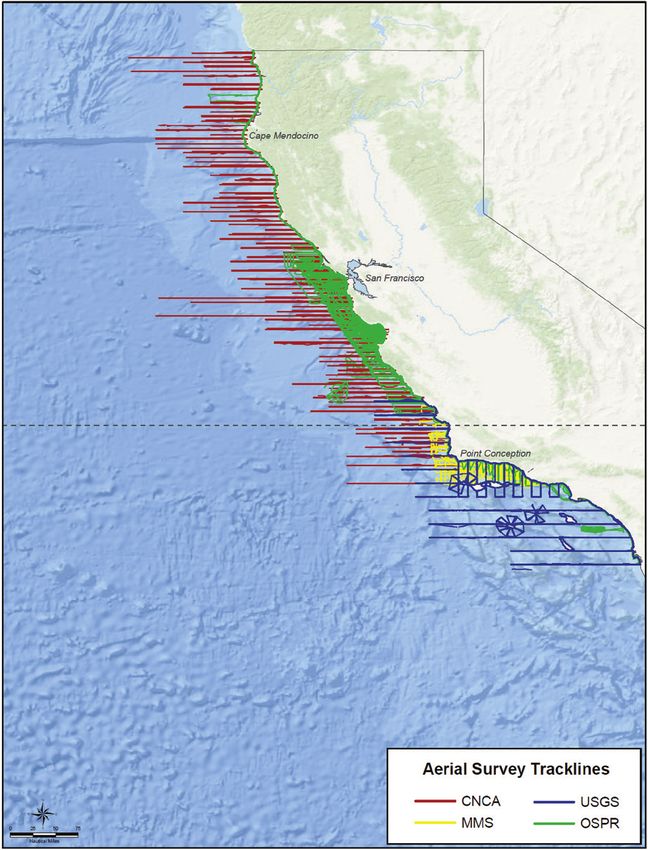
Ford et al.: Distribution of Ashy Storm Petrel off western California and Mexico                             195

no trend in observed ASSP numbers was detected during Cal-COFI          are non-breeders, which totals 7300 breeding birds (Spear & Ainley
cruises. In contrast, the three other storm petrel species regularly    2007). Also, areas where ASSP concentrate at sea (i.e., hotspots;
frequenting those waters—Leach’s Oceanodroma leucorhoa, Black           sensu Santora et al. 2017, 2018) have been fairly well-established for
O. melania, and Least O. microsoma—did exhibit changing decadal         central California, where rafting flocks of up to 13 000 individuals
trends relative to marine climate (Hyrenbach & Veit 2003).              have been regularly observed in slope waters from Monterey Bay to
                                                                        the northern Gulf of the Farallones and especially over submarine
Extensive at-sea counts for northern and central California, on the     canyons (densities reaching > 100 birds/km2; NOAA 2003 and
other hand, are in accord with Howell’s (2012) description and better   Results section below). Those flocks are generally encountered in
match both colony counts and at-sea scientific counts in that region;   the autumn, contain many molting individuals, and may include
i.e. there are more ASSP in the north compared to the south. Aerial     birds from the entire range (see Adams & Takekawa 2008). An
surveys by Briggs et al. (1987) estimated 5600 to 11 200 individuals    insignificant decreasing trend in at-sea results from spring surveys
encountered off northern/central California, depending on the           in central California (1985–2006) was noted by Ainley & Hyrenbach
season (i.e. 700–1400 birds encountered per year). These numbers        (2010), while a slightly increasing trend was evident at the Farallones
are corroborated by ship-board surveys during 1986–2006 (4339           (Warzybok et al. 2015).
individuals were encountered between 1980 and 2001 in a smaller
portion of the region, i.e. 207 birds per year; NOAA 2003). These       Given the varying levels of agreement between at-sea counts and
counts are consistent with at-sea surveys during 1980–1995, as well     colony counts, a summary and analysis of the existing at-sea data
as with extrapolations about the proportion of observed birds that      was needed. While existing colony-based data have been recently
                                                                        summarized (Table 1, Fig. 1), this is not the case for at-sea data.
                                                                        Overall, data from at-sea surveys might provide the best insights
                               TABLE 2                                  into the population size of this burrow-nesting, nocturnal (at
       A summary of aerial and ship-based surveys providing             colonies) species; Rayner et al. (2020) also reached this conclusion
      data for this study; all are strip censuses. Data are from        for the New Zealand Storm Petrel Fregetta maoriana. These
    all oceanographic seasons, though some months are missing           natural history characteristics complicate colony-based abundance
    from some data sets. Most surveys contributed to estimates          estimates. Clarke et al. (2003) successfully ground-truthed an
          for areas both north and south of 35.1°N (Fig. 2)             analysis of population estimates of at-sea data using Generalized
          and include data for the entire year range given.             Additive Models (GAMs) for three surface-nesting seabird species,
     Years     No. of                                          No.      two from the Farallon Islands and one from the Galápagos. Another
                               Agencya            Ship/Air              at-sea population estimate was verified by radar studies of burrow-
    covered    years                                          ASSP
                                                                        nesting seabirds in Hawaii (cf. Spear et al. 1995, Day et al. 2003,
1980–1983         4         CNCA (MMS)               Air      1606
                                                                        Joyce 2016). The key is to have intensive surveys covering an
1995–1997         3              MMS                 Air          9     appreciable portion of the foraging range or at-sea range of the
1999–2002         4              USGS                Air       254      species in question over an appreciable time period, to avoid
                                                                        the problems encountered by MacLean et al. (2013): very small
1994–2016        22              OSPR                Air       785      spatial scale and just a few years of data. No other seabird in the
1985–2015        29             Various              Ship      941      world has had its marine distribution as extensively surveyed as
                                                                        that of the ASSP from 1976 to 2017. Herein we summarize and
1987–2016        30            Cal-COFI              Ship     1363
                                                                        analyze existing at-sea data, from both formal surveys (aboard
1993–1995         8         EPOCS (NSF)              Ship        71     oceanographic research ships and aircraft) and from birding boat
1993–2014         6     ORCAWALEb (NMFS)             Ship      475      trips, to estimate the world population of ASSP and to detect
                                                                        hotspots where the species concentrates.
1996–2001         7            SF-DODS               Ship     1707
a
    Cal-COFI = California Cooperative Oceanic Fisheries                 METHODS
    Investigations (funded/supported by the California and
    National Science Foundation); CNCA = Central and Northern           Large-scale surveys—formal aerial/ship-based transects
    California Aerial survey; EPOCS = Equatorial Pacific Ocean
    Climate Studies, cruises that departed/returned to US ports         Data sources
    (funded by the National Science Foundation); MMS = Minerals
    Management Service; NMFS = National Marine Fisheries                Our estimates of the ASSP world population are based on a
    Service; NSF = National Science Foundation; OSPR = Office of        compilation of nearly all systematic aerial and ship-based surveys
    Spill Prevention and Response (California Department of Fish        of seabirds that have been conducted offshore of California during
    and Wildlife); SF-DODS = San Francisco Deep Ocean Disposal          the 1980–2017 period (Table 2). The CCS has three general
    Site (US Army Corps of Engineers); USGS = US Geological             oceanographic seasons or “periods”: Upwelling, Relaxation (or
    Survey; Various = Point Reyes Bird Observatory and HT               Oceanic), and Winter Storm (or Davidson Current; Bolin & Abbott
    Harvey & Associates on NMFS Rockfish Assessment cruises.            1963). Most surveys were done during summer (late Upwelling
b
    ORCAWALE (NMFS, i.e., Oregon, California and Washington             Period), which are also chick-rearing periods when both parents
    Line Transect Expedition = 1996, 2001, 2008) is a combination       are at sea. We did not parse data by year to look at trends, because
    of several sequential projects: PONDS (Populations of Northern      this would have reduced sample sizes to levels that would have
    Delphinus Stocks = 1993), CSCAPE (Collaborative Survey              added much more uncertainty to our statistical analyses and because
    of Cetacean Abundance and the Pelagic Ecosystem = 2005),            colony-based estimates are independent of year, differing among
    and CalCurCEAS (California Current Cetacean & Ecosystem             colonies by as much as a decade. These efforts used continuous-
    Assessment Surveys = 2014).                                         strip surveys conducted with a strip width of 50–150 m for aerial

                                                  Marine Ornithology 49: 193–204 (2021)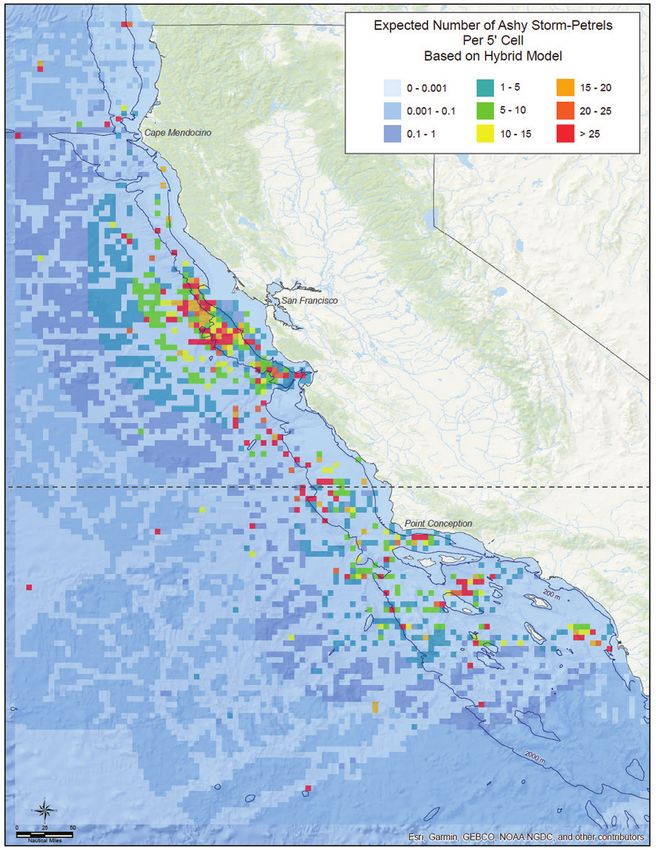
196                           Ford et al.: Distribution of Ashy Storm Petrel off western California and Mexico

surveys and 200–300 m for ship-based surveys (e.g., Clarke et al.            Creation of data snippets and association with predictor variables
2003). Most cases involved at least two observers (see Spear et al.
2004; Fig. 2). The initial strip width for aerial surveys was 50 m           The snippet database was intended to simplify the survey data, which
until 1998, when it was increased to 150 m to accommodate a                  were collected using a variety of survey protocols, by using a standard
change in aircraft for Oil Spill Prevention and Response (OSPR)              format based on a standard sampling unit. This was possible because,
surveys. At that time, it became standard to use two observers               in spite of varying protocols, all studies were based on continuous-
instead of one, whenever glare conditions allowed. Within some               strip transects. For the ship surveys, data were binned a priori into
ship-based surveys, strip width varied because of reduced visibility.        transects based on time (e.g., 30-min segments; except for Joyce
                                                                             2016). Latitude, longitude, and environmental variables were recorded
We counted all ASSP that occurred within strips, both flying and             at the start of each transect/segment. For analysis, we divided the
on the water. Given that storm petrels travel so slowly compared             survey track lines into smaller units (i.e., snippets), such that the area
to speed of the survey ship/aircraft, they were effectively perceived        searched for each snippet was at least 0.95 km2. Smaller areas would
as stationary. We therefore considered aerial and ship-based                 inject more samples with zero sightings, which is already a statistical
detections to be equivalent and did not require adjustment to factor         issue for this species. By standardizing by minimum area surveyed, we
in the relative speed and direction of either the survey platform            accounted for varying strip widths (due to changes in the number of
or the storm petrels (see Clarke et al. 2003). Such a strategy was           observers or in observation conditions) that sometimes occurred along
confirmed by our results.                                                    the survey track. Since the exposure variable is the area searched,
                                                                             creating transects of equal area ensured that variance in the number
Data standardization                                                         of observations was equal across all snippets and did not vary among
                                                                             studies.
All survey data were standardized to a common format and organized
by survey, date, and time. Each sample represented either a position         When a run of continuous sampling ended, the length of the last
fix (latitude and longitude) or an observation of one or more birds.         snippet created from that run was often less than the maximum
                                                                             allowable size of 1.0 km2. For example, a run might be 107 km long
We assumed that continuous sampling occurred along a given line              with a strip width of 0.1 km. Small snippets, as noted, often result
unless the “IFGAP” field was true, which indicated a break in                in zero sightings. Therefore, snippets that were > 0.95 km2 in area
continuous sampling. Breaks in sampling occurred for various reasons,        were retained for analysis and smaller ones were discarded. Our final
such as the observers going offline, the survey aircraft returning to        database consisted of a set of snippets in which each one represented
base, or the survey ship moving to a new location overnight.                 0.95–1.00 km2 of searcher effort. Once a snippet was specified, we

                                                                        35.1 N

                                                                                                                           Ship Survey Tracklines
                                             Aerial Survey Tracklines
                                                                                                                               CALCOFI       JVRK
                                                  CNCA           USGS                                                          DODS          NOAA
                                                  MMS            OSPR                                                          EPOC

Fig. 2. Tracklines for aerial and ship-based surveys conducted off the coast of California, USA, 1980–2017. For definition of acronyms, see
footnote to Table 2. JVRK = the Rockfish Assessment cruises of the National Marine Fisheries Service

                                                   Marine Ornithology 49: 193–204 (2021)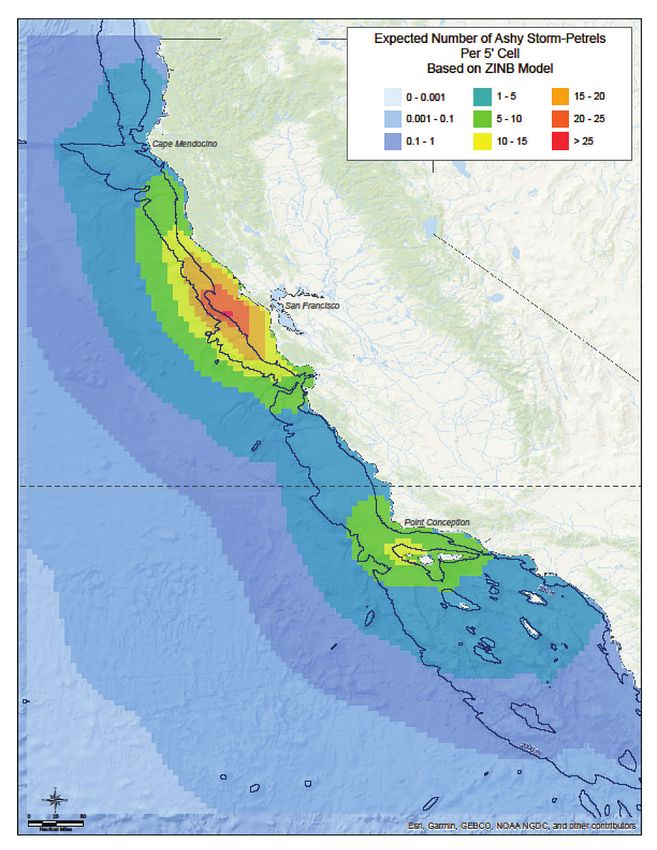
Ford et al.: Distribution of Ashy Storm Petrel off western California and Mexico                                      197

calculated its midpoint, to which potential predictor variables were            stopped near a large flock or petrel “raft” for a long period. The chum
assigned. These variables included the factors listed in the Appendix.          then attracts storm petrels to the boat, enabling better identification of
                                                                                the several storm petrel species that might be in the flock.
A total of 97 867 snippets was created, 85 375 of which were
> 0.95 km2 (Table 3). Total survey length was similar for air and               Each trip usually had 2–5 leaders with many years of experience
ship surveys (255 868 km and 240 607 km, respectively; Fig. 2),                 in observing and identifying seabirds, guiding 20–40 participants.
but ship-based surveys sampled more water area because of their                 Before each trip, leaders typically conferred with the captain to plan
greater strip width.                                                            the potential route for the day, considering sea conditions, recent
                                                                                observations, patterns of sea-surface temperature (SST), and other
Small-scale surveys—birding boat trips                                          factors. Otherwise, approximately the same routes were covered daily
                                                                                (Fig. 3), as finding storm petrel flocks became one of the usual goals.
Somewhat constrained by available ports, birders have searched widely           Once a storm petrel flock or a multi-species seabird foraging flock
to find storm petrel flocks, even sometimes organizing overnight trips          was spotted, the vessels moved closer to count birds and identify
to expand the area searched, especially in the southern portion of              species. The leaders’ primary responsibilities included spotting
the ASSP range. To quantify the very localized presence of autumn
molting flocks and the change in hotspot location during the last few
decades (see Results), we also report results from these birding boat
trips (ecotourism) that were organized at frequent intervals, especially
during July to November 1985–2015 (late Upwelling through Oceanic
periods; Bolin & Abbott 1963), covering Monterey Bay (Monterey,
Soquel, and Ascension canyons; n = 837 trips), waters off Halfmoon
Bay (Pioneer Canyon; n = 61 trips, 2010–2015 only), and waters off
Bodega Bay (Cordell Bank, Bodega Canyon; n = 152 trips; Fig. 3).
We assessed the utility of similar trips conducted off Southern
California into the waters around the Channel Islands but found
them to be too infrequent (a few dozen over 20 years) for meaningful
summary. Around Monterey Bay and Cordell Bank (i.e. the Monterey
Bay and Gulf of the Farallones/Cordell Bank marine sanctuaries),
surveys were done throughout the year, though most survey effort was
concentrated in the Oceanic Period (Aug–Oct). During that season,
winds are lightest, seas are calmest, and the diversity of seabirds in
California waters is by far the highest, thus increasing the interest of
participants (Ainley 1976, Stallcup 1976). These trips took place on
~30 m fishing vessels (i.e., “party boats”) that were outfitted to allow
two dozen or more passengers and typically lasted 8–12 h. Most trips
sailed out of Monterey and lasted ~8 h (i.e., 07h30 to 15h30); those
from Bodega and Halfmoon bays lasted 8–10 h and typically departed              Fig. 3. Typical routes in the three areas for which pelagic birding
at 07h30. A small amount of chum (mostly fish-oil) was dribbled from            surveys were analyzed in this paper. From north to south: Bodega
the stern once well away from shore. The oil tended to attract larger           Bay to waters overlying Bodega Canyon and Cordell Bank;
petrels/albatross and gulls to the vessel. Storm petrels fly too slowly         Halfmoon Bay to waters overlying Pioneer Canyon; and Monterey
to be affected (i.e., they cannot keep up), other than when the vessel is       to waters overlying Monterey, Soquel, and Ascension canyons.

                                                               TABLE 3
                                 Number of snippets and area surveyed (km2) by platform and study code
                                                                                  All snippets                      Snippets used in analysisb
Years covered              Agencya               Ship/Air
                                                                      Snippets                   Area               Snippets                Area
1980–1983               CNCA (MMS)                  Air                 6 604                    5 920.9              5 197                5 194.5
1994–2016                    OSPR                   Air                 9 113                    8 561.4              8 303                8 302.8
1995–1997                    MMS                    Air                 1 003                     955.5                908                  907.8
1999–2002                   USGS                    Air                 5 053                    4 512.3              3 939                3 937.7
1985–2015                   Various                Ship                13 798                 12 783.7              11 821               11 818.4
1987–2016                  Cal-COFI                Ship                52 161                 49 466.2              47 030               47 023.6
1993–1995               EPOCS (NSF)                Ship                     513                   460.9                434                  434.0
1993–2014                   NOAA                   Ship                 5 202                    4 570.7              4 027                4 025.3
1996–2001                 SF-DODS                  Ship                 4 420                    4 034.9              3 716                3 715.4
a
    See footnote to Table 2. NOAA = National Oceanic and Atmospheric Administration
b
    Only snippets representing > 0.95 km2 were used in the subsequent analysis.

                                                     Marine Ornithology 49: 193–204 (2021)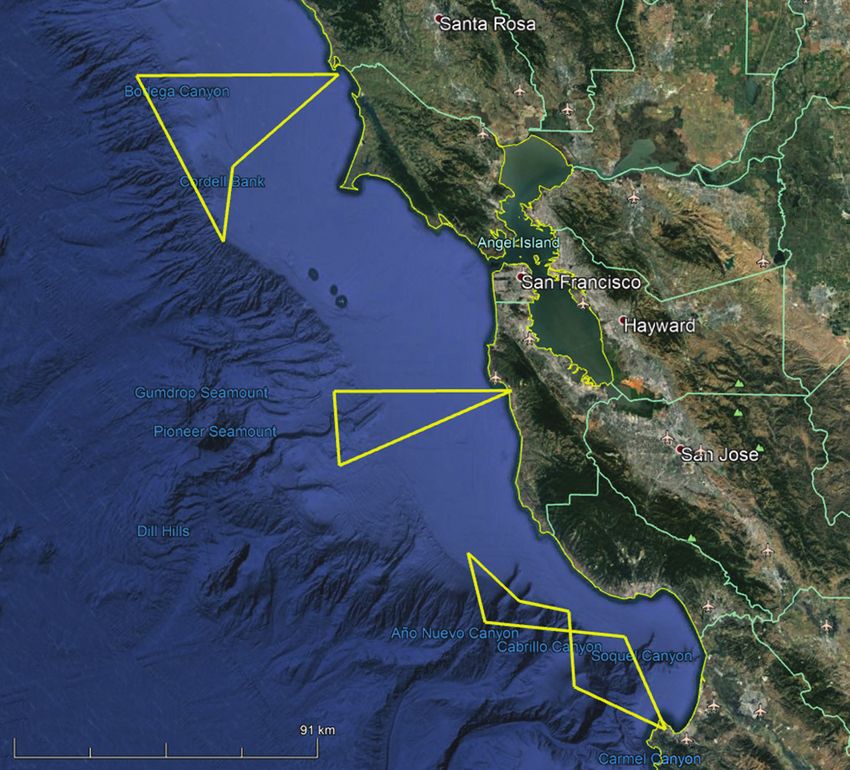
198                            Ford et al.: Distribution of Ashy Storm Petrel off western California and Mexico

and identifying birds, showing them to participants, and recording          or SST can change rapidly. The probable net effect of including
counts of the seabirds, marine mammals, and other megafauna                 these longer transects is a weakening of the relationship between the
(sharks, turtles, etc.) encountered. Leaders were also responsible          number of birds observed and the predictor variables. However, as
for documenting rare or unusual species and for recording relevant          noted above, by removing small extensions of snippets, there were
abiotic information associated with the observations. Leaders kept          still highly significant relationships between five of the covariates
track of how many ASSP were seen throughout a trip; in recent               and the number of ASSP observed.
years this has been done through implementation of the eBird
“pelagic protocol”, e.g., https://ebird.org/caribbean/news/pelagic-         To maximize the spatial and temporal coverage of these data, we
birding-with-ebird-caribbean. Trip leaders were usually situated at         combined all seasons and years to estimate the total number of
different positions on the boat, thus gazing at different sections of the   birds present in the study area, on average, during the years and
ocean. Each eBird checklist started fresh hourly, so some birds may         months for which there were data. Within each cell, ASSP density
have been counted on more than one checklist, thus necessitating            (i.e., birds per km2) was estimated by dividing the total number of
adjustments to daily totals. Leaders compared notes on the numbers          birds observed in that cell by the total area sampled within that cell.
of each species observed from the different areas that each viewed          The predicted number of birds within the cell was calculated as the
throughout the day, and they conferred again at the end of the trip to      surface area (ocean portion, if it included land) of the cell (in km2)
reach final consensus on its total numbers. There were no duplicate         times the density. The total population of ASSP in the study area
counts in the data that we analyzed in this paper.                          was thus equal to at least the sum of the number of estimated birds
                                                                            within all cells that were sampled.
Data analysis
                                                                            This estimator did not account for the population within unsampled
Large-scale surveys—aerial and ship-based                                   cells. About 51% of the cells in the study area were not sampled or
                                                                            were lightly sampled, although the majority of these were adjacent
The equivalency of ship and air surveys is supported by our GAMs,           to cells in which the estimated density of ASSPs was very low
which found that platform type was not a useful predictor for the           or where they were never observed at all. A population estimate
number of birds observed. Our goal was to develop a GAM that could          based on the empirical method is a minimum, since it does not
predict ASSP abundance based on systematic ship and aerial surveys.         include population estimates of unsampled cells. The treatment of
We examined three different ways of modeling ASSP abundance,                unsampled cells is described in the Hybrid model section below.
following the lead of Clarke et al. (2003), who developed the method
of using GAMs to estimate population abundance of seabird species           Zero-inflated negative binomial model
using at-sea surveys (see statistical models reviewed below, and
Appendix). Clarke et al. then ground-truthed the models based on            We used a GAM as implemented in R version 3.4.1 using the
thorough colony-based counts for three species of surface-nesting           “mgcv” package 1.8–28 to estimate the number of bird observations
seabirds: Waved Albatross Phoebastria irrorata, Western Gull Larus          expected in searching 1 km2 of ocean. Covariates used to estimate
occidentalis, Common Murre Uria aalge. The data for two of the              this number are listed in the Appendix.
species came from surveys included in the present analysis.
                                                                            While we initially intended to use the correlations (r) between the
Empirical method                                                            number of birds observed and the various predictor variables as a
                                                                            criterion for model selection, all the correlations were small (< 0.02
We binned observation and effort data from all large-scale                  in absolute value). However, since the data set was very large, many
surveys into geographical cells measuring 5′ × 5′ (minutes of               of the coefficients on the predictors were still significantly different
latitude × minutes of longitude). The size of these cells was               from zero, even for very small values of alpha (P < 0.001).
influenced by survey protocols from the late 1970s and early
1980s, which were based on navigation by dead reckoning and were            Since none of the explanatory variables was strongly correlated
resolved to a positional accuracy of only 5′. In general, 5′ appears        with the number of birds observed, we looked for a GAM
to be a good compromise between using larger blocks (thereby                in which the distribution of the expected number of birds
increasing the number of snippets that fall within a given cell but at      observed best matched the distribution of the actual data. The
the cost of decreasing spatial resolution) versus smaller cells (which      distributions evaluated included the Poisson, the zero-inflated
results in fewer snippets per cell but improves spatial resolution).        Poisson, the quasi Poisson, Poisson-inverse Gaussian, the zero-
Multiple studies of bird populations in the California Current have         inflated Poisson-inverse Gaussian, the negative binomial, the
also utilized cells of this size for analysis (e.g., Briggs et al. 1987,    zero-inflated negative binomial, and the generalized inverse
NOAA 2003, Mason et al. 2007).                                              Gaussian (Sichel). We selected the zero-inflated negative binomial
                                                                            model (ZINB) used for similar purposes by Joyce (2016), Welsh et
In cases where the strip width was relatively small, such as aerial         al. (2000), and McGowan et al. (2014), among others. The ZINB
surveys during the early 1980s (width = 50 m), some snippets                model assumes that the number of birds observed is a result of
could be > 10 km in length and longer than the north-south range            two processes: (1) a logistic (0 or 1) function determining whether
of a 5′ cell, which is about 9.3 km. Depending on their degree              or not ASSP are present at all in a particular snippet, and (2) a
of convolution, these transects sometimes extended outside the              function estimating how many ASSP are present, in the event that
relevant 5′ × 5′ block. Snippets that were ≥ 10 km long contributed         they are. ASSP distributions are sometimes highly clumped, and
9.0% of all transects. In such cases, the correspondence between            the small-scale surveys (e.g., birding boat trips) indicate that a
the 5′ grid and the values of the predictor variables was probably          large proportion of the population could be present in a single very
reduced, especially when the survey tracklines ran perpendicular to         large flock. In any case, the size of some flocks was equivalent
the coastline and shelf break; in these areas, variables such as depth      to the total population, according to our models. Based on visual

                                                     Marine Ornithology 49: 193–204 (2021)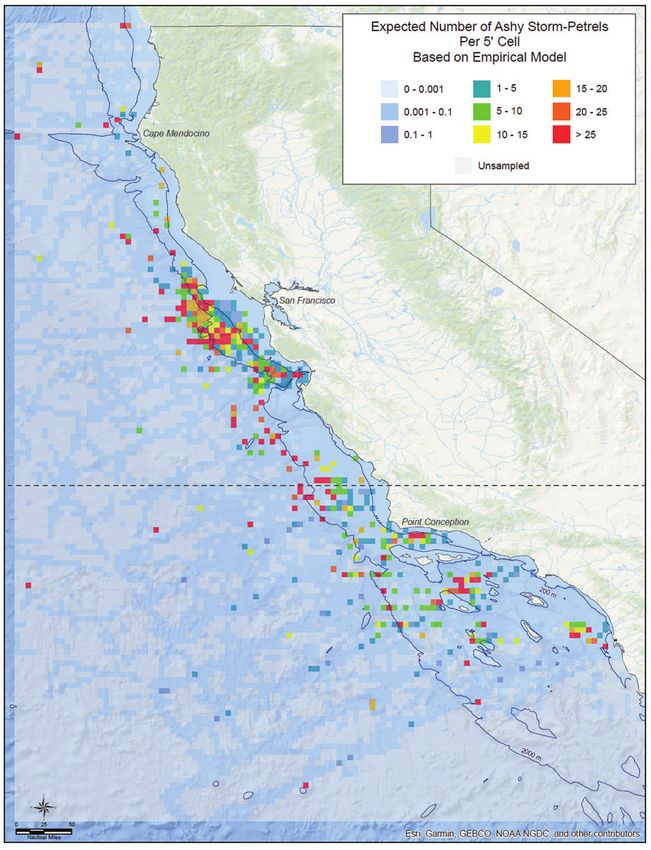
Ford et al.: Distribution of Ashy Storm Petrel off western California and Mexico                           199

inspection, none of the models fit the observed distribution well           Small-scale surveys—birding boat trips
for very large flock sizes. The best fit was the ZINB model, which
may have tended to overestimate small counts and underestimate              Data were summarized by dividing months in half for each year.
large counts. Almost all the apparently high-density areas were             Throughout the 1985–2015 study period, the number of ASSP
sampled and therefore are not affected by the structure of the              seen was added among surveys available for a given half-month,
ZINB model. GAM estimates of density were used in relatively                and that total was then divided by the number of surveys in that
empty portions of the ASSP range, especially seaward of the                 half-month over the entire temporal span of the data set. We did
shelf, where densities are typically very low. Estimates by tallying        this instead of taking an average (or the high count), because it
cell by cell population size indicated that 92.7% of all cells each         was unknown whether the large flock known to exist in a given
contained 1.0 bird or less. Overall, about 1527 (out of 13 445              area was encountered on a particular trip. For instance, one trip
birds) were added to the population estimate calculated using the           might report a flock of a few thousand ASSP but a few days later,
empirical method, based on the ZINB estimates for unsampled                 no birds or only a few would be encountered in the same location,
cells. Thus, if the model did overestimate the population in those          then large numbers would be seen there on the next trip not long
cells, the actual population would be smaller than our estimate,            after. Therefore, it was very likely that the molting/rafting flock
but that underestimate would be less than 1527 birds (see Results           was present in the area during that intervening survey but was
and Discussion for additional information).                                 not encountered. These numbers were then plotted by half-month
                                                                            periods by year, and regional population trends conditional upon
We tested all the candidate explanatory variables (see Appendix for         year and the 95% confidence interval (CI) about these trends were
a complete list of variables) using a backwards selection procedure         visualized using locally weighted smoothing (LOESS) in package
(Hastie et al. 2009). The decision to include or exclude explanatory        “ggplot2” (Wickham 2016) in R version 3.6.1 (R Core Team 2019).
variables in the final model was based on both significance levels          In another analysis, we compared the high counts by half-month
and Akaike information criterion values; either method resulted             among the three birding boat trip survey areas shown in Fig. 3:
in equivalent sets of variables. For the final model, we used only          Monterey Canyon, Pioneer Canyon, and Bodega Canyon.
highly significant (P < 0.001) explanatory variables. These included
distance to land, distance to 2000 m depth contour (lower slope),           RESULTS
distance to colony, latitude for both portions of the model, distance
to 200 m contour (shelf break), and average SST for the logistic            Population size
portion.
                                                                            GAM results were used to estimate the total number of ASSP
Hybrid model                                                                within the study area and within the northern and southern parts
                                                                            of the study area separately. In our models, there was no influence
The empirical method resulted in a minimum estimate because it did          of platform type, i.e. aircraft vs. ship, which supports our decision
not include birds that were present in unsampled cells. We estimated        to not correct for flux (as in Clarke et al. 2003). Thus, ASSP fly
the populations in unsampled cells by prediction, using the ZINB            slow enough that they are essentially stationary, contributing to
model described above. To accomplish this, we laid a 5′ × 5′ grid           the total just as much as those resting on the water. The northern
over the study area and counted the number of birds observed from           sub-region (north of 35.1°N) consisted of 3212 cells and the
the midpoint of each of the unsampled cells using the values of the         southern sub-region consisted of 6321 cells (see Fig. 4 for the
predictor variables for that point in space. We then used the ZINB          distribution depicted by each model). The hybrid model estimated
model to estimate how many ASSP we would expect to count at                 a total ASSP population of 13 445 birds, the largest estimate of
that location based on the values of the explanatory variables, then        the three alternative methodologies (Table 4). Estimates for both
multiplied the resultant value by the area of the cell. This yielded        the empirical method and the ZINB model are similar, at 11 633
an estimate of the expected number of ASSP in the cell. The sum             and 11 918 birds, respectively. Likewise, the proportion of the
of the population estimates (empirical method) over all sampled             population in the northern versus southern ranges is consistent, with
cells plus the sum of the population estimates (ZINB model) for             the northern range accounting for roughly two thirds of the total
all unsampled cells is therefore our best population estimate within        population in all three cases. Although the 95% confidence limits
the study area. We placed 95% confidence limits on these estimates          are relatively large for the ZINB and the hybrid models, estimates
using a bootstrap procedure iterated 1000 times.                            based on the empirical method have a narrower range.

                                                         TABLE 4
Estimates of Ashy Storm Petrel Oceanodroma homochroa population size within the California Current System based on at-sea surveys
                                               Empirical method                     ZINB model                         Hybrid model
Sub-region        Number of cells          Estimate      Percent of total    Estimate      Percent of total      Estimate      Percent of total
North                     3 212               7 161             60               8 160            70                 8 336            62
South                     6 321               4 757             40               3 473            30                 5 109            38
Totals                    9 533             11 918                             11 633                             13 445
         a
95% CI                        -                  [8 599–13 358]                    [5 694–50 637]                     [10 128–27 820]
90% CI                        -                  [8 890–12 751]                    [6 321–31 796]                     [10 531–21 030]
a   Confidence interval

                                                      Marine Ornithology 49: 193–204 (2021)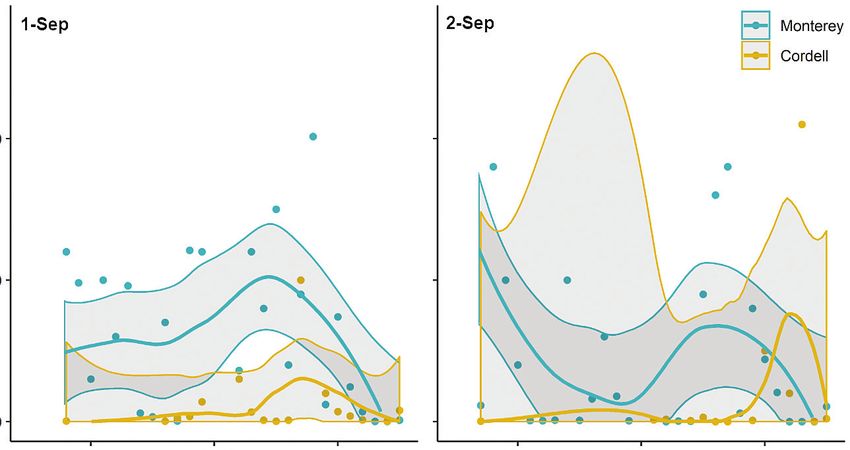
200 Ford et al.: Distribution of Ashy Storm Petrel off western California and Mexico
Large-scale distribution statistical models agreeing closely. The species generally occurs on
the outer continental shelf (near the shelf break) and continental
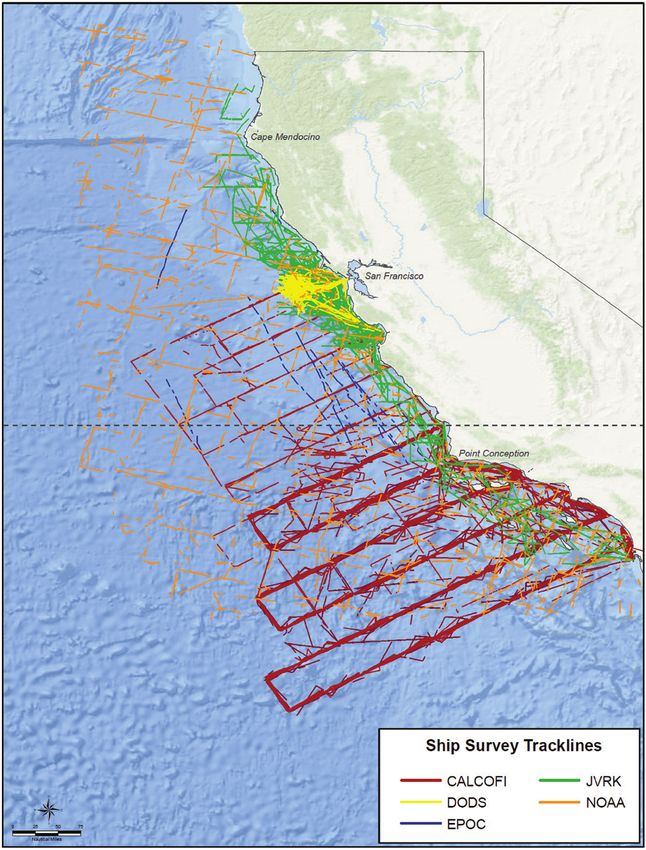
Clearly, there are many more ASSPs frequenting waters to the north slope, especially around the Farallon Islands and the northern
of Point Conception than to the south (Fig. 4). The pattern is the Channel Islands. Nightly colony arrival at darkness indicates that
same regardless of survey platform used, with results from the three dispersion during the day, at least during breeding, is not extensive
Ashy Storm-Petrel Sightings Expected Number of Ashy Storm-Petrels
Per 5ʹ Cell
SURVEY TYPE COUNT Based on ZINB Model
Aerial 1-2 31 - 100
0 - 0.001 1-5 15 - 20
Ship 3 - 15 101 - 750
16 - 30 0.001 - 0.1 5 - 10 20 - 25
751 - 1000
ANALYSIS AREA 0.1 - 1 10 - 15 >25
A B
35.1 N
Expected Number of Ashy Storm-Petrels Expected Number of Ashy Storm-Petrels
Per 5ʹ Cell Per 5ʹ Cell
Based on Hybrid Model Based on Empirical Model
0 - 0.001 1-5 15 - 20 0 - 0.001 1-5 15 - 20
0.001 - 0.1 5 - 10 20 - 25 0.001 - 0.1 5 - 10 20 - 25
0.1 - 1 10 - 15 >25 0.1 - 1 10 - 15 >25
Unsampled
C D
35.1 N
Fig. 4. Results of models depicting Ashy Storm Petrel Oceanodroma homochroa distribution: A) spread of individual sightings, 1980–2017;
B) zero-inflated negative binomial model; C) hybrid model; and D) empirical model.
Marine Ornithology 49: 193–204 (2021)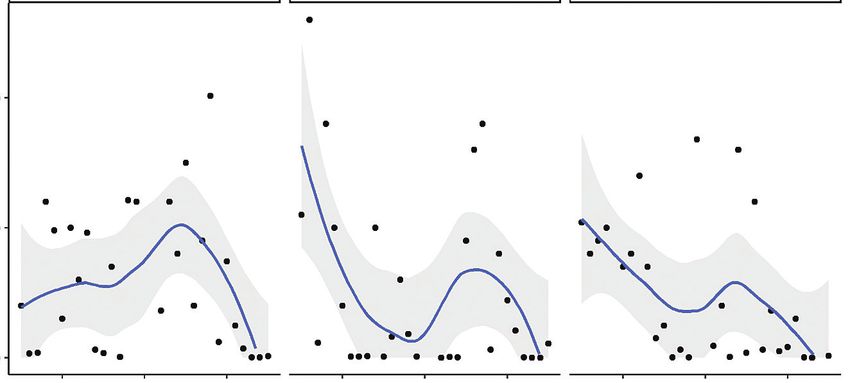
Ford et al.: Distribution of Ashy Storm Petrel off western California and Mexico                                201

(see Ainley et al. 1975, Adams 2016). Sightings of single birds far                                                Period; Bolin & Abbott 1963) were typically no more than 100 birds.
offshore occur with very low but increasing frequency toward the                                                   Clearly, numbers of ASSP in this area of the northern Gulf of the
south of the Channel Islands. However, these sightings may involve a                                               Farallones began to increase during the latter part of the study period,
higher frequency of incorrect identification, with confusion between                                               thus complementing the decrease seen in Monterey Bay (Figs. 6, 7).
ASSP and other dark Oceanodroma storm petrels. All these species
nest in the southern Channel Islands and Mexican islands (see Howell                                               Finally, as ASSP flocks became smaller in Monterey Bay, the birding
2012), thus possibly becoming problematic owing to increased                                                       community began to schedule their trips elsewhere to find them,
prevalence in at-sea surveys. The dozen or so records of unidentified                                              assuming that no actual decrease in population size was happening.
dark storm petrels were not included in our analysis.                                                              Besides Bodega Canyon, where it was known that numbers were
                                                                                                                   increasing, repeated trips departed from Halfmoon Bay to access
Small-scale patterns—hotspots                                                                                      Pioneer Canyon, where large flocks indeed were found (Figs. 3, 8).
                                                                                                                   Clearly, the size of flocks in Monterey Bay canyons during 2010–
Three major hotspots were detected by birders over the years,                                                      2015 had become far smaller than those at Pioneer and Bodega
beginning with the first birding boat trips in the 1970s (e.g., Stallcup                                           canyons. The complementarity of counts in Monterey Bay versus
1976). These were centered over submarine canyons that cut into the                                                Bodega Canyon are evident in Fig. 5; i.e., when there are more
outer continental shelf of central-northern California, especially the                                             birds in one area, there are fewer in the other. Several trips out of
Monterey/Soquel/Ascension and Bodega canyons (Figs. 3, 5). ASSP                                                    ports north of the Gulf of the Farallones, e.g., Fort Bragg near Cape
association with these submarine canyons is consistent with them being                                             Mendocino, found only a few ASSP: i.e., 68 in August 2011 but
krill hotspots (Santora et al. 2017, 2018), and the storm petrels forage                                           otherwise 30 or fewer birds on other trips (see also Howell 2012).
on small prey. Large flocks occurred, usually rafting on the water,
and were dominated by molting individuals. Seasonally, numbers                                                     DISCUSSION
encountered on trips began to increase in the second half of June but
were most prevalent from the second half of August to the second half                                              Compared to colony-based estimates of ASSP breeding populations,
of October (Oceanic Period). Birding boat trips conducted from ports                                               analysis of at-sea numbers indicates similar underestimates for both the
in Southern California out to the Channel Islands and beyond during                                                northern sub-region (mostly in the Farallon Islands—5700 (Nur et al.
the past 30 years have failed to find flocks or numbers anywhere near                                              2013) vs. 8336 birds (this study)) and the southern sub-region (3200
to what has been observed in central California waters.                                                            (Carter et al. 2016a) vs. 5109 birds (this study)). The total is slightly
                                                                                                                   higher than the maximum estimate of population size, based on surveys
The largest flocks seen on trips in Monterey Bay, all during the                                                   of all colonies (cf. Tables 1 and 4). Our results are similar to those
Oceanic Period, included: 7000 birds in October 1992, 8400 in                                                      obtained by Spear & Ainley (2007) for the northern sub-region during
October 1999, 9000 in August/September 1988 and 2007, 10 700 in                                                    spring-summer; they used most of the ship-based (not aerial) data
September 2008, and 13 000 in September 1986. From 1985 through                                                    analyzed here. They used GAMs to generate their population estimate
2011, in virtually every half-month of the Oceanic Period, counts                                                  of 7287 birds (CI 4500–9070), which was corrected for flux. Their result
exceeded at least 1000 birds. Numbers appeared to peak during 2006–                                                is further evidence that we were justified here in considering ASSP to
2008, but dropped off dramatically thereafter (Figs. 6, 7). The highest                                            be stationary relative to ship/aircraft speed; i.e. there was no difference
numbers of ASSP in the vicinity of Bodega Canyon/Cordell Bank                                                      between flux corrected and uncorrected population estimates.
also occurred during the Oceanic Period, and during approximately
the same array of months as in Monterey Bay (Fig. 5). The largest                                                  Our results may not be overestimates, as the colony-based surveys,
flocks encountered in this area included: 5000 in September 2004                                                   according to the researchers involved, involve only breeding birds
and 2007, 6000 in August 2015, 6400 in August 1994, and 10 500                                                     (“residents”; Nur et al. 2019), whereas the at-sea data include
in September 2013. A flock of 5000 encountered in January 2012                                                     breeders, non-breeders, and “floaters,” which includes breeding-
was very unusual, as counts during that month (Davidson Current                                                    capable adults that do not breed owing to a breeding cavity not being

                                                                          1=Sep                                     2=Sep                                Monterey

                                                                                                                                                         Cordell
                       Birds per survey during peak occurrence

                                                                 10000

                                                                  5000

                                                                     0

                                                                                  1990     2000        2010                 1990        2000          2010

Fig. 5. The pattern of Ashy Storm Petrel Oceanodroma homochroa prevalence at submarine canyons in Monterey Bay and Cordell Bank,
1985–2015. Values shown are the total number of birds logged during each half-month (1985–2015) divided by the number of surveys
conducted in each half-month period. The labels 1=Sep and 2=Sep refer to the first and second half of September.

                                                                                            Marine Ornithology 49: 193–204 (2021)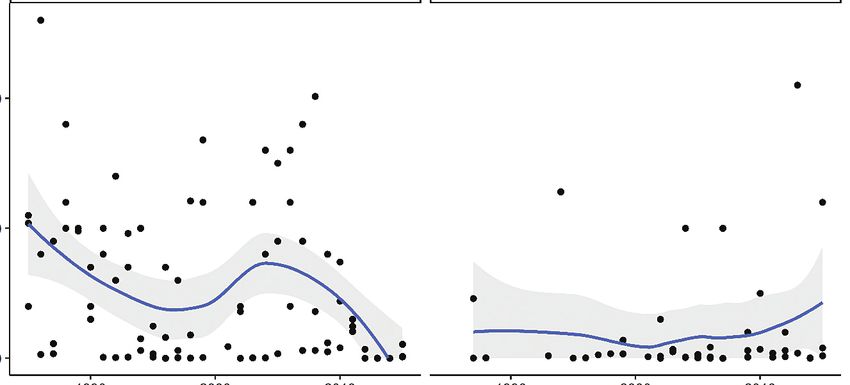
202                                                                              Ford et al.: Distribution of Ashy Storm Petrel off western California and Mexico

available. Many of these might be included in what Nur et al. (2019)                                                          whether they are incubating an egg). ASSP do not dig burrows but
define as “transients.” Indeed, Adams (2016) reported that ASSPs                                                              rely on natural cavities on the xeric, soil-deprived islands found in the
banded at one of the Channel Islands were recovered at multiple other                                                         Mediterranean climate of the southern CCS. A shortage of cavities
islands, including one at the Farallones; if these were not transients,                                                       results in floating populations of cavity-nesting birds, including
they were floaters. Nevertheless, floaters do visit colonies where                                                            seabirds, as noted both at Southeast Farallon and San Miguel islands
they are caught in mist nets used to estimate colony size. Floaters,                                                          (Ainley & Boekelheide 1990). Among other petrel species (almost
which are prospecting for nesting sites, cannot be distinguished                                                              all of which nest in burrows or cavities), the size of the non-breeding
from breeders, because both form incubation patches (regardless of                                                            portion of colony populations (which would include floaters) has

                                                                                              1-Sep                         2-Sep                           1-Oct

                                                                                   MONTEREY BAY

                                                                         10000

                                                                          5000
                               Birds per survey during peak occurrence

                                                                             0
                                                                                    1990      2000        2010      1990    2000     2010         1990      2000       2010
                                                                                                                            Year

                                                                                              2-Aug                         1-Sep                           2-Sep

                                                                                   CORDELL BANK

                                                                         10000

                                                                          5000

                                                                             0

                                                                                    1990      2000        2010      1990    2000     2010         1990      2000       2010
                                                                                                                            Year

Fig. 6. Half-monthly high counts among the three periods of highest counts in Monterey Bay and Cordell Bank, 1985–2015, analyzed using
Generalized Additive Models (line, with 95% confidence intervals in gray). On the x-axis, 1 and 2 refer to the first and second half of each month.

                                                                                                      Monterey                                    Cordell
                      Birds per survey during peak occurrence

                                                                10000

                                                                         5000

                                                                            0

                                                                                       1990             2000       2010              1990          2000             2010
                                                                                                                           Year

Fig. 7. Counts in Monterey Bay and Cordell Bank, 1985–2015, analyzed on an annual basis using Generalized Additive Models (line, with
95% confidence intervals in gray).

                                                                                                         Marine Ornithology 49: 193–204 (2021)
Ford et al.: Distribution of Ashy Storm Petrel off western California and Mexico 203
3000 ACKNOWLEDGEMENTS
2010-2015
2500 We have many persons and agencies to thank. This was definitely
BIRDS PER SURVEY
Monterey Bay a research community effort involving the efforts of hundreds of
2000 Pioneer Canyon people who were involved in collecting at-sea ASSP data over 45
Cordell Bank years, including both citizens funding their own expeditions, as well
1500
as professional observers on the platforms of opportunity and formal
research programs listed in Table 2. Observers on the EPOCS and
1000
Cal-COFI cruises were funded by the National Science Foundation.
500 Vessel and aircraft logistics were handled by the agencies also
identified in Table 2. Data analysis was funded by National Fish
0 & Wildlife Foundation award 0101.15.049952, with matches from
Jul 2 Aug 1 Aug 2 Sep 1 Sep 2 Oct 1 Oct 2 RG Ford Consulting and HT Harvey & Associates Ecological
Consultants. S.N.G. Howell organized the sighting records for
Fig. 8. Numbers of Ashy Storm Petrel Oceanodroma homochroa
Cordell Bank area and offered valuable comments on a draft of the
seen per survey, compared among Monterey Bay, Pioneer Canyon,
paper, as did J. Adams and associated lab members, members of
and Cordell Bank, 2010–2015. (Regularly scheduled Pioneer trips
ASSP Conservation Action Plan, James Waggitt, and two anonymous
began in 2010.) On the x-axis, 1 and 2 refer to the first and second
reviewers. Marine Ornithology’s Associate Editor, Peter Evans,
half of each month. Sightings during each half-month were totaled
managed the peer-review process of this paper, and Kyra Nabeta did
then divided by the number of surveys during the five-year period.
an excellent review as copy editor to facilitate a clearer presentation.
been found to be a significant portion of the total number of birds that REFERENCES
frequent the colonies (reviewed by Warham 1996: pp. 39–45). Our
results indicate a pattern like that determined for the New Zealand ADAMS, J. 2016. Ashy Storm-Petrel Oceanodroma homochroa
Storm Petrel (Rayner et al. 2020), in which the at-sea population mist-netting and capture rates in the California Channel Islands,
estimate is higher than the colony-based estimate. 2004–2007. Marine Ornithology 44: 71–82.
ADAMS, J. & TAKEKAWA, J.Y. 2008. At-sea distribution of radio-
Another issue with past estimates of breeding population size at marked Ashy Storm-Petrels Oceanodroma homochroa captured
the Channel Islands is that supposed ASSPs breeding at Santa on the California Channel Islands. Marine Ornithology 36: 9–17.
Catalina Island were recently inspected more closely and identified AINLEY, D.G. 1976. The occurrence of seabirds in the coastal region
as Leach’s Storm Petrels (LESP; Carter et al. 2016b). The body of California. Western Birds 7: 33–68.
size of LESP and other hydrobatid species decreases latitudinally, AINLEY, D.G. 1980. Geographic variation in Leach’s Storm-Petrel.
becoming more similar to ASSP toward the south (cf. measurements The Auk 97: 837–853.
in Ainley 1980, Ainley et al. 2019). The problem originated from AINLEY, D.G. & BOEKELHEIDE, R.J. (Eds.) 1990. Seabirds
sightings of only the heads of petrels in cavities, and subsequent of the Farallon Islands: Ecology, Dynamics, and Structure of
incorrect identification based only on the gray head of the southern an Upwelling System Community. Palo Alto, USA: Stanford
LESP populations in California. Rump color is also required for University Press.
accurate determination. Since then, closer inspections of birds at AINLEY, D.G. & HYRENBACH, K.D. 2010. Top-down and bottom-up
other localities on those islands have not been done to verify the factors affecting seabird population trends in the California current
colony-based estimates. It is possible that in the southern portion system (1985–2006). Progress in Oceanography 84: 242–254.
of the ASSP range, identification of storm petrels at sea judged to AINLEY, D.G. & LEWIS, T.J. 1974. The history of Farallon Island
be ASSP, could also have included dark-rumped LESP (and related marine bird populations, 1854–1972. The Condor 76: 432–446.
species). In that area, a few sightings of birds that could not be AINLEY, D.G., MCIVER, W., ADAMS, J. & PARKER, M. 2019.
identified by species were not included in our analysis. Ashy Storm-Petrel (Oceanodroma homochroa), version 2.0. In:
RODEWALD, P.G. (Ed.) The Birds of North America. Ithaca, USA:
Therefore, it appears from at-sea surveys that there are more ASSP Cornell Lab of Ornithology. doi:10.2173/bna.asspet.02
than previously thought, based on colony estimates, although a large AINLEY, D.G., MORRELL, S. & LEWIS, T.J. 1975. Patterns in the
portion of the difference may be among non-breeding individuals. life histories of storm-petrels on the Farallon Islands. Living Bird
Regardless, it has been confirmed that the entire population or almost 13: 295–312.
all of it can occur together in just one flock during the Oceanic Period BOLIN, R.L. & ABBOTT, D.P. 1963. Studies on the marine climate
(e.g., a flock of 10 000 to 13 000ASSP). Why these mega-flocks, and phytoplankton of the central coastal area of California, 1954–
which include a large proportion of molting individuals, appear to 1960. California Cooperative Oceanic Fisheries Investigations
have moved north from Monterey Bay to Pioneer Canyon and Cordell – Reports 9: 23–45.
Bank/Trough in the northern Gulf of the Farallones remains a mystery. BRIGGS, K.T., TYLER, W.B., LEWIS, D.B. & CARLSON, D.R.
It is worth investigating whether some unknown decadal and spatial 1987. Bird communities at sea off California: 1975 to 1983. Studies
changes in the food web are involved, or whether it is merely birds in Avian Biology 11: 1–74.
avoiding disturbance by the ever-increasing numbers of baleen whales CARTER, H.R., AINLEY, D.G., WOLF, S.G. & WEINSTEIN, A.M.
(see Ainley & Hyrenbach 2010), especially in the Monterey Bay area. 2016a. Range-wide conservation and science of the Ashy Storm-
There may also be some level of interference competition if ASSP and Petrel Oceanodroma homochroa. Marine Ornithology 44: 53–62.
whales are foraging on the same prey, but there are no data on ASSP CARTER, H.R., DVORAK, T.M. & WHITWORTH, D.L. 2016b.
diet. It could just be that the ASSP in their “molting flocks” shifted to Breeding of the Leach’s Storm-Petrel Oceanodroma leucorhoa at
avoid continual disturbance by surfacing whales and boat traffic. Santa Catalina Island, California. Marine Ornithology 44: 83–92.
Marine Ornithology 49: 193–204 (2021)204 Ford et al.: Distribution of Ashy Storm Petrel off western California and Mexico
CARTER, H.R., MCCHESNEY, G.J., JAQUES, D.L. ET AL. 1992. NUR, N., BRADLEY, R.W., SALAS, L., WARZYBOK, P. &
Volume 1 – Population Estimates. In: GILMER, D.S. (Ed.) JAHNCKE, J. 2019. Evaluating population impacts of predation
Breeding Populations of Seabirds in California, 1989–1991. by owls on storm petrels in relation to proposed island mouse
Dixon, USA: US Fish and Wildlife Service, Northern Prairie eradication. Ecosphere 10: e02878. doi:10.1002/ecs2.2878
Wildlife Research Center. PARKER, M.W. 2016. Conservation action plan for Ashy Storm-
CARTER, H.R., MCIVER, W.R. & MCCHESNEY, G.J. 2008. petrel (Oceanodroma homochroa) in California and Baja
Ashy Storm-Petrel (Oceanodroma homochroa). In: SHUFORD, California. Unpublished report. Davis, USA: California Institute of
W.D. & GARDALI, T. (Eds.) California Bird Species of Special Environmental Studies.
Concern: A ranked assessment of species, subspecies, and R CORE TEAM. 2019. R: A language and environment for statistical
distinct populations of birds of immediate conservation concern computing. Vienna, Austria: R Foundation for Statistical Computing.
in California. Studies of Western Birds No. 1. Camarillo, USA: RAYNER, M.J., GASKIN, C.P., TAYLOR, G.A. ET AL. 2020.
Western Field Ornithologists; Sacramento, USA: California Population estimation of the New Zealand storm petrel (Fregetta
Department of Fish and Game. maoriana) from mark-recapture techniques at Hauturu/Little
CLARKE, E.D., SPEAR, L.B., MCCRACKEN, M.L. ET AL. Barrier Island and from at-sea resightings of banded birds. Notornis
2003. Validating the use of generalized additive models and 67: 503–510.
at-sea surveys to estimate size and temporal trends of seabird SANTORA, J.A., SYDEMAN, W.J., SCHROEDER, I.D, FIELD,
populations. Journal of Applied Ecology 40: 278–292. J.C., MILLER, R.R. & WELLS, B.K. 2017. Persistence of trophic
DAY, R.H, COOPER, B.A., & TELFER, T.C. 2003. Decline of hotspots and relation to human impacts within an upwelling marine
Townsend’s (Newell’s) Shearwaters (Puffinus auricularis newelli) ecosystem. Ecological Applications 27: 560–574.
on Kauai, Hawaii. The Auk 120: 669–679. SANTORA, J.A., ZENO, R., DORMAN, J.G. & SYDEMAN, W.J.
HASTIE, T., TIBSHIRANI, R., & FRIEDMAN, J. 2009. The 2018. Submarine canyons represent an essential habitat network
Elements of Statistical Learning: Data Mining, Inference, and for krill hotspots in a Large Marine Ecosystem. Scientific Reports
Prediction, 2nd Edition. New York, USA: Springer-Verlag. 8: 7579. doi:10.1038/s41598-018-25742-9
HOWELL, S.N.G. 2012. Petrels, Albatrosses and Storm-Petrels SOWLS, A.L., DEGANGE, A.R., NELSON, J.W. & LESTER, G.S.
of North America: A Photographic Guide. Princeton, USA: 1980. Catalog of California Seabird Colonies. FWS/OBS-80/37.
Princeton University Press. Washington, USA: US Fish and Wildlife Service.
HUNT, G.L., JR., PITMAN, R.L., NAUGHTON, M., WINNETT, SYDEMAN, W.J., NUR, N., MCLAREN, E.B. & MCCHESNEY,
K. & NEWMAN, A. 1981. Summary of marine mammal and G.J. 1998. Status and trends of the Ashy Storm-petrel on Southeast
seabird surveys of the Southern California Bight area, 1975– Farallon Island, California, based upon capture-recapture analyses.
1978. Volume III - Investigators’ Reports. Part III. Seabirds, The Condor 100: 438–447.
book II. Reproductive ecology and foraging habits of breeding SPEAR, L.B. & AINLEY, D.G. 2007. Storm-petrels of the eastern
seabirds. Final report. Report no. PB-81-248205. Springfield, Pacific Ocean: Species diversity and assembly along habitat
USA: National Technical Information Service, US Department gradients. Ornithological Monographs 62: 1–77.
of Commerce. SPEAR, L.B., AINLEY, D.G., HARDESTY, B.D., HOWELL, S.N.G.
HYRENBACH, K.D. & VEIT, R.R. 2003. Ocean warming and & WEBB, S.W. 2004. Reducing biases affecting at-sea surveys of
seabird communities of the southern California Current System seabirds: use of multiple observer teams. Marine Ornithology 32:
(1987–98): response at multiple temporal scales. Deep-Sea 147–157.
Research Part II 50: 2537–2565. SPEAR, L.B., AINLEY, D.G., NUR, N. & HOWELL, S.N.G. 1995.
JOYCE, T.W. 2016. Foraging Ecology, Biogeography, and Population size and factors affecting at-sea distribution of four
Population Biology of Seabird and Toothed Whale Predators in endangered procellariids in the tropical Pacific. The Condor 97:
the Anthropocene. PhD dissertation. San Diego, USA: University 613–638.
of California. STALLCUP, R.W. 1976. Pelagic birds of Monterey Bay, California.
MACLEAN, I.M.D., REHFISCH, M.M., SKOV, H. & THAXTER, Western Birds 7: 113–136.
C.B. 2013. Evaluating the statistical power of detecting changes in USFWS (UNITED STATES FISH & WILDLIFE SERVICE). 2009.
the abundance of seabirds at sea. Ibis 155: 113–126. Endangered and Threatened Wildlife and Plants; 12-Month Finding
MASON, J.W., MCCHESNEY, G.J., MCIVER, W.R. ET AL. on a Petition to List the Ashy Storm-Petrel as Threatened or
2007. At-sea distribution and abundance of seabirds off southern Endangered. 50 CFR Part 17 [FWS-R8-ES-2008-0049; 1111 FY08
California: A 20-year comparison. Studies in Avian Biology 33: MO-B2]. Federal Register 74: 41832–41860.
1–101. USFWS. 2013. Endangered and Threatened Wildlife and Plants;
NOAA (NATIONAL OCEANOGRAPHIC AND ATMOSPHERIC 12-Month Finding on a Petition to List Ashy Storm-Petrel as an
ADMINISTRATION). 2003. A Biogeographic Assessment off Endangered or Threatened Species. 50 CFR Part 17 [Docket No.
North/Central California in Support of the Cordell Bank, FWS–ES–R8–2012–0075; 4500030113]. Federal Register 78:
Gulf of the Farallones and Monterey Bay National Marine 62523–62529.
Sanctuaries, Phase I – Marine Fishes, Bird and Mammals. WARHAM, J. 1996. The Behaviour, Population Biology and Physiology
Washington, USA: NOAA. [Accessed online at https:// of the Petrels, 1st Edition. New York, USA: Academic Press.
montereybay.noaa.gov/research/techreports/trnccos2003.html WARZYBOK, P., BERGER, R. & BRADLEY, R.W. 2015. Population
on 06 June 2017.] size and reproductive performance of seabirds on Southeast
NUR, N., BRADLEY, R., SALAS, L. & JAHNCKE, J. 2013. Farallon Island, 2015. Unpublished report to the US Fish and
Modeling the Impacts of House Mouse Eradication on Ashy Wildlife Service. PRBO Contribution Number 2055. Petaluma,
Storm-Petrels on Southeast Farallon Island. Unpublished report USA: Point Blue Conservation Science.
to the US Fish and Wildlife Service. PRBO Contribution Number WICKHAM, H. 2016. ggplot2: Elegant Graphics for Data Analysis.
1880. Petaluma, USA: Point Blue Conservation Science. 2nd Edition. New York, USA: Springer-Verlag.
Marine Ornithology 49: 193–204 (2021)You can also read