Shark (Rhincodon typus) - Blackwell Publishing Ltd Population genetic structure of Earth's largest fish, the whale
←
→
Page content transcription
If your browser does not render page correctly, please read the page content below
Molecular Ecology (2007) 16, 5183–5192                                                                        doi: 10.1111/j.1365-294X.2007.03597.x

Population genetic structure of Earth’s largest fish, the whale
Blackwell Publishing Ltd

shark (Rhincodon typus)
A . L . F. C A S T R O ,* B . S . S T E WA RT ,† S . G . W I L S O N ,† R . E . H U E T E R ,‡ M . G . M E E K A N ,§ P. J . M O T TA ,*
B . W. B O W E N ¶ and S . A . K A R L ¶
*Department of Biology, University of South Florida, SCA110, 4202 E. Fowler Ave., Tampa, FL 33620, USA, †Hubbs-SeaWorld
Research Institute, 2595 Ingraham Street, San Diego, CA 92109, USA, ‡Center for Shark Research, Mote Marine Laboratory, 1600 Ken
Thompson Parkway, Sarasota, FL 34236, USA, §Australian Institute of Marine Science, PO Box 40197, Casuarina MC, Darwin, NT
0811, Australia, ¶Hawai’i Institute of Marine Biology, University of Hawai’i, Manoa, PO Box 1346, Kane’ohe, HI 96744, USA

                           Abstract
                           Large pelagic vertebrates pose special conservation challenges because their movements
                           generally exceed the boundaries of any single jurisdiction. To assess the population structure
                           of whale sharks (Rhincodon typus), we sequenced complete mitochondrial DNA control
                           regions from individuals collected across a global distribution. We observed 51 single site
                           polymorphisms and 8 regions with indels comprising 44 haplotypes in 70 individuals, with
                           high haplotype (h = 0.974 ± 0.008) and nucleotide diversity (π = 0.011 ± 0.006). The control
                           region has the largest length variation yet reported for an elasmobranch (1143–1332 bp).
                           Phylogenetic analyses reveal no geographical clustering of lineages and the most common
                           haplotype was distributed globally. The absence of population structure across the
                           Indian and Pacific basins indicates that oceanic expanses and land barriers in Southeast
                           Asia are not impediments to whale shark dispersal. We did, however, find significant
                           haplotype frequency differences (AMOVA, ΦST = 0.107, P < 0.001) principally between the
                           Atlantic and Indo-Pacific populations. In contrast to other recent surveys of globally
                           distributed sharks, we find much less population subdivision and no evidence for cryptic
                           evolutionary partitions. Discovery of the mating and pupping areas of whale sharks is key
                           to further population genetic studies. The global pattern of shared haplotypes in whale
                           sharks provides a compelling argument for development of broad international approaches
                           for management and conservation of Earth’s largest fish.
                           Keywords: conservation genetics, control region, marine phylogeography, migration, mitochon-
                           drial DNA, tandem repeats

                           Received 22 May 2007; revision accepted 1 October 2007

                                                                                       Although the natural histories of many pelagic migrants
Introduction
                                                                                    have been illuminated by genetic markers, little is known
The vastness of Earth’s oceans often conceals regional biolo-                       about the biology and biogeography of the whale shark
gical processes particularly for pelagic and highly migratory                       (Rhincodon typus). Whale sharks appear to be widely distrib-
species. Many species of shark, billfish, and tuna mature                           uted in tropical and warm temperate seas (30°N and 35°S)
and forage far from shore. Some marine mammals and sea                              except, perhaps, in the Mediterranean (Compagno 2001).
turtles approach land to breed or rest, but spend most of                           Most information about general distribution, however,
their lives beyond shoreline-based jurisdictions. Moreover,                         is either from seasonal sightings in scattered locations or
large marine vertebrates often have complex migratory                               anecdotal observations (Colman 1997). Aggregations of
behaviours that vary with age and sex (e.g. Brown et al. 1995;                      whale sharks have been routinely reported off Western
Pardini et al. 2001; Bowen et al. 2005; Carlsson et al. 2007).                      Australia; Belize; the Yucatan peninsula and Baja California,
                                                                                    Mexico; India; Djibouti; Taiwan; Japan; and the Philippines
Correspondence: Stephen A. Karl, Fax: 808-236-7443; E-mail:                         (Colman 1997; Compagno 2001; Stewart & Wilson 2005).
skarl@hawaii.edu                                                                    Some aggregations occur year-round while others may be

© 2007 The Authors
Journal compilation © 2007 Blackwell Publishing Ltd
5184 A . L . F. C A S T R O E T A L .

                                                                TATAATTTTGGTTACAA-3′). Because of the large size of
                                                                the CR (~1100–1325 nucleotides), two internal primers were
                                                                designed to facilitate sequencing of the whole region.
                                                                Primer WSCR2-R (5′-CTTAATATTTATTGTTCCTGGTT-
                                                                TCAGCC-3′) was paired with WSCR1-F, and primer
                                                                WSCR2-F (5′-CTATAATTGATTTAAACTGACATTTG-3′)
                                                                was paired with WSCR1-R producing two overlapping
                                                                fragments approximately 950 bp and 700 bp, respectively.
                                                                Amplification reactions were carried out in 50-μL volumes
                                                                consisting of 1× Promega buffer (Promega), 1.25 U of
                                                                IDProof DNA polymerase (ID Laboratories Inc.), 0.8 mm
Fig. 1 Geographical distribution and number of whale shark      dNTPs, 2 mm MgCl2, 0.5 μm of each primer, 6.0 μg bovine
specimens obtained for each geographical location.
                                                                serum albumin, and 1–3 μL of template. Cycling conditions
                                                                for all primer pairs consisted of 95 °C 1 min, 35–40 cycles of
                                                                95 °C 45 s, 58 °C 60 s, and 72 °C 90 s with a final extension
associated with seasonal abundance of prey. Most known          at 72 °C for 7 min. Amplicons were purified with QIAquick
aggregations are comprised predominantly of immature            kit (QIAGEN) following the manufacturer’s instructions.
sharks and segregation by size and sex may occur in some        Both strands were sequenced using an ABI 3730XL Genetic
areas (Colman 1997; Compagno 2001). Even though recent          analyser (Applied Biosystems, Inc.).
studies have demonstrated the ability of this species to
migrate long distances (e.g. Eckert & Stewart 2001; Wilson
                                                                Data analysis
et al. 2006), it is not clear whether whale shark populations
are panmictic or composed of reproductively isolated sub-       Control region alignments were optimized in sequencher
populations. Recent evidence of cold-water tolerance when       4.1 (Gene Codes Corporation) and gaps were introduced to
diving (Wilson et al. 2006) indicates that low temperatures     maximize sequence similarity. Contiguous gaps were treated
and perhaps even subpolar waters may not be impediments         as a single event by omitting all but one of the gapped
to whale shark movement. Here, we present a population          bases. Gaps were coded as transitions for distance-based
genetics survey of this widely distributed species using        analyses. In the case of substitutions within gaps, variable
mtDNA control region (CR) sequences. As whale shark             positions were retained and the gap was coded as a single
numbers appear to be declining in some regions (Stewart         transition. The Akaike information criteria within modeltest
& Wilson 2005; Theberge & Dearden 2006), these findings         version 3.06 (Posada & Crandall 1998) was used to determine
have implications for global management and conservation.       the best-fit model of evolution. A statistical parsimony
                                                                network was constructed using tcs 1.2.1 (Clement et al. 2000).
                                                                   Summary statistics (haplotype frequencies, number
Materials and methods                                           of polymorphic sites, number of transitions and trans-
                                                                versions, and nucleotide composition) were estimated
Sample collection and laboratory procedures                     in arlequin 3.0 (Excoffier et al. 2005). Individuals were
Skin samples from 70 whale sharks were collected by biopsy      binned into five groups defined by geographical region:
punch on a pole spear for live animals, or direct sampling      Quintana Roo, Mexico and Gulf of Mexico, USA in the
of dead specimens, between 1992 and 2005 and were pre-          northwestern Atlantic Ocean (N = 19); South Africa,
served in either salt-saturated dimethyl sulphoxide (DMSO)      Mozambique, and Kenya in the western Indian Ocean (18);
solution or 95% ethanol and stored at room temperature.         Philippines and Taiwan in the northwestern Pacific Ocean
Collections were made at Ningaloo Reef, Australia (N = 12);     (12); Western Australia in the eastern Indian Ocean (12);
Gulf of California, Mexico (8); Pamilacan Island, Philippines   and the Gulf of California in the northeastern Pacific Ocean
(3); Hualien, Taiwan (9); KwaZulu-Natal, South Africa (5);      (8). Genetic diversity within localities was measured as the
Buinjata, Mozambique (8); Mombasa, Kenya (5); Vattanu           number of haplotypes, haplotype diversity (h), and nucle-
Kandu, Maldives (1); Quintana Roo, Mexico (17); and Gulf        otide diversity (π) estimated with Nei’s corrected average
of Mexico, USA (2)(Fig. 1).                                     genetic divergence (Nei 1987) incorporating Tamura & Nei’s
   We extracted total genomic DNA using a phenol–               (1993) model of sequence evolution with arlequin.
chloroform–isoamyl alcohol protocol (Sambrook et al. 1989)         We used mismatch distributions for each sample to
or 5% Chelex nonboiling protocol (Walsh et al. 1991). The       distinguish between population growth models, especially
mitochondrial CR was amplified using primers developed          those invoking past exponential growth and historical
within the tRNAPro (WSCR1-F: 5′-TTGGCTCCCAAAGCC-                population stasis (Slatkin & Hudson 1991; Rogers &
AAGATTCTTC-3′) and tRNAPhe (WSCR1-R: 5′-GCATG-                  Harpending 1992). Population parameters τ, θ0, and θ1

                                                                                                           © 2007 The Authors
                                                                           Journal compilation © 2007 Blackwell Publishing Ltd
G E N E T I C S T R U C T U R E O F W H A L E S H A R K S 5185
Fig. 2 Schematic diagram showing the
consensus of all 44 haplotypes for the
complete CR sequences of the whale shark.
Coloured blocks represent different repeated
fragments along the CR sequence. Similar
sequences have the same colour and letter
designation and repeats are numbered.
Arrows represent primers used in PCR
amplification.
were obtained from arlequin, where τ is the mutational E3, and F3 to J3 (sequentially as indicated in Fig. 2) and this
timescale, and θ0 and θ1 are the expected pairwise differ- was the motif for the smallest haplotype, H19 (see Supple-
ences before and after a change in population size (growth mentary material). The largest haplotype, H10, had all the
or contraction), respectively (Harpending 1994). The common repeats, some less common ones, and was the
mutational timescale is τ = 2μt, where t is measured in only haplotype to have block I1. Haplotypes H11 and H12
generations and μ is the mutation rate per generation for were similar to H19 except they possessed blocks E1 and F1
the entire sequence (μ = mTu, where mT = number of nucle- (totaling 103 bp) making H11 and H12 the second largest
otides and u = mutation rate per nucleotide). The expected haplotypes.
pairwise differentiation is θ = 2Nefμ where Nef is the effec- We also found substitutions among repeated blocks
tive female population size. within the same sequence. For example, repeat A1 differed
Population subdivision and structure were estimated from A2 by a substitution of one nucleotide in haplotype
using an analysis of molecular variance (amova, Excoffier H23. Other examples included substitutions shared between
et al. 1992) and pairwise population ΦST significance test different haplotypes including block B, which was repeated
(Cockerham & Weir 1993) as implemented in arlequin. twice in nearly all haplotypes. For some haplotypes, these
Significance of ΦST was determined via nonparametric were perfect repeats whereas there were single transitional
permutation (Excoffier et al. 1992) with 1000 data permuta- changes in others. Clearly, both larger indel changes and
tions. For amova analyses, we used the Tamura & Nei’s smaller substitutional changes are common in the evolu-
(1993) model of sequence evolution. Population differenti- tion of the whale shark CR.
ation also was tested using an exact test based on haplotype To maximize sequence similarity among specimens,
frequencies (Raymond & Rousset 1995) in arlequin. the complete DNA sequence alignment required multiple
gaps of sizes ranging from 1 to 163 bp. There were 49 single
site substitutions (38 transitions and 11 transversions) and
Results
eight gaps resolving 44 haplotypes. Five of the sequences
The mitochondrial CR from a total of 70 individuals ranged in the gapped regions were monomorphic, while the other
from 1143 to 1332 bp with a mean of 1236 bp (GenBank three each had substitutions. Overall, the haplotype diver-
Accession nos EU182401 to EU182444 (see Supplementary sity (h), and nucleotide diversity (π) were relatively high
material pending). Nearly all of this size variation was (h = 0.90–1.0, π = 0.007–0.016; Table 1). Among the 44
due to indels composed of repeated sequence blocks observed haplotypes, only nine were observed in more than
(Fig. 2). Interestingly, although we did not specifically test for a single shark (Table 2). Five of those haplotypes were
heteroplasmy, none was observed. Considering just the found in only a single geographical region (H4 and H6 in
repeat unit structure (i.e. ignoring site substitutions), there the Atlantic Ocean, H5 and H7 in the western Indian
were 11 different repeat motifs in the whale shark CR. Ocean, and H9 in the northwest Pacific Ocean), with the
Repeated blocks ranged in size from 9 (block A) to 64 bp remainder being found in two or more locations. Except
(block E) long. All haplotypes had regions A1 to D1, E2, F2 for some of the Atlantic Ocean haplotypes, there appeared
© 2007 The Authors
Journal compilation © 2007 Blackwell Publishing Ltd5186 A . L . F. C A S T R O E T A L .
Table 1 Location, number of individuals (N), number of
haplotypes (n), haplotype (h) and nucleotide (π) diversity estimates
and standard deviations observed in the CR of the whale shark
within five major ocean basins. Single individual from Maldives
not included
Geographical location N n h π
Atlantic 19 12 0.93 ± 0.04 0.007 ± 0.002
Western Indian 18 14 0.95 ± 0.04 0.005 ± 0.003
Eastern Indian 12 9 0.91 ± 0.08 0.004 ± 0.002
Northwest Pacific 12 11 1.00 ± 0.04 0.005 ± 0.003
Northeast Pacific 8 7 0.96 ± 0.08 0.006 ± 0.004
TOTAL 69 44 0.97 ± 0.01 0.011 ± 0.006
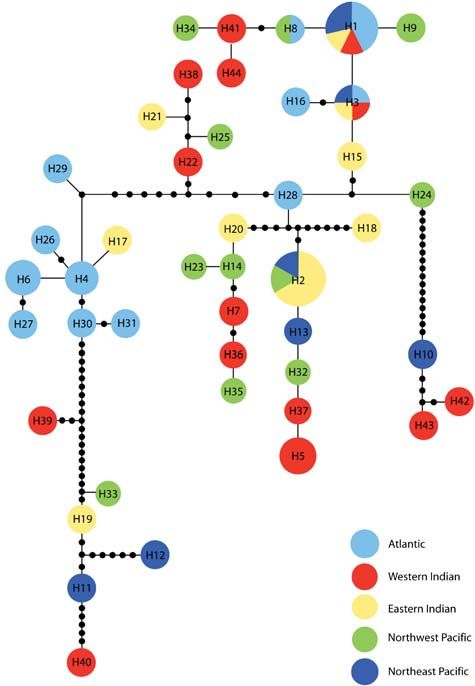
Fig. 3 Statistical parsimony network of haplotypes. All haplotypes
are separated by one mutation and solid black circles represent
Fig. 4 Haplotype mismatch distribution. Note that nearly all
hypothetical haplotypes not observed in this study. The size of the
comparisons with 11 or more differences between the sequences
circle is proportional to the frequency of that haplotype.
involve haplotypes H10, H42, and H43. The line is the expected
frequency given a demographically stable population.
to be no phylogeographical clustering of haplotypes
(Fig. 3). There was statistically significant structure in haplotypes by 8–18 substitutions (Fig. 4). There was no
whale shark populations with overall ΦST = 0.107 clear geographical clustering, however, and several haplo-
(P < 0.001). The Atlantic Ocean population was signifi- types were shared among regions. Indeed, we detected
cantly different from all other populations (Table 3), although haplotypes H1 and H3 in every region except the northwest
small sample sizes temper this conclusion. Moreover, Pacific Ocean.
an exact test of haplotype frequencies shows divergence The mutational timescale τ = 2μt can be used to estimate
primarily between the Atlantic and Indian/Pacific Ocean coalescence times for populations if generation time and
populations (with the exception of the northeast Pacific mutation rate (μ) are available. Moreover, the initial and
Ocean; Table 3). There are two exceptions to the finding of current effective population sizes (Nf0 and Nf1) can be esti-
genetic homogeneity across the Indo-Pacific region both mated from the pairwise differences θ0 and θ1, if a mutation
involving the western Indian Ocean population. Neither of rate is available or estimated. Based on the observation of
those, however, makes phylogeographical sense and both an adolescent female with a vertebral age estimate of
oppose the general trend of homogeneity. Hence, we consider 20 years (Wintner 2000), we provisionally apply a genera-
these findings to be the result of stochastic sampling error. tion estimate of 25 years. The control region clock for the
The observed haplotype mismatch distribution was not scalloped hammerhead, Sphyrna lewini, is 0.8% divergence
significantly different from expectations under constant between lineages per million years (Duncan et al. 2006) and
population size (P = 0.90; Fig. 4). Haplotypes H10 (northeast is similar to a rate derived from control regions of lemon
Pacific Ocean) and H42 and H43 (western Indian Ocean) sharks (Negaprion brevirostris; J. Schultz, personal communica-
contributed to this conclusion being distinct from all other tion). In contrast, Keeney & Heist (2006) reported a rate of
© 2007 The Authors
Journal compilation © 2007 Blackwell Publishing LtdG E N E T I C S T R U C T U R E O F W H A L E S H A R K S 5187
Table 2 Geographical distribution of
Geographical location haplotypes found in 70 whale sharks from
five major ocean basins
Western Eastern Northwest Northeast
Haplotype Atlantic Indian Indian Pacific Pacific Total
H1 3 1 1 — 2 7
H2 — — 4 1 1 7*
H3 1 1 1 — 1 4
H4 4 — — — — 4
H5 — 4 — — — 4
H6 3 — — — — 3
H7 — 2 — — — 2
H8 1 — — 1 — 2
H9 — — — 2 — 2
H10 — — — — 1 1
H11 — — — — 1 1
H12 — — — — 1 1
H13 — — — — 1 1
H14 — — — 1 — 1
H15 — — 1 — — 1
H16 1 — — — — 1
H17 — — 1 — — 1
H18 — — 1 — — 1
H19 — — 1 — — 1
H20 — — 1 — — 1
H21 — — 1 — — 1
H22 — 1 — — — 1
H23 — — — 1 — 1
H24 — — — 1 — 1
H25 — — — 1 — 1
H26 1 — — — — 1
H27 1 — — — — 1
H28 1 — — — — 1
H29 1 — — — — 1
H30 1 — — — — 1
H31 1 — — — — 1
H32 — — — 1 — 1
H33 — — — 1 — 1
H34 — — — 1 — 1
H35 — — — 1 — 1
H36 — 1 — — — 1
H37 — 1 — — — 1
H38 — 1 — — — 1
H39 — 1 — — — 1
H40 — 1 — — — 1
H41 — 1 — — — 1
H42 — 1 — — — 1
H43 — 1 — — — 1
H44 — 1 — — — 1
TOTAL 19 18 12 12 8 70
*One individual with H2 was sampled in the Maldives but not listed by location in the table.
0.4% per million years for the control region in the blacktip data indicated coalescence times on the order of 1 600 000–
shark (Carcharhinus limbatus). We provisionally applied 3 200 000 years (Pliocene–Pleistocene boundary), with founding
both rates to whale sharks, with the caution that these effective population sizes of Nf0 = 13 000–26 000 individuals,
three species are tens of millions of years divergent from and current effective population size Nf1 = 119 000–238 000
Rhincodon typus. When analysed across all samples, these individuals (Table 4).
© 2007 The Authors
Journal compilation © 2007 Blackwell Publishing Ltd5188 A . L . F. C A S T R O E T A L .
Table 3 Estimate of pairwise ΦST values
Western Eastern Northwest Northeast of whale sharks from five major ocean
Populations Atlantic Indian Indian Pacific Pacific basins using Tamura & Nei (1993)
genetic distances (below diagonal) and
Atlantic — 0.004 0.011 0.008 0.235 exact test significance values (above).
Western Indian 0.215* — 0.037 0.028 0.258 The ΦST values marked with * are
Eastern Indian 0.196* 0.072* — 0.173 0.768 significant (P = 0.05)
Northwest Pacific 0.163* 0.001 0.002 — 0.499
Northeast Pacific 0.208* 0.037 0.000 0.000 —
Table 4 Time to common ancestor (τ), founding effective female estimation of generation time is also somewhat con-
population size (from θ0), and current effective female population troversial. The generation time of 25 years was based
size (from θ1) based on a coalescence approach on the size–age relationship of a single immature female
(Wintner 2000). Hoelzel et al. (2006) used a generation
Divergence rate
time of 16 years for the basking shark. If the generation
0.8% per 0.4% per time for the whale shark is similar (i.e. shorter than we
Parameter million years million years estimate), our population estimates can be considered
conservative. Nonetheless, we suggest caution in accepting
τ 14.300 1 600 000 years 3 200 000 years genetically effective population sizes as being accurate
θ0 3.011 13 000 26 000 within no less than an order of magnitude.
θ1 27.107 119 000 238 000
Control region structure
Discussion The CR in whale sharks (1143–1332 bp) is larger than that
observed in most cartilaginous fishes. Amplification of the
Our global survey of whale sharks indicates unusual size
CR in 52 elasmobranch species has indicated a length of
polymorphism in the CR, significant population structure
1030–1050 bp except for the barndoor skate (Dipturus
between the Atlantic and Indian-Pacific ocean basins, and
laevis), which is ~1200 bp (Stoner et al. 2003). Other sharks
coalescence times on the order of 2–3 million years. Before
have a shorter CR (spiny dogfish, Squalus acanthias, 1080 bp,
interpreting these results, we address two caveats:
Rasmussen & Arnason 1999; starspotted smooth-hound,
1 Sample size is small and lapses in coverage include the Mustelus manazo, 1068 bp, Cao et al. 1998; horn shark,
South Atlantic, Central Pacific, and South Pacific oceans. Heterodontus francisi, 1068 bp, Arnason et al. 2001; lesser
Sample sizes clearly limit inferences and we temper our spotted dogfish, Scyliorhinus canicula, 1050 bp, Delarbre
conclusions accordingly. There are no directed oceanic et al. 1998), or one comparable in length (white shark,
surveys for whale sharks, as there are for tuna, billfish, Carcharodon carcharias, 1146 bp, Pardini et al. 2001) to the
and sea turtles, and the species occurs at low densities smallest whale shark CR. Size variation in the CR of whale
even in regional aggregates. The sample size of 70 repre- sharks is also higher than that reported for other sharks
sents over a decade of effort and this study is the most (Kitamura et al. 1996; Pardini et al. 2001; Keeney et al. 2005),
comprehensive genetic evaluation of this rare and with a 189-bp difference between the largest and smallest
enigmatic species (see Ramírez-Macías et al. 2007 for an amplicon.
analysis of whale sharks in the Gulf of California, Mexico). Variation in the size of the control region has been
The observation of shared haplotypes (e.g. H1–H3) across reported for a substantial number of bony fishes (Lee et al.
the extremes of the geographical range is a robust find- 1995; Brown et al. 1996; Bentzen et al. 1998; Hoarau et al.
ing that will not change regardless of sample sizes. 2002). In bony fishes, the CR typically consists of tandem
2 Estimates of generation time and mutation rate are pro- repeats, as observed in the whale shark (Fig. 2). Our initial
visional, and the latter is derived from distantly related attempts to polymerase chain reaction (PCR)-amplify the
sharks. The corresponding estimates of coalescence times CR of whale sharks using a variety of published shark
and effective population sizes should be regarded as primers failed, probably because of the highly duplicated
general indicators. Shark mtDNA appears to evolve about nature of the CR. Because the rate and pattern of these
an order of magnitude slower than for bony fishes mutations are unknown, most studies have not used size
(Martin et al. 1992), consistent with our clock estimates. variants as population markers. Insertions and deletions of
Consequently, corresponding estimates are useful in a repeat blocks may be relatively common, and homoplasy
qualitative sense for determining whether, for example, (convergence on the same number of repeats) is likely to
population histories coalesce at 105, 106, or 107 years. The confound any genealogical analysis.
© 2007 The Authors
Journal compilation © 2007 Blackwell Publishing LtdG E N E T I C S T R U C T U R E O F W H A L E S H A R K S 5189
evolutionary timescale. Because a majority of our samples
Genetic diversity and effective population size
were collected from seasonal feeding aggregations (seven
Despite an apparent decline in whale sharks abundance were from stranded or fishery-caught sharks), we cannot
in some regions (e.g. Stewart & Wilson 2005; Theberge & determine whether this pattern is due to ocean-wide
Dearden 2006; Bradshaw et al. 2007), there is still relatively interbreeding or to physical mixing in seasonal foraging
high genetic diversity in the species. Declining populations areas of sharks from different breeding populations. In
are expected, however, to retain historic levels of genetic genetic studies of organisms with complex, multiphasic life
diversity if the decline has occurred only recently (Roman histories, conclusions regarding population subdivisions
& Palumbi 2003; Bowen et al. 2007). In the only other global are fundamentally influenced by the particular life-history
surveys of shark CRs, the blacktip shark (Carcharhinus phase sampled (Bowen & Karl 2007). It is possible that
limbatus), yielded h = 0.843 ± 0.015 and π = 0.004 ± 0.002 whale shark populations consist of discrete, differentiated
(Keeney & Heist 2006), and the scalloped hammerhead breeding units, which would not be detected in a survey
(Sphyrna lewini) had h = 0.800 ± 0.020 and π = 0.013 ± 0.007 of feeding aggregates. Regardless, our finding of haplotype
(Duncan et al. 2006), compared to h = 0.970 ± 0.010 and sharing between ocean basins is consistent with the
π = 0.011 ± 0.006 for whale sharks. These values are typical potential for global migrations allowing for population
of abundant, geographically widespread shark species mixing over large distances. If this is the case, any breeding
(cf. Heist 1999; Heist 2004). population subdivision would likely be primarily based on
The extant population size of whale shark is unknown. behavioural attributes. Clearly, more research on the basic
The nucleotide diversity values for blacktip sharks and life history of whale sharks is needed before questions of
scalloped hammerheads correspond to Nef = 140 000 complex population structure in whale sharks can be
compared to our estimates of Nef = 119 000–238 000 for whale addressed.
sharks. This is surprising given that blacktip sharks and Whale shark population structure is low, even against
hammerheads are globally distributed, abundant, coastal the standards of large migratory fishes and whales. Bluefin
species, whereas the known dozen or so aggregates of whale tuna (Thunnus thynnus) show subtle (ΦST = 0.013) but
sharks typically consist of tens to a few hundred individuals significant population structure between the western Atlantic
(Bradshaw et al. 2007). Two general processes might Ocean (Gulf of Mexico) and the Mediterranean Sea, sep-
contribute to the relatively high genetic diversity that we arated by ~11 000 km (Carlsson et al. 2007). The sailfish
have documented in whale sharks: (i) secondary contact Istiophorus platypterus also is divided among ocean basins
between divergent allopatric lineages, or (ii) large stable with significant population structure within the Pacific
populations. Except perhaps for haplotypes H10, H42, and Ocean (Graves & McDowell 2003). Blue marlin (Makaira
H43, the mtDNA phylogeny reveals no evidence of distinct nigricans) are strongly divided among ocean basins
evolutionary lineages now in sympatry and the mismatch (ΦST = 0.217, Buonaccorsi et al. 2001). Whales show similar
distribution indicates a relatively large, stable population. patterns of inter-ocean differentiation. Humpback (Megaptera
The large Nef of 119 000–238 000 females indicates that novaeangliae, Baker et al. 1994), minke (Balaenoptera acutorostrata,
the surface waters supporting transient feeding aggrega- van Pijlen et al. 1995), fin (Balaenoptera physalus, Bérubé et al.
tions (nearly all of the living Rhincodon typus observations) 1998), and Cuvier’s beaked (Ziphius cavirostris, Dalebout
are not the sole, or perhaps even principal, habitat of adult et al. 2005) whales all have pronounced inter-ocean sub-
whale sharks. Recent telemetry studies demonstrate that division and some population structure within ocean basins.
whale sharks occupy habitat far from shore and often in Barriers to movement within and between ocean basins
relatively deep, cold water for transient periods (Wilson generally appear to be stronger for most whales and large
et al. 2006). Although whale sharks are not known to possess pelagic fishes than for whale sharks. These comparisons
anatomical, physiological or behavioural adaptations to indicate that pelagic expanses can be barriers to highly
conserve heat, the large body mass of adults may provide mobile species, whereas the only apparent barriers to
sufficient thermal inertia to allow extended cold-water whale sharks may be geological and thermal (see below).
exposure (Sims 2003; Wilson et al. 2006). Regardless of the
extent of geographical and vertical population move-
Marine phylogeography
ments, it is clear that much of the habitat for this species
is still unknown, and population sizes may be considerably In recent years there has been renewed interest in the
larger than previously assumed. biogeographical barrier between the Indian and Pacific
oceans, enhanced by substantially lower sea levels during
glacial maxima. While this barrier is consistent with
Population structure
evolutionary separations in small marine invertebrates
Our genetic studies indicate that whale shark aggregations (Barber et al. 2000), it is a less substantial, albeit still
within ocean basins are substantially interconnected on an significant, population barrier to marine fishes and sharks
© 2007 The Authors
Journal compilation © 2007 Blackwell Publishing Ltd5190 A . L . F. C A S T R O E T A L .
(Chenoweth & Hughes 2003; Duncan et al. 2006; Keeney & Warm core gyres originating from the North Atlantic Gulf
Heist 2006; Craig et al. 2007). Whale shark dispersal ability Stream are thought to be responsible for sightings of whale
appears to be unimpeded by this intermittent barrier. It is sharks in cold temperate areas such as the Bay of Fundy
not clear why some species are affected more than others (44°15′N; Turnbull & Randell 2006). Regardless, historic or
by historical barriers across the Indo-Pacific region, ongoing gene flow is apparently limited as indicated by
although habitat preference is likely a dominant influence the significant global ΦST = 0.107.
(Rocha et al. 2002) and pelagic species may disperse more
effectively than reef-associated organisms. Over evolutionary
Conservation implications
time, whale shark migratory routes may be flexible enough
to accommodate newly submerged habitats or perhaps This first worldwide genetic survey of whale sharks
connectivity can be quickly re-established after glacial indicates significant population structure on a global scale.
intervals of tens of thousands of years. Management units for whale sharks may span over
The last tropical connection between the Atlantic and 8000 km in the Atlantic Ocean, and over 16 000 km in the
Indo-Pacific Oceans ended with the rise of the isthmus of Indian-Pacific Ocean. Any management plan for whale
Panama, about 3.5 million years ago (Coates & Obando 1996). sharks must consider that feeding aggregations may draw
In contemporary biogeography, the southern extensions individuals from an ocean-wide population to a single
of Africa and South America are regarded as formidable location. Unilateral management in any single political
impediments to tropical connectivity. Faunas of the Atlantic jurisdiction will be inadequate for a highly mobile species
and Indo-Pacific oceans share connections on a scale shorter that travels through multiple political jurisdictions. Indeed,
than 3.5 million years, however, indicating dispersal around tracking studies and our mtDNA data both indicate that
southern Africa (Bowen et al. 1998, 2001). Such exchanges management plans for the Earth’s largest fish will, at a mini-
are rare because of the cold Benguela Current along western mum, require ocean-basin-wide cooperation and governance.
South Africa (Gibbons & Thibault-Botha 2002), and might
occur on a scale of 105–106 years (Roberts et al. 2004; Rocha
Acknowledgements
et al. 2005; Bowen et al. 2006).
In a compilation of whale shark strandings and sightings We thank the major contributors to this study including the organiza-
in South Africa, Beckley et al. (1997) confirmed the occur- tions and persons who provided tissue samples (D. Abercrombie,
J. Brunnschweiler, R. Pittman, M. Shivji, T. Thys, J. Tyminski, S.
rence of whale sharks along the frigid Atlantic coast. To
Winter, Georgia Aquarium, and Mote Marine Laboratory) as well
explain the sporadic stranding in this area, they suggested as those that provided laboratory assistance and data analysis
that sharks arriving from the Indian Ocean succumb to the (A.L. Bass, C. Curtis, K. Hayes, C. Puchulutegui, and T. Schwartz).
cold upwelling water and quickly perish. In contrast, We also thank A. Martin, J. Zamzow, and three anonymous
Wilson et al. (2006) demonstrated that whale sharks can reviewers for helpful comments on the manuscript. Funding for
inhabit cold water, although perhaps not indefinitely. this project was provided in part by a CAPES Fellowship (BEX
Whale shark dives have recently been recorded to ~1400 m 1277-02/2) to A.L.F.C., an NSF grant DEB 03-21924 to S.A.K., a
Georgia Aquarium grant to R.E.H., and an NSF grant OCE-
(R.E. Hueter, J. Tyminski, C. Simpfendorfer, R. de la Parra,
0454873 to B.W.B., with additional funding provided by Hubbs-
M. Trigo Mendoza, unpublished. data). A deep, hour-long, Sea World Research Institute, the Hubbs Society, and Mote Marine
cold-water dive in the tropics can be offset with a return to Laboratory. This is SOEST contribution no. 7195, and HIMB
warm surface waters. In the Benguela upwelling system, contribution no. 1295.
however, cold water extends to the surface and no such
relief is possible. Nonetheless, the sharing of haplotypes
References
between Atlantic, Indian, and Pacific Ocean locations
indicates a relatively recent connection via southern Africa. Arnason U, Gullberg A, Janke A (2001) Molecular phylogenetics of
gnathostomous (jawed) fishes: old bones, new cartilage. Zoologica
Whale sharks could have moved between the Atlantic and
Scripta, 30, 249–255.
Indian oceans during a hiatus of Benguela upwelling that Baker CS, Slade RW, Bannister JL et al. (1994) Hierarchical structure
occurred between Pleistocene glacial epochs (Chang et al. of mitochondrial DNA gene flow among humpback whales
1999; Flores et al. 1999). Immediately following each ice age Megaptera novaeangliae, world-wide. Molecular Ecology, 3, 313–327.
(100 000 to 400 000 years ago, but most recently 10 000 to Barber PH, Palumbi SR, Erdmann MV, Moosa MK (2000) A
20 000 years ago), tropical plankton appears in sediment marine Wallace’s line? Nature, 406, 692–693.
cores off southwestern Africa, indicating an avenue of warm Beckley LE, Cliff G, Smale MJ, Compagno LJV (1997) Recent
strandings and sightings of whale sharks in South Africa.
water into the south Atlantic (Peeters et al. 2004). Contem-
Environmental Biology of Fishes, 50, 343–348.
porary movement is also possible. Warm-core gyres from Bentzen P, Wright JL, Bryden LT, Sargent M, Zwanenburg KCT
the Indian Ocean occasionally become entrained in the (1998) Tandem repeat polymorphism and heteroplasmy in the
northward moving Benguela Current, feeding into the mitochondrial control region of redfishes (Sebastes: Scorpaenidae).
central Atlantic Ocean (Flores et al. 1999; Penven et al. 2001). Journal of Heredity, 89, 1–7.
© 2007 The Authors
Journal compilation © 2007 Blackwell Publishing LtdG E N E T I C S T R U C T U R E O F W H A L E S H A R K S 5191 Bérubé M, Aguilar A, Dendanto D et al. (1998) Population genetic Cockerham CC, Weir BS (1993) Estimation of gene flow from F- structure of North Atlantic, Mediterranean Sea and Sea of Cortez statistics. Evolution, 47, 855–863. fin whales, Balaenoptera physalus (Linnaeus 1758): analysis of Colman JG (1997) A review of the biology and ecology of the mitochondrial and nuclear loci. Molecular Ecology, 7, 585–599. whale shark. Journal of Fish Biology, 51, 1219–1234. Bowen BW, Karl SA (2007) Population genetics and phylogeo- Compagno LJV (2001) Sharks of the World: An Annotated and Illus- graphy of sea turtles. Molecular Ecology, doi: 10.1111/j.1365- trated Catalogue of Shark Species Known to Date. Volume 2 Bullhead, 294X.2007.03542.X. Mackerel and Carpet Sharks (Heterodontiformes, Lamniformes and Bowen BW, Clark AM, Abreu-Grobois FA et al. (1998) Global Orectolobiformes). Food and Agriculture Organization of the United phylogeography of the ridley sea turtles (Lepidochelys spp.) as inferred Nations, species catalogue for fishery purposes, Rome, Italy. from mitochondrial DNA sequences. Genetica, 101, 179–189. Craig MT, Eble JA, Robertson DR, Bowen BW (2007) High genetic Bowen BW, Bass AL, Rocha LA, Grant WS, Robertson DR (2001) connectivity across the Indian and Pacific Oceans in the reef fish Phylogeography of the trumpetfishes (Aulostomus): ring species Myripristis berndti (Holocentridae). Marine Ecology Progress complex on a global scale. Evolution, 55, 1029–1039. Series, 334, 245–254. Bowen BW, Bass AL, Soares L, Toonen RJ (2005) Conservation Dalebout ML, Robertson KM, Frantzis A et al. (2005) Worldwide implications of complex population structure: lessons from the structure of mtDNA diversity among Cuvier’s beaked whales loggerhead turtle (Caretta caretta). Molecular Ecology, 14, 2389– (Ziphius cavirostris): implications for threatened populations. 2402. Molecular Ecology, 14, 3353–3371. Bowen BW, Muss A, Rocha LA, Grant WS (2006) Shallow mtDNA Delarbre C, Spruyt N, Delmarre C et al. (1998) The complete nucle- coalescence in Atlantic pygmy angelfishes (genus Centropyge) otide sequence of the mitochondrial DNA of the dogfish, indicates a recent invasion from the Indian Ocean. Journal of Scyliorhinus canicula. Genetics, 150, 331–344. Heredity, 97, 1–12. Duncan KM, Martin AP, Bowen BW, de Couet GH (2006) Global Bowen BW, Grant WS, Hillis-Starr Z et al. (2007) Mixed stock analysis phylogeography of the scalloped hammerhead shark (Sphyrna reveals the migrations of juvenile hawksbill turtles (Eretmochelys lewini). Molecular Ecology, 15, 2239–2251. imbricata) in the Caribbean Sea. Molecular Ecology, 16, 49–60. Eckert SA, Stewart BS (2001) Telemetry and satellite tracking of the Bradshaw CJA, Mollet HF, Meekan MG (2007) Inferring population whale shark, Rhincodon typus, in the Sea of Cortez, Mexico, and the trends for the world’s largest fish from mark-recapture estimates North Pacific Ocean. Environmental Biology of Fishes, 60, 299–308. of survival. Journal of Animal Ecology, 73, 480–489. Excoffier L, Smouse P, Quattro J (1992) Analysis of molecular Brown JR, Beckenbach K, Beckenbach AT, Smith MJ (1996) Length variance inferred from metric distances among DNA haplotypes: variation, heteroplasmy and sequence divergence in the mito- application to human mitochondrial DNA restriction data. chondrial DNA of four species of sturgeon (Acipenser). Genetics, Genetics, 131, 479–491. 142, 525–535. Excoffier L, Laval G, Schneider S (2005) arlequin ver. 3.0: an Brown MR, Corkeron PJ, Hale PT, Schultz KW, Bryden MM (1995) integrated software package for population genetics data analysis. Evidence for a sex-segregated migration in the humpback Evolutionary Bioinformatics Online, 1, 47–50. whale (Megaptera novaeangliae). Proceedings of the Royal Society B: Flores J-A, Gersonde R, Sierro FJ (1999) Pleistocene fluctuations in Biological Sciences, 259, 229–234. the Agulhas Current Retroflection based on the calcareous Buonaccorsi VP, McDowell JR, Graves JE (2001) Reconciling patterns plankton record. Marine Micropaleontology, 37, 1–22. of inter-ocean molecular variance from four classes of molecular Gibbons MJ, Thibault-Botha D (2002) The match between ocean markers in blue marlin (Makaira nigricans). Molecular Ecology, 10, circulation and zoogeography of epipelagic siphonophores 1179–1196. around southern Africa. Journal of the Marine Biological Association Cao Y, Waddell PJ, Okada N, Hasengawa M (1998) The complete of the UK, 82, 801–810. mitochondrial DNA sequence of the shark Mustelus manazo: Graves JE, McDowell JR (2003) Stock structure of the world’s evaluating rooting contradictions to living bony vertebrates. istiophorid billfishes: a genetic perspective. Marine and Freshwater Molecular Biology and Evolution, 15, 1637–1646. Research, 54, 287–298. Carlsson J, McDowell JR, Carlsson JEL, Graves JE (2007) Genetic Harpending RC (1994) Signature of ancient population growth in identity of YOY bluefin tuna from the eastern and western a low-resolution mitochondrial DNA mismatch distribution. Atlantic spawning areas. Journal of Heredity, 98, 23–28. Human Biology, 66, 591–600. Chang Y-P, Chang C-C, Wang L-W, Chen M-T, Wang C-H, Yu E-F Heist EJ (1999) A review of population genetics in sharks. American (1999) Planktonic foraminiferal sea surface temperature variation Fishery Society Symposium, 23, 161–168. in the Southeast Atlantic Ocean: a high-resolution record Heist EJ (2004) Genetics of sharks, skates and rays. In: Biology of MD962085 of the past 400 000 years from the IMAGES II — NAU- Sharks and Their Relatives (eds Carrier JC, Musick JA, Heithaus SICAA cruise. Terrestrial, Atmospheric and Oceanic Sciences, 10, MR), pp. 471–485. CRC Press, Boca Raton, Florida. 185–200. Hoarau G, Holla S, Lescasse R, Stam WT, Olsen JL (2002) Hetero- Chenoweth SF, Hughes JM (2003) Oceanic interchange and plasmy and evidence for recombination in the mitochondrial nonequilibrium population structure in the estuarine dependent control region of the flatfish Platichthys flesus. Molecular Biology Indo-Pacific tasselfish Polynemus sheridani. Molecular Ecology, 12, and Evolution, 19, 2261–2264. 2387–2397. Hoelzel AR, Shiviyi MS, Magnussen J, Francis MP (2006) Low Clement M, Posada D, Crandall KA (2000) tcs: a computer pro- worldwide genetic diversity in the basking shark. Biology Letters, gram to estimate gene genealogies. Molecular Ecology, 9, 1657–1660. 2, 630–642. Coates AG, Obando JA (1996) The geologic evolution of the Keeney DB, Heist EJ (2006) Worldwide phylogeography of the Central American isthmus. In: Evolution and Environment in blacktip shark (Carcharhinus limbatus) inferred from mitochon- Tropical America (eds Jackson J, Budd AF, Coates AG), pp. 21–56. drial DNA reveals isolation of West Atlantic populations coupled University of Chicago Press, Chicago, Illinois. with recent Pacific dispersal. Molecular Ecology, 15, 3669–3679. © 2007 The Authors Journal compilation © 2007 Blackwell Publishing Ltd
5192 A . L . F. C A S T R O E T A L .

Keeney DB, Heupel MR, Hueter RE, Heist EJ (2005) Microsatellite           Slatkin M, Hudson RH (1991) Pairwise comparisons of mitochon-
  and mitochondrial DNA analyses of the genetic structure of                drial DNA sequences in stable and exponentially growing
  blacktip shark (Carcharhinus limbatus) nurseries in the north-            populations. Genetics, 129, 555–562.
  western Atlantic, Gulf of Mexico, and Caribbean Sea. Molecular          Stewart BS, Wilson SG (2005) Threatened fishes of the world:
  Ecology, 14, 1911–1923.                                                   Rhincodon typus (Smith 1828) (Rhincodontidae). Environmental
Kitamura T, Takemura A, Watabe S, Taniuchi T, Shimizu M (1996)              Biology of Fishes, 74, 184–185.
  Mitochondrial DNA analysis for the cytochrome b gene and                Stoner DS, Grady JM, Priede KA, Quattro JM (2003) Amplification
  D-loop from the bull shark Carcharhinus leucas. Fisheries Science,        primers for the mitochondrial control region and sixth intron of
  62, 21–27.                                                                the nuclear-encoded lactate dehydrogenase A gene in elasmo-
Lee WJ, Conroy J, Howell WH, Kocher TD (1995) Structure and                 branch fishes. Conservation Genetics, 4, 805–808.
  evolution of teleost mitochondrial control region. Journal of           Tamura K, Nei M (1993) Estimation of the number of nucleotide
  Molecular Evolution, 41, 54–66.                                           substitutions in the control region of the mitochondrial DNA in
Martin AP, Naylor GJP, Palumbi SR (1992) Rates of mitochondrial             humans and chimpanzees. Molecular Biology and Evolution, 10,
  DNA evolution in sharks are slow compared with mammals.                   512–526.
  Nature, 357, 153–155.                                                   Theberge MM, Dearden P (2006) Detecting a decline in whale
Nei M (1987) Molecular Evolutionary Genetics. Columbia University           shark Rhincodon typus sightings in the Andaman Sea, Thailand,
  Press, New York.                                                          using ecotourist operator-collected data. Oryx, 40, 337–342.
Pardini AT, Jones CS, Noble LR et al. (2001) Sex-biased dispersal of      Turnbull SD, Randell JE (2006) Rare occurrence of a Rhincodon
  great white sharks. Nature, 412, 139–140.                                 typus (whale shark) in the Bay of Fundy Canada. Northeastern
Peeters JC, Acheson R, Brummer G-JA et al. (2004) Vigorous                  Naturalist, 13, 57–58.
  exchange between the Indian and Atlantic Oceans at the end of           Walsh HE, Metzger DA, Higuchi R (1991) Chelix medium for simple
  the past five glacial periods. Nature, 430, 661–665.                      extraction of DNA for PCR-based typing from forensic material.
Penven P, Lutjeharms JRE, Marchesiello P, Roy C, Weeks SJ (2001)            Biology Techniques, 10, 506–513.
  Generation of cyclonic eddies by the Agulhas Current in the lee of      Wilson SG, Polovina JJ, Stewart BS, Meekan MG (2006) Movement
  the Agulhas Bank. Geophysical Research Letters, 28, 1055–1058.            of whale sharks (Rhincodon typus) tagged at Ningaloo Reef,
van Pijlen IA, Amos B, Burke T (1995) Patterns of genetic variability       Western Australia. Marine Biology, 148, 1157–1166.
  at individual mini-satellite loci in minke whale Balaenoptera           Wintner SP (2000) Preliminary study of vertebral growth rings in
  acutorostrata populations from three different oceans. Molecular          the whale shark, Rhincodon typus, from the east coast of South
  Biology and Evolution, 12, 459–472.                                       Africa. Environmental Biology of Fishes, 59, 441–451.
Posada D, Crandall KA (1998) modeltest: testing the model of
  DNA substitution. Bioinformatics, 14, 817–818.
Ramírez-Macías D, Vázquez-Juárez R, Galván-Magaña F,                      A. L. F. Castro is a Ph.D. student in the Biology Department of
  Munguía-Vega A (2007) Variations of the mitochondrial control           the University of South Florida. This study represents a portion of
  region sequence in whale sharks (Rhincodon typus) from the Gulf         his doctoral research on phylogeography of elasmobranches. B.
  of California, Mexico. Fisheries Research, 84, 87–95.                   S. Stewart studies population biology, foraging and physiological
Rasmussen AS, Arnason U (1999) Phylogenetic studies of complete           ecology, and behaviour of a variety of marine mammals, sea birds,
  mitochondrial DNA molecules place cartilaginous fishes within           sea turtles, and sharks R. E. Hueter is director of Mote Marine
  the tree of bony fishes. Journal of Molecular Evolution, 48, 118–123.   Laboratory’s Centre for Shark Research where he conducts research
Raymond M, Rousset F (1995) An exact test for population differ-          on anatomy, physiology, behavior, ecology and conservation of
  entiation. Evolution, 49, 1280–1283.                                    sharks. P. Motta is interested in the functional morphology and
Roberts MA, Schwartz TS, Karl SA (2004) Global population                 evolution of feeding in sharks and bony fishes. B. W. Bowen and
  genetic structure and male mediated gene flow in the green sea          S. A. Karl are researches at the Hawaii Institute of Marine Biology,
  turtle (Chelonia mydas): analysis of microsatellite loci. Genetics,     a premier marine molecular genetics facility sitting atop a coral
  166, 1857–1970.                                                         reef in Kaneohe Bay, Hawaii.
Rocha LA, Bass AL, Robertson DR, Bowen BW (2002) Adult habitat
  preferences, larval dispersal, and the comparative phylogeo-
  graphy of three Atlantic surgeonfishes (Teleostei: Acanthuridae).
  Molecular Ecology, 11, 243–252.                                         Supplementary material
Rocha LA, Robertson DR, Rocha CR et al. (2005) Recent invasion of
  the tropical Atlantic by an Indo-Pacific coral reef fish. Molecular     The following supplementary material is available for this article:
  Ecology, 14, 3921–3928.
                                                                          Figure S1 This figure shows the presence and absence of repeat
Rogers AR, Harpending H (1992) Population growth makes
                                                                          units for each haplotype.
  waves in the distribution of pairwise genetic differences.
  Molecular Biology and Evolution, 9, 552–569.                            This material is available as part of the online article from:
Roman J, Palumbi SR (2003) Whales before whaling in the North             http://www.blackwell-synergy.com/doi/abs/
  Atlantic. Science, 301, 508–510.                                        10.1111/j.1365-294X.2007.03597.x
Sambrook J, Fritsch EF, Maniatis T (1989) Molecular Cloning: A            (This link will take you to the article abstract).
  Laboratory Manual, 2nd edn. Cold Spring Harbor Laboratory
  Press, New York.                                                        Please note: Blackwell Publishing are not responsible for the
Sims DW (2003) Tractable models of testing theories about natural         content or functionality of any supplementary materials supplied
  strategies: foraging behaviour and habitat selection of free-           by the authors. Any queries (other than missing material) should
  raging sharks. Journal of Fish Biology, 63 (Suppl. A), 53–73.           be directed to the corresponding author for the article.

                                                                                                                       © 2007 The Authors
                                                                                       Journal compilation © 2007 Blackwell Publishing Ltd
Figure S1: This figure shows the presence and absence of repeat units
for each haplotype. Each row is a haplotype and each column is a repeat
unit. The presence of any particular repeat is indicated by a black
box. For example, all haplotypes have repeat units A1, B1, C1 and D1
and haplotypes 11, 12 and 40 are the only haplotypes to have repeat
units E1 and F1.
Repeat Unit
Haplotype A1 B1 C1 D1 E1 F1 E2 G1 F2 H1 I1 A2 B2 C2 D2 E3 G2 F3 H2 I2 J1 K1 J2 K2 J3
1
2
3
4
5
6
7
8
9
10
11
12
13
14
15
16
17
18
19
20
21
22
23
24
25
26
27
28
29
30
31
32
33
34
35
36
37
38
39
40
41
42
43
44You can also read