First Insight of Meso- and Bentho-Pelagic Fish Dynamics Around Remote Seamounts in the South Atlantic Ocean
←
→
Page content transcription
If your browser does not render page correctly, please read the page content below
ORIGINAL RESEARCH
                                                                                                                                              published: 17 June 2021
                                                                                                                                     doi: 10.3389/fmars.2021.663278

                                            First Insight of Meso- and
                                            Bentho-Pelagic Fish Dynamics
                                            Around Remote Seamounts in the
                                            South Atlantic Ocean
                                            Fabio Campanella 1* , Martin A. Collins 2 , Emma F. Young 2 , Vladimir Laptikhovsky 1 ,
                                            Paul Whomersley 1 and Jeroen van der Kooij 1
                                            1
                                             Centre for Environment, Fisheries and Aquaculture Science, Lowestoft, United Kingdom, 2 British Antarctic Survey,
                                            High Cross, Cambridge, United Kingdom

                                            Seamounts have long been recognised as hotspots for pelagic productivity and diversity
                                            in the world’s open ocean habitats. Recent studies have suggested that productivity may
                                            vary greatly between different seamounts, depending on complex interactions between
                                            the bathymetric features and local oceanography. These processes may enhance local
                                            primary production which support elevated biomass at higher trophic levels. In addition
                                            to enhancing local biomass, seamounts may also act as aggregative features, attracting
                           Edited by:       pelagic species from the surrounding waters. Such characteristics make seamounts
                Rochelle Diane Seitz,
     William & Mary’s Virginia Institute
                                            attractive targets for fisheries. However, as these unique habitats are localised and
     of Marine Science, United States       relatively small, they are vulnerable to overexploitation, which may have detrimental
                      Reviewed by:          impact on the wider region. Mapping and quantitative assessments of the fish biomass
                     Réka Domokos,
                                            at different seamounts are crucial prerequisites to identifying vulnerable seamounts and
  National Oceanic and Atmospheric
Administration (NOAA), United States        will aid toward understanding the dynamics of these important ecosystems and their
                  Andrew M. Fischer,        vulnerability to fishing pressures. We used fisheries acoustics during two expeditions in
    University of Tasmania, Australia
                                            2018 and 2019, to investigate the distribution and abundance of fish and micronekton
                *Correspondence:
                  Fabio Campanella
                                            on and around five little studied seamounts of Tristan da Cunha, a remote archipelago
       fabio.campanella@cefas.co.uk         in the South Atlantic Ocean. The results confirmed increased productivity at the
                                            seamounts, compared to the surrounding open ocean with higher acoustic backscatter
                   Specialty section:
         This article was submitted to      values, a proxy for biomass, particularly at the shallower (˜200 m depth) seamounts.
                  Marine Conservation       Fish largely dominated the backscatter on most of the seamounts especially over the
                     and Sustainability,
                                            plateau areas where large densities of prey fish, primarily the mesopelagic Maurolicus
               a section of the journal
          Frontiers in Marine Science       inventionis, were detected. Very large aggregations, thought to consist of bentho-
        Received: 02 February 2021          pelagic fish, were also observed over the slope of McNish Seamount that resulted in
           Accepted: 18 May 2021            very high biomass estimates. Aggregations of this size and magnitude, have, to our
          Published: 17 June 2021
                                            knowledge, never been mapped or quantified on seamounts, using acoustic methods.
                              Citation:
            Campanella F, Collins MA,       Specific physical processes, such as enhanced retention and vertical mixing that were
             Young EF, Laptikhovsky V,      identified by an oceanographic model, may be some of the drivers of the enhanced
   Whomersley P and van der Kooij J
                                            fish biomass detected at McNish. The characteristics of the seamounts observed in this
          (2021) First Insight of Meso-
   and Bentho-Pelagic Fish Dynamics         work suggest that these habitats are highly suitable for the presence of large predatory
          Around Remote Seamounts           fish that can utilise these areas as their primary habitat or as important foraging grounds.
          in the South Atlantic Ocean.
            Front. Mar. Sci. 8:663278.      Keywords: seamount, Tristan da Cunha, Maurolicus, bentho-pelagic fishes, Blue Belt, fisheries acoustics, UK
    doi: 10.3389/fmars.2021.663278          Overseas Territories, oceanographic modelling

Frontiers in Marine Science | www.frontiersin.org                                 1                                             June 2021 | Volume 8 | Article 663278
Campanella et al.                                                                                       Seamount Fish Dynamics in the South Atlantic

INTRODUCTION                                                               crucial prerequisite to understanding the dynamics of these
                                                                           important ecosystems, identifying their vulnerability to fishing
Seamounts are topographically distinct features that rise from             pressures and their role in the wider ocean systems. Despite
the seafloor with most being of volcanic origin that are widely            the increasing number of works focused on seamounts, few
distributed in all ocean basins. The number of seamounts that              seamounts have been studied in detail. Most remain unexplored
have an elevation of more than 1,000 m above the seafloor                  primarily due to the remoteness of these areas. It is crucial to
was estimated to be between 10,000 and 100,000, a number                   describe and characterise the processes that occur on the un-
that increases considerably if the smaller features are included           studied seamounts to better understand and identify the large
(Kitchingman et al., 2007).                                                variability of these habitats.
    Seamounts often support unique ecosystems and have been                    One of the main objectives of the UK Government funded
recognised as hotspots for pelagic productivity and diversity              Blue Belt programme is to provide a better understanding of
in many areas of the world (Morato et al., 2010a). Enhanced                these environments and develop efficient marine protection
fish densities at seamounts include small mesopelagic fish (e.g.,          strategies in the UK Overseas Territories. Tristan da Cunha,
pearlside—Maurolicus sp.) (Kalinowski and Linkowski, 1983;                 a remote archipelago that consists of four islands located in
Parin and Kobylianski, 1996), bentho-pelagic species (orange               the Southern Atlantic, was one of the main areas of interest
roughy—Hoplostethus atlanticus, alfonsino—Beryx splendens,                 to this programme. The EEZ (Exclusive Economic Zone) of
rockfish—Sebastes sp.) (Koslow, 1996; Koslow et al., 2000),                Tristan da Cunha includes several seamounts with very different
elasmobranchs and large pelagic predators (Morato et al., 2008,            topographic characteristics that, to date, have not been studied
2010b). The seamounts can act as primary habitat for resident              in detail. These seamounts are exploited by fisheries, primarily
fish populations or as foraging grounds for other species that will        targeting bluenose warehou (Hyperoglyphe antarctica) and, to
spend only a limited amount of time of their life cycles associated        a lesser extent, bluefin tuna (Thunnus maccoyii). Even though
with the seamount (Morato and Clark, 2007). It has also been               fishing effort has been relatively low, very high catch rates
hypothesised that certain highly migratory species such as tuna            (catch per unit effort, CPUE) have been recorded, suggesting the
can use the seamounts as navigational aids in large movement               presence of enhanced fish biomass (Bell et al., 2021). In 2020,
patterns (Holland et al., 1999; Klimley et al., 2003; Holland and          the environmental and ecological importance of this area was
Grubbs, 2007).                                                             recognised by the designation of the entire Tristan da Cunha
    The increased productivity around seamounts is likely the              EEZ as Marine Protected Area (MPA). Covering an area of
result of multiple factors. Firstly, the coupling of topographic           ∼700,000 km2 , this represents the largest MPA in the Atlantic
characteristics of the seafloor with local hydrodynamics enhances          Ocean and fourth largest in the world. The results of the work
local primary productivity: the interaction generates physical             conducted under the Blue Belt programme helped underpin the
features such as eddies, isopycnal doming, Taylor column/cone,             designation of the MPA, and will serve as a baseline that will help
and internal waves, creating a unique environment, different               the evaluation and monitoring of the effectiveness of the MPA
from the surrounding open ocean (Owens and Hogg, 1980).                    in the long term.
These processes can produce biological responses, for instance                 In this study we used fisheries acoustic methods and pelagic
by increasing vertical fluxes of nutrient-rich waters, enhancing           trawl sampling to investigate the distribution, (relative) biomass
primary productivity, facilitating the retention of nutrients and          and diversity of fish and micronekton on and around five
planktonic organisms over the seamount with a direct positive              seamounts located in the south of Tristan da Cunha’s EEZ
effect on the higher trophic levels such as fish (Comeau et al.,           during two expeditions (in 2018 and 2019) conducted under the
1995; Goldner and Chapman, 1997; Mohn and Beckmann,                        Blue Belt programme. The main objectives of this study were
2002; Genin, 2004; White et al., 2007). These processes are                to (i) investigate whether the seamounts in Tristan da Cunha
characterised by high spatial and temporal variability, dependent          support enhanced productivity compared to the surrounding
on the specific topographic characteristics of the seamounts.              open ocean, (ii) identify any differences in micronekton and
Secondly, in other cases, high plankton and fish biomass detected          fish distribution between the surveyed seamounts, (iii) provide
at the seamounts does not correspond to an increase in the                 estimates of fish biomass where possible, and (iv) investigate
local primary production (Genin, 2004; Genin and Dower, 2007).             the physical and biological processes that drive any differences
The enhanced secondary production may have an allochthonous                between seamounts.
origin, instead. For example, the seamount seafloor can act as a
trap for vertically migrating plankton and micronekton advected
from the surrounding waters that are unable to complete their              MATERIALS AND METHODS
descent to deeper waters during the day making them more
visible and vulnerable to fish predation (Genin et al., 1988, Genin,       Study Area
2004; Fock et al., 2002).                                                  Tristan da Cunha is a remote archipelago that consists of four
    The presence of high densities of fish in these ecosystems             islands (Tristan da Cunha, Gough Island, Inaccessible Island,
makes them attractive targets to fisheries. Moreover, as these             Nightingale Island) located between 37◦ and 41◦ S (9–13◦ W) in
unique habitats are highly localised and relatively small, they            the South Atlantic and positioned 2,816 km from the nearest
are vulnerable to overexploitation. Mapping and quantitatively             land (South Africa) and 3,360 km from South America. Five
assessing the (relative) biomass at seamounts is therefore a               seamounts located within the Tristan da Cunha EEZ were

Frontiers in Marine Science | www.frontiersin.org                      2                                       June 2021 | Volume 8 | Article 663278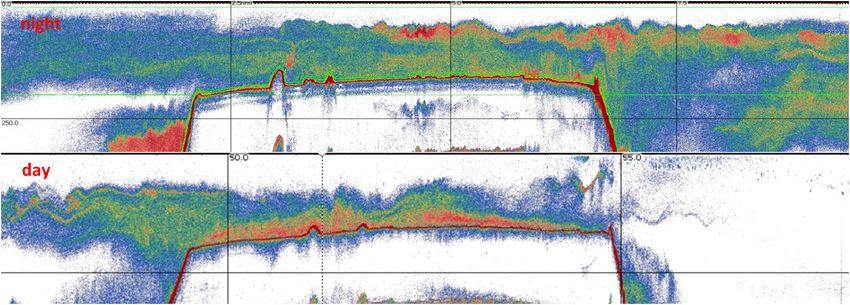
Campanella et al.                                                                                       Seamount Fish Dynamics in the South Atlantic

surveyed during two expeditions, one conducted on the RRS                 were cleaned and processed using the software Echoview v10. The
James Clark Ross (2018) and the second on RRS Discovery                   first step involved editing the bottom line and removing noise and
(2019): Crawford and Yakhont in 2018 and RSA, McNish and                  unwanted targets. The area immediately below the transducers
an un-named seamount in 2019 (Figure 1). Crawford is made                 (∼10 m below) was excluded from the analysis because it was
up of a pair of seamounts (Esk Guyot and Crawford Seamount)               affected by the near-field effect and surface noise (e.g., surface
situated in the centre of the Tristan da Cunha EEZ, between the           bubbles). Background noise, pulse noise and attenuated signals
northern islands and Gough. The shallowest points of Esk and              were removed using a series of tools integrated in the Echoview
Crawford are at approximately 250 and 380 m deep, respectively.           software. To reduce the stochastic variability, the data were
Only two small areas of the Crawford complex (east and west               resampled from the original horizontal (10–20 m depending
ends), both characterised by plateaus of about 15 km in diameter,         on vessel speed) and vertical (0.2 m) sampling resolution to
were surveyed in March 2018. McNish is a small dome-shaped                a lower resolution (20 m H × 2 m V cell) before further
seamount, located 116 km east of Gough Island, which rises to             processing steps were applied. The Nautical Area Backscattering
less than 90 m below the sea surface at its shallowest point.             Coefficient (NASC), was exported from the “clean” echograms
The plateau is 15 km across in a north-south direction and                and used for further analyses. While NASC is often converted
12 km across east-west. RSA Seamount, in the far south-east,              to a measure of biomass, the required details on the species
is the largest feature in the Tristan da Cunha EEZ at almost              composition, size and on the acoustic target strengths (see next
111 km long. Owing largely to its size, this feature remains poorly       section) were not available for the broader geographic area.
mapped, but the plateau is thought to be mostly at 300–350 m              Therefore, NASC, also referred to as backscatter, was considered
deep with a shallow region with depth
Campanella et al.                                                                                                         Seamount Fish Dynamics in the South Atlantic

  FIGURE 1 | Overview of study area (left), with detailed maps of the seamounts (right), including acoustic transects and net trawls (see legend), conducted during the
  2018 (Yakhont and Crawford seamounts) and 2019 expeditions (McNish, RSA and un-named seamounts, open ocean transect).

Whomersley et al., 2019). Given the differences in backscatter                         area was dominated by pearlside (Maurolicus inventionis) a small
observed between the shallow and deep seamounts, the modelling                         swimbladdered fish of the Sternoptychidae family (Kalinowski
dataset was split into two parts based on the average depth of                         and Linkowski, 1983). Therefore, biomass of pearlside was
the seamounts and two separate models were created: one for the                        estimated based on a Target Strength/Length relationship for a
shallow seamounts (RSA, McNish, Crawford-west, Yakhont) and                            similar species of the same genus, Maurolicus muelleri (Sobradillo
one for the deeper seamounts (Un-named, Crawford-East). The                            et al., 2019). Bluenose warehou (Hyperoglyphe antarctica), was
GAM analysis was conducted using the “mgcv” library in the R                           selected as the likely species dominating a bentho-pelagic
statistical software (Wood, 2006).                                                     aggregation observed. It was one of the main targets of local
                                                                                       commercial fisheries and was the focus of recent research
Fish Biomass Estimation                                                                conducted in the area (Laptikhovsky et al., 2020; Bell et al.,
At two seamounts, McNish and RSA, an attempt was made                                  2021). Since no TS-length equation was published for bluenose
to convert acoustic backscatter (NASC) to biomass. These                               and little was known about its morphology, specifically the
two seamounts were selected, because of their considerable                             presence and type of swimbladder, we calculated two different
importance to commercial fisheries, the high backscatter                               biomass estimates based on two separate TS/length equations:
encountered, and better coverage achieved during the survey.                           a generalised equation for fish with physoclist swimbladders
A multifrequency analysis (Ballón et al., 2011) confirmed that                         (Foote, 1987) and a TS-length equation derived for orange
the aggregations identified consisted of fish with a swimbladder.                      roughy (Hoplostethus atlanticus) (McClatchie et al., 1999), a deep-
However, the analysis was limited to the top 200 m of the                              sea species with a regressed swimbladder invested with wax esters
water column because of the limited observation range of the                           (Phleger and Grigor, 1990) that might be similar to bluenose
higher frequencies (due to sound absorption). The conversion of                        swimbladder. A study on stromatoed fish anatomy, which
acoustic backscatter to biomass, requires a species-specific target                    included bluenose, indicated that a swimbladder is present in
strength (TS) length equation. No in situ Target Strength could be                     the juvenile stage but that it can regress in the adulthood (Horn,
obtained during the survey, due to the density of the aggregations.                    1975). Further details of parameters used in the calculations are
Previous studies suggested the mesopelagic community in the                            provided in Table 1.

Frontiers in Marine Science | www.frontiersin.org                                  4                                              June 2021 | Volume 8 | Article 663278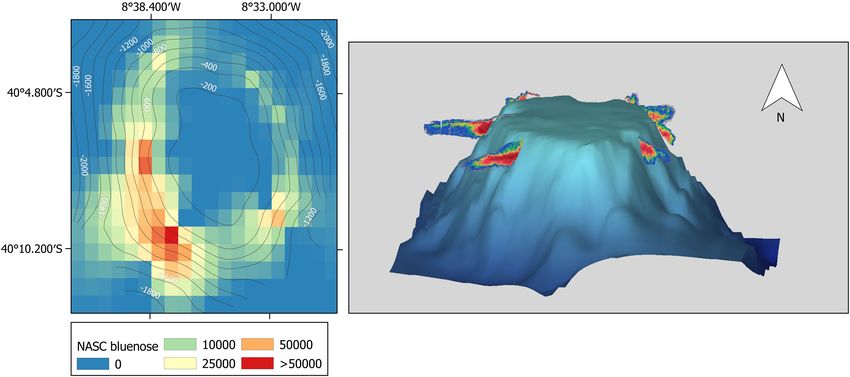
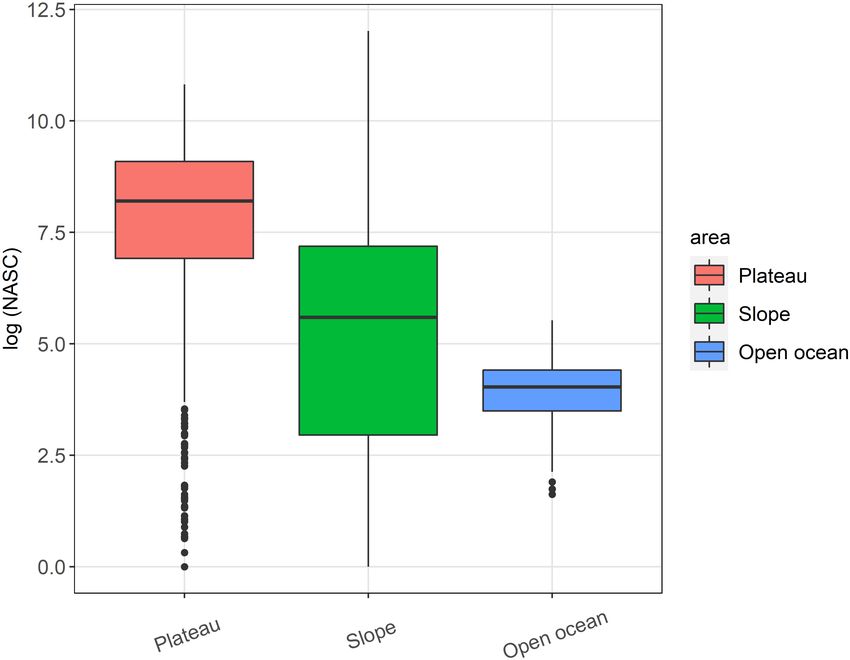
Campanella et al.                                                                                                     Seamount Fish Dynamics in the South Atlantic

  FIGURE 2 | Boxplot of the log-transformed Nautical Area Backscattering Coefficient (NASC) calculated over the plateau and slope of the seamounts and at the open
  ocean area. Lower and the upper hinges correspond to the first and third quartiles. Dots at the end of the boxplot represent outliers.

Net Sampling                                                                         being preserved. Due to the absence of motion compensated
The species composition of the micronekton community                                 scales during the 2018 cruise, total catch and species composition
was investigated (qualitatively) using an 8 m2 Rectangular                           were recorded in volume rather than weight. While the ability
Midwater Trawl (RMT8, during the 2018 expedition) and a                              of different species (and life stages) to avoid the trawl varies and
25 m2 rectangular midwater trawl (RMT25, during the 2019                             will have affected catch composition, conducting the trawls at
expedition). Both systems consisted of two nets that are opened                      night was thought to have reduced this effect (Collins et al., 2008,
and closed remotely from the ship to sample discrete depth layers                    2012) and, in the absence of detailed knowledge of the avoidance
(Roe and Shale, 1979; Piatkowski et al., 1994), with a nominal                       behaviour, we assumed the catch composition was representative
mouth opening of 8 and 25 m2 , respectively, and with a cod-                         of the acoustically observed micronekton. We point out that
end mesh of 5 mm. The nets were monitored and controlled                             the catch composition was only used to provide qualitative
in real-time using a custom-built net monitoring system which                        information about the species composition of the acoustically
also logged depth. All nets were deployed at night to minimise                       observed backscatter.
potential avoidance by the mobile micronekton, in particular
fish, and to take advantage of the shallower distribution of the                     Hydrodynamic Modelling
vertically migrating organisms that, at night, are generally more                    The hydrographic characteristics of two seamounts, McNish
concentrated in surface layers. Tows were undertaken to (i)                          and RSA, were investigated to enable a qualitative comparison
target acoustically detected aggregations and (ii) sample discrete                   between the physical processes and the biological characteristics
depth layers, typically 0–200 and 200–400, although some                             observed over these two topographically different seamounts.
deeper deployments were undertaken with the RMT25 in 2019                            A high-resolution oceanographic model of the Tristan da Cunha
(Supplementary Table 3) to characterise oceanic and seamount                         region provided the physical context. The regional ocean model
micro-nekton communities. Nets were towed obliquely at 2.5–                          is an implementation of the Nucleus for European Modelling
3 knots for 30–60 min in each depth horizon, with a protected                        of the Ocean (NEMO) modelling framework (Young et al., in
cod-end fitted to keep captured animals in good condition. Once                      prep). The model domain extended from 24 to 0◦ W, and from
back onboard, the catches from each cod-end were collected in                        45 to 31◦ S, with a horizontal resolution of 1/30◦ longitude by
separate buckets to ensure catches from the different depth bands                    1/40◦ latitude (∼2.75 km), and with 75 levels in the vertical
remained separate. The catches were then sorted and individuals                      arranged on a partial-step z-coordinate. This configuration
identified to the lowest taxonomic level possible, enumerated,                       allowed good representation of the complex regional bathymetry
measured (only fish species), weighed and photographed before                        whilst capturing large-scale features of the wider oceanic

Frontiers in Marine Science | www.frontiersin.org                                5                                            June 2021 | Volume 8 | Article 663278
Campanella et al. Seamount Fish Dynamics in the South Atlantic
circulation. Surface atmospheric forcing was derived from the
Total biomass
Total biomass
DFS5.2 reanalysis (Dussin et al., 2016). At the open boundaries,
3,307,159
(tonnes)
(tonnes)
548,851
29,469
483.4
5,307
6,046
tides were imposed using the Oregon State University global
ocean tide model, TPXO7.2 (Egbert and Erofeeva, 2002). Three-
TABLE 1 | Details of the acoustic-based density and biomass estimates for pearlside at RSA and McNish and for the bluenose warehou aggregation at McNish, including parameters used in the equations.
dimensional temperature and salinity, barotropic flux and sea
surface height at the open boundaries were derived from a
global 1/12◦ implementation of NEMO, provided by the National
Total area
Total area
Oceanography Centre, Southampton, United Kingdom. The
(km2)
(km2 )
375
409
351
116
116
56 oceanographic model has been verified by comparing outputs
with a combination of historic in situ (conductivity, temperature,
Length values for pearlsides were obtained from the net samples and for bluenose warehou from fisheries observer data collected at McNish in March–April 2018 (Bell et al., 2021).
depth) and satellite-derived (sea surface temperature) data
and was found to provide good representation of observed
(kg/m2)
Density
Density
(g/m2 )
28.51
oceanographic properties in the region (Young et al., in prep).
78.6
17.2
4.73
1.2
95
The model was used as an explanatory tool to explore potential
physical mechanisms that could provide the underlying physical
conditions for enhanced productivity at seamounts in the region.
(fish/m2)
(fish/m2 )
Analyses were concentrated on two seamounts with the most
Density
Density
154.7
127.4
23.07
2.3
0.5
3
comprehensive survey coverage: McNish and RSA. Existing
model outputs for the period 2000–2009 were analysed, focussing
on model outputs for the Austral autumn 2006, when the ATL3
index for Atlantic Niño was comparable to that during the 2019
11,024
11,694
18,424
18,424
NASC
NASC
Mean
Mean
165.4
2,117
expedition to McNish and RSA seamounts. Although model
outputs were not available for the period of the observations, the
time period chosen had the same large-scale forcing conditions
as the observational period, and results are interpreted in this
context. Mean horizontal and vertical velocities for 2000–2009 at
TS (dB)
TS (dB)
−57.84
−57.84
−56.73
−30.71
−38.51
56.73
10 and 200 m depth were calculated to visualise the dominant
circulation patterns around McNish and RSA seamounts. To
examine the oceanography at McNish seamount in more detail,
−77.0 (McClatchie et al., 1999)
cross-sections of 5-day mean oceanographic properties (potential
−69.2 (Sobradillo et al., 2019)
−69.2 (Sobradillo et al., 2019)
−69.2 (Sobradillo et al., 2019)
−69.2 (Sobradillo et al., 2019)
temperature, salinity, density, horizontal and vertical velocities)
were extracted along 40◦ 8"S, and 8◦ 36"W.
−67.5 (Foote, 1987)
The possible effect of the circulation on local retention of biota
at McNish Seamount was investigated using Lagrangian particle
tracking. Passive particles were released every 5 days for 1 year
Hyperoglyphe antarctica (bluenose warehou)
(2000) at all model grid cells with depth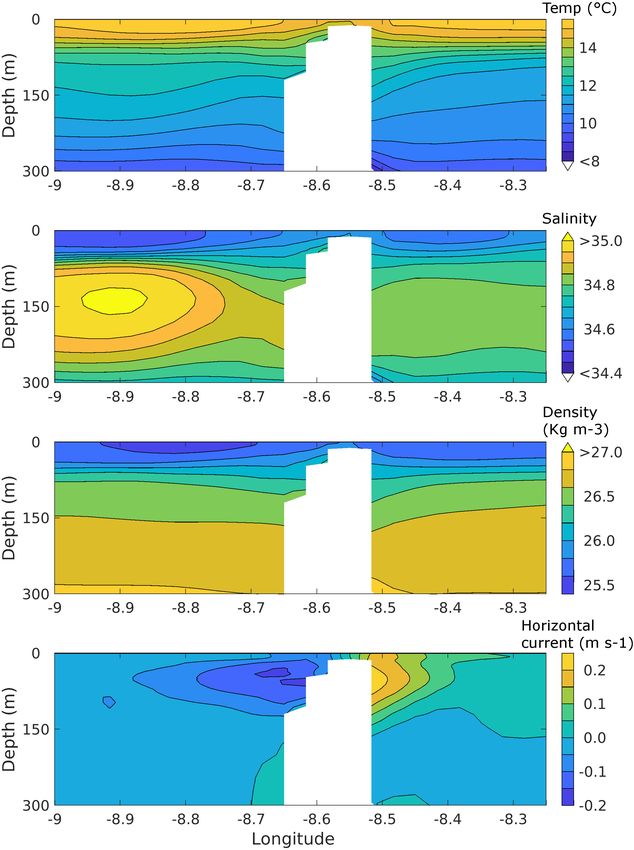
Campanella et al. Seamount Fish Dynamics in the South Atlantic
FIGURE 3 | Maps of the Nautical Area Backscattering Coefficient (NASC) at 70 kHz for all the Tristan da Cunha seamounts. An example echogram (Sv, volume
backscattering strength) representing one full transect of the corresponding seamount, is shown at the bottom of each panel. The vertical and horizontal black lines
on the echograms are 2.5 nautical miles and 250 m spaced, respectively.
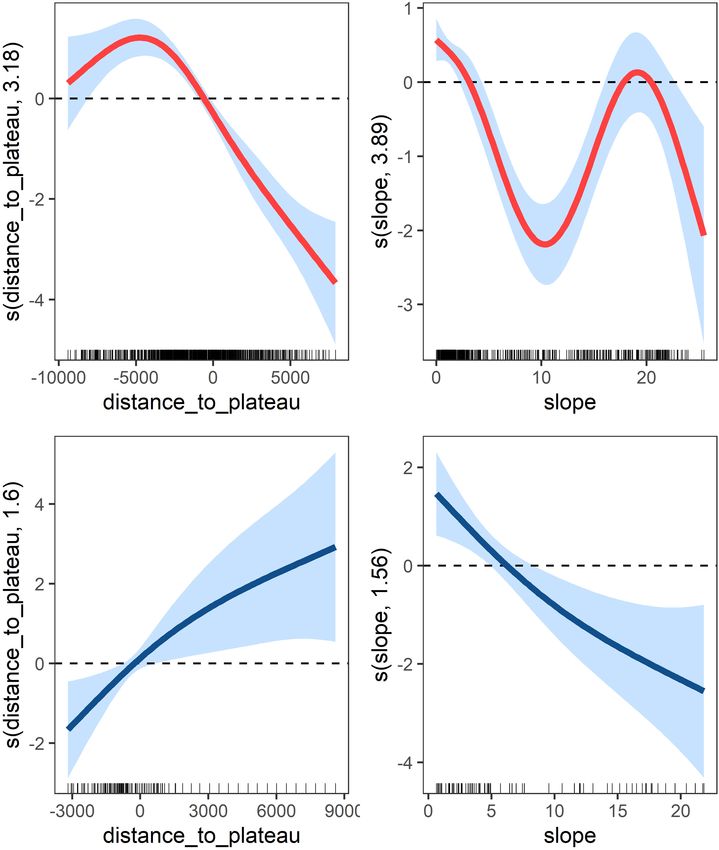
compared to the open ocean area (Figure 2). All the seamounts, where “s” are the smoothing terms, “slope” is the seabed slope
except for Crawford East and un-named, were characterised by in degrees and “distance_to_plateau” is the distance from the
the presence of a strong Sound Scattering Layer (SSL) with similar plateau edge (in metres). The variable seabed depth was not
characteristics across the seamounts (examples of echograms are included in the models because it was highly collinear with
shown in Figure 3). The SSL was mainly concentrated over the “distance_to_plateau.” The location was used as a categorical
summit of the seamounts, occupying almost the entire water variable to account for the variability between the different
column with decreasing density and height at the seamount’s seamounts. The deviance explained for the shallow and deep
flanks. McNish and Yakhont had the highest average backscatter, seamount models were 35 and 14.5%, respectively. The results
followed by Crawford-West and RSA (Figures 3, 4). These highlighted the importance of the distance from the plateau on
seamounts were characterised by relatively shallow summit the distribution of the backscatter, which was the covariate that
depths of less than 400 m with McNish being the shallowest explained most of the variation in the shallow seamount model.
(∼150 m). These seamounts also showed higher backscatter The areas over the plateaus positively affected the backscatter
on the plateau compared to the slope area (Figure 5). The density at the shallow seamounts, while increasing distances away
deeper seamounts (Un-named and Crawford East, summit depth from the plateau had a negative effect (Figure 6). In addition,
∼500 m) were characterised by very low levels of backscatter and the model indicated the positive effect of both low and high
a very weak SSL (Figures 3, 4) with no clear differences between values of slope, which correspond to the plateau and the steep
plateau and slope (Figure 5). seamount flanks, respectively. The deep seamount model showed
GAM models for both the shallow and deep seamount datasets opposite patterns with a positive effect on the backscatter density
selected the same explanatory variables: of increasing distances from the plateau and low values of slope.
Even though the acoustic surveys were conducted during the
night, some opportunistic data were collected during the day and
NASC 70kHz − s slope +s distance_to_plateau +location, the crepuscular period. These data highlighted the presence of a
Frontiers in Marine Science | www.frontiersin.org 7 June 2021 | Volume 8 | Article 663278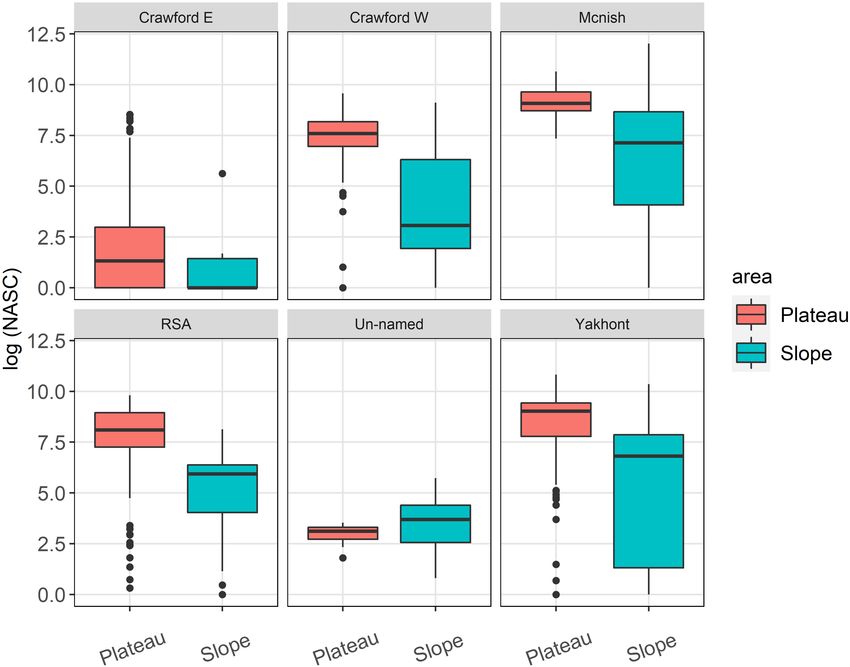
Campanella et al. Seamount Fish Dynamics in the South Atlantic
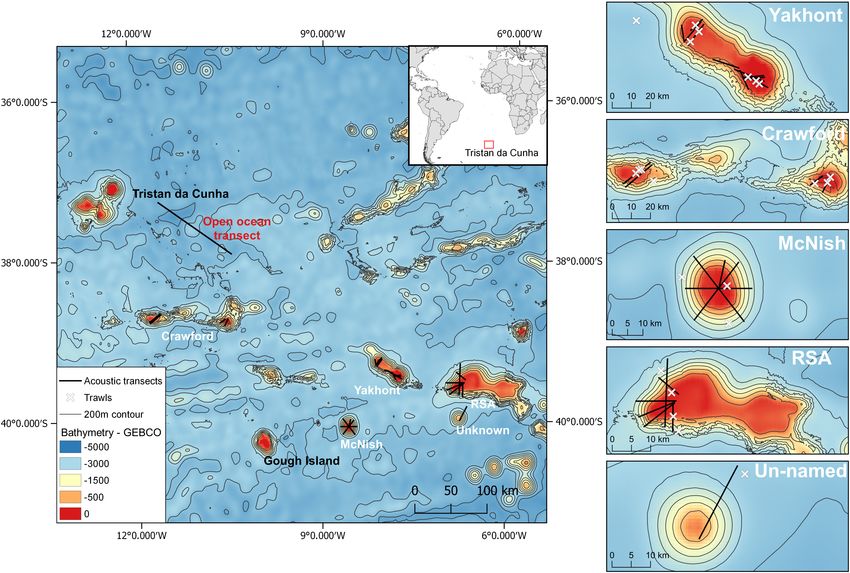
the seafloor (Figure 7). The inverse migration occurred at sunset
where the SSL moved vertically to the upper water column and
maintained that behaviour throughout the night. The night and
crepuscular data were mainly collected at the McNish seamount.
Biomass Estimation at McNish and RSA
The catches of the RMT25 and RMT8 pelagic nets performed
over the summit of these seamounts (below), confirmed our
assumption that the main component of the SSL to be
pearlside (Maurolicus inventionis), although small numbers of
siphonophores and several species of euphausiids were also
caught. Because the acoustic contribution of the other organisms
was not known we converted the backscatter of the SSL at
McNish and RSA into biomass based on pearlside TS equations.
The pearlside density for McNish (mean length estimated from
net samples: 4.2 cm) was estimated to be 127.4 fish/m2 for the
plateau area and 23.07 fish/m2 for the slope area resulting in a
total biomass of 113,503 tonnes on the slope and plateau of the
FIGURE 4 | Boxplot of the log-transformed Nautical Area Backscattering
seamount (area: 407 km2 ). The pearlside density for RSA (using
Coefficient (NASC), a proxy for biomass, calculated for the area above each of
the seamounts and for the open ocean area. Lower and upper hinges a mean length of 3.7 cm based on net samples) was estimated
correspond to the first and third quartiles. Dots at the end of the boxplot to be 154.7 fish/m2 for the plateau area and 2.3 fish/m2 for the
represent outliers. slope area resulting in a total biomass of 29,952 tonnes (area:
784 km2 ) (Table 1).
A large and very dense discrete aggregation, which was not
strong Diel Vertical Migration (DVM) of the SSL that occurred at part of the SSL, was also detected on McNish (Figure 8). This
dawn and dusk. At sunrise the SSL became denser and moved to aggregation was distributed over the slope of the seamount near
deeper waters forming a strong and homogeneous layer close to the seafloor at depths ranging approximately from 200 to 500 m.
FIGURE 5 | Boxplot of the log-transformed Nautical Area Backscattering Coefficient (NASC) calculated at the plateau and slope for each of the seamounts. Lower
and the upper hinges correspond to the first and third quartiles. Dots at the end of the boxplot represent outliers.
Frontiers in Marine Science | www.frontiersin.org 8 June 2021 | Volume 8 | Article 663278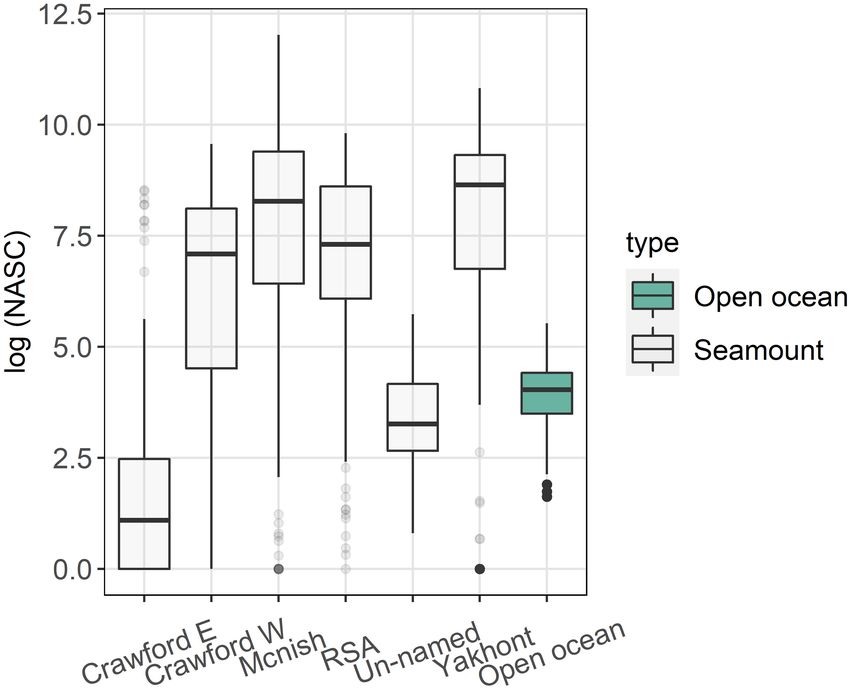
Campanella et al.                                                                                                      Seamount Fish Dynamics in the South Atlantic

  FIGURE 6 | Smooths of generalised additive model terms showing the effect of slope (degrees) and distance from the plateau edges (metre; the negative values are
  distances from the edges of the plateau to the centre of the seamount and the positive values are distances from the edges of the plateau going toward the open
  ocean) on the backscattering at 70 kHz for the shallow seamounts (McNish, RSA, Yakhont, Crawford West; (A) and the deeper seamounts (un-named, Crawford
  east; (B). The solid lines are the estimates of the smooths, the thick marks on the x-axis are observed datapoints and the shaded regions indicate 95% confidence
  bounds.

It was detected on every pass performed over the seamount with                        mouchezi) and bluenose warehou (Hyperoglyphe antarctica).
the highest density and size detected at the south-west side of the                   As mentioned previously, we considered it was most likely
seamount where it reached a length of about 4 km and a height                         a bluenose warehou spawning or feeding aggregation. In the
of 200 m. No net deployment could be conducted due to risks of                        absence of a dedicated TS equation for this species and limited
damaging the gear on the slope and the species composition of the                     information on the morphology of the swimbladder, we used
school could therefore not be validated. However, based on the                        two existing but contrasting equations, to estimate the minimum
high backscattering strength, the morphology that characterised                       and maximum biomass. Using a conservative physoclist fish
the aggregation and the outcome of the multifrequency analysis                        target strength equation, the acoustic backscatter of the total
(limited to the shallower part of the aggregation), we attributed                     aggregation was estimated to represent a biomass of 548,851
the aggregation to fish with swimbladders. The aggregation                            tonnes with a density of 0.5 fish/m2 . The biologically more
could be ascribed to different bentho-pelagic fish species that                       comparable target strength equation of the orange roughy,
are known to inhabit seamounts in this area such as alfonsino                         suggested a biomass of 3,307,159 tonnes with a density of 3
(Beryx splendens), rockfish (Sebastes sp.), jacopever (Helicolenus                    fish/m2 . For both estimates we used a mean bluenose length

Frontiers in Marine Science | www.frontiersin.org                                 9                                            June 2021 | Volume 8 | Article 663278
Campanella et al.                                                                                                    Seamount Fish Dynamics in the South Atlantic

  FIGURE 7 | Sv (volume backscattering strength) echograms at 70 kHz of two adjacent transects conducted at night (top) and day (bottom) at the McNish seamount.

of 84 cm (range 57–124 cm) and mean weight of 9.4 kg that                           Hydrodynamics
were derived from fisheries observer data collected at McNish                       The 10-year mean horizontal velocities revealed a tendency for
in March-April 2018 (Bell et al., 2021). Other discrete, but                        anticyclonic flows around McNish Seamount, with strongest
considerably smaller, schools were also detected on Yakhont at                      flows on the south and east flanks (Figure 9A). These were
a similar depth range to that observed at McNish.                                   particularly clear in the flows at 10 m depth, but were also
                                                                                    evident at 200 m, albeit weaker (not shown). Associated with the
Micronekton and Fish Community                                                      anticyclonic circulation were enhanced vertical velocities, with
Eighteen net hauls were undertaken to target acoustically                           upwelling in the centre of the seamount, and downwelling on the
detected aggregations over the seamounts (Supplementary                             southeast and northwest flanks (Figure 9C). The simulated mean
Table 3) and of these, fourteen were dominated by catches                           circulation patterns thus suggested a tendency for local retention
of Maurolicus inventionis (pearlside) (37–90% of the catch).                        on the seamount through the convergent nature of anticyclonic
The only target hauls that did not catch pearlside were those                       flows, and the potential for increased local productivity through
targeting layers in the upper 100 m, which had catches dominated                    vertical mixing of nutrients associated with enhanced vertical
by siphonophores and salps (Supplementary Table 3). Over                            velocities. By comparison, the 10-year mean flows at RSA
Yakhont Seamount (2018) two size modes of pearlsides (25–                           seamount showed a weak anticyclonic circulation at 10 m
28 mm and 44–46 mm SL) were caught, with both modes only                            depth, centred over the shallower western part of the seamount
found in deeper layers (∼200 M), but only the smaller mode                          (Figure 9B). At 200 m, an additional weak anticyclonic flow was
caught during shallower (
Campanella et al. Seamount Fish Dynamics in the South Atlantic FIGURE 8 | Presumed bluenose warehou (Hyperoglyphe antarctica) aggregation at McNish seamount visualised in two ways: (A) Interpolated map of NASC of the bluenose aggregation at McNish. (B) 70 kHz Sv (volume backscattering strength) echogram curtain of the bluenose aggregation overlaid on the 3D McNish elevation. FIGURE 9 | Simulated 10-year mean horizontal velocities (A,B) and vertical velocities (C,D) at 10 m depth from the regional oceanographic model: McNish seamount (A,C), RSA seamount (B,D). Vectors in (A,B) indicate the direction of flow [every 2nd flow vector shown in (B)], and shading represents current speed. Frontiers in Marine Science | www.frontiersin.org 11 June 2021 | Volume 8 | Article 663278
Campanella et al.                                                                                         Seamount Fish Dynamics in the South Atlantic

in accord with the mean circulation pattern described earlier.                properties and the catch composition of the targeted trawl
However, detailed examination of the 5-day mean fields for                    hauls, suggested these consisted of micronekton, dominated by
2000–2009 suggested that, although the anticyclonic circulation               pearlsides (Maurolicus inventionis). Small mesopelagic fish of the
was a frequent occurrence, it is not a persistent feature. There              genus Maurolicus are abundant in all oceans (Kalinowski and
may therefore be temporal variability in any associated local                 Linkowski, 1983; Boehlert et al., 1994; Sassa et al., 2002; Wilson
productivity and retention.                                                   and Boehlert, 2004), and M. inventionis (Parin and Kobylianski,
    The effect of the localised circulation patterns on time scales of        1996) is endemic to the southern Atlantic, notably around the
retention of marine biota at McNish Seamount was illustrated by               Discovery seamounts. Pearlsides are considered “pseuodoceanic”
calculating the e-folding time for passive particles released above           (sensu Hulley and Lutkeharms, 1989), and prefer continental
the seamount in the model. By simulating particle releases for a              shelf-slope breaks to open ocean habitats. This matches the
year of oceanographic model output, the potential impact of the               results from this study where they were not observed away
predicted anticyclonic circulation features on local retention was            from the seamount plateaus and flanks and suggests they were
shown within a wider temporal context. Simulations of particles               part of a seamount mesopelagic boundary community (Reid
released at 5-day intervals for a year (2000) suggested a mean                et al., 1991; Benoit-bird et al., 2001). The absence of other
e-folding time of 17 days, albeit with considerable temporal                  mesopelagic species over the seamounts may be due to the
variability (ranging from 1 to 37 days). Such temporal variability            shallow depths (
Campanella et al. Seamount Fish Dynamics in the South Atlantic
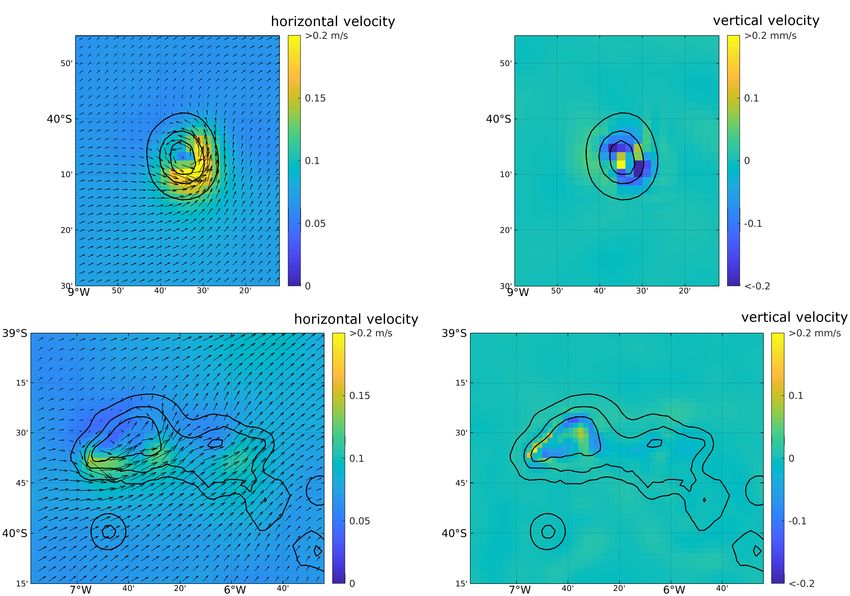
FIGURE 10 | Cross-section of 5-day mean (31/1/2006–4/2/2006) ocean properties along 40◦ 8"S from the regional oceanographic model: (A) potential temperature
(◦ C), (B) salinity, (C) potential density (σ, kg m−3 ), (D) horizontal current (m s−1 ). Positive (negative) horizontal currents are northward (southward). Model grid cells
below the seabed are shaded white.
fish that is widely distributed in the southern oceans although vs. those with a regressed swimbladder. Both scenarios were
little is known about its ecology in the southern Atlantic Ocean. explored as the size and physiology of a swimbladder is the most
On the basis that there is a high probability that the significant variable affecting the TS (Simmonds and Maclennan,
aggregation consisted of bluenose, we attempted to estimate 2005) and no detailed information on bluenose swimbladders was
the biomass from the acoustic data using two different Target available. For context, we point out that if fish species without
Strength (TS) equations, in the absence of a dedicated bluenose a swimbladder were present in the aggregation, the resulting
TS value. The resulting density and biomass estimates ranged biomass estimate would be higher than the (conservative) value
from 0.5 to 3 fish/m2 and 548,851 to 3,307,159 tonnes, provided. Also, if the aggregation consisted (partly) of other
respectively, representing fish with well-developed swim-bladder bentho-pelagic species like alfonsino (Beryx spp.) or rockfish
Frontiers in Marine Science | www.frontiersin.org 13 June 2021 | Volume 8 | Article 663278Campanella et al. Seamount Fish Dynamics in the South Atlantic
(Sebastes spp.), the same physoclist swimbladder target strength tight to the seafloor where they were visible on the echogram
equations would have been applied. Regardless of the taxa as a dense layer.
concerned (and swim-bladder form), this study presents evidence The diet of bluenose from these seamounts (McNish, RSA
of significant bentho-pelagic fish biomass at McNish. If the and Yakhont) is known to include pearlside (Laptikhovsky
aggregation is bluenose, our data suggest that the stock size of this et al., 2020), especially over McNish where it constituted more
species at McNish could be very high compared to other bluenose than 60% of the total diet, confirming the important trophic
stocks for which stock assessments have been produced (Cordue interactions between benthopelagic and pelagic environments.
and Pomaréde, 2012; Williams et al., 2016). However, given the High pearlside densities, estimated to range from 78.6 to 95 g/m2 ,
aforementioned uncertainties and the resulting large variability were similar to previous estimates (Kalinowski and Linkowski,
in the estimates, the results on the biomass of presumed bluenose 1983). The highest estimates were recorded over the flanks at
reported in this paper are only preliminary and should not be McNish (compared to RSA), which might explain the higher
used, in isolation, for any management decisions such as the importance of pearlside in the bluenose diet at McNish compared
status and size of bluenose warehou stock. to other seamounts. The large bentho-pelagic fish aggregation
It is unclear if the population of bluenose at McNish is self- was mainly located over the slope of the seamount, likely because
recruiting at the seamount or if it receives external fluxes of eggs of a higher availability of migrating prey. The higher backscatter
and larvae. The specific hydrodynamic conditions at McNish that values of both aggregations were located on the western flanks
seem to allow a relatively persistent retention, could facilitate self- of the seamount, which, according to the oceanographic model,
recruitment at the seamount in different ways. Firstly, a portion were generally characterised by weaker currents. It is possible
of the planktonic eggs and larvae produced at the seamount could that pearlside occupied these calmer habitats during non-feeding
be retained. Accumulation of larval stages has been observed intervals to preserve energy (feed-rest hypothesis; Genin, 2004),
on other seamounts characterised by persistent hydrographic and bluenose would target these high concentrations of prey. It
features (Mullineaux and Mills, 1997; Dower and Ian Perry, is unclear whether the quantity of meso-pelagic prey at McNish
2001). Secondly, the hydrographic conditions may also act to would be able to support such a potentially high benthopelagic
create an optimal habitat for bluenose juveniles with flotsam fish biomass, particularly for a prolonged period. For this reason,
and drift algae, known to provide suitable habitat conditions another hypothesis that could explain the presence of the large
for its early pelagic life stages (Blackwell and Gilbert, 2003), amount of fish at McNish is migration. Tagging studies on
accumulating over the seamounts and juvenile bluenose prey, bluenose carried out in New Zealand have shown that adults
such as salps and pyrosomes, advecting by prevailing currents can travel up to 490 km along the continental margin (Horn,
(Laptikhovsky et al., 2020). 2003). Considering that the period of the survey (March–
The results of this study suggested the presence of potentially April) overlaps with the spawning season reported in the South
high densities of bentho-pelagic fish, which matched reported Atlantic (Piotrovsky, 1994), bluenose might have migrated from
spawning behaviour of bluenose warehou (as well as several other the nearby seamounts and islands to McNish to spawn. Even
species). If that is the case, it would mean that McNish could act as though bluenose spawning migration has not been observed,
the main hub for these bentho-pelagic species by providing fluxes this hypothesis cannot be excluded and more work is needed to
of eggs and larvae to replenish the other seamounts in the area. investigate this further.
Similar to pearlside, we cannot confirm this hypothesis without To our knowledge, this work represents the first scientific
a thorough analysis of the connectivity between seamounts. study combining fisheries acoustic methods, qualitative trawls
Moreover, since the coverage of our surveys was spatially and and hydrodynamic modelling to explore the ecological role
temporally limited, especially over the larger seamounts such as of the seamount ecosystems around the Tristan da Cunha
RSA, we could not confirm if other large aggregations, such as archipelago. Despite several caveats, discussed in this study, the
the one observed at McNish, were present at other seamounts. multi-disciplinary approach enabled us to describe patterns in
Other factors, such as larval stage duration, larval swimming the micronekton dynamics, analyse the influence of seamount
ability and spatio-temporal patterns of the spawning activity topographic features on these observations and interpret them
would need to be investigated as they may largely contribute to in context of the ecology of the region. This study contributes
the self-recruitment success (Sponaugle et al., 2002). toward a better understanding of the relative importance of
This study implies the presence of high mesopelagic and the newly established MPA, its role in the wider region
bentho-pelagic biomass at McNish Seamount, and would support and, more broadly, to the general understanding of the role
the important role of seamounts in betho-pelagic coupling. The of seamount systems in the open oceans. The suggested
mesopelagic community, including pearlsides, transfer energy observations of enhanced (mesopelagic and benthopelagic) fish
from the productive pelagic zone to the benthic zone by diel biomass detected near seamounts (compared to the surrounding
vertical migration (DVM) (Trueman et al., 2014). Mesopelagic ocean) corroborated the role of seamounts as ecological “oasis”
fish such as pearlside, inhabit shallower waters at dusk and during (sensu McClain, 2007). As this enhanced productivity was
the night (Staby et al., 2011) to feed on plankton and descend only observed over specific seamounts, possibly as a result of
to the seabed where they reside during the day and are predated complex interactions between topography, hydrodynamics and
on by benthic and bentho-pelagic predators. The limited daytime environmental factors, it further highlighted the heterogeneity
acoustic observations at the seamounts confirmed that the of these habitats with differing ecological roles. More scientific
pelagic pearlside scattering layers observed at night, descended efforts are needed to disentangle the complex interactions
Frontiers in Marine Science | www.frontiersin.org 14 June 2021 | Volume 8 | Article 663278Campanella et al. Seamount Fish Dynamics in the South Atlantic
operating at seamounts by expanding the research focus to other FUNDING
components of the ecosystems such as planktonic and benthic
organisms and a more comprehensive analysis on the physical The surveys were funded by the UK Government funded Blue
forcing. Although further questions remain about the large Belt Programme and the British Antarctic Survey through the
bentho-pelagic aggregation on McNish, including on the species Natural Environment Research Council (RSS Discovery Survey:
composition, this study has helped identify priority areas for Grant NE/R000107/1) NC-ODA project. The participation of
future monitoring surveys which will be important to underpin EY was funded by the Natural Environment Research Council
sustainable management. through award NE/R000107/1. The oceanographic modelling
used the ARCHER UK National Supercomputing Service (http:
//www.archer.ac.uk).
DATA AVAILABILITY STATEMENT
The raw data supporting the conclusions of this article will be ACKNOWLEDGMENTS
made available by the authors, without undue reservation.
We are grateful to the masters and crew of the RRS James Clark
Ross and RRS Discovery for their cooperation during the fisheries
surveys, and to Tristan da Cunha Government for their support
AUTHOR CONTRIBUTIONS during this research.
FC, MC, and JK designed the acoustic surveys. FC, MC, VL,
and PW collected the acoustic data, performed the net sampling, SUPPLEMENTARY MATERIAL
and process the samples on board the research vessels. FC
conducted the acoustic analysis. EY performed the analysis of the The Supplementary Material for this article can be found
oceanographic model data. All authors contributed to the article online at: https://www.frontiersin.org/articles/10.3389/fmars.
and approved the submitted version. 2021.663278/full#supplementary-material
REFERENCES A. Oceanogr. Res. Pap. 39, 1139–1145. doi: 10.1016/0198-0149(92)90
061-W
Anderson, D. A., Burnham, K. P., and Anderson, D. R. (1998). Model Selection and Dower, J. F., and Ian Perry, R. (2001). High abundance of larval rockfish over Cobb
Inference: a Practical Information-Theoretic Approach. Berlin: Springer. Seamount, an isolated seamount in the Northeast Pacific. Fish. Oceanogr. 10,
Ballón, M., Bertrand, A., Lebourges-Dhaussy, A., Gutiérrez, M., Ayón, P., Grados, 268–274. doi: 10.1046/j.1365-2419.2001.00162.x
D., et al. (2011). Is there enough zooplankton to feed forage fish populations Dussin, R., Barnier, B., and Brodeau, L. (2016). The making of Drakkar forcing set
off Peru? An acoustic (positive) answer. Prog. Oceanogr. 91, 360–381. doi: DFS5. DRAKKAR/MyOcean Rep. 01-04–16. Gütersloh: Bertelsmann.
10.1016/j.pocean.2011.03.001 Egbert, G. D., and Erofeeva, S. Y. (2002). Efficient Inverse Modeling of Barotropic
Bell, J., Laptikhovsky, V., Barnes, D. K. A., Benedet, R., Bridges, E., Glass, J., Ocean Tides. J. Atmos. Ocean. Technol. 19, 183–204. doi: 10.1175/1520-
et al. (2021). Life history and ecology of bluenose warehou (Hyperoglyphe 0426(2002)0192.0.co;2
antarctica, Centrolophidae) in the southern Atlantic. Front. Mar. Sci. 8:610172. Fock, H. O., Matthiessen, B., Zidowitz, H., and Westernhagen, H. V. (2002).
doi: 10.3389/fmars.2021.610172 Diel and habitat-dependent resource utilisation by deep-sea fishes at the Great
Benoit-bird, K. J., Au, W. W. L., Brainard, R. E., and Lammers, M. O. (2001). Meteor seamount: Niche overlap and support for the sound scattering layer
Diel horizontal migration of the Hawaiian mesopelagic boundary community interception hypothesis. Mar. Ecol. Prog. Ser. 244, 219–233. doi: 10.3354/
observed acoustically. Mar. Ecol. Prog. Ser. 217, 1–14. doi: 10.3354/meps217001 meps244219
Blackwell, R. G., and Gilbert, D. J. (2003). Review of methods for the estimation of Foote, K. G. (1987). Fish target strengths for use in echo integrator surveys.
relative biomass of bluenose. New Zeal. Fish. Assess. Rep. 14:57. J. Acoust. Soc. Am. 82, 981–987. doi: 10.1121/1.395298
Boehlert, G., Wilson, C., and Mizuno, K. (1994). Populations of the Sternoptychid Genin, A. (2004). Bio-physical coupling in the formation of zooplankton and fish
Fish Maurolicus muelleri on Seamounts in the Central North Pacific. Pacific Sci. aggregations over abrupt topographies. J. Mar. Syst. 50, 3–20. doi: 10.1016/j.
48, 57–69. jmarsys.2003.10.008
Collins, M. A., Stowasser, G., Fielding, S., Shreeve, R., Xavier, J. C., Venables, Genin, A., and Boehlert, G. W. (1985). Dynamics of temperature and chlorophyll
H. J., et al. (2012). Latitudinal and bathymetric patterns in the distribution and structures above a seamount: an oceanic experiment. J. Mar. Res. 43, 907–924.
abundance of mesopelagic fish in the Scotia Sea. Deep. Res. II 59–60, 189–198. doi: 10.1357/002224085788453868
doi: 10.1016/j.dsr2.2011.07.003 Genin, A., and Dower, J. F. (2007). “Seamount plankton dynamics,” in Seamounts:
Collins, M. A., Xavier, J. C., Johnston, N. M., North, A. W., Enderlein, P., Tarling, Ecology, Fisheries & Conservation, eds T. J. Pitcher, T. Morato, P. J. B. Hart, M. R.
G. A., et al. (2008). Patterns in the distribution of myctophid fish in the northern Clark, N. Haggan, and R. S. Santos (Oxford: Blackwell Publishing), 85–100.
Scotia Sea ecosystem. Polar Biol. 31, 837–851. doi: 10.1007/s00300-008-0423-2 Genin, A., Haury, L., and Greenblatt, P. (1988). Interactions of migrating
Comeau, L. A., Vézina, A. F., Bourgeois, M., and Juniper, S. K. (1995). Relationship zooplankton with shallow topography: predation by rockfishes and
between phytoplankton production and the physical structure of the water intensification of patchiness. Deep Sea Res. Part A. Oceanogr. Res. Pap.
column near Cobb Seamount, northeast Pacific. Deep Sea Res. Part I Oceanogr. 35, 151–175. doi: 10.1016/0198-0149(88)90034-9
Res. Pap. 42, 993–1005. doi: 10.1016/0967-0637(95)00050-G Godø, O. R., Samuelsen, A., Macaulay, G. J., Patel, R., and Hjøllo, S. S. (2012).
Cordue, P. L., and Pomaréde, M. (2012). A 2011 stock assessment of bluenose Mesoscale Eddies Are Oases for Higher Trophic Marine Life. PLoS ONE
(Hyperoglyphe antarctica). New Zeal. Fish. Assess. Rep. 06:56. 7:e30161. doi: 10.1371/journal.pone.0030161
Demer, D. A., Berger, L., Bernasconi, M., Bethke, E., Boswell, K. M., Chu, D., et al. Goldner, D. R., and Chapman, D. C. (1997). Flow and particle motion induced
(2015). Calibration of Acoustic Instruments. ICES Cooperative Research Report above a tall seamount by steady and tidal background currents. Deep Sea Res.
326. London: ICES. Part I Oceanogr. Res. Pap. 44, 719–744. doi: 10.1016/S0967-0637(96)00131-8
Dower, J., Freeland, H., and Juniper, K. (1992). A strong biological Holland, K. N., and Grubbs, R. D. (2007). “Fish visitors to seamounts: tunas and bill
response to oceanic flow past Cobb Seamount. Deep Sea Res. Part fish at seamounts,” in Seamounts Ecol. Fish. Conserv, eds T. J. Pitcher, T. Morato,
Frontiers in Marine Science | www.frontiersin.org 15 June 2021 | Volume 8 | Article 663278Campanella et al. Seamount Fish Dynamics in the South Atlantic
P. J. B. Hart, M. R. Clark, N. Haggan, and R. S. Santos (Oxford: Blackwell Owens, W. B., and Hogg, N. G. (1980). Oceanic observations of stratified Taylor
Publishing), 189–201. doi: 10.1002/9780470691953.ch10a columns near a bump. Deep Sea Res. Part A. Oceanogr. Res. Pap. 27, 1029–1045.
Holland, K. N., Kleiber, P., and Kajiura, S. M. (1999). Different residence times of doi: 10.1016/0198-0149(80)90063-1
yellowfin tuna, Thunnus albacares, and bigeye tuna, T. obesus, found in mixed Parin, N. V., and Kobylianski, S. G. (1996). Diagnoses and distribution of fifteen
aggregations over a seamount. Fish. Bull. 97, 392–395. species recognized in genus Maurolicus cocco (Sternoptychidae, Stomiiformes)
Horn, M. H. (1975). Swim-bladder state and structure in relation to behavior and with a key to their identification. Cybium 20, 185–195.
mode of life in stromateoid fishes. Fish. Bull. 73, 95–109. Phleger, C. F., and Grigor, M. R. (1990). Role of wax esters in determining buoyancy
Horn, P. L. (2003). Stock structure of bluenose (Hyperoglyphe antarctica) off the in Hoplostethus atlanticus (Beryciformes: Trachichthyidae). Mar. Biol. 105,
north-east coast of New Zealand based on the results of a detachable hook 229–233. doi: 10.1007/bf01344291
tagging programme. New Zeal. J. Mar. Freshw. Res. 37, 623–631. doi: 10.1080/ Piatkowski, U., Rodhouse, P. G., White, M. G., Bone, D. G., and Symon, C. (1994).
00288330.2003.9517193 Nekton community of the Scotia Sea as sampled by the RMT 25 during austral
Hulley, P. A., and Lutkeharms, J. R. (1989). Lanternfishes of the Southern Benguela summer. Mar. Ecol. Prog. Ser. 112, 13–28. doi: 10.3354/meps112013
Region Part 3. The Pseudoceanic-oceanic interface. Ann. South African Museum Piotrovsky, A. S. (1994). Stromateoidei in the southern part of Africa and adjacent
98, 645–658. areas (distribution, biology and fisheries). Main results of YugNIRO complex
Irigoien, X., Klevjer, T. A., Røstad, A., Martinez, U., Boyra, G., Acuña, J. L., et al. research in Azov-Black Seas region and the World Ocean in 1993. Proc. South.
(2014). Large mesopelagic fishes biomass and trophic efficiency in the open Aust. Sci. Res. Inst. Mar. Fish. Ocean. 40, 69–77. doi: 10.15407/gpimo2020.01.
ocean. Nat. Commun. 5:3271. doi: 10.1038/ncomms4271 069
Kalinowski, J., and Linkowski, T. B. (1983). Hydroacoustic observations on Proud, R., Cox, M. J., and Brierley, A. S. (2017). Biogeography of the Global Ocean’s
Maurolicus muelleri (Sternoptychidae) over R.S.A. and Discovery Seamounts Mesopelagic Zone. Curr. Biol. 27, 113–119. doi: 10.1016/j.cub.2016.11.003
(South Atlantic). London: ICES. Reid, S. B., Hirota, J., Young, R. E., and Hallacher, L. E. (1991). Mesopelagic-
Kitchingman, A., Lai, S., Morato, T., and Pauly, D. (2007). “How many seamounts boundary community in Hawaii: Micronekton at the interface between neritic
are there and where are they located?,” in Seamounts: Ecology, Fisheries & and oceanic ecosystems. Mar. Biol. 109, 427–440. doi: 10.1007/BF01313508
Conservation, eds T. J. Pitcher, T. Morato, P. J. B. Hart, M. R. Clark, N. Roe, H. S. J., and Shale, D. M. (1979). A new multiple rectangular midwater
Haggan, and R. S. Santos (Oxford: Blackwell Publishing), 26–40. doi: 10.1002/ trawl (RMT 1+ 8M) and some modifications to the Institute of Oceanographic
9780470691953.ch2 Sciences’ RMT 1+ 8. Mar. Biol. 50, 283–288. doi: 10.1007/bf00394210
Klimley, A. P., Jorgensen, S. J., Muhlia-Melo, A., and Beavers, S. C. (2003). The Sassa, C., Kawaguchi, K., Kinoshita, T., and Watanabe, C. (2002). Assemblages of
occurrence of yellowfin tuna (Thunnus albacares) at Espiritu Santo Seamount vertical migratory mesopelagic fish in the transitional region of the western
in the Gulf of California. Fish. Bull. 101, 684–692. North Pacific. Fish. Oceanogr. 11, 193–204. doi: 10.1046/j.1365-2419.2002.
Koslow, J. A. (1996). Energetic and life-history patterns of deep-sea benthic, 00199.x
benthopelagic and seamount-associated fish. J. Fish Biol. 49, 54–74. doi: 10. Simmonds, E. J., and Maclennan, D. N. (2005). Fisheries Acoustics: Theory and
1111/j.1095-8649.1996.tb06067.x Practice. Oxford, UK: Blackwell Publishing.
Koslow, J. A., Boehlert, G. W., Gordon, J. D. M., Haedrich, R. L., Lorance, P., and Sobradillo, B., Boyra, G., Martinez, U., Carrera, P., Pe, M., and Irigoien, X. (2019).
Parin, N. (2000). Continental slope and deep-sea fisheries: implications for a Target Strength and swimbladder morphology of Mueller’s pearlside. Sci. Rep.
fragile ecosystem. ICES J. Mar. Sci. 57, 548–557. doi: 10.1006/jmsc.2000.0722 9:17311. doi: 10.1038/s41598-019-53819-6
Laptikhovsky, V., Bell, J. B., Benedet, R., Glass, J., Glass, W., Green, R., et al. (2020). Sponaugle, S., Cowen, R. K., Shanks, A., Morgan, S. G., Leis, J. M., Pineda, J.,
Feeding habits of bluenose warehou, Hyperoglyphe antarctica (Carmichael, et al. (2002). Predicting self-recruitment in marine populations: Biophysical
1819) (Centrolophidae) at seamounts of the Southern Atlantic. Deep. Res. Part correlates and mechanisms. Bull. Mar. Sci. 70, 341–375.
I Oceanogr. Res. Pap. 156:103182. doi: 10.1016/j.dsr.2019.103182 Staby, A., Røstad, A., and Kaartvedt, S. (2011). Long-term acoustical observations
Linkowski, T. B. (1983). Some Aspects of the Biology of Maurolicus of the mesopelagic fish Maurolicus muelleri reveal novel and varied vertical
muelleri/Sternoptychidae from the South Atlantic. London: ICES. migration patterns. Mar. Ecol. Prog. Ser. 441, 241–255. doi: 10.3354/meps09363
Marecol (2017). South Atlantic Overseas Territories Commercial Fisheries Trueman, C. N., Johnston, G., O’Hea, B., and MacKenzie, K. M. (2014). Trophic
Management Review. A Report Commissioned by the RSPB. Available online interactions of fish communities at midwater depths enhance long-term carbon
at: https://www.rspb.org.uk/globalassets/downloads/documents/conservation- storage and benthic production on continental slopes. Proc. R. Soc. B Biol. Sci.
projects/ukots-hidden-treasures/2017/summary-south-atlantic-overseas- 281:20140669. doi: 10.1098/rspb.2014.0669
territories-fisheries-sustainability-report-2017.pdf White, M., Bashmachnikov, I., Arístegui, J., and Martins, A. (2007). “Physical
McClain, C. R. (2007). Seamounts: Identity crisis or split personality? J. Biogeogr. processes and seamount productivity,” in Seamounts Ecol. Fish. Conserv, eds
34, 2001–2008. doi: 10.1111/j.1365-2699.2007.01783.x T. J. Pitcher, T. Morato, P. J. B. Hart, M. R. Clark, N. Haggan, and R. S. Santos
McClatchie, S., Macaulay, G., Coombs, R. F., Grimes, P., and Hart, A. (1999). Target (Oxford: Blackwell Publishing), 62–84. doi: 10.1002/9780470691953.ch4
strength of an oily deep-water fish, orange roughy (Hoplostethus atlanticus) I. Whomersley, P., Morley, S., Bell, J., Collins, M. A., Pettafor, A., Campanella, F.,
Experiments. J. Acoust. Soc. Am. 106, 131–142. doi: 10.1121/1.427042 et al. (2019). Blue Belt Programme: RRS Discovery DY100 survey report.
Mohn, C., and Beckmann, A. (2002). The upper ocean circulation at Great Meteor Williams, A., Hamer, P., Haddon, M., Robertson, S., Althaus, F., Green, M., et al.
Seamount. Ocean Dyn. 52, 179–193. doi: 10.1007/s10236-002-0017-4 (2016). Determining Blue-eye Trevalla Stock Structure and Improving Methods
Morato, T., and Clark, M. R. (2007). “Seamount fishes: ecology and life histories,” for Stock Assessment. Fisheries Research and Development Corporation Report
in Seamounts: Ecology, Fisheries & Conservation, eds T. J. Pitcher, T. Morato, 05. Washington, DC: NOAA.
P. J. B. Hart, M. R. Clark, N. Haggan, and R. S. Santos (Oxford: Blackwell Wilson, C. D., and Boehlert, G. W. (2004). Interaction of ocean currents and
Publishing), 170–188. doi: 10.1002/9780470691953.ch9 resident micronekton at a seamount in the central North Pacific. J. Mar. Syst.
Morato, T., Hoyle, S. D., Allain, V., and Nicol, S. J. (2010a). Seamounts are hotspots 50, 39–60. doi: 10.1016/j.jmarsys.2003.09.013
of pelagic biodiversity in the open ocean. Proc. Natl. Acad. Sci. U. S. A. 107, Wood, S. (2006). Generalized Additive Models. An Introduction with R. London:
9707–9711. doi: 10.1073/pnas.0910290107 Chapman & Hall.
Morato, T., Hoyle, S. D., Allain, V., and Nicol, S. J. (2010b). Tuna longline fishing
around west and central pacific seamounts. PLoS ONE 5:e0014453. doi: 10.1371/ Conflict of Interest: The authors declare that the research was conducted in the
journal.pone.0014453 absence of any commercial or financial relationships that could be construed as a
Morato, T., Varkey, D. A., Damaso, C., Machete, M., Santos, M., Prieto, R., et al. potential conflict of interest.
(2008). Evidence of a seamount effect on aggregating visitors. Mar. Ecol. Prog.
Ser. 357, 23–32. doi: 10.3354/meps07269 Copyright © 2021 Campanella, Collins, Young, Laptikhovsky, Whomersley and van
Morley, S. A., Collins, M. A., Barnes, D. K. A., Sands, C., Bell, J. B., Walmsley, der Kooij. This is an open-access article distributed under the terms of the Creative
S., et al. (2018). Helping Tristan da Cunha and St Helena manage their marine Commons Attribution License (CC BY). The use, distribution or reproduction in
environments. Report of James Clark Ross cruise 17-004. Liverpool: BODC. other forums is permitted, provided the original author(s) and the copyright owner(s)
Mullineaux, L. S., and Mills, S. W. (1997). A test of the larval retention hypothesis are credited and that the original publication in this journal is cited, in accordance
in seamount-generated flows. Deep. Res. Part I Oceanogr. Res. Pap. 44, 745–770. with accepted academic practice. No use, distribution or reproduction is permitted
doi: 10.1016/S0967-0637(96)00130-6 which does not comply with these terms.
Frontiers in Marine Science | www.frontiersin.org 16 June 2021 | Volume 8 | Article 663278You can also read