Flood Impact Assessment on Road Network and Healthcare Access at the example of Jakarta, Indonesia
←
→
Page content transcription
If your browser does not render page correctly, please read the page content below
AGILE: GIScience Series, 2, 4, 2021. https://doi.org/10.5194/agile-giss-2-4-2021
Proceedings of the 24th AGILE Conference on Geographic Information Science, 2021.
Editors: Panagiotis Partsinevelos, Phaedon Kyriakidis, and Marinos Kavouras.
This contribution underwent peer review based on a full paper submission.
© Author(s) 2021. This work is distributed under the Creative Commons Attribution 4.0 License.

Flood Impact Assessment on Road Network and Healthcare
Access at the example of Jakarta, Indonesia
Isabell G. Klippera , Alexander Zipfa,b and Sven Lautenbacha (corresponding author)
isabell.klipper@gmail.com, zipf@uni-heidelberg.de, sven.lautenbach@heigit.org

a
    HeiGIT at Heidelberg University, Heidelberg, Germany
b
    GIScience department, Institute of Geography, Heidelberg University, Heidelberg, Germany

Abstract. Climate change leads to an increasing num-                            most common natural disaster worldwide, with re-
ber of flood events that poses threats to a large share                         markable impacts on public health and economic wel-
of the global population. In addition to direct effects,                        fare (Alderman et al., 2012). Most low-income coun-
flooding leads to indirect effect due to damages of                             tries are more vulnerable to floods since they often lack
the road infrastructure that might limit accessibility of                       resources for all phases of the disaster management
health sites. For disaster preparedness it is important                         cycle: preparedness, mitigation, response and recovery
to know how flood events impact accessibility in that                           (Alderman et al., 2012). Cities, including their infras-
respect. We analyzed this at the example of the capital                         tructures, are vulnerable systems, and the resilience of
of Indonesia, Jakarta based on the flood event of 2013.                         these systems is important for maintaining their func-
The analysis was based on information about the road                            tions under shock events such as major floods. Two im-
network and health sites from OpenStreetMap. We as-                             portant components of resilience are the road network
sessed impacts of the flood event by comparing cen-                             as well as the healthcare system. Access to healthcare
trality indicators of the road network as well as by an                         facilities is essential for the population in their every-
accessibility analysis of health sites before and dur-                          day life and even more in such an emergency (Luo and
ing the event. The flooded areas were home to 2.75                              Wang, 2003). The analysis and evaluation of the vari-
million inhabitants and hosted 79 clinics and hospi-                            ous aspects of the road network and healthcare supply
tals. The flood split the road network into several sub-                        are therefore important for understanding and manag-
graphs. The city center maintained its importance for                           ing the effects of flooding.
time-efficient routing as well as for easily accessible                         The Indonesian capital mega-city Jakarta, located at
healthcare but might be prone to traffic congestion af-                         the coast of the Java Sea, is facing a serious risk
ter such an event. Indirect effects via interrupted road                        of flooding due to its physical-geographical setting:
traffic through flooded areas affected around 1.5 mil-                          about 40% of the land is below sea level and most
lion inhabitants and led to an increase of travel time to                       of the Jakarta mainland stretches across alluvial low-
the nearest hospital by five minutes based on normal                            land with a mean elevation of 7 m above sea level
traffic conditions.                                                             (ADPC, 2010). The city’s water systems consists of 13
Keywords. disaster preparedness, OpenStreetMap,                                 rivers, drains and canals that discharge into Jakarta Bay
network analysis, openrouteservice, accessibility,                              through Jakarta’s 35-km coast. In addition to flood risk
health sites                                                                    by heavy rainfalls during the monsoon season, floods
                                                                                might be also triggered or aggrevated by storms that
                                                                                push sea water inland. Jakrata has faced an increasing
                                                                                number of flood events: the years 1996, 2002, 2007,
                                                                                2013, 2014 and 2020 (Octavianti and Charles, 2019;
1      Introduction                                                             AHA center, 2020; Lyons, 2015) were marked by in-
                                                                                tense flooding, with the year 2007 having the worst
Due to climate change and anthropogenic activi-                                 impact so far. In this year 97 deaths were counted,
ties, the number and intensity of natural hazards has                           500,000 people evacuated, and 60 percent of the city
steadily increased at the global scale. Floods are the                          area flooded (Octavianti and Charles, 2019). In 2013

                          Reproducibility review: https://doi.org/10.17605/osf.io/g4dcq                                            1 of 11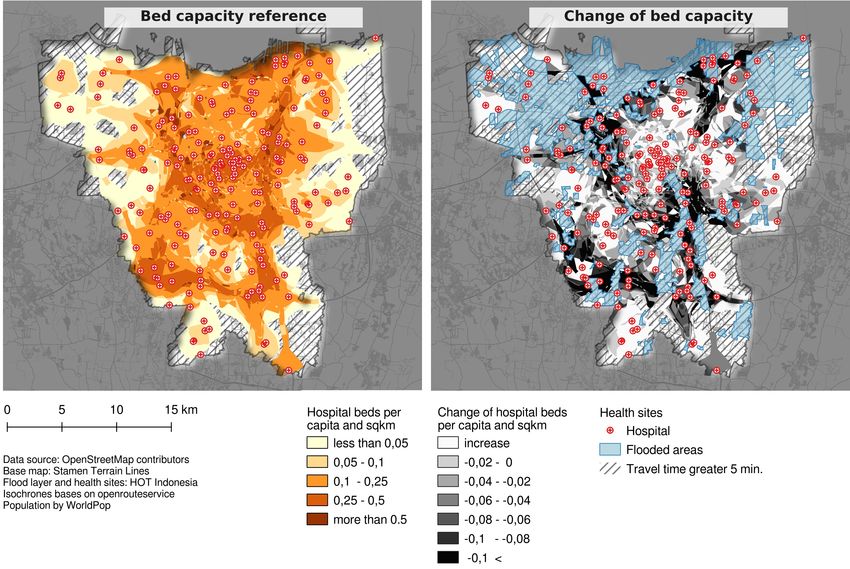
14 percent of the entire city was flooded, 20 people                   The flood extent map for 2013 was provided by HOT
died, and 50,000 people had to be evacuated (Octa-                     Indonesia. The flood map included no information
vianti and Charles, 2019). The rising sea level, land                  about the severity of the flooding such as water depth.
subsidence and the lack of flood protection exacerbate                 Information on health sites was also provided by HOT
the situation (Baker, 2012). Due to data availability, we              Indonesia - the information has been incorporated by
used the flood of 2013 as an example to analyse re-                    HOT Indonesia into the OSM database and is available
silience.                                                              by the usual means of accessing OSM data. In addition
A number of studies have investigated how central-                     to the type of the health site (hospital, clinic, doctor,
ness indicators could be used to assess the resilience or              pharmacy), information on bed capacity was available
vulnerability of road networks to external disturbance                 for about 60% of the hospitals and for about 53% of
- e.g. (e.g. Abshirini et al., 2017; Ahmadzai et al.,                  the clinics. Where the information on bed capacity was
2019; Demšar et al., 2008; Gauthier et al., 2018; Pa-                  missing we imputed the mean of each category.
pilloud et al., 2020; Zhang et al., 2011). Accessibility               To estimate the amount of population affected by
of health sites based on isochrones has been applied                   changes in accessibility due to the flood events, World-
less frequently. Examples are an analysis for subsaha-                 Pop (WorldPop, 2020) data at 100m cell size resolution
ran Africa (Geldsetzer et al., 2020) as well as studies                was used.
at city scale (Arrighi et al., 2019; Coles et al., 2017;
Green et al., 2017; Guagliardo, 2004). In case of dis-
asters the affected parts of the road network have to be
detached from the routing graph (Eckle et al., 2016).
Combined assessment of both accessibility of health
sites by means of isochrones and network connectiv-
ity in respect to resilience to flood events was seldom
investigated. Since both aspects are interconnected a
combined analysis might reveal aspects of concern for
city planning and disaster preparedness. Our analysis
aimed at:

    1. identifying parts of the road system in Jakarta
       most critical for access to health sites in Jakarta
       under normal conditions and under the flood event
       of 2013
    2. a quantification of the effect of the flood event in
       2013 on access of the population to health sites.

Since OSM was the main data source of our analysis,
it was furthermore necessary to assess underlying data
quality aspects with respect to the fitness for purpose.
                                                                       Figure 1. Spatial extent of the 2013 flood and location of
                                                                       clinics and hospitals. Areas outside the administrative bound-
                                                                       ary of Jakarta are greyed out.
2     Methods and Data

The road network was extracted from OSM by                             2.1   Network analysis
overpass-turbo (Overpass-Turbo Development Team,
2020). We used the administrative city boundaries of                   Connectivity of the road network was estimated by
Jakarta. The mega-city, however, does not stop at the                  indicators of network centrality, namely betweenness
administrative boundaries - densely populated areas                    and closeness centrality. Betweenness centrality (BC)
continue in the surroundings. The northern islands                     is based on the shortest path between two nodes in the
(’Kepulauan Seribu’) were excluded from the analysis,                  network. It measures how frequently a node lies on the
avoiding complexities such as transport by boats. The                  shortest paths among all possible node pairs (Freeman,
resulting area covered about 650 km2 . We used recent                  1977; Wang et al., 2018). The betweenness centrality
OSM data (29/09/2020), since our analysis aimed at                     of a nodes denotes the fraction of shortest paths which
understanding how resilient the current city would be                  pass through the focal node between all node pairs
towards a flood event similar to the 2013 event. Com-                  (Equation Eq. (1). The higher the betweenness central-
pleteness of OSM in the region has increased over time                 ity value of a node, the higher the importance of the
(c.f. figure 2), so using data from 2013 would imply the               node in the network. The implementation of Brandes
use of more incomplete OSM data.                                       (Brandes, 2001) was used to calculate BC. Since we

AGILE: GIScience Series, 2, 4, 2021 | https://doi.org/10.5194/agile-giss-2-4-2021                                            2 of 11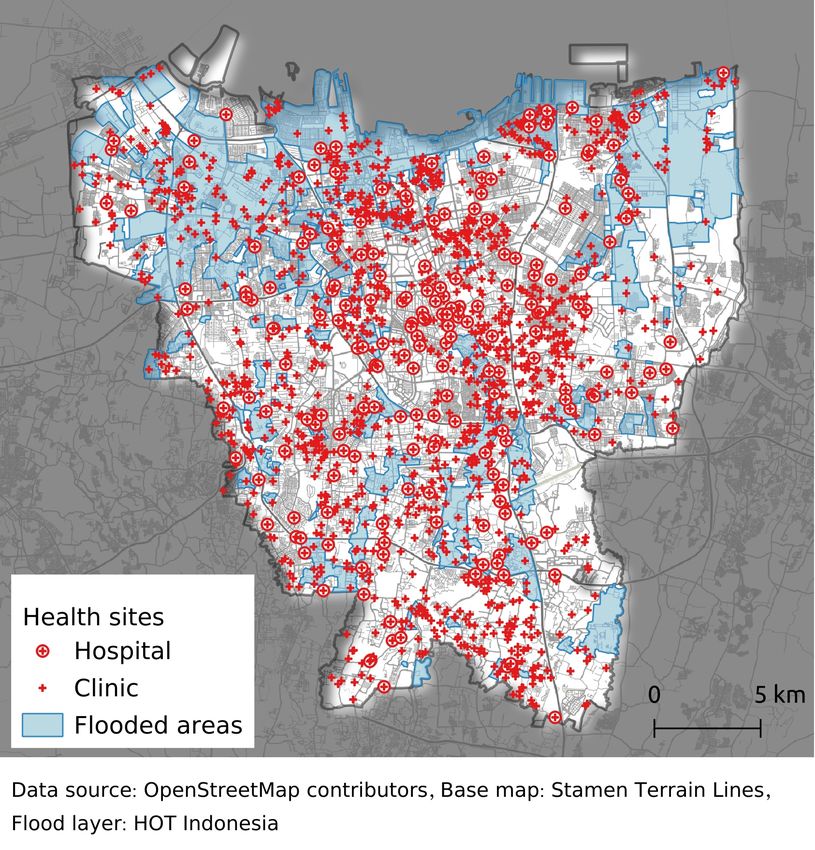
used travel times as weights the BC measured in our                    network remains unchanged after a disruption. It fol-
case the frequency at which the respective nodes were                  lows the idea that a network is less resilient, if the high
approached or crossed on the fastest routes. Nodes with                centrality values do not remain with the existing nodes
a high betweenness value are crossed more frequently                   but are transferred to others. We used the top one per-
and are in this context important for a fast routing and               cent of the centrality values as the small foreground
traffic flow. An even spatial distribution of between-                 network and the top ten percent as the large foreground
ness values indicates a resilient road network, since the              network. We calculated the sameness ratio (SR) be-
maintenance of traffic does not depend on individual                   tween the large foreground network for the normal and
nodes and is therefore not affected by the failure of in-              the flood event situation to quantify how strongly the
dividual sections. A doubling in value implies that the                flood event affected the road network. The SR ranges
node is passed twice as often.                                         from 0 to 1 - higher SR values indicate that the func-
                                                                       tionality of the road network changed less.
                             i
               X            gst
BC(i) =                                                  (1)           2.2   Accessibility analysis
                            gst
           i6=s,i6=t,s6=t

                                                                       Accessibility was estimated by calculating isochrones
where node i is the specified node, node s and t are                   (O’Sullivan et al., 2000; Doling, 1979) for each of the
two arbitrary nodes which are distinct and also differ-                hospitals and clinics inside the administrative bound-
ent from i, gst is the number of shortest paths between                aries of Jakarta. For the flood event, only hospitals and
              i
s and t, and gst is the number of shortest paths via node              clinics outside the flooded areas were considered. It
i between s and t.                                                     was assumed that health sites in flooded areas were ei-
Closeness centrality (CC) (Sabidussi, 1966) counts the                 ther out of order or unreachable for people in need. The
reciprocal of the average distance from a specific node                openrouteservice (HeiGIT, 2020) was used to calculate
to any other nodes within the network. Since the clas-                 the isochrones for each clinic and hospital based on the
sic formula cannot be used for disconnected graphs we                  OSM road network. During pre-processing the open-
used a variant, the harmonic closeness centrality (HC,                 routeservice builds the network graph and assigns rout-
Equation 2) (Rochat, 2009). Nodes with a higher HC                     ing weights based on OSM data. Travel time as well as
are closer to all other nodes and can therefor be easier               traffic restrictions depend on the mode of transport. We
reached by others (Opsahl et al., 2010). In contrast to                used the car profile together with the standard speed
the BC, the results of the HC indicate, which nodes can                limits of the ORS, that are assigned based on road cat-
be reached most quickly on average from all existing                   egories if not present as tags at the individual OSM
nodes. Nodes with a higher closeness rating can there-                 ways. The isochrones calculation considers additional
fore be regarded as important supply points as well as                 factors such as driving constraints and turn restrictions
locations which can be reached quickly by all other                    if these are present in the OSM data for the region.
nodes.                                                                 Isochrones were calculated for 5 minutes intervals up
                                                                       to half an hour of driving time. The isochrones for the
             X                                                         two health site categories hospitals and clinics were an-
HC(i) =             dij                                  (2)           alyzed separately. For the flood scenario flooded areas
           i6=j∈N                                                      were erased from the isochrones - while flooded roads
                                                                       were excluded from the graph isochrones could still in-
where N is the set of nodes, and dij denotes the dis-                  clude smaller flooded areas under some circumstances
tance between node i and j.                                            without that extra step. The analysis was based on the
For the analysis of connectivity only drivable roads,                  simplifying assumption, that inhabitants seek help at
including residential roads were considered since we                   the nearest hospital or clinic. An assumption that might
assumed transport by cars or minibuses. The analysis                   hold for emergencies but not necessarily for other situ-
was performed twice: for normal conditions and for the                 ations.
2013 flood event. For the flood event all roads that in-               To estimate the relationship between the health service
tersected with the flooded areas were removed from the                 supplied and the demand for that service, we divided
weighted graph. Weights were based on the length of                    the number of beds per clinic or hospital inside each
the road segment divided by the speed limit. To exam-                  isochrone by the population in that isochrone. To ex-
ine the indirect flood impact on the road network the                  amine the actual flood impact on the available health
value difference for both BC and HC was taken be-                      care supply, the change in the health site distribution
tween the normal and the flooded scenario.                             and bed capacity was calculated by determining the
To estimate the resilience of the road network towards                 difference between the results of the normal and the
the flood event we calculated an adjusted version of the               flooded scenario for each isochrone.
sameness indicator (Abshirini et al., 2017). This indi-
cator measures how much of the existing foreground

AGILE: GIScience Series, 2, 4, 2021 | https://doi.org/10.5194/agile-giss-2-4-2021                                          3 of 11
2.3 Intrinsic data quality assessment 3 Results
Since our analysis relies heavily on OSM data, it 3.1 Data quality assessment
was necessary to check data quality. We followed
an intrinsic data quality approach (Senaratne et al., The development of OSM features in Jakarta (c.f. fig.
2017; Degrossi et al., 2017; Barron et al., 2014). We 2) shows that the length road categories relevant for car
queried contributions for different feature classes and travel have been converging towards 13,000 km. The
studied the development of contributions over time. increase in road lengths for these categories has been
OSM history was accessed via the ohsome API that very small, especially since mid 2019. Additional fea-
builds on the oshdb (Raifer et al., 2019). We analyzed tures of the OSM key highway were mainly added for
the development of the length of relevant highway categories such as footway or path. The general devel-
classes, hospitals and clinics (amenity=hospital and opment of contributions showed several phases which
amenity=clinic), hospitals and clinics were capacity could be described by a multiple logistic growth func-
information was present (capacity:persons=*). Defini- tion. This pattern presumably is related to several map-
tions of the different road classes and the two health ping campaigns triggered e.g. by HOT Indonesia. The
site categories can be found in the OSM Wiki (OSM development of highway contributions showed some
Wiki, 2021a,b,c). In addition, we analyzed the number shifts between different categories which might indi-
of OSM users in Jakarta that contributed actively in the cate a refinement of the road type classification. Visual
domain of roads and paths (highway=*) or amenities inspection of the road network in comparison to recent
(amenity=*). high resolution imagery by Mapbox revealed also no
indication of missing road segments in the case study
2.4 Software and Data Availability region. Together with the sufficiently high number of
active OSM contributors mapping amenities and high-
ways (c.f. fig. 3) we can take this as an indication, that
The code used for the analysis of network centrality
the relevant part of the road network was sufficiently
and accessibility is available at github at https://github.
complete for our analysis.
com/GIScience/Jakarta_Thesis_Klipper. Except the
flood extent data, which were provided by the Humani- Contributions to clinics and hospitals in OSM (which
tarian OpenStreetMap Team (HOT) Indonesia, all used are based on the HOT Indonesia data set we used) have
data are publicly available. also levelled of since 2019. A few locations of hospi-
tals (3% of 221) and clinics (0.5% of 1516) were added
The analysis of network centrality and accessibility
since 2019 - however, we can still assume that the
was performed in Python 3.7 (Python Development
locations of these health sites were sufficiently com-
Team, 2020) and QGIS (QGIS Development Team,
plete for our analysis. As mentioned above, informa-
2020). Handling of the network data was performed by
tion about bed capacity was incomplete.
the Python OSMnx (Boeing, 2017), betweenness in-
dicators were calculated by NetworKit (Staudt et al.,
2016) and isochrones were calculated by calls to the 3.2 Network analysis
openrouteservice API (HeiGIT, 2020) via the Python
module openrouteservice 2.2.3, using the car profile Nearly a quarter of all nodes and of the edges were af-
and standard speed limits. In addition, the following fected by the flood event, which split the network into
python modules were used: fiona 1.8.13, pandas 1.0.1, one main graph and several subgraphs. In total, 34,027
numpy 1.18.1, shapely 1.7.0, geopandas 0.7.0, rtree nodes were flooded and therefore no longer passable.
0.9.4, matplotlib 3.2.0, pyyaml 5.3, ogr2osm, rasterio Effects of the flood event on betweenness centrality
1.1.3, area 1.1.1 and rasterstats 0.14.0. there relatively small (cf. figure 4). A few nodes in the
center of the city gained in betweenness centrality but
The analysis of the data quality was performed in R (R
on average the value decreased slightly from 0.00004
Core Team, 2021), using the packages sf (Pebesma,
to 0.00002. Most of the nodes ( 75 percent) did not
2018), RCurl (Temple Lang, 2021), geojsonio (Cham-
change in value or only changed by a small amount
berlain and Teucher, 2021), tidyverse (Wickham et al.,
of -/+0.0005, which means that these nodes had an in-
2019), ggplot2 (Wickham, 2016) and ggpubr (Kassam-
creasing or decreasing traffic volume of up to 0.05 per-
bara, 2020). R code of the analysis is available at https:
cent.
//gitlab.gistools.geog.uni-heidelberg.de/giscience/
big-data/ohsome/ohsome-api-analysis-examples/ Effects of the flood event on HC were a bit more pro-
completeness_highway_healthsites_jakarta. nounced than for BC (cf. figure 4). More than 60 per-
cent of the remaining 111,379 nodes changed their HC
value by less than -/+0.2, which indicates that most
of the nodes and the major part of the network, re-
spectively, maintained their functionality with respect
to the provision of fast access. Strongest losses in HC
AGILE: GIScience Series, 2, 4, 2021 | https://doi.org/10.5194/agile-giss-2-4-2021 4 of 11Betweenness centrality Harmonic closeness centrality
OSM contributions Jakarta Scenarios Normal Flooded Scenarios Normal Flooded
Highway
Other Unclassified Tertiary Primary Motorway 1e+05 1e+05
Service Residential Secondary Trunk
15000
Length [km]
10000
# nodes
# nodes
1e+03 1e+03
5000
0
2010 2015 2020
1e+01 1e+01
Health sites
1500 0.000 0.001 0.002 0.003 0.004 0 1 2
Betweenness centrality Harmonic closeness centrality
Count
1000
500
Figure 4. Histogram of BC and HC values for normal con-
0
2010 2015 2020
ditions and the flood event. The dashed lines represent the
mean of the distribution: grey: normal, black: flooded - for
Hospitals Clinics
betweenness centrality the two lines cannot be distinguished
due to the small difference in mean.
Health sites with capacity information
1500
clearer (cf. figure 5). The value of about 50 percent
Count
1000
of these nodes decreased to a degree that indicated that
500 their high importance within the road framework could
not be maintained. Particularly affected by the flood as
0
2010 2015 2020 well as by the loss of importance, were the connect-
ing roads to the north-west and to the south. The city
Figure 2. Intrinsic data quality assessment for relevant OSM centre area, on the other hand, even gained in impor-
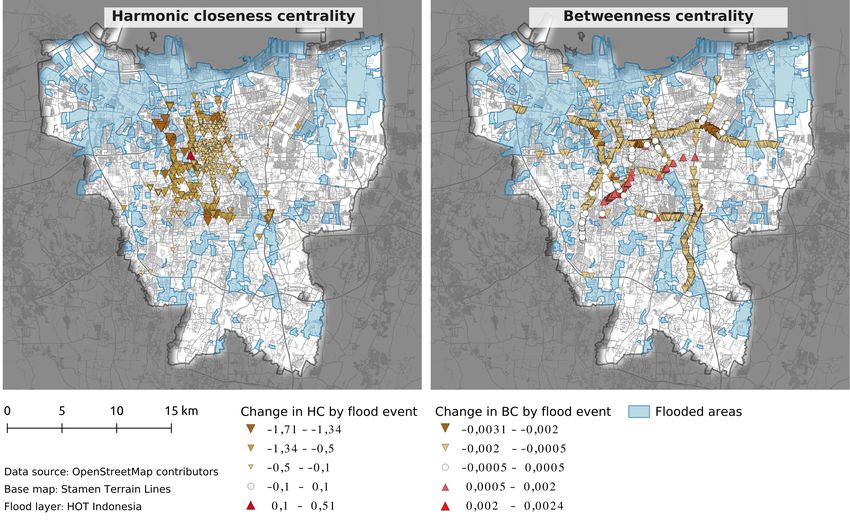
feature classes. tance in some cases. Around 4.7 percent (69 nodes) of
the small foreground network increased in BC value
(0.0005 - 0.0025). The nodes were located particularly
OSM active users Jakarta
Highway in the area close to the city centre on the east-west con-
200 nection, running in parallel to roads which lost impor-
150 tance. The sameness ratio between the normal and the
Active users
100
flooded situation was 0.62 for BC.
50
For the small foreground network of the top one per-
cent HC values nodes concentrate mainly to the west-
0
2010 2015 2020 ern inner-city area (cf. Fig. 5). Almost 30 percent of the
nodes experienced such a strong importance decrease
Amenity by the flood event, that the respective nodes were no
250
longer part of the small foreground network. Nodes lo-
200
cated in the centre of the city decreased in HC value
Active users
150 too, but belonged still to the small foreground network
100 - i.e. they were still of high importance for a fast supply
50
within the city. This indicates a core maintenance and
0
resilience of the road network for the largest sub-graph.
2010 2015 2020 One node located in the city center gained strongly in
importance, the HC value changed from 0.51 to 2.18
- this node might be especially sensitive to traffic con-
Figure 3. Intrinsic data quality assessment: number of active
OSM contributors per month for relevant feature classes.
gestion. The sameness ratio between the normal and
the flooded situation was 0.69 for HC.
value occurred in nodes located near the city border. 3.3 Accessibility analysis
This might be partly due to the artificial clipping of
the road network at the administrative boundary, since Hospitals and clinics in Jakarta were mainly concen-
this limited the possibility to bypass flooded areas near trated in the city center and western and southern parts
the city boundary. On average the HC value decreased of the city. The concentration of health services was
from 0.25 to 0.13. further amplified since the hospitals and clinics in these
For the small foreground network - representing the top locations had also the highest bed capacities. Due to
one percent of the BC values - effects on BC become the flood event, 30 (15%) hospitals and 349 (25%) clin-
AGILE: GIScience Series, 2, 4, 2021 | https://doi.org/10.5194/agile-giss-2-4-2021 5 of 11Figure 5. Flood impact on the BC (left) and HC (right) related small foreground network and the functionality of the main road
structure considering the frequency of crossed locations based on the car fastest routing profile within the administrative city borders.
ics were affected and were considered as no longer represent parks or areas with restricted access. From
functional for our analysis. This led to a reduction of the majority of the urban area and of the urban popu-
12,000 (16.6%) and 34,500 (25.8%) beds in hospitals lation the closest hospital was even accessible within
and clinics respectively. five minutes. The flooding had direct as well as indi-
rect impact on accessibility to health sites. Directly af-
fected were the flooded areas which were considered
Scenario Normal Flooded no longer passable - in total 2.75 million inhabitants
clinic hospital (25.6% of the total population) lived in those areas.
Indirect effects were caused by detours necessary to
9
avoid flooded areas. These indirect impacts lead to an
in travel time to health site
increase of travel time by five minutes for the inhabi-
Population [mio.]
6 tants of parts of the city. In the north-western part of
the city, north of the area most affected by the flood,
3 an additional travel time of up to ten minutes occurred
in some areas. Small spatial fragments close to the ad-
0
ministrative city border were also subject to an addi-
0−5 5−10 10−15 15−20 20−25 25−30 0−5 5−10 10−15 15−20 20−25 25−30 tional travel time of more than ten minutes. In total
Time required to reach health site [min.] 1.36 million inhabitants were affected by an increase in
travel time to the nearest hospital from up to 5 minutes
Figure 6. Amount of city population with healthcare access to 5 to 10 minutes and 140,000 by an increase from 5
within specific time range: (left) access to at least one hospi- to 10 minutes travel time to 10 to 15 minutes. With re-
tal, (right) access to at least one clinic. The size of the acces- spect to the travel time to the nearest clinic the increase
sible area, for the normal respectively the flooded scenario,
by indirect effects was less severe: around 60,000 in-
were calculated by summing up the inhabitants for the dis-
solved isochrones for each time interval.
habitants had to face an increase from up to 5 to 5 to
10 minutes.
Under normal conditions almost from the entire area of The main roads near the city centre provided under
the city of Jakarta at least one hospital or one clinic was normal conditions access up to 10,000 beds within a 5-
accessible within a 10 to 15 minute car drive (c.f. 6). minute car drive, with bed availability in a five-minute
Exceptions were small areas at the city border, which
AGILE: GIScience Series, 2, 4, 2021 | https://doi.org/10.5194/agile-giss-2-4-2021 6 of 11drive decreasing towards the administrative boundary. 4.2 Accessibility analysis
The effect of the flood event on accessible to bed ca-
pacity was spatially heterogeneous (cf. Fig. 7). Espe- In terms of travel time, access to health facilities re-
cially the northern part of Jakarta was affected with a mained the same in most parts of the city, in case of
reduction of more than 0.1 beds per person per square the 2013 flood scenario. This is partly due to the given
kilometre. In the southern section, the flood caused spatial distribution of facilities and partly due to the
changes of varying intensity. available choice of amenities. The areas that had to
consider additional travel time were mostly located in
the immediate vicinity of the flood. Accessibility for
4 Discussion areas not affected dropped only to a relatively small
amount, indicating again a relatively high resilience of
the system. However, bed capacity in five-minute driv-
4.1 Network analysis ing time was distributed unevenly across the city, a sit-
uation that was further aggravated by the flood event.
Due to the direct and indirect impacts of the 2013 In some cases, the flood event lead to a significant loss
flood, the road network broke up into sub-graphs. of supply, especially in the north-western part of the
However, the major part of the network remained in- city where health supply was low already under nor-
tact. The network experienced inevitably a reduction mal conditions.
functionality, as road segments actively became im-
passable. Some non flooded areas were cut off from 4.3 Limitations
the main part of the city and from the main supply.
BC captured the characteristics of the road network re- Limitations of our analysis can be grouped into the fol-
garding efficient and fastest possible routing between lowing categories: 1) data quality, 2) assumptions and
all places within the city, based on a car driving fastest indicators. With respect to data quality the road net-
routing profile. The importance of the city centre in- work underlying the analysis could be considered satis-
creased in case of the 2013 flooding. The flood caused fyingly complete. The same could be assumed for clin-
a shift of the highest centrality values, which means ics and hospitals. Attribute completeness with respect
that the usual, previously used routes were no longer to the bed capacity of clinics and hospital was sub-
the fastest connections and the traffic flow would shift optimal. The simple imputation by the mean might not
to other roads. This implied a stronger traffic concen- be sufficient to draw strong conclusions. The distribu-
tration on the main roads close to the city centre, cov- tion of bed capacities was negatively skewed (highest
ering a much smaller area - since the highest centrality count for category > 500) for hospitals and positively
values were spatially much closer and more compact skewed (highest count for category < 50) for hospitals.
during this flood. Such a transformation can lead to One might speculate that larger hospitals and clinics
a concentration of traffic and consequently to conges- were mapped first given their importance and promi-
tion. nence - in this case the imputation of the mean might
In comparison, HC identified locations that were on av- have resulted in too high bed capacities.
erage fastest to reach, i.e. good supply locations within Results for accessibility of hospitals without consid-
the city. These places could be used as contact points ering the supply side were not affected by that issue.
for people seeking help, but also to better coordinate However, accessibility has been calculated using the
the supply for the affected areas. The high proportion speed limit as travel speed - this is unrealistic for traf-
of nodes with a very low HC value, concentrated in the fic jams which are not atypical for a mega-city such
outskirts, revealed that access to them would become as Jakarta. So we have to assume that accessibility is
more time-consuming. The city centre and the main lower than suggested by our results - of course also
traffic junctions within the centre showed up in this depending on the time of the day and the weekday.
respect. Access to the city centre was reduced in the Travel speed adjustments due to traffic conditions are
flood scenario, indicated by the decrease in HC value principle possible in the openrouteservice but require
of the nodes along the main roads, which were par- realistic estimates based on observational data such as
ticularly affected by the indirect flood effects. Some Google Directions (e.g. Keller et al. (2020)). For a ma-
parts of the main roads were no longer passable and jor flood event one has to consider that traffic might
were not able to maintain their function of providing be different from normal situation so traffic simulation
fast supply. However, due to the large number of rout- models might be required. Another shortcoming of our
ing possibilities between the outer areas and the city analysis is that we estimated connectivity and acces-
centre, the city centre was still able to provide its main sibility by means of car transport - as much traffic in
supply functions for the entire city. mega-cities such as Jakarta relies on public and semi-
public transport such as mini-busses this presumably
has also led to too high accessibility estimates. While
AGILE: GIScience Series, 2, 4, 2021 | https://doi.org/10.5194/agile-giss-2-4-2021 7 of 11Figure 7. Cumulative amount of available hospital beds per person per square kilometre accessible within a 5-minute car drive: (left) normal scenario, (right) 2013 flood impact. Isochrone boundaries were dissolved by health site category and travel distance to generate all available isochrone fragments. The cumulative bed capacity of each fragment was set in relation to the respective population density. The flood impact was received by calculating the difference for each isochrone. Negative values indicate the loss of available beds per person per square kilometre. Since the five minutes isochrones of some hospitals and clinics decreased due to the direct and indirect effects of the flood the bed to inhabitant relationship increased in these zones relative to the normal situation since less inhabitants could reach the hospitals and clinics. these factors require more research, our results provide stricted public and private care may decrease, result- still a first estimate based on freely available data. Fac- ing in general emergency care for all affected people. tors influencing travel speed will presumably vary spa- Financial resources from NGOs, international and na- tially, how much accessibility assessments have to take tional institutions may also help to cover the costs nec- this into account - or if it is sufficient to estimate con- essary to ensure the provision of care. version factors - is up for future research. We have restricted our analysis to the administrative Demand for health care was estimated simply based on boundaries. However, the road network and the de- population density. However, need for health care dif- mand for health care extends beyond those limits. One fers with age as well as with income and education. the one hand, accessibility in some parts might be a Estimating and incorporating these effects was beyond bit higher due to the neglected possibility to bypass ar- the scope of this study but should be included in up- eas affected by flooding by taking routes outside the coming work. With the focus on spatial distribution administrative boundaries. On the other hand, average and mobility-based access to healthcare, the individ- travel times to health sites can be expected to increase ual acceptance and affordability of care services was significantly if considering the outskirts of Jakarta, not included here. Consequently, then analysing the re- since density of health services is clearly decreasing sults, it must be kept in mind that various aspects such with increasing distance to the city center. as gender and age, costs as well as ethnic and reli- A further assumption we made for our analysis was gious backgrounds also have an influence (Penchansky that clinics and hospitals would be completely out of and Thomas, 1981; Jalil et al., 2018). Healthcare in In- use if they would be flooded. Some of those places donesia, in particular based on "out-of-pocket" financ- might be still functional at a reduced capacity. As long ing (WHO, 2017), can lead to limited access for lower as no data is available with that respect we decided to income groups. In the event of a disaster, however, re- provide conservative estimates based on the assump- AGILE: GIScience Series, 2, 4, 2021 | https://doi.org/10.5194/agile-giss-2-4-2021 8 of 11
tion that the health sites would either be not functional              viding as access to the flood map data as well as to the most
due to damage by the flood or that they could not be                   recent version of the health sites data base. Furthermore we
reached by emergencies and hospital/clinic staff.                      would like to thank the GIScience Heidelberg team members
                                                                       and the HeiGIT Smart Location-based Services and Navi-
                                                                       gation, Big Spatial Data Analytics and Geoinformation for
                                                                       Humanitarian Aid teams for fruitful discussions and support.
5   Conclusion and outlook

Planning for severe disasters requires an estimation of                References
the effects of the event on health sites and their ac-
cessibility. We have demonstrated that it is possible to               Abshirini, E., Koch, D., and Legeby, A.: Flood hazard and
address such affects by publicly available data. While                 its impact on the resilience of cities: An accessibility-based
information on the flood extent was not publicly avail-                approach to amenities in the city of Gothenburg, Sweden,
able, publicly available remote sensing data such as the               in: 11th International Space Syntax Symposium, SSS 2017,
Sentinel products (Malenovský et al., 2012) could be                   Lisbon, Portugal, 3 July 2017 through 7 July 2017, pp. 36–1,
used to produce this input data.                                       2017.

Our analysis indicated parts of the non-flooded road                   ADPC: Flood preparedness initiatives of high-
                                                                       risk communities of Jakarta, Tech. Rep. 27, Asian
network that would decrease in importance and parts
                                                                       Disaster  Preparedness    Center,     Bangkok,     Thai-
that would increase in importance. If roads gaining in
                                                                       land,        http://www.adpc.net/igo/category/ID226/doc/
importance are not designed for increased travel this                  2013-c28Jbn-ADPC-Safer_Cities_27.pdf, 2010.
might lead to traffic congestion with negative effects
                                                                       AHA center: Situation Updates No. 3: Massive Floods in
on accessibility on health sites. With respect to accessi-
                                                                       Greater Jakarta Area - Indonesia., Tech. rep., AHA center,
bility of clinics and hospitals we were able to pinpoint               https://reliefweb.int/sites/reliefweb.int/files/resources/AHA_
areas what would suffer most from a similar event.                     Situation_Updates_No3_Greater_Jakarta_Floods_FINAL.
While our analysis captures only the 2013 flood event,                 pdf, 2020.
it can be assumed that affected areas would be sim-                    Ahmadzai, F., Rao, K., and Ulfat, S.: Assessment
ilar for other flood events. Flooded areas during the                  and modelling of urban road networks using Inte-
1996, 2002 and 2007 event showed very similar pat-                     grated Graph of Natural Road Network (a GIS-based
tern to the 2013 flood event (c.f. ADPC, 2010; Texier,                 approach), Journal of Urban Management, 8, 109–125,
2008) - therefore, our analysis of the 2013 flood event                https://doi.org/10.1016/j.jum.2018.11.001, 2019.
should provide important insights for city administra-                 Alderman, K., Turner, L. R., and Tong, S.: Floods and human
tion, health services and NGOs. While the effect of cli-               health: A systematic review, Environment International, 47,
mate change on flood risk is highly uncertain (Budiy-                  37–47, https://doi.org/10.1016/j.envint.2012.06.003, 2012.
ono et al., 2016), raising sea level and land subsidence               Arrighi, C., Pregnolato, M., Dawson, R., and Castelli,
are likely to increase flood risk (Budiyono et al., 2016;              F.: Preparedness against mobility disruption by floods,
Takagi et al., 2016) and damage (Fajar Januriyadi et al.,              Science of The Total Environment, 654, 1010–1022,
2018) in Jakarta. Disaster preparedness is therefore of                https://doi.org/10.1016/j.scitotenv.2018.11.191, 2019.
high importance. Our results highlight that not only the               Baker, J. L.: Climate change, disaster risk, and the urban
directly affected areas but also indirect effects that in-             poor: cities building resilience for a changing world, The
crease pressure on the health system should be con-                    World Bank, 2012.
sidered in spatial planning. While OSM data quality is                 Barron, C., Neis, P., and Zipf, A.: A Comprehen-
varying between regions and should always be care-                     sive Framework for Intrinsic OpenStreetMap Qual-
fully checked, we assume that our approach can be                      ity Analysis, Transactions in GIS, 18, 877–895,
transferred to other mega-cities and urban areas and                   https://doi.org/10.1111/tgis.12073, 2014.
help to prepare for upcoming disasters.                                Boeing, G.: OSMnx: New methods for acquiring, construct-
Future work could rerun the analysis for different his-                ing, analyzing, and visualizing complex street networks,
toric flood events or flood simulations to study the re-               Computers, Environment and Urban Systems, 65, 126–139,
lationship between severity of the flood event and the                 https://doi.org/10.1016/j.compenvurbsys.2017.05.004, 2017.
effects on the road network and accessibility of health                Brandes, U.: A Faster Algorithm for Betweenness Centrality,
centers. Longer term goal is the establishment of a                    Journal of Mathematical Sociology, 25, 163–177, 2001.
web-service to allow city administrations, emergency                   Budiyono, Y., Aerts, J. C. J. H., Tollenaar, D., and Ward, P. J.:
agencies and NGOs to estimate the vulnerability of ur-                 River flood risk in Jakarta under scenarios of future change,
ban systems - specifically with regard to health care                  Natural Hazards and Earth System Sciences, 16, 757–774,
accessibility - by floods and other natural disasters.                 https://doi.org/10.5194/nhess-16-757-2016, 2016.
                                                                       Chamberlain, S. and Teucher, A.: geojsonio: Convert Data
                                                                       from and to ’GeoJSON’ or ’TopoJSON’, https://CRAN.
Acknowledgements. We would like to thank HOT Indonesia                 R-project.org/package=geojsonio, r package version 0.9.4,
as well as the Jakarta Disaster Management Agency for pro-             2021.

AGILE: GIScience Series, 2, 4, 2021 | https://doi.org/10.5194/agile-giss-2-4-2021                                               9 of 11
Coles, D., Yu, D., Wilby, R. L., Green, D., and Keller, S., Gabriel, R., and Guth, J.: Machine Learn-
Herring, Z.: Beyond ‘flood hotspots’: Modelling ing Framework for the Estimation of Average Speed
emergency service accessibility during flooding in in Rural Road Networks with OpenStreetMap Data, IS-
York, UK, Journal of Hydrology, 546, 419–436, PRS International Journal of Geo-Information, 9, 638,
https://doi.org/10.1016/j.jhydrol.2016.12.013, 2017. https://doi.org/10.3390/ijgi9110638, 2020.
Degrossi, L. C., Albuquerque, J. P. d., Rocha, R. d. S., and Luo, W. and Wang, F.: Measures of Spatial Accessi-
Zipf, A.: A Framework of Quality Assessment Methods for bility to Health Care in a GIS Environment: Synthe-
Crowdsourced Geographic Information : a Systematic Liter- sis and a Case Study in the Chicago Region, Environ-
ature Review, in: Proceedings of the 14th ISCRAM Confer- ment and Planning B: Planning and Design, 30, 865–884,
ence, pp. 21–24, issue: May, 2017. https://doi.org/10.1068/b29120, 2003.
Demšar, U., Špatenková, O., and Virrantaus, K.: Lyons, S.: The Jakarta floods of early 2014: Ris-
Identifying Critical Locations in a Spatial Network ing risks in one of the World’s fastest sinking
with Graph Theory, Transactions in GIS, 12, 61–82, cities, Tech. rep., Liège Université SEM, http://labos.
https://doi.org/10.1111/j.1467-9671.2008.01086.x, 2008. ulg.ac.be/hugo/wp-content/uploads/sites/38/2017/11/
Doling, J.: Accessibility and strategic planning, Tech. Rep. The-State-of-Environmental-Migration-2015-103-120.pdf,
Research Memo 75 Monograph, Birmingham: Centre for Ur- 2015.
ban and Regional Studies, University of Birmingham, 1979. Malenovský, Z., Rott, H., Cihlar, J., Schaepman, M. E.,
Eckle, M., de Albuquerque, J. P., Herfort, B., Zipf, A., Leiner, García-Santos, G., Fernandes, R., and Berger, M.: Sen-
R., Wolff, R., and Jacobs, C.: Leveraging OpenStreetMap to tinels for science: Potential of Sentinel-1, -2, and -3
Support Flood Risk Management in Municipalities: A Proto- missions for scientific observations of ocean, cryosphere,
type Decision Support System., in: ISCRAM, 2016. and land, Remote Sensing of Environment, 120, 91–101,
https://doi.org/10.1016/j.rse.2011.09.026, iSBN: 0034-4257,
Fajar Januriyadi, N., Kazama, S., Riyando Moe, I., and Kure, 2012.
S.: Evaluation of future flood risk in Asian megacities: a case
study of Jakarta, Hydrological Research Letters, 12, 14–22, Octavianti, T. and Charles, K.: The evolution of
https://doi.org/10.3178/hrl.12.14, 2018. Jakarta’s flood policy over the past 400 years: The
lock-in of infrastructural solutions, Environment
Freeman, L. C.: A set of measures of centrality based on be- and Planning C: Politics and Space, 37, 1102–1125,
tweenness, Sociometry, pp. 35–41, 1977. https://doi.org/10.1177/2399654418813578, 2019.
Gauthier, P., Furno, A., and Faouzi, N.-E. E.: Road Network Opsahl, T., Agneessens, F., and Skvoretz, J.: Node
Resilience: How to Identify Critical Links Subject to Day- centrality in weighted networks: Generalizing de-
to-Day Disruptions, Transportation Research Record, 2672, gree and shortest paths, Social Networks, 32, 245–251,
54–65, https://doi.org/10.1177/0361198118792115, 2018. https://doi.org/10.1016/j.socnet.2010.03.006, 2010.
Geldsetzer, P., Reinmuth, M., Ouma, P. O., Lautenbach, OSM Wiki: OpenStreetMap Wiki tag:amenity=clinic, https:
S., Okiro, E. A., Bärnighausen, T., and Zipf, A.: Map- //wiki.openstreetmap.org/wiki/Tag:amenity%3Dclinic/, [On-
ping physical access to health care for older adults in sub- line; accessed 28-April-2021], 2021a.
Saharan Africa and implications for the COVID-19 response:
a cross-sectional analysis, The Lancet Healthy Longevity, OSM Wiki: OpenStreetMap Wiki key:highway, https:
1, e32–e42, https://doi.org/https://doi.org/10.1016/S2666- //wiki.openstreetmap.org/wiki/Key:highway/, [Online; ac-
7568(20)30010-6, 2020. cessed 28-April-2021], 2021b.
Green, D., Yu, D., Pattison, I., Wilby, R., Bosher, L., Pa- OSM Wiki: OpenStreetMap Wiki tag:amenity=hospital,
tel, R., Thompson, P., Trowell, K., Draycon, J., Halse, https://wiki.openstreetmap.org/wiki/Tag:amenity%
M., Yang, L., and Ryley, T.: City-scale accessibility 3Dhospital/, [Online; accessed 28-April-2021], 2021c.
of emergency responders operating during flood events, O’Sullivan, D., Morrison, A., and Shearer, J.: Using desk-
Natural Hazards and Earth System Sciences, 17, 1–16, top GIS for the investigation of accessibility by pub-
https://doi.org/10.5194/nhess-17-1-2017, 2017. lic transport: an isochrone approach, International Jour-
Guagliardo, M. F.: Spatial accessibility of primary care: nal of Geographical Information Science, 14, 85–104,
concepts, methods and challenges, International Journal of https://doi.org/10.1080/136588100240976, 2000.
Health Geographics, p. 13, 2004. Overpass-Turbo Development Team: Overpass-Turbo, https:
HeiGIT: openrouteservice, https://openrouteservice.org, //overpass-turbo.eu/, [Online; accessed 10-June-2020], 2020.
[Online; accessed 29-September-2020], 2020. Papilloud, T., Röthlisberger, V., Loreti, S., and Keiler,
Jalil, I. A., Rasam, A. R. A., Adnan, N. A., Saraf, M.: Flood exposure analysis of road infrastructure –
N. M., and Idris, A. N.: Geospatial network analysis Comparison of different methods at national level, Inter-
for healthcare facilities accessibility in semi-urban areas, national Journal of Disaster Risk Reduction, 47, 101 548,
in: 2018 IEEE 14th International Colloquium on Sig- https://doi.org/10.1016/j.ijdrr.2020.101548, https://www.
nal Processing Its Applications (CSPA), pp. 255–260, sciencedirect.com/science/article/pii/S221242091931413X,
https://doi.org/10.1109/CSPA.2018.8368722, 2018. 2020.
Kassambara, A.: ggpubr: ’ggplot2’ Based Publication Ready Pebesma, E.: Simple Features for R: Standardized Sup-
Plots, https://CRAN.R-project.org/package=ggpubr, r pack- port for Spatial Vector Data, The R Journal, 10, 439–446,
age version 0.4.0, 2020. https://doi.org/10.32614/RJ-2018-009, 2018.
AGILE: GIScience Series, 2, 4, 2021 | https://doi.org/10.5194/agile-giss-2-4-2021 10 of 11Penchansky, R. and Thomas, J. W.: The Concept of Access: Hester, J., Kuhn, M., Pedersen, T. L., Miller, E., Bache, S. M.,
Definition and Relationship to Consumer Satisfaction, Med- Müller, K., Ooms, J., Robinson, D., Seidel, D. P., Spinu, V.,
ical Care, 19, 127–140, https://doi.org/10.1097/00005650- Takahashi, K., Vaughan, D., Wilke, C., Woo, K., and Yutani,
198102000-00001, 1981. H.: Welcome to the tidyverse, Journal of Open Source Soft-
Python Development Team: Python, https://www.python. ware, 4, 1686, https://doi.org/10.21105/joss.01686, 2019.
org/, [Online; accessed 10-June-2020], 2020. WorldPop: Indonesia - Population
QGIS Development Team: QGIS Geographic Information Counts, https://data.humdata.org/dataset/
System, Open Source Geospatial Foundation, http://qgis.org, worldpop-population-counts-for-indonesia, [Online;
2020. accessed 29-September-2020], 2020.
R Core Team: R: A Language and Environment for Statistical Zhang, Y., Wang, X., Zeng, P., and Chen, X.: Central-
Computing, R Foundation for Statistical Computing, Vienna, ity Characteristics of Road Network Patterns of Traf-
Austria, https://www.R-project.org/, 2021. fic Analysis Zones, Transportation Research Record: Jour-
nal of the Transportation Research Board, 2256, 16–24,
Raifer, M., Troilo, R., Kowatsch, F., Auer, M., Loos, L., https://doi.org/10.3141/2256-03, 2011.
Marx, S., Przybill, K., Fendrich, S., Mocnik, F.-B., and Zipf,
A.: OSHDB: a framework for spatio-temporal analysis of
OpenStreetMap history data, Open Geospatial Data, Soft-
ware and Standards, 4, https://doi.org/10.1186/s40965-019-
0061-3, 2019.
Rochat, Y.: Closeness centrality extended to unconnected
graphs: The harmonic centrality index, in: ASNA, EPFL-
CONF-200525, 2009.
Sabidussi, G.: The centrality index of a graph, Psychome-
trika, 31, 581–603, 1966.
Senaratne, H., Mobasheri, A., Ali, A. L., Capineri, C.,
and Haklay, M. M.: A review of volunteered geographic
information quality assessment methods, International
Journal of Geographical Information Science, 31, 139–
167, https://doi.org/10.1080/13658816.2016.1189556,
https://www.tandfonline.com/doi/full/10.1080/13658816.
2016.1189556, 2017.
Staudt, C. L., Sazonovs, A., and Meyerhenke, H.: NetworKit:
A tool suite for large-scale complex network analysis, Net-
work Science, 4, 508–530, 2016.
Takagi, H., Esteban, M., Mikami, T., and Fujii, D.: Projection
of coastal floods in 2050 Jakarta, Urban Climate, 17, 135–
145, https://doi.org/10.1016/j.uclim.2016.05.003, 2016.
Temple Lang, D.: RCurl: General Network (HTTP/FTP/...)
Client Interface for R, https://CRAN.R-project.org/package=
RCurl, r package version 1.98-1.3, 2021.
Texier, P.: Floods in Jakarta: when the extreme reveals
daily structural constraints and mismanagement, Disaster
Prevention and Management: An International Journal,
17, 358–372, https://doi.org/10.1108/09653560810887284,
https://www.emerald.com/insight/content/doi/10.1108/
09653560810887284/full/html, 2008.
Wang, J., Li, C., and Xia, C.: Improved centrality indica-
tors to characterize the nodal spreading capability in com-
plex networks, Applied Mathematics and Computation, 334,
388–400, https://doi.org/10.1016/j.amc.2018.04.028, 2018.
WHO: The Republic of Indonesia Health Sys-
tem Review, Tech. rep., World Health Organization,
https://apps.who.int/iris/bitstream/handle/10665/254716/
9789290225164-eng.pdf;sequence=1., 2017.
Wickham, H.: ggplot2: Elegant Graphics for Data Analy-
sis, Springer-Verlag New York, https://ggplot2.tidyverse.org,
2016.
Wickham, H., Averick, M., Bryan, J., Chang, W., McGowan,
L. D., François, R., Grolemund, G., Hayes, A., Henry, L.,
AGILE: GIScience Series, 2, 4, 2021 | https://doi.org/10.5194/agile-giss-2-4-2021 11 of 11You can also read