In vivo multi parametric manganese enhanced MRI for detecting amyloid plaques in rodent models of Alzheimer's disease - Nature
←
→
Page content transcription
If your browser does not render page correctly, please read the page content below
www.nature.com/scientificreports
OPEN In vivo multi‑parametric
manganese‑enhanced MRI
for detecting amyloid plaques
in rodent models of Alzheimer’s
disease
Eugene Kim1*, Davide Di Censo2, Mattia Baraldo3, Camilla Simmons1, Ilaria Rosa2,
Karen Randall1, Clive Ballard4, Ben R. Dickie5, Steven C. R. Williams6, Richard Killick3,7 &
Diana Cash1,7
Amyloid plaques are a hallmark of Alzheimer’s disease (AD) that develop in its earliest stages. Thus,
non-invasive detection of these plaques would be invaluable for diagnosis and the development and
monitoring of treatments, but this remains a challenge due to their small size. Here, we investigated
the utility of manganese-enhanced MRI (MEMRI) for visualizing plaques in transgenic rodent models
of AD across two species: 5xFAD mice and TgF344-AD rats. Animals were given subcutaneous
injections of MnCl2 and imaged in vivo using a 9.4 T Bruker scanner. MnCl2 improved signal-to-noise
ratio but was not necessary to detect plaques in high-resolution images. Plaques were visible in all
transgenic animals and no wild-types, and quantitative susceptibility mapping showed that they
were more paramagnetic than the surrounding tissue. This, combined with beta-amyloid and iron
staining, indicate that plaque MR visibility in both animal models was driven by plaque size and iron
load. Longitudinal relaxation rate mapping revealed increased manganese uptake in brain regions of
high plaque burden in transgenic animals compared to their wild-type littermates. This was limited
to the rhinencephalon in the TgF344-AD rats, while it was most significantly increased in the cortex
of the 5xFAD mice. Alizarin Red staining suggests that manganese bound to plaques in 5xFAD mice
but not in TgF344-AD rats. Multi-parametric MEMRI is a simple, viable method for detecting amyloid
plaques in rodent models of AD. Manganese-induced signal enhancement can enable higher-resolution
imaging, which is key to visualizing these small amyloid deposits. We also present the first in vivo
evidence of manganese as a potential targeted contrast agent for imaging plaques in the 5xFAD model
of AD.
Abbreviations
AD Alzheimer’s disease
Aβ Beta-amyloid
CNR Contrast-to-noise ratio
DAB 3,3′-Diaminobenzidine
FWE Family-wise error
1
BRAIN Centre (Biomarker Research and Imaging for Neuroscience), Department of Neuroimaging, King’s College
London, The James Black Centre, 125 Coldharbour Lane, London SE5 9NU, UK. 2Department of Life, Health and
Environmental Sciences, University of L’Aquila, Piazzale Salvatore Tommasi 1, 67100 L’Aquila, Italy. 3Department
of Old Age Psychiatry, Institute of Psychiatry, Psychology & Neuroscience, King’s College London, 16 De Crespigny
Park, London SE5 8AF, UK. 4The University of Exeter Medical School, Medical School Building, St. Luke’s Campus,
Magdalen Road, Exeter EX1 2LU, UK. 5Division of Neuroscience and Experimental Psychology, Faculty of Biology
Medicine and Health, Geoffrey Jefferson Brain Research Centre, Manchester Academic Health Science Centre,
The University of Manchester, Stopford Building, 99 Oxford Road, Manchester M13 9PG, UK. 6Department of
Neuroimaging, Centre for Neuroimaging Sciences, King’s College London, De Crespigny Park, London SE5 8AF,
UK. 7These authors jointly supervised this work: Richard Killick and Diana Cash. *email: eugene.kim@kcl.ac.uk
Scientific Reports | (2021) 11:12419 | https://doi.org/10.1038/s41598-021-91899-5 1
Vol.:(0123456789)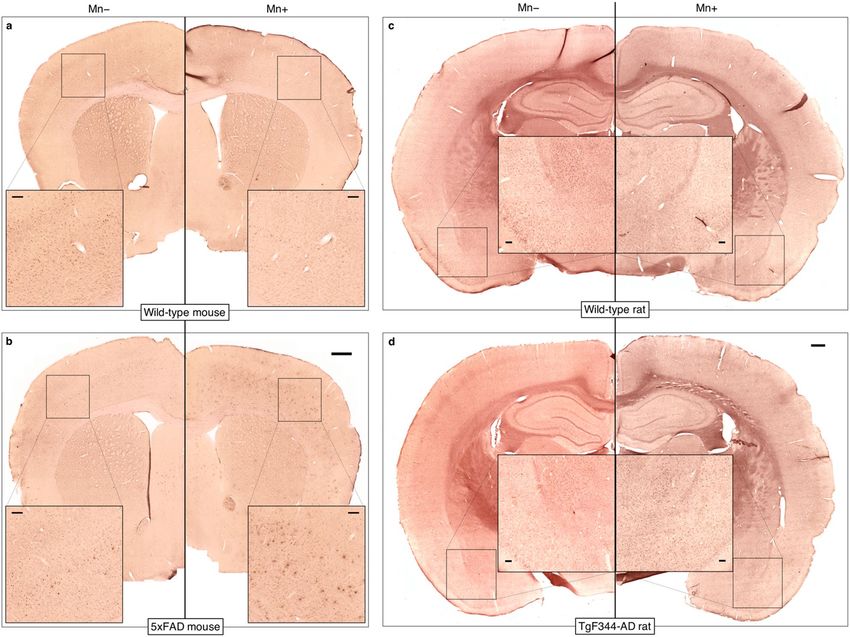
www.nature.com/scientificreports/
GBCA Gadolinium-based contrast agents
MRI Magnetic resonance imaging
MEMRI Manganese-enhanced MRI
MGE Multi-gradient-echo
Mn− MnCl2-naïve
Mn+ Treated with MnCl2
MP2RAGE Magnetization prepared 2 rapid acquisition of gradient echoes
PBS Phosphate-buffered saline
QSM Quantitative susceptibility mapping
R1 Longitudinal relaxation rate
R1norm Temporalis-normalized R1
R2* Effective transverse relaxation rate
ROI Region-of-interest
SNR Signal-to-noise ratio
SWI Susceptibility-weighted image
T1 Longitudinal relaxation time
TBS Tris-buffered saline
TE Echo time
TI Inversion time
UTE Ultra-short echo time
Senile plaques (extracellular deposits of beta-amyloid (Aβ) in the brain) are one of the two neuropathological
hallmarks of Alzheimer’s disease (AD) and develop early in the disease progression. However, early diagnosis of
AD is limited by the difficulty of visualizing Aβ plaques in vivo. Currently, a definitive diagnosis of Alzheimer’s
disease (AD) is only made postmortem by observing Aβ plaques and neurofibrillary tangles (intracellular deposits
of hyperphosphorylated forms of the tau protein) in brain sections.
A diagnosis of AD during life can be greatly aided by measurement of cerebrospinal fluid levels of Aβ1–42, tau,
and phosphorylated t au1; and by positron emission tomography detection of radioactive Aβ ligands such as P iB2.
Although highly accurate3, the implementation of PET is restricted by high cost, limited accessibility, and inva-
siveness (ionizing radiation). Thus, non-invasive and repeatable methods of detecting plaques, or other facets of
AD pathology, are needed to provide biomarkers of AD for refining diagnosis and assessing therapeutic efficacy.
MRI has shown great potential in filling this n eed4, but in vivo MR imaging of amyloid plaques remains
challenging due to the small size of plaques and the relatively low sensitivity of MRI.
There are various rodent models of AD that develop Aβ deposits similar to senile plaques found in human
AD. Previous preclinical studies on in vivo MR imaging of amyloid plaques involved complex pulse s equences5 or
administration of gadolinium-based contrast agents (GBCA) to increase the signal-to-noise ratio (SNR). GBCAs
enable high-resolution imaging at reduced scan times, but complex procedures are required to deliver them to
the brain parenchyma, e.g., stereotactic surgery for intracerebroventricular injection6 or the use of ultrasound
and microbubbles to transiently open the blood–brain b arrier7.
Like Gd(III), manganese(II) is paramagnetic and enhances MR signal by shortening longitudinal relaxation
times (T1), but manganese-based contrast agents have lower relaxivities (i.e., produce a smaller signal enhance-
ment per unit of contrast agent concentration) than GBCAs8. Unlike GBCAs, MnCl2, a contrast agent commonly
used for manganese-enhanced MRI (MEMRI), readily crosses the blood–brain barrier and, as a calcium analog,
is taken up by n eurons9. Thus, in addition to enhancing SNR and neuroanatomical contrast, MEMRI can provide
functional information. Accordingly, MEMRI has been used to probe AD-related disruption of neural activity
and shown both increased10,11 and d ecreased12,13 Mn(II) uptake in different mouse models.
An overview of the use of MEMRI in neurodegenerative models is given in the recent review article by Saar
and Koretsky14.
In this study, we investigated the feasibility of using Mn(II) as a GBCA alternative to enhance image contrast
and SNR to aid the in vivo visualization of amyloid plaques. We tested our MEMRI technique in two rodent
models of AD.
1. The well-characterized 5xFAD transgenic mouse model of AD, which express human APP with the Swedish
(K670N/M671L), Florida (I716V), and London (V717I) mutations and human PSEN1 with the M146L and
L286V mutations and start developing Aβ plaques from as early as two months of a ge15.
2. The TgF344-AD transgenic rat model of AD, which express human APP with the Swedish mutation and
human PSEN1 with the Δ exon 9 mutation and start developing Aβ plaques from as early as six months of
age16.
Methods
Experimental design. All experimental procedures involving animals were performed in accordance with
the UK Animals (Scientific Procedures) Act 1986 and with approval from the King’s College London animal
welfare ethical review body under the authorization of Project License P023CC39A. The study is reported in
accordance with ARRIVE guidelines.
All mice and rats were bred in in-house colonies. This study included eight 8–9.5-month-old 5xFAD mice, six
of their wild-type littermates, four 16.5–18.5-month-old TgF344-AD rats, and four of their wild-type littermates.
Half of the mice were male and half female across both genotypes, while all of the rats were male. Investigators
were not blinded to the animal genotype. A subset of six 5xFAD mice (three males and three females chosen
Scientific Reports | (2021) 11:12419 | https://doi.org/10.1038/s41598-021-91899-5 2
Vol:.(1234567890)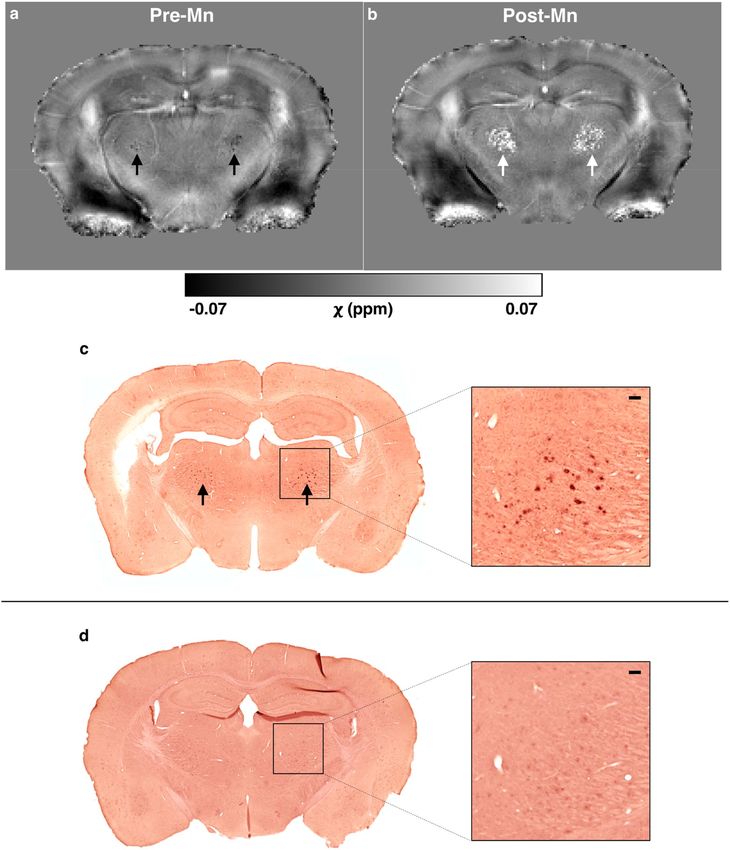
www.nature.com/scientificreports/
UTE MP2RAGE MGE
Parameter Mouse Rat Mouse Rat Mouse Rat
TE (ms) 0.008 0.008 2.5 2.7 5, 12, 19, 26 6.2, 14.85, 23.5, 32.15, 40.8
TR (ms) 3.75 3.75 7 7.05 250 150
TRMP2 (ms) n/a n/a 7000 9000 n/a n/a
TI (ms) n/a n/a 700, 3500 900, 3500 n/a n/a
FA (°) 3.9 3.9 7, 7 7, 9 50 30
BW (kHz) 81.5 81.5 40 50 40 40
Matrix 80 × 80 × 80 128 × 128 × 128 108 × 108 × 64 160 × 160 × 100 200 × 150 × 20 300 × 230 × 40
FOV (mm) 36 × 36 × 36 58 × 58 × 58 16.2 × 16.2 × 9.6 30.4 × 30.4 × 19 12 × 9 × 4.8 18 × 13.8 × 9.6
Averages 1 1 4 1 4 4
Scan time 1 m 15 s 3 m 13 s 33 m 18 m 60 m 1 h 50 m
Table 1. MRI sequence parameters. UTE ultra-short echo time, MP2RAGE magnetization prepared 2 rapid
acquisition of gradient echoes, MGE multi-gradient-echo, TE echo time, TR repetition time, TRMP2 MP2RAGE
segment repetition time, TI inversion time, FA flip angle, BW receiver bandwidth, FOV field-of-view.
randomly by hand) underwent baseline MRI scans. Immediately afterwards, these and all other animals received
s.c. injections of M
nCl2 (Sigma-Aldrich), once daily for 4 days. The mice received 0.15 mmol/kg/day (1.5 ml
of 0.1 M solution diluted in 1 ml of sterile 0.9% saline) for a cumulative dose of 0.6 mmol/kg; the rats received
0.075 mmol/kg/day (0.75 ml of 0.1 M solution diluted in 1 ml of sterile 0.9% saline) for a cumulative dose of
0.3 mmol/kg.
These doses were determined in a pilot study on a separate cohort of wild-type animals; a 0.6 mmol/kg cumu-
lative dose resulted in mild adverse effects in the rats, thus a lower dose was used for this study.
MEMRI was performed on all animals one day after the final M nCl2 injection. Immediately after scanning,
the animals were killed by transcardiac perfusion with heparinized saline and 4% formaldehyde. The fixed brains
were harvested for histological analysis.
MRI acquisition. All MRI experiments were performed on a 9.4 T Bruker BioSpec 94/20 controlled by
ParaVision (6.0.1 for mice and 7.0.0 for rats) at the BRAIN Centre (http://brain-imaging.org) at King’s College
London. An 86-mm volume coil was used in combination with species-specific, receive-only 2 × 2 surface array
coils designed for mouse or rat brain imaging. The animals were anesthetized with isoflurane (5% induction,
~ 2% maintenance) in medical air (1 L/min) + medical oxygen (0.4 L/min). During scanning, the isoflurane level
was adjusted to maintain the respiration rate at 75–85 breaths/min for mice and 50–60 breaths/min for rats.
Body temperature was monitored with a rectal probe and maintained at 37 ± 0.5 °C using a warm water circula-
tion system (Small Animal Instruments, Inc., Stony Brook, NY, USA).
Images were acquired using the following sequences (sequence parameters are summarized in Table 1).
1. 3D ultra-short echo time (UTE).
2. Magnetization prepared 2 rapid acquisition of gradient echoes (MP2RAGE).
3. High-resolution 3D multi-gradient-echo (MGE).
The UTE and MP2RAGE sequences provided whole brain coverage, while the MGE sequence provided partial
coverage along the rostrocaudal axis; the MGE slice package was positioned to include all of the hippocampus.
The pre-Mn baseline scan sessions for the subset of six 5xFAD mice included only the MGE and UTE scans.
All three scans were acquired in the post-Mn MEMRI sessions for all animals except for two wild-type rats, for
which MGE scans were not acquired. One wild-type mouse was found to have hydrocephalus (Fig. 2a, second
row, right) and thus excluded from the MP2RAGE processing and analysis described below.
MRI processing and analysis. MP2RAGE. Both magnitude and complex MP2RAGE and UTE images
were reconstructed in ParaVision. The complex images from the four channels of the array coil were com-
bined with the COMPOSER method, which uses the UTE reference scan to correct for differing phase offsets
in the images from the individual coils in the array17. This was implemented in the wrapper script composer.
sh, which is part of the QUantitative Imaging Tools (QUIT) package (https://github.com/spinicist/QUIT)18.
From the combined complex MP2RAGE image, bias-field-corrected T1-weighted images and T1 maps were
computed using the mp2rage command in QUIT, which produces robust T1-weighted images by suppressing
background noise19. The noise suppression constant β was empirically optimized and set to 1 for all mouse data
and 0.05 for all rat data. Longitudinal relaxation rate (R1 ≡ 1/T1) maps were made by calculating the reciprocal
of the T1 maps.
Study-specific T1-weighted mouse and rat templates were created using the ANTs script antsMulti-
variateTemplateConstruction2.sh, and each subject was registered to its respective template using
antsRegistration with serial rigid-body, affine, and SyN transformations20.
Scientific Reports | (2021) 11:12419 | https://doi.org/10.1038/s41598-021-91899-5 3
Vol.:(0123456789)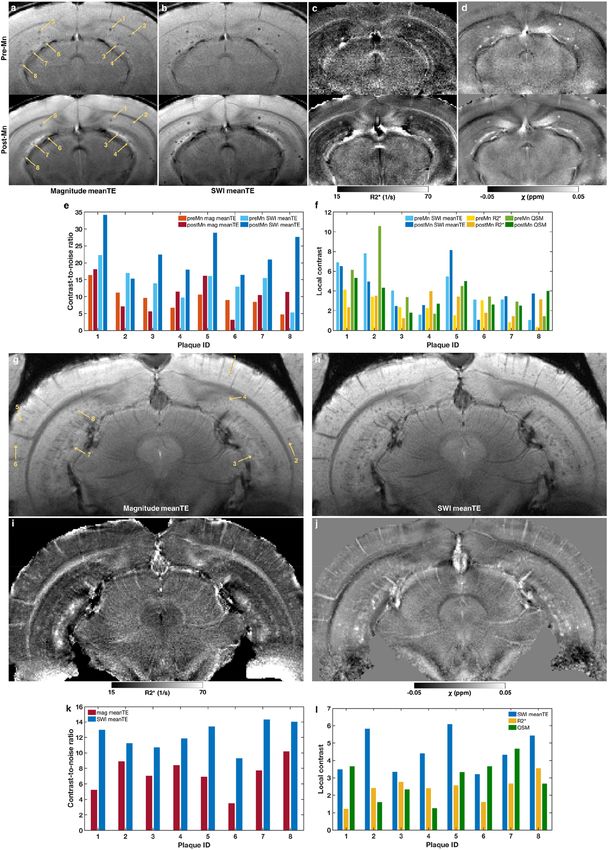
www.nature.com/scientificreports/
Each R1 map was transformed to the template space, and R1 values were normalized by the median R1
value in a temporalis region-of-interest (ROI) manually defined on the template image. The rationale was to
correct for any inter-subject differences in effective Mn(II) dose on the assumption that genotype did not affect
Mn(II) uptake in the temporalis. To determine if R1 differed between transgenic and wild-type animals, voxel-
wise permutation tests were performed using FSL randomise with 5000 permutations, threshold-free cluster
enhancement, and controlling for family-wise error (FWE) rate21.
MGE. Magnitude, complex, and susceptibility-weighted images (SWI) were reconstructed from the MGE data
in ParaVision. The ‘positive-mask’ SWI reconstruction weighting mode was used, with a mask weighting of 4.0
and Gauss broadening of 0.2 mm.
The magnitude and susceptibility-weighted images were bias field corrected using the N4BiasFieldCor-
rection command in A NTs22. Then, individual echo time (TE) images were averaged to create magnitude and
SWI “meanTE” images to increase SNR23. Effective transverse relaxation rate (R2*) maps were computed from
the uncorrected MGE magnitude images using the non-linear fitting algorithm of the multiecho command
in QUIT.
The complex images were combined as described above, from which magnitude and phase images were
extracted for quantitative susceptibility mapping (QSM). Magnetic susceptibility (χ) maps were computed using
the STAR-QSM algorithm24 in STI Suite v3.0, a MATLAB (MathWorks, Natick, MA, USA) toolbox. Brain masks,
which are required by the QSM algorithm, were generated from the uncorrected first TE magnitude images using
the Rapid Automatic Tissue Segmentation (RATS) t ool25.
Thus, four image contrasts or parametric maps were derived from the MGE data:
1. magnitude meanTE images,
2. SWI meanTE images,
3. R2* maps, and
4. QSM maps.
Using Fiji26, the SNR of magnitude meanTE images were estimated from manually drawn ROIs around the
brain and background in a central slice, where
mean brain signal
SNR = . (1)
s.d. of background signal
For one 5xFAD mouse and one TgF344-AD rat each, eight randomly selected plaques and their neighbor-
hoods were manually segmented from a single slice of the SWI meanTE image using Fiji. Any voxels containing
blood vessels or white matter were excluded from the neighborhoods. The contrast-to-noise ratios (CNR) in the
magnitude and SWI meanTE images were computed for each plaque, where
mean plaque signal − mean neighborhood signal
CNR = . (2)
s.d. of background signal
In addition, local contrast, defined here as
mean plaque signal − mean neighborhood signal
local contrast = , (3)
s.d. of neighborhood signal
was calculated for each plaque in each of the four MGE-derived images/maps.
Histology. Perfusion-fixed brains were extracted and cryoprotected in 30% sucrose before being sectioned at
35 µm in a series of 6 for mouse and 12 for rat on a freezing microtome and stored free floating in cryoprotectant
at − 20 °C. For mice and rats, Alizarin Red was used to stain for calcium and manganese, Perl’s/DAB for iron,
and 4G8 antibody for Aβ.
For Alizarin Red, one series was mounted onto slides and air dried before rehydrating in distilled H2O and
incubating in Alizarin Red solution for 2 min. Sections were then differentiated in acetone then acetone:xylene
(1:1) and finally were cleared in xylene before coverslipping.
For Perl’s/DAB, one series was washed for 3 × 5 min in phosphate-buffered saline (PBS) before being incubated
in 0.3% hydrogen peroxide (H2O2) for 30 min, then in Perl’s solution (1% Potassium Ferrocyanide Trihydrate
in acidified PBS) for 1 h at 37 °C, and finally in 3,3′-diaminobenzidine (DAB) for up to 10 min until sufficient
colour had developed (PBS wash steps were performed in between each incubation). Sections were then mounted
onto slides, air dried, and coverslipped.
For 4G8, one series was washed for 3 × 5 min in Tris-buffered saline (TBS) before being incubated in 88%
formic acid for 15 min for antigen retrieval, then in 1% H 2O2 for 15 min to block endogenous peroxidase activity,
10% skimmed milk powder to block non-specific binding, and finally in anti-4G8 antibody (1:2000; BioLegend
(800701)) overnight at 4 °C. This was followed by incubation in a biotinylated secondary antibody (anti mouse in
goat, 1:1000, Vector Labs (BA-9200)) for 2 h and ABC kit for 1 h (Vectastain ABC Kit, Vector Labs (PK-6100)).
Washes with TBS-X (3 × 5 min) were performed in between each step. Staining was then visualized using DAB.
Sections were then mounted onto slides, air dried, and coverslipped.
Scientific Reports | (2021) 11:12419 | https://doi.org/10.1038/s41598-021-91899-5 4
Vol:.(1234567890)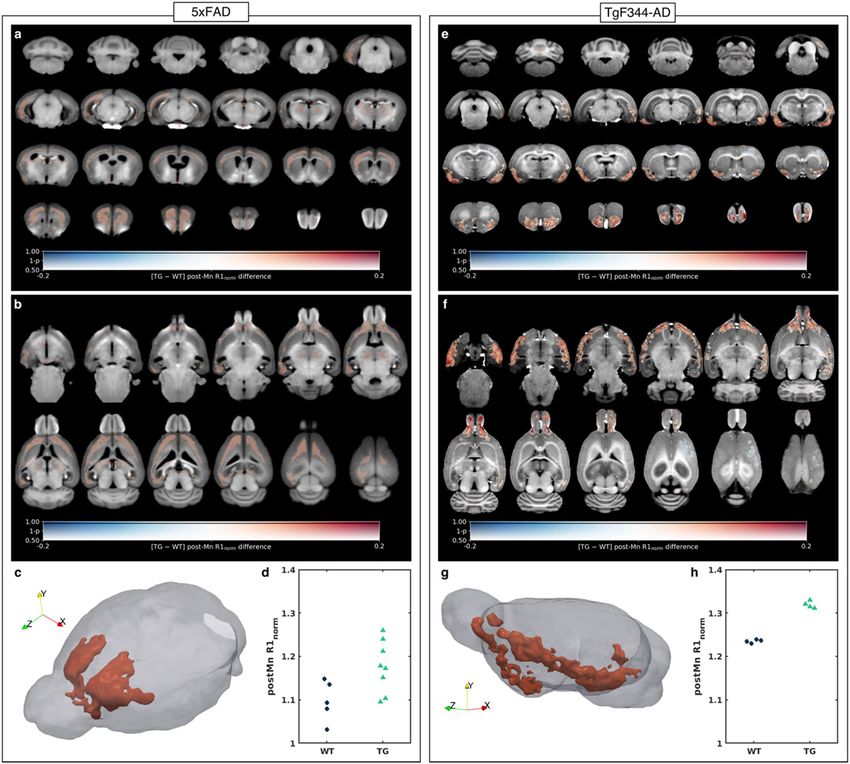
www.nature.com/scientificreports/
5xFAD TgF344-AD
Genotype Pre-Mn SNR Post-Mn SNR Ratio Genotype Post-Mn SNR
TG 44.83 62.38 1.39 WT 42.37
TG 70.64 75.68 1.07 WT 33.14
TG 44.58 57.69 1.29 TG 42.35
TG 37.92 74.78 1.97 TG 34.23
TG 47.73 72.36 1.52 TG 37.00
TG 38.54 80.05 2.08 TG 40.00
Mean 47.37 70.49 1.55 Mean 38.18
SD 12.03 8.60 0.39 SD 4.02
Table 2. Signal-to-noise ratios of MGE magnitude meanTE images. MGE multi-gradient-echo, meanTE
average across all echo times, SNR signal-to-noise ratio.
Slides from all three stains were then scanned with an Olympus VS120 slide scanner at 40× magnification.
Images were saved with 80% compression.
Results
Mn(II) increased the SNR of MGE images. One aim of this study was to evaluate the efficacy of using
Mn(II) as a T1 shortening agent to increase the SNR and/or decrease the scan time of high-resolution images. To
this end, high-resolution MGE images were acquired both before and after M nCl2 administration for six 5xFAD
mice. The post-Mn SNR was on average 55% higher than the pre-Mn SNR, but the change varied greatly from 7
to 108% (Table 2). This variability may have been due to Mn(II)-independent variability in image quality stem-
ming from sensitivities to shimming and motion of the long, gradient-echo-based scan.
Beyond increasing SNR, Mn(II) increased neuroanatomical contrast, most likely due to regional differences
in uptake driven by neural activity and neuronal density (Fig. 1a). This is apparent in the increased white/gray
matter contrast and particularly in the visibility of hippocampal structures. This is far from a novel observa-
tion—Mn(II) is well-known to enhance neuroanatomical contrast—but it bears mentioning for this specific
application because nominally T1-weighted FLASH-like sequences like the MGE sequence used in this study
produce fairly flat image contrast at high fields. Thus, MEMRI was especially beneficial and aided more precise
localization of plaques.
Mn(II) had a variable effect on plaque contrast. While Mn(II) increased global tissue contrast and
thereby improved our ability to determine where plaques were located, it had a variable effect on our ability
to detect plaques in the first place. Hypointense plaques were visible in magnitude and SWI meanTE images
(Fig. 1a,b) both before (top row) and after (bottom row) MnCl2 administration. Due to imperfect slice alignment
between pre- and post-Mn scans, not all plaques visible in one were visible in the other. For one 5xFAD mouse,
eight plaques visible in both pre- and post-Mn scans were randomly selected and manually segmented (yellow
arrows, Fig. 1a,b). The CNR of those plaques are presented in Fig. 1e. In the magnitude meanTE images, the
post-Mn CNR of three plaques were actually lower than the pre-Mn CNR; while in the SWI meanTE images, the
post-Mn CNR was higher in all but one plaque. As mentioned above, the pre- and post-Mn slices were not per-
fectly aligned, which led to varying degrees of partial voluming in the slice direction and may have contributed
to the unexpectedly lower post-Mn CNR of some plaques.
Plaque MR‑visibility was driven by increased magnetic susceptibility. As for the 5xFAD mouse,
we manually segmented eight random plaques in one TgF344-AD rat (Fig. 1g,h). All selected plaques in both
the 5xFAD mouse and TgF344-AD rat had higher CNR in the SWI meanTE image compared to the magnitude
image (Fig. 1e,k): 5xFAD post-Mn SWI CNR = 22.99 ± 6.70, magnitude CNR = 10.43 ± 5.07; TgF344-AD post-
Mn SWI CNR = 12.23 ± 1.75, magnitude CNR = 7.25 ± 2.12. In addition, MGE-visible plaques had elevated R2*
(Fig. 1c,i), which increases in the presence of magnetic susceptibility gradients. QSM confirmed that the plaques
were more paramagnetic (i.e., had a greater positive magnetic susceptibility) than most of the surrounding brain
parenchyma (Fig. 1d,j). Comparing the three image modalities—SWI, R2*, and QSM—the post-Mn local plaque
contrast was generally highest in the SWI meanTE images (5xFAD: 4.12 ± 2.32, TgF344-AD: 4.51 ± 1.14), inter-
mediate in the QSM maps (5xFAD: 3.54 ± 1.30, TgF344-AD: 2.90 ± 1.15), and lowest in the R2* maps (5xFAD:
2.61 ± 1.04, TgF344-AD: 2.40 ± 0.71). However, the relative local contrasts of the three modalities varied from
plaque to plaque (Fig. 1f,l).
Only a fraction of histologically identified plaques were MR‑visible. Figure 2 shows single slices
of SWI meanTE images of each mouse and rat brain for which MGE scans were acquired. Most visible plaques
in 5xFAD mouse brains were in the hippocampus, while more plaques in TgF344-AD rat brains were visible in
the cortex a well as the hippocampus. As expected, there were no visible plaques in any of the wild-type animals.
Half of the 5xFAD mice presented with bilateral hypointense clusters in the thalamus, which were also not found
in wild-type animals.
Scientific Reports | (2021) 11:12419 | https://doi.org/10.1038/s41598-021-91899-5 5
Vol.:(0123456789)www.nature.com/scientificreports/
Scientific Reports | (2021) 11:12419 | https://doi.org/10.1038/s41598-021-91899-5 6
Vol:.(1234567890)www.nature.com/scientificreports/
◂Figure 1. Plaque contrast in manganese-enhanced MGE-derived images and quantitative maps. (a) Matching
slices of MGE images acquired from a 5xFAD mouse before (pre-Mn) and after (post-Mn) M nCl2. The images
were computed by averaging the magnitude images across all four echo times (meanTE, TE = 5–26 ms). Yellow
arrows point to the same eight plaques, which were manually selected for contrast analysis. (b–d) The same
slices as in (a) but showing: (b) the susceptibility-weighted images (SWI) averaged across TE, (c) the R2* maps
derived from monoexponential fitting of the multi-echo data, and (d) the magnetic susceptibility (χ) maps
derived from quantitative susceptibility mapping (QSM). (e) Contrast-to-noise ratios (CNR) of each of the eight
plaques in the pre- and post-Mn magnitude meanTE (a) and SWI meanTE images (b). CNR was calculated
according to Eq. (2). (f) Local contrast of each of the eight plaques in the pre- and post-Mn SWI meanTE images
(b), R2* maps (c), and χ maps (d). Local contrast was calculated according to Eq. (3). (g) A slice of an MGE
magnitude image averaged across TE (TE = 6.2–40.8 ms) acquired from a TgF344-AD rat. Yellow arrows point
to eight plaques, which were manually selected for contrast analysis. (h–j) The same slices as in (g) but showing:
(h) the SWI averaged across TE, (c) the R2* map, and (d) the χ map (QSM). (k) Contrast-to-noise ratios (CNR)
of each of the eight plaques in the magnitude meanTE (g) and SWI meanTE images (h). (l) Local contrast of
each of the eight plaques in the SWI meanTE image (h), R2* map (i), and χ map (j).
4G8 anti-Aβ staining revealed plaques throughout the 5xFAD brain, with large plaque burdens in the septum,
thalamus, and deeper cortical layers in addition to the hippocampus (Fig. 3a). Perl’s/DAB staining showed that
iron was present in many plaques in the cortex, hippocampus, and thalamus; the largest iron deposits were in
the hippocampus, as were most of the MR-visible plaques (Fig. 3b–d).
Compared to 5xFAD mice, TgF344-AD rats had a lower plaque burden in general except in the hippocam-
pus, amygdala, and piriform cortex (Fig. 3e). Most plaques throughout the rat brain appeared to contain iron
deposits (Fig. 3g). The 4G8 and Perl’s/DAB staining revealed no obvious difference between plaques in the dorsal
hippocampus versus those in the ventral hippocampus, but more plaques were MR-visible in the latter than in
the former (Fig. 3f). Plaques in the amygdalopiriform cortex were difficult to see in the MR images due to a
combination of the receiver coil’s inhomogeneous sensitivity profile and the signal dropout around the air–tissue
interfaces along the ventral surface of the brain.
Thalamic calcifications and Mn‑Aβ binding in 5xFAD mice. The 5xFAD thalamic plaques in the
4G8- and Perl’s/DAB-stained sections (Fig. 3a–d) were not localized in the manner of the hypointense clusters
seen in the MR images (Fig. 2b). QSM revealed that these clusters were diamagnetic at baseline (pre-Mn, Fig. 4a)
but became paramagnetic after MnCl2 administration (post-Mn, Fig. 4b). Alizarin Red staining showed large
spots in the same area of the thalamus (Fig. 4c); these large spots were only present in mice with MR-visible
thalamic clusters (Fig. 4d).
Alizarin Red staining also revealed numerous, less intensely stained foci in the brains of 5xFAD mice treated
with MnCl2 (Mn+) that were not present in Mn+ wild-type brains (Figs. 4c,d and 5a,b). Fewer of these deposits
were visible in the M
nCl2-naïve (Mn−) 5xFAD brain, while the Mn− and Mn+ wild-type brain sections had a
similar appearance. The Alizarin-Red-stained deposits in the Mn+ xFAD sections matched the spatial distribu-
tion of 4G8-stained Aβ plaques (Fig. 3a), suggesting that the injected Mn(II) bound to the plaques.
Unlike in the 5xFAD brains, Alizarin Red staining showed no evidence of Mn(II) binding to plaques in the
TgF344-AD brains (Fig. 5c,d).
Mn(II) uptake was increased in areas of high plaque burden. The MP2RAGE data revealed a trend
(0.22 < FWE-corrected p < 0.5) towards increased temporalis-normalized R1 (R1norm) in 5xFAD compared
to WT mice in several brain regions including the deep cortical layers, hippocampus, thalamus, and septum
(Fig. 6a,b). The spatial pattern of increased R 1norm is consistent with the histologically verified pattern of Aβ
deposition (Fig. 3a). This is consistent with the apparent binding of Mn(II) to amyloid plaques (Figs. 4c,d and
5a,b). To illustrate the magnitude of the genotype-driven difference in R1norm, an ROI in the anterior cortex
was automatically generated by thresholding the voxel-wise statistical map at FWE-corrected p < 0.3 and taking
the largest connected component (Fig. 6c), and the mean R 1norm within the ROI was plotted for each mouse
(Fig. 6d). The mean R1norm was significantly greater in 5xFAD mice compared to wild-types (two-sample t-test
p = 0.028, Cohen’s d = 1.44).
R1norm was also increased in TgF344-AD rats compared to their wild-type littermates but in different areas
of the brain than in 5xFAD mice—mostly in the rhinencephalon including the olfactory bulb, amygdala, and
piriform cortex (Fig. 6e,f). Also unlike the 5xFAD mice, the increase in R1norm was statistically significant (FWE-
corrected p < 0.05) in sizeable clusters (black contours, Fig. 6e,f). A rhinencephalon ROI was automatically
segmented by taking the largest connected component of the R 1norm p-value map after thresholding it at FWE-
corrected p < 0.05 (Fig. 6g). The mean R1norm in the ROI was significantly greater in TgF344-AD rats than in
wild-types (two-sample t-test p < 0.00001, Cohen’s d = 12.93, Fig. 6h).
Discussion
MnCl2 as a GBCA alternative. The original aim of this study was to evaluate the suitability of M nCl2 as
an easily deliverable alternative to GBCAs to aid direct visualization of amyloid plaques in high-resolution MR
images. While Mn(II) boosted SNR and tissue contrast, it did not appreciably enhance plaque visibility in 5xFAD
mice (Fig. 1a–f). However, given that the SNR of the pre-Mn images was sufficient to visualize plaques, the signal
Scientific Reports | (2021) 11:12419 | https://doi.org/10.1038/s41598-021-91899-5 7
Vol.:(0123456789)www.nature.com/scientificreports/
Figure 2. Plaques were MR-visible in all 5xFAD mice and TgF344-AD rats. Single slices from MGE
susceptibility-weighted meanTE images of all (a) wild-type mice, (b) 5xFAD mice, (c) wild-type rats, and (d)
TgF344-AD rats. Compared to the 5xFAD mice, the TgF344-AD plaques had lower contrast and were more
obscured by blood vessels. However, the majority of visible plaques in the 5xFAD mice were in the dorsal
hippocampus while many more plaques were visible in the TgF344-AD rats, especially in the cortex and ventral
hippocampus.
enhancement provided by Mn(II) could be leveraged to increase the image resolution and/or shorten the scan
time while maintaining the ability to detect plaques.
Compared to studies that used GBCAs, we achieved less signal enhancement with MnCl2. For example, Santin
et al. delivered Gd-DOTA to the brain parenchyma in mice using microbubbles and ultrasound to transiently
open the blood–brain barrier, which reduced the cortical T1 from ~ 2000 to ~ 360 ms at 7 T7. This dramatic T1
shortening allowed them to acquire images with a resolution of 29 × 29 × 117 μm3 (~ 9 × higher than our MGE
images) in just 32 min. In comparison, we measured a much smaller decrease in whole-brain T1 from ~ 1600 to
~ 1300 ms at 9.4 T after MnCl2 injections in the rats. This large difference in T1 shortening is due to the much
higher Gd-DOTA dose compared to the MnCl2 dose given to the rats (4 mmol/kg vs. 0.3 mmol/kg). The toxicity
of free manganese prevents the use of such high doses of M nCl2, which therefore cannot enable a comparable
combination of high resolution and short scan time. Nevertheless, the ease of M nCl2 administration by simple
subcutaneous injections, compared to complex delivery required for GBCAs is advantageous for many non-
invasive applications.
Discrepancy between MRI and histology. There was a discrepancy between the spatial distributions of
MR-visible plaques in MGE images and iron-loaded plaques on histological sections. Perl’s staining with potas-
sium ferrocyanide specifically stains Fe(III), but the additional DAB intensification step results in staining of
both Fe(III) and Fe(II)27. A recent phantom study found that Fe(III) and Fe(II) have significantly different r2*
relaxivities: 12.5/mM/s and 0.77/mM/s, respectively28.
Aβ, like most proteins, is diamagnetic. Putative Aβ plaques have been shown to appear as diamagnetic spots
in ex vivo QSM of transgenic Aβ mice29. However, many of the plaques in the animal models used in this study
appear to contain iron, and the MR-visible plaques have positive susceptibilities. Co-localization of paramagnetic
iron with diamagnetic Aβ may reduce susceptibility-based MR contrast.
While Perl’s/DAB staining revealed the presence of plaque-associated iron throughout the brain, regional
variation in plaque configuration (compact vs. diffuse)30, relative concentrations of Aβ and iron, and different
species of iron might explain why certain plaques were not visible in the MGE images. More nuanced and quan-
titative molecular analysis is required to test these hypotheses.
Given the relatively large voxel dimensions, the size of the iron core might be the most important determinant
of MR visibility, especially in these T2*-weighted MGE images. 4G8 staining shows that plaque sizes do not differ
much between the cortex, hippocampus, and thalamus in the 5xFAD mouse (Fig. 3a,c). In contrast, Perl’s/DAB
staining shows that the hippocampus contains several iron cores that are much larger than most in the cortex
(Fig. 3d). This could explain why, although there are many more plaques in the cortex, most of the MR-visible
plaques are in the hippocampus (Fig. 3b).
Scientific Reports | (2021) 11:12419 | https://doi.org/10.1038/s41598-021-91899-5 8
Vol:.(1234567890)www.nature.com/scientificreports/
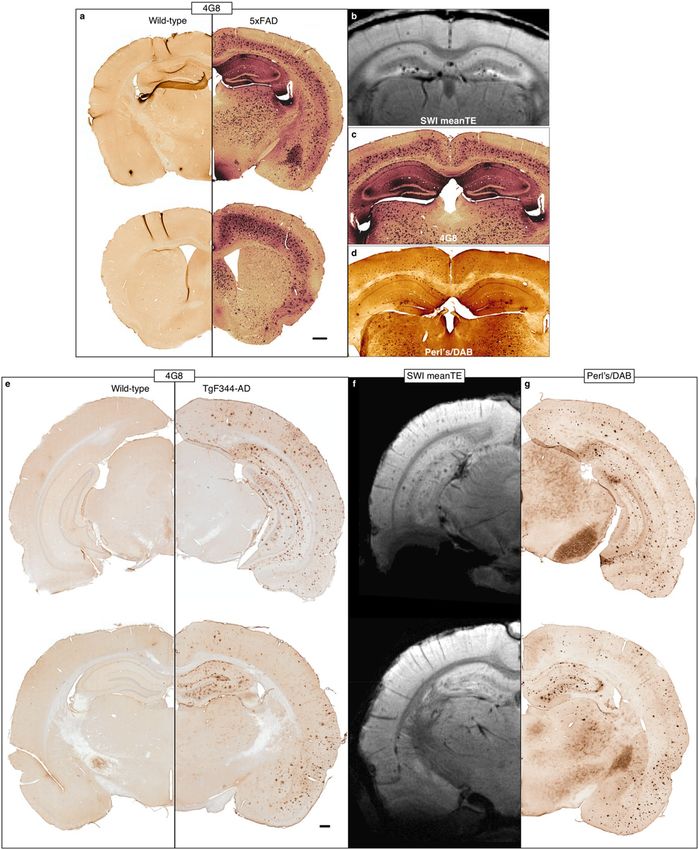
Figure 3. Histology shows iron-containing Aβ plaques throughout the brain in 5xFAD mice and TgF344-AD
rats. (a) 48G anti-amyloid staining confirmed the presence of plaques not only in the hippocampus, but in the
deep cortical layers and subcortical regions, including the thalamus, of 5xFAD mice. (b) The plaques visible on
MRI were mostly limited to the hippocampus, with a few cortical plaques visible in a few mice. The contrast
in these MGE images is largely T2*/susceptibility-driven. Perl’s-DAB staining showed that while many of the
plaques stained with 4G8 contained iron, the largest iron deposits were in the dorsal hippocampus (c, d). (e)
48G anti-amyloid staining confirmed the presence of plaques throughout the hippocampus and cortex of
TgF344-AD rats. (f) Hippocampal and cortical plaques were visible on MRI. Susceptibility artifacts around
the air-tissue interfaces at the ventral surface of the brain obscured visualization of plaques in those areas. (g)
Perl’s-DAB staining showed a spatial distribution of iron very similar to Aβ. All images were acquired from one
wild-type mouse (a—left), one 5xFAD mouse (a—right, b, c), one wild-type rat (e—left), and one TgF344-AD
rat (e—right, f, g). Scale bars in (a) and (e) = 500 microns.
Scientific Reports | (2021) 11:12419 | https://doi.org/10.1038/s41598-021-91899-5 9
Vol.:(0123456789)www.nature.com/scientificreports/
Figure 4. In vivo QSM and Alizarin Red staining reveal thalamic calcifications in 5xFAD mice. (a, b)
Quantitative susceptibility (χ) maps of a 5xFAD mouse (a) before (pre-Mn) and (b) after administration of
MnCl2 (Post-Mn). Bilateral clusters in the thalamus were diamagnetic Pre-Mn but became paramagnetic
Post-Mn (arrows). (c) A section from the same mouse, stained with Alizarin Red, shows that these thalamic
clusters contain calcium and/or manganese. (d) An Alizarin-Red-stained section from a 5xFAD mouse without
MR-visible thalamic clusters. Inset scale bars = 100 μm.
In addition, more plaques were MR-visible in TgF344-AD rats than in 5xFAD mice, supporting the hypothesis
that size was the key factor underlying plaque visibility in our MGE images. Qualitatively comparing the two
models, plaque size seems to scale proportionally with brain size; and in the TgF344-AD rat, there is no obvious
difference in the Aβ to iron ratio within plaques in the cortex compared to those in the hippocampus (Fig. 3e,g).
Scientific Reports | (2021) 11:12419 | https://doi.org/10.1038/s41598-021-91899-5 10
Vol:.(1234567890)www.nature.com/scientificreports/
Figure 5. Alizarin Red staining shows subcutaneously administered manganese binds to Aβ plaques in 5xFAD
but not TgF344-AD brains. Alizarin Red binds to calcium and, because of their chemical similarity, manganese.
(a) Alizarin Red staining appears similar in wild-type brains that were M nCl2-naïve (Mn−) and treated with
MnCl2 (Mn+). (b) In the Mn− 5xFAD brain, some plaques or plaque-like structures in the cortex and septum
were stained. Many more plaques were stained in the Mn+ 5xFAD brain, suggesting that the injected manganese
bound to the plaques. (c, d) Alizarin Red staining appears similar in (c) wild-type and (d) TgF344-AD brains
that were manganese-naïve (Mn−) and treated with M nCl2 (Mn+). Unlike in the 5xFAD mouse brains, there
is no evidence that exogenously administered manganese bound to amyloid plaques in TgF344-AD rat brains.
Both whole-section scale bars = 500 μm, and all inset scale bars = 100 μm.
Mn(II) uptake as an indirect marker of amyloid plaque burden. While MnCl2 cannot enable the
kind of high-resolution imaging possible with GBCAs, MEMRI did serve another purpose in revealing regional
increased Mn(II) uptake and retention in transgenic AD animals compared to wild-types. Previous MEMRI
studies have also reported increased Mn(II) in AD mouse models including the 5xFAD model used here, attrib-
uting it to neuronal dysfunction and hyperactivity10,11. This is consistent with the results of Busche et al. who,
through in vivo measurements of spontaneous Ca2+ transients in individual neurons, found hyperactive cortical
neurons in the close vicinity (within 60 μm) of Aβ plaques in the APP23xPS45 mouse model of A D31. Manga-
nese can also accumulate in microglia and astrocytes via phagocytosis32 or divalent metal transporters33. Given
this and the well-known association between inflammation, microglia, and amyloid plaques in A D34, glial acti-
vation and recruitment to plaques may have contributed to the increased Mn(II) uptake in AD animals.
We present evidence of another potential mechanism by which Mn(II) retention was enhanced in 5xFAD
mice. The increased R1norm in brain regions of high plaque load, in conjunction with Alizarin Red staining of
plaques in Mn+ but not Mn− 5xFAD mice (Fig. 4a,b), suggests that accumulation of the injected Mn(II) in these
regions was increased by direct binding of Mn(II) to plaques. This is supported by recent studies that showed that
Mn(II) binds to Aβ with a weak binding affinity that does not affect the protein’s aggregation35,36.
However, Alizarin Red staining of the TgF344-AD rats brains showed that Mn(II) does not have the same
affinity to all plaques (Fig. 4c,d). Moreover, while the plaque load in TgF344-AD rats was equally high in the
hippocampus, the increased R1norm was localized to the rhinencephalon. Together, these results indicate that
Mn(II) accumulation was increased in the TgF344-AD rat rhinencephalon due to neuronal dysfunction rather
than Mn(II) binding to Aβ.
Scientific Reports | (2021) 11:12419 | https://doi.org/10.1038/s41598-021-91899-5 11
Vol.:(0123456789)www.nature.com/scientificreports/
Figure 6. Transgenic animals show regional increases in manganese uptake. (a, b) The voxel-wise difference in
post-Mn R1norm (R1 values were normalized to the median R1 in a manually defined region in the temporalis
muscle) between 5xFAD (TG, n = 8) mice and wild-type (WT, n = 5) littermates, overlaid on the T1-weighted
MP2RAGE study-specific template shown in (a) coronal slices from back to front and (b) transverse slices
from bottom to top. The difference in group means is coded by overlay color (warm colors indicate TG > WT),
and the statistical significance is coded by overlay transparency (completely transparent indicates family-wise-
error-corrected p > 0.5). (c) 3D rendering of the template brain (gray) and a cortical region of interest (ROI)
automatically generated from the largest connected component in which p < 0.3 (red). (d) A dot plot of the mean
post-Mn R1norm within the ROI for each mouse. Two-tailed two-sample t-test, p = 0.028. (e, f) Similar maps as in
(a, b), showing the voxel-wise difference in post-Mn R1norm between TgF344-AD (TG, n = 4) rats and wild-type
(WT, n = 4) littermates, overlaid on the pre-Mn T1-weighted MP2RAGE study-specific template. Areas in which
p < 0.05 are outlined in black. (g) 3D rendering of the template brain (gray) and an ROI in the rhinencephalon
automatically generated from the largest connected component in which p < 0.05 (red). (h) A dot plot of the
mean post-Mn R1norm within the rhinencephalon ROI for each rat. Two-tailed two-sample t-test, p < 0.00001.
Thalamic calcifications in 5xFAD mice. In addition to plaque-like structures in the hippocampal and
cortical areas, we also detected large clusters of hypointensities in MGE images in 4/8 5xFAD mice in their bilat-
eral mediodorsal thalami. Similar thalamic lesions have been reported before in transgenic AD m ice5,37, and it
has been suggested that these are not typical amyloid plaques, but instead deposits of calcium together with a
variable amount of colocalized iron. Accordingly, while we observed a matching pattern between amyloid (4G8)
and iron (Perl’s) staining and our MRI-visible plaques in the hippocampus and cortex, neither stain resembled
the configuration of the thalamic lesions which were only replicated by the staining for calcium with Alizarin
Red38. QSM showed that, at pre-Mn baseline, these thalamic clusters were diamagnetic, corroborating the histo-
logical findings that these lesions are calcifications.
Scientific Reports | (2021) 11:12419 | https://doi.org/10.1038/s41598-021-91899-5 12
Vol:.(1234567890)www.nature.com/scientificreports/
Interestingly, strikingly similar thalamic calcifications have been observed in animal models of
neurotoxicity39,40, ischemia/hypoxia41, depletion of huntingtin p rotein42, tauopathy43, and even a geing44. Such
dystrophic calcifications (intra or extra-cellular deposits of calcium salts in degenerating or necrotic tissue) are
known to occur intracerebrally in the basal ganglia and thalami in a spectrum of human disorders known as
primary familial brain calcification45. A common mechanism that appears to feature in all these calcifications
is a disturbed iron homeostasis, as dysregulation of brain transferrin and ferritin has been shown to precede
the calcifications. Iron is also known to be pathologically linked to AD and could play a role in the formation of
thalamic calcifications in 5xFAD mice.
The regional location of these calcifications could be due to the same reason why calcifications target thalami
in the neurotoxicity models; it is possible that an unknown factor related to, e.g., thalamic configuration or acces-
sibility renders it particularly vulnerable. The same could underlie our observation that Mn(II) also appeared to
bind to these thalamic deposits, turning them from diamagnetic at pre-Mn baseline to paramagnetic after MnCl2
injection (Fig. 4). This is supported by observations of Mn(II) binding to thalamic calcifications in a MEMRI
study of hypoxia induced brain injury41, as well as of its binding directly to amyloid p laques35,36. Nevertheless,
while the observation of Mn-enhancing thalamic calcifications in experimental AD is interesting, the question
remains about their wider significance and whether they may be useful biomarkers of either disease progression
or treatment efficacy.
Translational outlook. A recent study of MEMRI on healthy volunteers using the FDA-approved, but
no longer marketed, mangafodipir demonstrated signal intensity increase in the choroid plexus and anterior
pituitary gland but no signal enhancement in the brain parenchyma. This is likely due to the much lower dose
(5 μmol/kg) compared to animal studies (0.3 or 0.15 mmol/kg in this study)46. This low dose, necessitated by
manganese toxicity, currently limits the clinical translatability of MEMRI for AD applications.
Conclusion
MnCl2 does not match GBCAs in its ability to enhance longitudinal relaxation, increase image resolution, and
reduce scan time. However, it is much simpler to deliver to the brain parenchyma and still offers useful signal
enhancement. Our results suggest that, at least in the 5xFAD mouse, this should be leveraged to increase spatial
resolution rather than SNR in the context of visualizing amyloid plaques. Image resolution and plaque size
appear to be the key factors in determining plaque visibility, with iron load playing an increasingly important
role as resolution and/or plaque size decrease. MEMRI also allows indirect detection of amyloid plaques. Mn(II)
uptake was increased in regions of high plaque burden, consistent with neuronal hyperactivity as a result of
plaque-related dysregulation, and perhaps enhanced by Aβ-Mn(II) binding. Thus, MEMRI is a viable method
for visualizing amyloid plaques and for obtaining functional insights in preclinical models of AD. This technique
will be used in future longitudinal studies to monitor disease progression and therapeutic response. Other future
work includes determining how early MEMRI can detect plaques and investigating its value as a tool for early
diagnosis of AD.
Data availability
The MRI data generated and analysed during the current study are available in the OpenNeuro repository, https://
doi.org/10.18112/openneuro.ds003463.v1.0.1.
Received: 2 March 2021; Accepted: 28 May 2021
References
1. Simonsen, A. H. et al. Recommendations for CSF AD biomarkers in the diagnostic evaluation of dementia. Alzheimer’s Dement.
13, 274–284. https://doi.org/10.1016/j.jalz.2016.09.008 (2017).
2. Mathis, C. A., Mason, N. S., Lopresti, B. J. & Klunk, W. E. Development of positron emission tomography beta-amyloid plaque
imaging agents. Semin. Nucl. Med. 42, 423–432. https://doi.org/10.1053/j.semnuclmed.2012.07.001 (2012).
3. Jack, C. R. Jr. et al. NIA-AA Research Framework: Toward a biological definition of Alzheimer’s disease. Alzheimer’s Dement. 14,
535–562. https://doi.org/10.1016/j.jalz.2018.02.018 (2018).
4. Ten Kate, M. et al. MRI predictors of amyloid pathology: Results from the EMIF-AD Multimodal Biomarker Discovery study.
Alzheimer’s Res. Ther. 10, 100. https://doi.org/10.1186/s13195-018-0428-1 (2018).
5. Jack, C. R. Jr. et al. In vivo visualization of Alzheimer’s amyloid plaques by magnetic resonance imaging in transgenic mice without
a contrast agent. Magn. Reson. Med. 52, 1263–1271. https://doi.org/10.1002/mrm.20266 (2004).
6. Petiet, A. et al. Gadolinium-staining reveals amyloid plaques in the brain of Alzheimer’s transgenic mice. Neurobiol. Aging 33,
1533–1544. https://doi.org/10.1016/j.neurobiolaging.2011.03.009 (2012).
7. Santin, M. D., Debeir, T., Bridal, S. L., Rooney, T. & Dhenain, M. Fast in vivo imaging of amyloid plaques using mu-MRI Gd-staining
combined with ultrasound-induced blood-brain barrier opening. Neuroimage 79, 288–294. https://doi.org/10.1016/j.neuroimage.
2013.04.106 (2013).
8. Brandt, M., Cardinale, J., Rausch, I. & Mindt, T. L. Manganese in PET imaging: Opportunities and challenges. J. Labelled Comp.
Radiopharm. 62, 541–551. https://doi.org/10.1002/jlcr.3754 (2019).
9. Massaad, C. A. & Pautler, R. G. Manganese-enhanced magnetic resonance imaging (MEMRI). Methods Mol. Biol. 711, 145–174.
https://doi.org/10.1007/978-1-61737-992-5_7 (2011).
10. Fontaine, S. N. et al. Identification of changes in neuronal function as a consequence of aging and tauopathic neurodegeneration
using a novel and sensitive magnetic resonance imaging approach. Neurobiol. Aging 56, 78–86. https://doi.org/10.1016/j.neuro
biolaging.2017.04.007 (2017).
11. Tang, X. et al. Spatial learning and memory impairments are associated with increased neuronal activity in 5XFAD mouse as
measured by manganese-enhanced magnetic resonance imaging. Oncotarget 7, 57556–57570. https://d oi.o
rg/1 0.1 8632/o
ncota rget.
11353 (2016).
Scientific Reports | (2021) 11:12419 | https://doi.org/10.1038/s41598-021-91899-5 13
Vol.:(0123456789)www.nature.com/scientificreports/
12. Badea, A. et al. Multivariate MR biomarkers better predict cognitive dysfunction in mouse models of Alzheimer’s disease. Magn.
Reson. Imaging 60, 52–67. https://doi.org/10.1016/j.mri.2019.03.022 (2019).
13. Perez, P. D. et al. In vivo functional brain mapping in a conditional mouse model of human tauopathy (tauP301L) reveals reduced
neural activity in memory formation structures. Mol. Neurodegener. 8, 9. https://doi.org/10.1186/1750-1326-8-9 (2013).
14. Saar, G. & Koretsky, A. P. Manganese enhanced MRI for use in studying neurodegenerative diseases. Front. Neural Circ. 12, 114.
https://doi.org/10.3389/fncir.2018.00114 (2018).
15. Oakley, H. et al. Intraneuronal beta-amyloid aggregates, neurodegeneration, and neuron loss in transgenic mice with five familial
Alzheimer’s disease mutations: Potential factors in amyloid plaque formation. J. Neurosci. 26, 10129–10140. https://doi.org/10.
1523/JNEUROSCI.1202-06.2006 (2006).
16. Cohen, R. M. et al. A transgenic Alzheimer rat with plaques, tau pathology, behavioral impairment, oligomeric abeta, and frank
neuronal loss. J. Neurosci. 33, 6245–6256. https://doi.org/10.1523/JNEUROSCI.3672-12.2013 (2013).
17. Robinson, S. D. et al. Combining phase images from array coils using a short echo time reference scan (COMPOSER). Magn.
Reson. Med. 77, 318–327. https://doi.org/10.1002/mrm.26093 (2017).
18. Wood, T. C. QUIT: QUantitative imaging tools. J. Open Source Softw. 3, 656. https://doi.org/10.21105/joss.00656 (2018).
19. O’Brien, K. R. et al. Robust T1-weighted structural brain imaging and morphometry at 7T using MP2RAGE. PLoS ONE 9, e99676.
https://doi.org/10.1371/journal.pone.0099676 (2014).
20. Avants, B. B., Epstein, C. L., Grossman, M. & Gee, J. C. Symmetric diffeomorphic image registration with cross-correlation: Evaluat-
ing automated labeling of elderly and neurodegenerative brain. Med. Image Anal. 12, 26–41. https://doi.org/10.1016/j.media.2007.
06.004 (2008).
21. Winkler, A. M., Ridgway, G. R., Webster, M. A., Smith, S. M. & Nichols, T. E. Permutation inference for the general linear model.
Neuroimage 92, 381–397. https://doi.org/10.1016/j.neuroimage.2014.01.060 (2014).
22. Tustison, N. J. et al. N4ITK: improved N3 bias correction. IEEE Trans. Med. Imaging 29, 1310–1320. https://doi.org/10.1109/TMI.
2010.2046908 (2010).
23. Helms, G. & Dechent, P. Increased SNR and reduced distortions by averaging multiple gradient echo signals in 3D FLASH imaging
of the human brain at 3T. J. Magn. Reson. Imaging 29, 198–204. https://doi.org/10.1002/jmri.21629 (2009).
24. Wei, H. et al. Streaking artifact reduction for quantitative susceptibility mapping of sources with large dynamic range. NMR Biomed.
28, 1294–1303. https://doi.org/10.1002/nbm.3383 (2015).
25. Oguz, I., Zhang, H., Rumple, A. & Sonka, M. RATS: Rapid automatic tissue segmentation in rodent brain MRI. J. Neurosci. Methods
221, 175–182. https://doi.org/10.1016/j.jneumeth.2013.09.021 (2014).
26. Schindelin, J. et al. Fiji: An open-source platform for biological-image analysis. Nat. Methods 9, 676–682. https://doi.org/10.1038/
nmeth.2019 (2012).
27. Roschzttardtz, H., Conejero, G., Curie, C. & Mari, S. Identification of the endodermal vacuole as the iron storage compartment
in the Arabidopsis embryo. Plant Physiol. 151, 1329–1338. https://doi.org/10.1104/pp.109.144444 (2009).
28. Dietrich, O. et al. MR imaging differentiation of Fe(2+) and Fe(3+) based on relaxation and magnetic susceptibility properties.
Neuroradiology 59, 403–409. https://doi.org/10.1007/s00234-017-1813-3 (2017).
29. Gong, N. J., Dibb, R., Bulk, M., van der Weerd, L. & Liu, C. Imaging beta amyloid aggregation and iron accumulation in Alzheimer’s
disease using quantitative susceptibility mapping MRI. Neuroimage 191, 176–185. https://doi.org/10.1016/j.neuroimage.2019.02.
019 (2019).
30. Dudeffant, C. et al. Contrast-enhanced MR microscopy of amyloid plaques in five mouse models of amyloidosis and in human
Alzheimer’s disease brains. Sci. Rep. 7, 4955. https://doi.org/10.1038/s41598-017-05285-1 (2017).
31. Busche, M. A. et al. Clusters of hyperactive neurons near amyloid plaques in a mouse model of Alzheimer’s disease. Science 321,
1686–1689. https://doi.org/10.1126/science.1162844 (2008).
32. Wideroe, M. et al. Manganese-enhanced magnetic resonance imaging of hypoxic-ischemic brain injury in the neonatal rat. Neu-
roimage 45, 880–890. https://doi.org/10.1016/j.neuroimage.2008.12.007 (2009).
33. Erikson, K. M. & Aschner, M. Increased manganese uptake by primary astrocyte cultures with altered iron status is mediated
primarily by divalent metal transporter. Neurotoxicology 27, 125–130. https://doi.org/10.1016/j.neuro.2005.07.003 (2006).
34. Mandrekar-Colucci, S. & Landreth, G. E. Microglia and inflammation in Alzheimer’s disease. CNS Neurol. Disord. Drug Targets
9, 156–167. https://doi.org/10.2174/187152710791012071 (2010).
35. Wallin, C. et al. Characterization of Mn(II) ion binding to the amyloid-beta peptide in Alzheimer’s disease. J. Trace Elem. Med.
Biol. 38, 183–193. https://doi.org/10.1016/j.jtemb.2016.03.009 (2016).
36. Lermyte, F. et al. Metal ion binding to the amyloid beta monomer studied by native top-down FTICR mass spectrometry. J. Am.
Soc. Mass Spectrom. 30, 2123–2134. https://doi.org/10.1007/s13361-019-02283-7 (2019).
37. Dhenain, M. et al. Characterization of in vivo MRI detectable thalamic amyloid plaques from APP/PS1 mice. Neurobiol. Aging 30,
41–53. https://doi.org/10.1016/j.neurobiolaging.2007.05.018 (2009).
38. Dahl, L. K. A simple and sensitive histochemical method for calcium. Proc. Soc. Exp. Biol. Med. 80, 474–479. https://doi.org/10.
3181/00379727-80-19661 (1952).
39. Aggarwal, M., Li, X., Grohn, O. & Sierra, A. Nuclei-specific deposits of iron and calcium in the rat thalamus after status epilepticus
revealed with quantitative susceptibility mapping (QSM). J. Magn. Reson. Imaging 47, 554–564. https://d oi.o rg/1 0.1 002/j mri.2 5777
(2018).
40. Mori, F., Tanji, K. & Wakabayashi, K. Widespread calcium deposits, as detected using the alizarin red S technique, in the nervous
system of rats treated with dimethyl mercury. Neuropathology 20, 210–215. https://doi.org/10.1046/j.1440-1789.2000.00341.x
(2000).
41. Wideroe, M. et al. Longitudinal manganese-enhanced magnetic resonance imaging of delayed brain damage after hypoxic-ischemic
injury in the neonatal rat. Neonatology 100, 363–372. https://doi.org/10.1159/000328705 (2011).
42. Dietrich, P., Johnson, I. M., Alli, S. & Dragatsis, I. Elimination of huntingtin in the adult mouse leads to progressive behavioral
deficits, bilateral thalamic calcification, and altered brain iron homeostasis. PLoS Genet. 13, e1006846. https://doi.org/10.1371/
journal.pgen.1006846 (2017).
43. Ni, R. et al. Tau deposition is associated with imaging patterns of tissue calcification in the P301L mouse model of human tauopathy.
bioRxiv https://doi.org/10.1101/851915 (2019).
44. Fraser, H. Bilateral thalamic calcification in ageing mice. J. Pathol. Bacteriol. 96, 220–222. https://d
oi.o
rg/1 0.1 002/p ath.1 70096 0124
(1968).
45. Lemos, R. R., Ferreira, J. B., Keasey, M. P. & Oliveira, J. R. An update on primary familial brain calcification. Int. Rev. Neurobiol.
110, 349–371. https://doi.org/10.1016/B978-0-12-410502-7.00015-6 (2013).
46. Sudarshana, D. M. et al. Manganese-enhanced MRI of the brain in healthy volunteers. AJNR Am. J. Neuroradiol. 40, 1309–1316.
https://doi.org/10.3174/ajnr.A6152 (2019).
Acknowledgements
The authors thank the Wohl Cellular Imaging Centre (http://w
ww.k clwci c.c o.u
k) for the use of their slide scanner.
SCRW would also like to thank the Wellcome Trust and Medical Research Council for their ongoing support of
our neuroimaging research.
Scientific Reports | (2021) 11:12419 | https://doi.org/10.1038/s41598-021-91899-5 14
Vol:.(1234567890)You can also read