Analysis of microbial contamination of household water purifiers
←
→
Page content transcription
If your browser does not render page correctly, please read the page content below
Applied Microbiology and Biotechnology (2020) 104:4533–4545
https://doi.org/10.1007/s00253-020-10510-5

    ENVIRONMENTAL BIOTECHNOLOGY

Analysis of microbial contamination of household water purifiers
Wenfang Lin 1 & Chengsong Ye 2 & Lizheng Guo 1,3 & Dong Hu 1,3 & Xin Yu 2

Received: 23 October 2019 / Revised: 13 February 2020 / Accepted: 28 February 2020 / Published online: 19 March 2020
# Springer-Verlag GmbH Germany, part of Springer Nature 2020

Abstract
Household water purifiers are increasingly used to treat drinking water at the household level, but their influence on the
microbiological safety of drinking water has rarely been assessed. In this study, representative purifiers, based on different
filtering processes, were analyzed for their impact on effluent water quality. The results showed that purifiers reduced chemical
qualities such as turbidity and free chlorine. However, a high level of bacteria (102–106 CFU/g) was detected at each stage of
filtration using a traditional culture-dependent method, whereas quantitative PCR with propidium monoazide (PMA) treatment
showed 106–108 copies/L of total viable bacteria in effluent water, indicating elevated microbial contaminants after purifiers. In
addition, high-throughput sequencing revealed a diverse microbial community in effluents and membranes. Proteobacteria
(22.06–97.42%) was the dominant phylum found in all samples, except for purifier B, in which Melainabacteria was most
abundant (65.79%). For waterborne pathogens, Escherichia coli (100–106 copies/g) and Pseudomonas aeruginosa (100–105
copies/g) were frequently detected by qPCR. Sequencing also demonstrated the presence of E. coli (0–6.26%), Mycobacterium
mucogenicum (0.01–3.46%), and P. aeruginosa (0–0.16%) in purifiers. These finding suggest that water from commonly used
household purifiers still impose microbial risks to human health.

Keywords Household treatment purifiers . Microbial contamination . Membrane filtration . Waterborne pathogens .
High-throughput sequencing . PMA-qPCR

Introduction                                                                 because of waterborne illness each year (WHO 2006). To control
                                                                             microbiological risks, water is generally disinfected to kill path-
In the past decades, source water has been increasingly contam-              ogens before entering the drinking water distribution system.
inated by various chemicals and emerging pollutants, which rep-              However, some persistent bacteria remain in water, and even
resents a great concern for public health (Hu et al. 2018; Shi et al.        proliferate and grow in pipelines (Douterelo et al. 2018; Vaz-
2018). People’s demand for safe and healthy drinking water is                Moreira et al. 2017). Traditional treatment techniques do not
increasing, creating a challenge for public water suppliers. The             efficiently remove all chemical and microbiological contami-
microbiological safety of drinking water is crucial for human                nants. Therefore, point of use (POU) or household water treat-
health. It is estimated that five million people lose their lives            ment methods can be useful to improving the quality and safety
                                                                             of drinking water.
                                                                                 Household water purifier can include multi-step activated
Electronic supplementary material The online version of this article         carbon or special absorbent material filters and key step mem-
(https://doi.org/10.1007/s00253-020-10510-5) contains supplementary
material, which is available to authorized users.                            brane filters. Activated carbon treatment can effectively ad-
                                                                             sorb organic substances and residual disinfectants, improving
* Xin Yu                                                                     water quality and taste (Korotta-Gamage and Sathasivan
  xyu@xmu.edu.cn                                                             2017). In addition, membrane filtration is another process that
                                                                             physically removes various contaminants, including bacteria,
1
     Key Laboratory of Urban Environment and Health, Institute of Urban      viruses, suspended solids, and heavy metals (Shirasaki et al.
     Environment, Chinese Academy of Sciences, Xiamen 361021, China
                                                                             2017; Wang et al. 2013). Commonly used membrane filtration
2
     College of the Environment and Ecology, Xiamen University,              technologies include microfiltration (MF), ultrafiltration (UF),
     Xiamen 361005, China
                                                                             and reverse osmosis (RO), which can filter out 0.5–5-, 0.005–
3
     University of Chinese Academy of Sciences, Beijing 100049, China        0.5-, and 0.0007–0.005-μm particles, respectively (Hoslett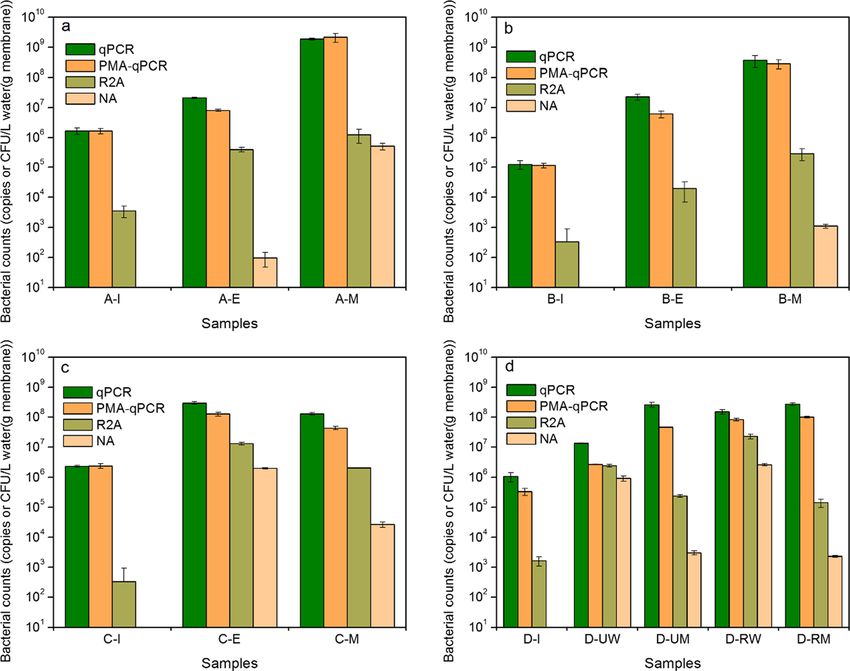
4534                                                                                             Appl Microbiol Biotechnol (2020) 104:4533–4545

et al. 2018). However, biofilms generated on the surfaces of         Table 1     Description of household water purifiers examined in this study
moist activated carbon can detach and enter effluents, causing       Purifiers    Service time     Membrane technology       Producing country
public health problems (Gibert et al. 2013). Similarly, membrane
filtration systems are also easily fouled by attached microorgan-    A            2   years        UF                        China
isms during routine operation (Shao et al. 2018; Wei et al. 2011).   B            1   year         UF                        America
Membrane fouling of household water purifiers can decrease           C            5   years        RO                        China
membrane flux, and biofilms released from membrane surface           D            1   year         UF and RO                 China
can lead to excessive bacteria in effluents (Su et al. 2009). A
                                                                     UF is ultrafiltration; RO is reverse osmosis
previous study showed that the clinical relevance of
Pseudomonas aeruginosa isolated from filters of household wa-
ter treatment systems (Mombini et al. 2019). However, there is
                                                                     2006) before the devices were disassembled. Several indices
limited information on microbial contaminants and membrane
                                                                     such as temperature, DO, and free chlorine were measured on
fouling in household water purifiers.
                                                                     site at the time of sampling. To obtain representative samples,
    The quality of drinking water is traditionally assessed by
                                                                     the water was left running for 5 min before collection. After
measuring cultivable bacteria and attempting to detect fecal
                                                                     this, 1.5 L of influent and effluent water was collected in
indicator bacteria (Gillespie 2016). However, only a slight
                                                                     sterile bottles. The number of total bacteria was determined
fraction (below 1%) of bacteria in drinking water system can
                                                                     by spread plating on nutrient agar (NA) medium at 37 °C for
be measurable by culture-dependent methods; a large propor-
                                                                     48 h or on R2A agar at 28 °C for 5 days (Liu et al. 2019).
tion of bacteria are in a viable but non-culturable (VBNC)
                                                                     Moreover, 10 L of influent and effluent water was filtered
state (Hammes et al. 2008). Therefore, PCR-based techniques
                                                                     through 0.22-μm membrane filters (Millipore, Billerica,
have been developed to rapidly, accurately, and more compre-
                                                                     MA, USA) in duplicate at each sample site for later DNA
hensively survey microorganisms. For instance, high-
                                                                     extraction.
throughput sequencing (HTS) is widely used to show the mi-
crobial diversity in drinking water systems (Bae et al. 2019;
Gerrity et al. 2018; Lin et al. 2014). In addition, quantitative     Microorganism collection from padding materials
PCR (qPCR) can target at specific microbes, including path-          and membrane filters
ogens (Cui et al. 2017). Furthermore, propidium monoazide
(PMA)–modified PCR method can be applied to distinguish              To detect microorganisms attached on different purifiers,
live from dead cells by inhibiting amplification of DNA from         each treatment unit was split using a saw. Diagrams of
dead cells, which represent real health risks associated with        each purifier are shown in Fig. S1. In purifier A, drinking
drinking water (Gensberger et al. 2014).                             water was successively treated with a polypropylene (PP)
    This study aimed to investigate microbial contaminations         cotton filter → pre-activated carbon (AC) filter → AC
in household water purifiers, as well as microbial health risks      filter → composite material (CM) filter → ultrafiltration
to humans. Specific objectives were the following: (1) enu-          (UF) membrane filter, and finally post-activated carbon
merate total bacteria both in the water phase and in filter units    (AC) filter. The treatment process of Purifier B was sim-
of each treatment process; (2) compare total, viable, and            pler, with only three steps: PP cotton filter, UF membrane
culturable bacteria in water and membrane samples; (3) char-         filter, and compressed AC filter. In purifier C, drinking
acterize microbial communities using HTS technology; and             water was continuously treated with five major steps: PP
(4) quantify common waterborne pathogens.                            cotton filter → pre-AC filter → pre-AC filter → reverse
                                                                     osmosis (RO) membrane filter → post-AC filter. Purifier
                                                                     D employed a series of treatment processes: PP cotton
Materials and methods                                                filter, compressed AC filter, UF membrane filter or RO
                                                                     membrane filter, and post-AC filter.
Water sample collection and water quality                                To obtain the bacteria adhering to membranes, the mem-
measurement                                                          branes were cut into pieces using sterile scissors. Both the
                                                                     packing material and membrane samples were placed in a
Four representative household water purifier devices designed        sterile saline solution for sonic treatment (KQ-500DE,
with different treatment processes and service times were ob-        China) at 30 min and 40 kHz to separate biomass from the
tained from residents. Detailed descriptions are provided in         matrix (Shi et al. 2013). After that, the suspension was left
Table 1. The influent and effluent water quality (i.e., temper-      standing for 5 min to remove large particles, and the superna-
ature, pH, free chlorine, dissolved oxygen (DO), turbidity, and      tant was used to determine the amount of biomass in biofilms.
organic matter indices) was measured three times following           The number of total bacteria was determined on NA or R2A
the National Standards for Drinking Water Quality (GB 5749-          agar plates in the above incubation conditions.
Appl Microbiol Biotechnol (2020) 104:4533–4545                                                                                    4535

PMA treatment and DNA extraction                                     Quantification of total bacteria and potential
                                                                     pathogens
To extract total genomic DNA, the supernatants from mem-
brane samples were concentrated by filtering through mem-            Total bacteria were quantified based on 16S rRNA using SYBR
brane filters with a 0.22-μm pore size in duplicate. The             Green qPCR. For the SYBR Green qPCR assay, each 20-μL
second aliquots of membrane filters were intended for pre-           reaction mixture included 10 μL of SYBR Premix Ex Tap
treatment by evenly dropping 500 μL PMA dye (Biotium                 (Takara, Japan), 0.4 μL of each primer (10 μmol/L), and 1 μL
Inc., USA) on the surfaces of filters at a final PMA concen-         of template DNA. The PCR cycling procedures were the follow-
tration of 50 μg/mL, which was demonstrated to be an effi-           ing: 95 °C for 30 s, followed by 35 cycles of 95 °C for 5 s, 60 °C
cient concentration based on previous studies (Chen et al.           for 30 s, 72 °C for 30 s, and then 1 cycle of 72 °C for 7 min. In
2017; Hu et al. 2019). In brief, filters were incubated in the       addition, a TaqMan probe was designed to target five potential
dark for 5 min and then subsequently held on ice and hor-            pathogens, namely P. aeruginosa, Salmonella enterica, Shigella,
izontally exposed to a 650-W halogen light at a distance of          Escherichia coli, and Legionella pneumophila with 6-carboxy-
approximately 20 cm for 4 min (Gensberger et al. 2014; Liu           fluoresein (FAM) as the fluorescent reporter on the 5′ end and 6-
et al. 2018). Finally, both the pre-treated and non-treated          carboxytetramethylrhodamine (TAMRA) as the quencher dye on
samples were cut into small pieces and used for total DNA            the 3′ end. For the real-time qPCR assay, each 20-μL reaction
extraction with a FastDNA SPIN Kit (MP Biomedicals,                  mixture contained 10 μL of 2× PCR mixture, 1.0 μL of each
USA) following the manufacturer’s instructions. DNA con-             primer, 0.5 μL of each 10 μM probe, and 1 μL DNA template.
centration and purity were measured using a ND-1000                  The reaction procedures included an initial denaturation step at
NanoDrop spectrophotometer (NanoDrop Technologies,                   95 °C for 10 min, followed by 40 cycles at 95 °C for 15 s and,
Wilmington, USA).                                                    60 °C for 1 min. All qPCRs were performed on a 7300 real-time
                                                                     PCR system (ABI 7300, Applied Biosystems, USA). The primer
                                                                     sequences used are listed in Table S1. Both DNA templates and
Illumina high-throughput sequencing                                  negative controls (DNA replaced with nuclease-free water) were
                                                                     run in triplicate. In addition, a melting curve was prepared to
To determine the diversity and composition of bacterial              verify primer specificity. All standard qPCR curves were con-
communities in water and membrane samples, DNA was                   structed from 10-fold serial dilutions of the plasmid carrying
amplified using forward primer 515F (5′GTGCCAGC                      target genes ranging from 102 to 107 gene copies per microliter.
MGCCGCGGTAA-3′) and reverse primer 907R (5′-                         The number of target gene copies was calculated based on Ct
CCGTCAATTCCTTTGAGTTT-3′) targeting the V4–V5                         values compared with the standard curves described above.
regions of 16S rRNA (Zhang et al. 2018). In detail,
DNA was first amplified by PCR at 95 °C for 5 min,
followed by 30 cycles at 95 °C for 40 s, 58 °C for                   Observation of microbes on membranes by scanning
40 s, 72 °C for 40 s, and a finial extension at 72 °C                electron microscopy
for 7 min. PCR products were purified using an
AxyPrepDNA Gel Kit (Axygen, CA, USA), and se-                        The microbial morphology of microbes on membranes was
quencing was performed on an Illumina MiSeq platform                 directly observed by scanning electron microscopy (SEM).
using standard procedures (Novogene Bioinformation                   Membrane samples were fixed in 2.5% glutaraldehyde in
Technology Co., Ltd., China).                                        phosphate-buffered saline (PBS) for 1 h at 4 °C and washed
   Raw sequences were filtered and analyzed using a                  three times with PBS at room temperature. Each sample
pipeline in Quantitative Insights into Microbial Ecology             underwent graded dehydration with 30%, 50%, 70%, and
(QIIME) software to exclude low-quality and chimeric                 90% alcohol for 10 min and then treatment with 100% pure
sequences as described in a previous report (Wang et al.             ethyl alcohol for 20 min. Finally, the samples were dried over-
2018). After this, the sequences were clustered into oper-           night in a critical point dryer before analysis by SEM (SEM,
ational taxonomic units (OTUs) with a 97% threshold.                 Hitachi S-4800, Japan).
Species diversity was evaluated in mothur (http://www.
mothur.org). A representative sequence for each OTU
was aligned using the Silva database and Ribosome Database           Statistical analysis
Project classifier (Song et al. 2018). Hierarchical clustering was
conducted to visualize similarities in bacterial communities         The physicochemical and biological data from the influent
based on unweighted UniFrac metrics. The raw sequencing              and effluent water samples were compared statistically with
data has been submitted to the NCBI Sequence Read Archive            an analysis of variance (ANOVA) and a significance level of
(SRA) with the project accession code of PRJNA576308.                p < 0.05 using IBM SPSS Statistics 22.0 software.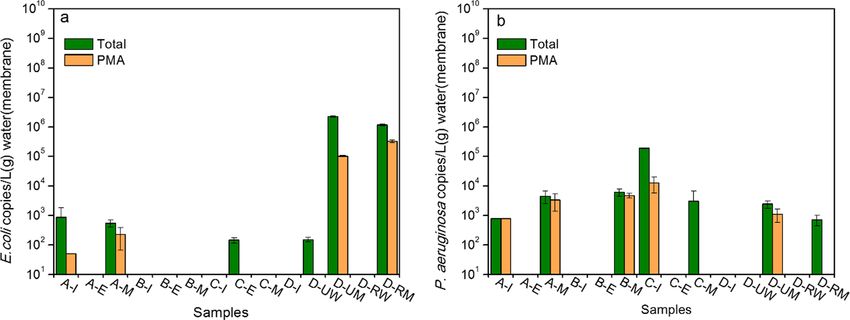
4536                                                                                                   Appl Microbiol Biotechnol (2020) 104:4533–4545

Results                                                                        filtration, and bacterial concentrations were higher on external
                                                                               surfaces (2.58 × 10³–3.78 × 10⁵ CFU/g) than on internal sur-
Water quality characteristics                                                  faces (6.12 × 10²–3.11 × 10⁵ CFU/g) because the water in
                                                                               these systems flowed from outside to inside. In addition, we
As shown in Table 2, levels of free chlorine in effluent water                 found that the color of PP cotton filters became yellow by the
(0.00–0.06 mg/L) were significantly lower than those in all                    naked eye (data not shown). Moreover, 1.51 × 10⁴–2.88 ×
influent water (0.41–0.74 mg/L). pH values were around neu-                    105 CFU/g of bacteria was maintained in one-step or multi-
tral (6.71–7.38) for all water samples, except for effluent water              step pre-activated carbon or complex material filters in all
from RO membranes in purifier D (6.26 ± 0.37). DO ranged                       purifiers except purifier D. In purifier D, although the number
from 8.28 to 8.70 mg/L, but DO in the effluents of purifier C                  of bacteria in pre-activated carbon was only 1.59 × 101 CFU/g
(RO 5.06 ± 0.11) and purifier D (UF 4.23 ± 0.10, RO 3.79 ±                     on NA medium, there were still 1.03 × 10⁶ CFU/g bacteria
0.88) were significantly less. Turbidity of 0.08–0.53 NTU was                  grown on R2A medium. It should also be noted that there were
observed in influent water samples, but this was less in efflu-                no pre-activated carbon filters in purifier B.
ent water samples (below 0.02 NTU), except for effluent from                       The concentration of bacteria increased to 1.12 × 10³–
the UF membrane in purifier D (0.09 NTU). The values of                        1.24 × 10⁶ CFU/g at the membrane filtration step. Microbial
NO3-N and total organic carbon (TOC) were slightly de-                         attachment on membrane filters was directly verified by SEM
creased after UF membrane filtration, but were significantly                   (Fig. 2). Microbes were scattered or assembled in small
reduced after RO membrane filtration. As for temperature, it                   groups on the surfaces of membranes. However, a lower level
ranged from 22.33 to 23.43 °C in three independent sam-                        (1.12 × 10³ CFU/g) of bacteria was detected on a UF mem-
plings. Finally, it should be noted that no bacteria were detect-              brane from purifier B on NA medium, which might be due to
ed from influent water cultivated in NA medium, but high                       remaining free chlorine as there was no pre-activated carbon
levels of bacteria (0.67–2.59 × 10⁵ CFU/100 mL) were detect-                   filter in this purifier. It should be noted that still 3.33 × 100–
ed in effluent water, especially after RO treatment.                           5.98 × 10³ CFU/g of bacteria persisted in post-activated car-
                                                                               bon filters. Finally, the number of bacteria in effluent water
                                                                               (2.0 × 10⁴–2.30 × 10⁷ CFU/L) was significantly higher than
Microbial contaminants in each processing unit                                 that in influent water (3.33 × 10²–3.67 × 10⁴ CFU/L) when
                                                                               counted on R2A medium.
To analyze microbial contaminants at each filtration step in
purifiers, filtration units were disassembled. The bacteria at-
tached padding materials and membranes were enumerated                         Viability of bacteria in water and membrane samples
(Fig. 1). No bacteria grew on NA medium, but 3.33 × 10²–
3.67 × 10³ CFU/L bacteria were detected in influent water by                   In this study, three methods, including traditional qPCR,
R2A plating. Similarly, more bacteria were found on R2A                        PMA-modified qPCR, and culture, were employed to quantify
plates than on NA medium at other treatment steps.                             microbial contaminants. As shown in Fig. 3, a high level of
Subsequently, high levels of bacteria (6.12 × 10²–3.78 ×                       1.26 × 10⁵–2.28 × 10⁶ copies/L total bacteria was detected in
105 CFU/g) were retained at the first step of PP cotton                        influent water by traditional qPCR, and the concentration of

Table 2   Characteristics of water quality

Samples pH                  Free chlorine (mg/L) DO (mg/L) Turbidity           NO3—N (mg/        TOC (mg/L) Temperature           HPC (CFU/
                                                           (NTU)               L)                           (°C)                  100 mL)

A-I       7.36   ±   0.04   0.46 ± 0.01        8.61   ±   0.05   0.53 ± 0.01   1.00   ±   0.01   0.82 ± 0.08   22.33   ±   2.32   ND
A-E       7.35   ±   0.06   0.05 ± 0.01        8.55   ±   0.03   ND            0.90   ±   0.00   0.79 ± 0.09   22.47   ±   2.71   9.67 ± 4.93
B-I       7.36   ±   0.03   0.74 ± 0.04        8.61   ±   0.01   0.12 ± 0.01   1.81   ±   0.02   0.92 ± 0.04   22.63   ±   2.34   ND
B-E       7.38   ±   0.07   0.06 ± 0.01        8.70   ±   0.08   0.02 ± 0.00   1.38   ±   0.00   0.91 ± 0.01   22.60   ±   2.78   0.67 ± 1.15
C-I       7.16   ±   0.14   0.41 ± 0.01        8.63   ±   0.03   0.09 ± 0.01   1.19   ±   0.00   1.11 ± 0.18   23.07   ±   2.12   ND
C-E       7.12   ±   0.04   ND                 5.06   ±   0.11   0.01 ± 0.00   0.08   ±   0.07   0.12 ± 0.02   22.97   ±   1.61   (1.97 ± 0.12) × 105
D-I       7.13   ±   0.11   0.58 ± 0.09        8.28   ±   0.27   0.08 ± 0.01   1.16   ±   0.02   0.72 ± 0.09   23.03   ±   2.29   ND
D-UW      6.71   ±   0.02   0.01 ± 0.01        4.23   ±   0.10   0.09 ± 0.04   1.39   ±   0.11   0.47 ± 0.01   23.43   ±   2.25   (9.33 ± 1.77) × 104
D-RW      6.26   ±   0.37   0.02 ± 0.01        3.79   ±   0.88   0.01 ± 0.00   0.16   ±   0.01   0.08 ± 0.01   22.96   ±   1.79   (2.59 ± 0.22) × 105

Results were the average value of three independent sampling event (mean ± SD); ND is not detected; HPC (heterotrophic plate count) indicates the
number of total bacteria on NA agar plate. Samples A-I, B-I, C-I, and D-I, and A-E, B-E, C-E, D-UW, and D-RW are influent and effluent water from
purifiers A, B, C, and D, respectively. UW is UF effluent; RW is RO effluent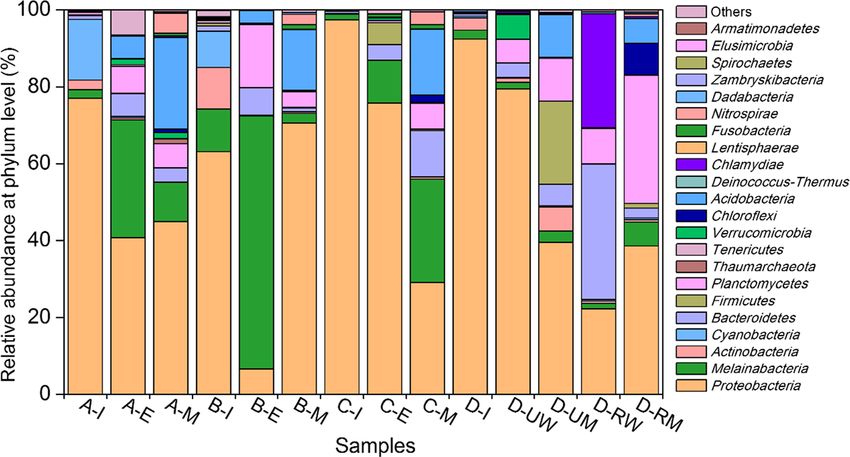
Appl Microbiol Biotechnol (2020) 104:4533–4545                                                                                                    4537

Fig. 1 The number of total
bacteria from different purifiers
determined by incubation in NA
and R2A media. a Filter A, b filter
B, c filter C, and d filter D

total viable bacteria, including cultivable and VBNC cells,                   PMA-qPCR can reveal real active bacterial cells including
was almost at the same level (1.16 × 10 5 –2.34 × 10 6                        cells in VBNC state and cultivable cells in household water
copies/L) revealed by PMA-modified qPCR. However, the                         purifiers. For example, only 9.67 × 101, 6.67 × 100, and
concentration of cultivable cells on R2A medium ranged                        1.97 × 10⁶ CFU/L were detected by microbiological culture
3.33 × 10²–3.67 × 10³ CFU/L in influent water. Besides,                       on NA plates in effluent water from purifiers A, B, and C,

Fig. 2 Scanning electron micrographs of microorganisms attached to surfaces of different filters membranes. a Ultrafiltration (UF) membrane from filter
A, b UF membrane from filter B, c reverse osmosis (RO) membrane from filter C, d UF membrane from filter D, and e RO membrane from filter D
4538                                                                                    Appl Microbiol Biotechnol (2020) 104:4533–4545

Fig. 3 Concentrations of total
bacteria from different purifiers
determined by molecular and
culture-dependent technologies. a
Filter A, b filter B, c filter C, and
d filter D

respectively, but total viable bacteria from these purifiers       bacteria were detected in effluent water filter through UF
based on PMA-qPCR remained at 8.08 × 10⁶, 6.06 × 10⁶,              and RO membranes, respectively. Finally, many bacterial cells
and 1.28 × 10⁸ copies/L. According to previous studies             (4.36 × 10⁷–2.18 × 10⁹ copies copies/g) on membrane sam-
(Klappenbach et al. 2000; Stoddard et al. 2014), the copy          ples were also detected by PMA-qPCR.
number of rRNA operons per bacterial genome varies from
1 to as many as 15. Thus, the concentration of total viable        Bacterial diversity and community composition
bacterial cells ranged from 5.39 × 10⁵ to 8.08 × 10⁶, from         in water and membrane samples
4.04 × 10⁵ to 6.06 × 10⁶, and from 8.51 × 10⁶ to 1.28 × 10⁸
cells/L, respectively. So, the difference between the total via-   As shown in Table 3, 14 16S rRNA gene (V4–V5) libraries
ble bacterial cells and cultivable cells was 2–5 order of mag-     were constructed to reveal bacterial communities in influent
nitude; i.e., 76.82–100% of the viable cell entered the VBNC       water, effluent water, and membrane samples from four
state. However, considering the concentration of cultivable        household water purifiers. After removing low-quality se-
cells on R2A plates, which was 3.97 × 10⁵, 2.00 × 10⁴, and         quences and chimeras, 964,561 effective sequences were ob-
1.32 × 10⁷ CFU/L, thus, the proportion of microorganisms in        tained. The sequence number of each sample was normalized
VBNC state ranged from 26.35 to 95.09%, from 95.05 to              and 202–400 OTUs were identified. Notably, microbial com-
99.67%, and from 0 to 89.66%. In addition, the percentage          munity diversity and species richness in effluent water and
of microorganisms in VBNC state from UF effluent of purifier       membranes were significantly higher than those in influent
D ranged from 0 to 9.62% by R2A plate and from 0 to 64.90%         water. For example, the Shannon index for effluent water
by NA plate. These values might be lower than actual ones          and membranes from purifier C were 5.05 and 5.07, respec-
because of experimental error. Therefore, a large part of bac-     tively, while this value was 2.17 in influent water. Similar
teria entered the VBNC state in this study.                        trends were observed in other samples. Furthermore, the cov-
    Moreover, the concentrations of bacterial cells in effluent    erage index of all samples was over 99.6%, suggesting that
water and membrane samples were significantly higher than          sequencing depth was enough to reveal the bacterial commu-
those in influent water for all purifiers. From purifier C, PMA-   nity in these samples.
qPCR showed 1.28 × 10⁸ copies/L total viable bacteria in ef-          Bacterial communities from all samples were primarily
fluent water and 4.36 × 10⁷ copies/g on membrane compared          dominated by Proteobacteria (22.06–77.04%), except for
with 2.34 × 10⁶ copies/L in influent water. In purifier D,         those in effluent water from purifier B (B-E 6.61%) (Fig. 4).
2.26 × 10⁶ copies/L and 8.29 × 10⁶ copies/L total viable           In particular, a high proportion (97.42%) of bacterial
Appl Microbiol Biotechnol (2020) 104:4533–4545 4539
Table 3 Bacterial diversity of
each sample from different Samples Sequences OTUs Shannon Simpson Ace Chao1 Coverage (%)
purifiers based on high-
throughput sequencing of 16S A-I 74,098 268 2.17 0.45 246.74 245.37 99.8
rRNA gene A-E 42,643 269 5.05 0.94 258.61 252.95 99.9
A-M 80,038 387 5.07 0.92 365.02 377.36 99.8
B-I 78,846 287 3.68 0.73 271.25 286.31 99.8
B-E 74,809 255 3.52 0.85 236.69 234.37 99.8
B-M 80,144 400 5.76 0.96 437.16 444.14 99.7
C-I 65,565 202 0.69 0.14 189.89 177.08 99.8
C-E 80,159 289 4.33 0.88 253.19 252.91 99.8
C-M 80,107 397 5.58 0.96 477.26 484.16 99.6
D-I 69,592 176 1.36 0.33 192.89 188.19 99.9
D-UW 60,882 219 4.07 0.88 240.85 242.38 99.9
D-UM 60,087 294 5.37 0.96 318.60 313.59 99.9
D-RW 64,608 231 3.30 0.80 250.95 247.00 99.9
D-RM 52,983 354 5.06 0.90 367.06 373.33 99.9
OTUs is operational taxonomic units. Sample names A-I, B-I, C-I, and D-I mean the influent water from purifiers
A, B, C, and D, respectively; A-E, B-E, C-E, D-UW, and D-RW mean the effluent water from purifiers A, B, C,
and D, respectively; A-M, B-M, C-M, D-UM, and D-RM mean the membrane samples from purifier A, B, C, and
D, respectively; UM is ultrafiltration membrane, RM is reverse osmosis membrane, UW is UF effluent, and RW is
RO effluent
sequences from influent water for purifier C (C-I) were clas- analysis based on unweighted UniFrac metrics determined
sified as Proteobacteria. The phylum Cyanobacteria was also that the microbial community from effluent water was more
relatively abundant in influent water samples from purifier A likely to cluster with that on membranes (Fig. S2).
(15.74%) and purifier B (9.28%). For sample B-E, Furthermore, the bacterial community in purifier D was rela-
Melainabacteria was the most abundant phylum, occupying tively distinct from that in the other purifiers.
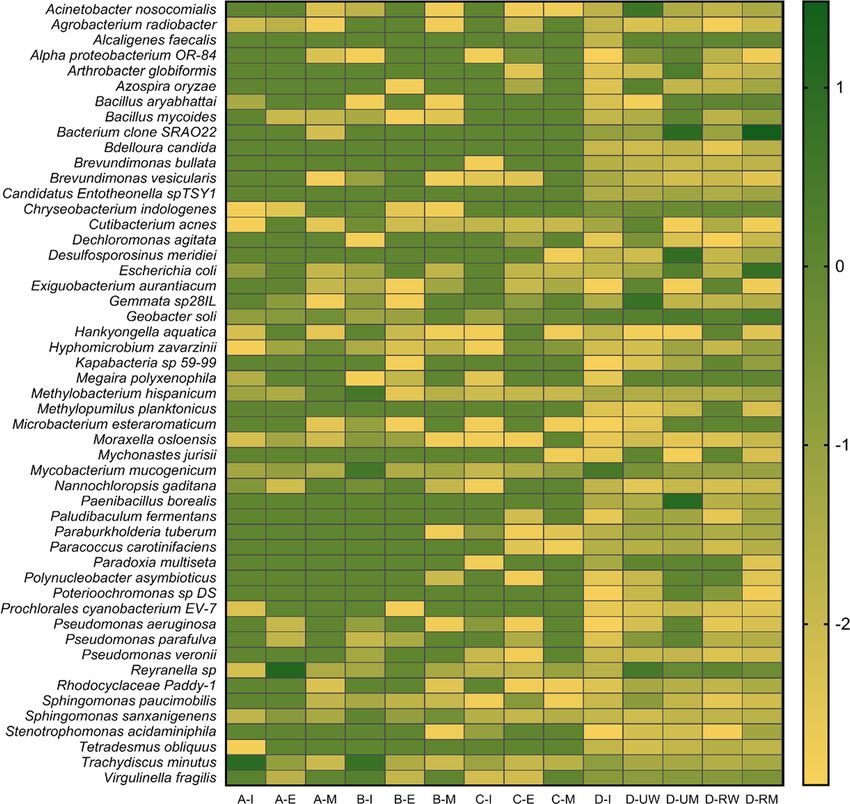
65.79% of total sequences. In addition, Acidobacteria from The top 50 genera in bacteria communities analyzed in this
influent water showed low abundant (0.07–0.09%), whereas study are listed in Fig. 5. Genera whose abundance was above
these bacteria were highly abundant on membrane samples 5% in these samples were Bacterium clone SRAO 22 (0–
(6.41–23.75%) and relatively less abundant in effluent water 30.21%), Reyranella sp. (0.01–14.71%), Paenibacillus
samples (0.22–5.79%). Similarly, Planctomycetes and borealis (0–12.08%), Trachydiscus minutus (0.01–9.32%),
Bacteroidetes displayed a higher abundance in effluent water Desulfosporosinus meridiei (0–7.46%), and Gemmata sp.
and membrane samples than in influent water. The cluster 28IL (0–5.54%). In addition, with an alignment against the
Fig. 4 Microbial communities in water and membrane samples from respectively; A-M, B-M, C-M, D-UM, and D-RM mean the membrane
different purifiers at the phylum level. A-I, B-I, C-I, and D-I mean the samples from purifiers A, B, C, and D, respectively; UM is an ultrafiltra-
influent water from purifiers A, B, C, and D, respectively; A-E, B-E, C-E, tion membrane, RM is a reverse osmosis membrane, UW is UF effluent,
D-UW, and D-RW mean the effluent water from purifiers A, B, C, and D, and RW is RO effluent4540 Appl Microbiol Biotechnol (2020) 104:4533–4545
Fig. 5 Heatmap showing the top 50 genera detected in water and membrane samples from different purifiers. Values indicate the log10-transformed
relative abundance of bacteria in each genus. The sample names are the same as those mentioned above
pathogen database, potential pathogens were detected in these positive for E. coli detection using qPCR, and the gene copy
samples. It is worth noting that E. coli was abundant in UF numbers of this strain varied in the range of 5.11 × 101–2.23 ×
(1.60%) and RO (6.26%) membranes from purifier D. 106 copies per liter water or gram membrane. Especially, the
Mycobacterium mucogenicum was more frequently detected concentrations of E. coli on UF and RO membranes from
in influent water (2.84%) and effluent water of UF membranes purifier D were 2.23 × 10⁶ and 1.16 × 10⁶ copies/g, respec-
(0.34%) from purifier D, and influent water (3.46%) in puri- tively, although the concentrations of viable E. coli were a
fier B. Moreover, the abundance of P. aeruginosa, a major little lower (1.02 × 10⁵ and 3.21 × 10⁵ copies/g) for these
pathogen in nosocomial infections, accounted for 0–0.16% two samples tested by PMA-qPCR. In purifier D, E. coli
of total bacteria in the communities tested. was negative in influent water (D-I), whereas a level of
1.52 × 10² copies/L was detected in the effluent water of UF
Quantification of potential waterborne pathogens filters (D-UW).
In P. aeruginosa, the expression of Exotoxin A is under the
Of the five pathogens tested, only E. coli and P. aeruginosa control of the regulatory gene regA (Storey et al. 1991; Wolz
were detected in these samples by qPCR (Fig. 6). The Ct et al. 1994). Previous study used regA gene to detect this
values of S. enterica, Shigella, and L. pneumophila were all important waterborne pathogen P. aeruginosa in municipal
below or near the detection limit for all samples. Six samples, wastewater system and showed high sensitivity and specificity
including A-I, A-M, C-E, D-UW, D-UM, and D-RM, were (Lee et al. 2006). So, regA gene was also selected to quantifyAppl Microbiol Biotechnol (2020) 104:4533–4545 4541
Fig. 6 Concentrations of potential pathogens in the water phase and membrane samples. a Escherichia coli and b Pseudomonas aeruginosa. The sample
names are the same as those mentioned above
the concentration of P. aeruginosa in household water puri- UF because of their smaller pore sizes (Warsinger et al. 2018).
fiers in this study. It was found that the concentrations of the Previous studies have indicated that a physical separation pro-
reg gene, including those for P. aeruginosa, were near or cess, i.e., membrane filtration (Albergamo et al. 2019; Schurer
below the detection limit in all water samples, except for in- et al. 2019), together with a biological process, i.e., activated
fluent water from purifier C with 1.88 × 10⁵ copies/L. It is also carbon filtration (Korotta-Gamage and Sathasivan 2017), can
important to note that P. aeruginosa was most likely to be effectively remove organic compounds. Our results indicate
found on membranes ranging from 2.44 × 10³ to 6.14 × 10³ that household water purifiers indeed ameliorate water quality,
copies/g, but it was not detected in effluent water. Similarly, either in taste or in chemical characteristics.
M. mucogenicum was identified at a low abundance by se- It should be noted that no bacteria were detected from in-
quencing, but the presence of this organism was not further fluent water cultivated in NA medium, but they were detected
verified, because this bacterium should be contained at or in effluent water, especially after RO treatment. Some factors
beyond Biosafety Level-2 for DNA extraction and standard such as residual disinfectants, non-cultivability of microor-
plasmid construction. ganisms, or inadequate growth conditions may result in the
failure to detect bacteria in influent water samples (Gillespie
et al. 2014; Li et al. 2018). As mentioned above, 0.41–
Discussion 0.74 mg/L of free chlorine was still present in influent water,
and this could inhibit microbial regrowth. However, free chlo-
Providing safe drinking water for consumers presents a great rine was depleted with step-by-step filtering. In these cases,
challenge as source water quality continues to deterioration. surviving or injured microbes can attach, regrow, and prolif-
Household water purifiers are widely used to ensure safe and erate on the surfaces of padding materials and membranes,
high-quality drinking water. Multi-step activated carbon filters illustrating the microbial health risks of effluent water.
and membrane filters are widely coupled in purifiers to im- Besides, although no bacteria grew on NA medium, yet more
prove drinking water quality. However, little information on bacteria were found on R2A plates than on NA medium in
best procedures to ensure the microbial safety of drinking influent water as well as other samples. In general, low-
water is available. In this study, free chlorine and turbidity nutrient R2A medium can be used to recover many species
were removed significantly after activated carbon filtration. of bacteria, and is more suitable to determining total counts of
AC filters are commonly used for pre-filtration or post- heterotrophic bacteria in drinking water systems when com-
filtration in household water purifier processes because of pared with NA medium (Deininger and Lee 2005).
their large surface area, microporous structure, and high sur- A high level of microbial contaminants was detected at
face reactivity (El Gamal et al. 2018; McQuillan et al. 2018). each stage of filtration. PP cotton filters, as the first step of
They can efficiently adsorb various organic and odor com- purifiers, play a key role in intercepting with microorganisms
pounds, significantly decreasing free chlorine in effluent water or particulate matter. To ensure filtration efficiency, PP cotton
(Hoslett et al. 2018). In addition, both UF and RO membrane filter should be changed every 2–6 months according to the
filters can reduce turbidity, but RO membranes exhibit better manufacturer’s instructions. Moreover, activated carbon filters
removal of organic compounds such as NO3-N and TOC than provided a good place for bacteria to attach and proliferate in4542 Appl Microbiol Biotechnol (2020) 104:4533–4545 the absence of free chlorine (Gibert et al. 2013), but the ad- specific, it detects DNA from living, non-cultivable, and dead sorption performance of activated carbon was affected by sur- bacteria, leading to false positive results (Liu et al. 2018; face area and microporous structure (McQuillan et al. 2018). Zacharias et al. 2015). Accordingly, PMA-qPCR can be used In household purifiers, granular activated carbon provides to differentiate between intact and compromised cells limited adsorbing sites, easily leaking carbon for the next step. (Slimani et al. 2012; Telli and Doğruer 2019) and is more In fact, carbon powder was observed on the surfaces of mem- suitable for assessing real health risks of household water brane filters (Fig. S3). Similarly, the microorganisms leaked purifier condition. In this study, PMA-qPCR revealed 106– from activated carbon filters can be intercepted by follow-up 108 copies/L of total viable bacteria in effluent water, and membrane filtration (Hong et al. 2018). the difference between the total bacterial cells and cultivable Fouling is an inevitable and long-standing problem in cells was 2–5 order of magnitude, indicating that a large part membrane technology for drinking water treatment. Previous of bacteria entered the VBNC state in this condition. It was studies (Gaveau et al. 2017; Helling et al. 2017; Wang et al. reported that bacteria in the VBNC state still maintain meta- 2008) showed that bacteria commonly leaked through mem- bolic activity and have the potential to resuscitate and regrow, brane filters. In particular, the concentration of microorgan- regain virulence when the environmental conditions are favor- isms in effluent water from RO filters was relatively high. RO able (Kibbee and Örmeci 2017; Pinto et al. 2011). In particu- membranes are capable to removing organic compounds and l a r, m a n y k i n d s o f p a t h o g e n i n c l u d i n g Vi b r i o microbes because of their small pore size. However, RO filters parahaemolyticus (Liu et al. 2018), E. coli (Kibbee and produce large volumes of concentrated water with low water Örmeci 2017), and L. pneumophila (Slimani et al. 2012) were productivity. Some consumers only use effluents for drinking found to be able to enter VBNC state. It would be a significant aims. In this case, microorganisms easily regrow and prolifer- concern for public health once the VBNC cells undergo a ate in moist environments such as filters and water-storing rapid resuscitation to the fully culturable state (Oliver et al. container because of low usage rate and long-time stagnation 1995). (Su et al. 2009). This factor is often ignored, despite the mi- In general, the Shannon and Simpson indices are often used crobial health risks to human that these conditions pose. In to indicate microbial community diversity, and the Ace and contrast, a simple process with one-stage filtration followed Chao1 indices are used to represent species richness (Zhang by one-stage post-activated carbon filtration in purifier B is et al. 2018). Greater community diversity and richness were likely more appropriate from the perspective view of micro- observed in effluent water and on membranes. Therefore, it is bial health risk. Activated carbon and membranes are compact reasonable to suggest that multi-stage pre-activated carbon and can be used to obtain safe effluents. Therefore, it can be treatment increases the microbial diversity of effluent water. inferred that both pre- and post-activated carbon filters, as well In addition, Proteobacteria was predominant in all sample as membrane filters, provide appropriate surfaces for microbi- except for those in effluent water from purifier B (B-E), which al growth and then allow microbes to be released or leak to was the most common group found in drinking water treat- effluent water. This was in line with previous studies (Wang ment and distribution systems (Bautista-de los Santos et al. 2017; Wu et al. 2012; Wu and Li 1997; Zhou et al. 2012), 2016; Huang et al. 2014; Perrin et al. 2019). Moreover, which investigated hundreds of purifiers from different areas Cyanobacteria was abundant in influent water samples be- of China including Shanghai, Hangzhou, and Tianjin, and cause of the use of surface water as a source of drinking water found an excessive rate, i.e., the total number of bacteria in (Fuente et al. 2019). Melainabacteria, as the most abundant effluent above 100 CFU/mL and ranging from 13.2 to 87.5% phylum in sample B-E (65.79%), were classified as members (Table S2). That was to say, household water purifiers did not of the non-photosynthetic, anaerobic, and nitrogen fixers and lower but elevated microbial risks, presenting a considerable were believed to represent an ancient lineage of the problem for human health. Cyanobacteria (Celikkol-Aydin et al. 2016). Effluent water Our results show that the concentration of total bacteria and membrane samples presented a higher proportion of was a little higher than that of total viable bacteria and signif- Melainabacteria than influent water, indicating this group icantly higher than cultivable cells in effluent water and on could be enriched during purifier treatment. Knowledge about membrane samples. Microbes were continuously exposed to the presence of Melainabacteria in drinking water systems is the two most common environmental stressors in household limited, but these bacteria are known to be present in the water purifiers, i.e., free chlorine and oligotrophic conditions, human gut (Gerrity et al. 2018; Zamyadi et al. 2019). allowing bacteria to easily enter the VBNC state with low Finally, microbial communities in effluent water are more metabolic activity and no division (Gensberger et al. 2014). similar to those on membranes than those in influent water VBNC cells are often undetected using commonly used based on a cluster tree, suggesting purifier treatment proce- culture-based methods and standards, leading to an underesti- dures may shift communities to those in effluent water. mate of the real microbial population size (Gillespie 2016). In terms of potential pathogens, the presence of E. coli, P. Although traditional quantitative PCR is sensitive and aeruginosa, and Mycobacterium were detected by using high-
Appl Microbiol Biotechnol (2020) 104:4533–4545                                                                                                    4543

throughput sequencing and TaqMan qPCR. E. coli is the most                 Bautista-de los Santos QM, Schroeder JL, Blakemore O, Moses J, Haffey
                                                                                M, Sloan W, Pinto AJ (2016) The impact of sampling, PCR, and
commonly used fecal bacteria, indicating fecal contamination
                                                                                sequencing replication on discerning changes in drinking water bac-
of drinking water (Coleman et al. 2013; Ikonen et al. 2017). In                 terial community over diurnal time-scales. Water Res 90:216–224.
addition, P. aeruginosa, as a major pathogen in nosocomial                      https://doi.org/10.1016/j.watres.2015.12.010
infections, was frequently detected in drinking water environ-             Bressler D, Balzer M, Dannehl A, Flemming HC, Wingender J (2009)
                                                                                Persistence of Pseudomonas aeruginosa in drinking-water biofilms
ments (Bressler et al. 2009; De and Galván 2001; Moritz et al.
                                                                                on elastomeric material. Water Sci Technol Water Supply 9:81–87.
2010). Moreover, M. mucogenicum may cause severe disease                        https://doi.org/10.2166/ws.2009.026
and even death in immunocompromised individuals, and its                   Celikkol-Aydin S, Gaylarde CC, Lee T, Melchers RE, Witt DL, Beech IB
presence has been demonstrated in water environments such                       (2016) 16S rRNA gene profiling of planktonic and biofilm microbial
                                                                                populations in the Gulf of Guinea using Illumina NGS. Mar Environ
as potable water used in hospital (Fernandez-Rendon et al.
                                                                                Res 122:105–112. https://doi.org/10.1016/j.marenvres.2016.10.001
2012; Loret and Dumoutier 2019). It was interesting to find                Chen L, Zhu X, Zhang M, Wang Y, Lv T, Zhang S, Yu X (2017) Profiling
that more E. coli and P. aeruginosa was attached to the sur-                    total viable bacteria in a hemodialysis water treatment system. J
faces of membranes than that found in influent and effluent                     Microbiol Biotechnol 27(5):995–1004. https://doi.org/10.4014/
                                                                                jmb.1612.12002
water, suggesting these bacteria may have been captured and
                                                                           Coleman BL, Louie M, Salvadori MI, McEwen SA, Neumann N, Sibley K,
enriched on membrane surfaces.                                                  Irwin RJ, Jamieson FB, Daignault D, Majury A, Braithwaite S, Crago
    The results of the present study suggest that using household               B, McGeer AJ (2013) Contamination of Canadian private drinking
water purifiers does not lower but elevates microbial risk. Some                water sources with antimicrobial resistant Escherichia coli. Water Res
efforts can be made by both manufacturers and consumers to                      47:3026–3036. https://doi.org/10.1016/j.watres.2013.03.008
                                                                           Cui Q, Fang T, Huang Y, Dong P, Wang H (2017) Evaluation of bacterial
improve the performance of household water purifiers, such as                   pathogen diversity,abundance and health risks in urban recreational
replacing filters regularly before over-saturation or installing a              water by amplicon next-generation sequencing and quantitative
back-washing program to prolong the life span of a filter (Shao                 PCR. J Environ Sci 57:137–149. https://doi.org/10.1016/j.jes.
et al. 2018). Moreover, advanced technologies such as UV-LED                    2016.11.008
                                                                           De VJ, Galván M (2001) Pseudomonas aeruginosa as an indicator of
treatment can be introduced as a final step to minimize microbial               health risk in water for human consumption. Water Sci Technol
contamination in purifiers (Lui et al. 2016).                                   43:49–52. https://doi.org/10.2166/wst.2001.0710
                                                                           Deininger RA, Lee J (2005) Rapid detection of bacteria in drinking water,
Acknowledgments The authors gratefully appreciate the help of Ms. Ren           Ukraine, Modern tools and methods of water treatment for improv-
H from Instrument Center, Institute of Urban Environment, Chinese               ing living standards, pp 71–78
Academy of Sciences, for assistance with scanning electron microscopy;     Douterelo I, Fish KE, Boxall JB (2018) Succession of bacterial and fungal
and Mr. Wan K in the author’s laboratory for revising this manuscript.          communities within biofilms of a chlorinated drinking water distri-
                                                                                bution system. Water Res 141:74–85. https://doi.org/10.1016/j.
Funding information This publication was financially supported by               watres.2018.04.058
the National Key Research and Development Program of China-                El Gamal M, Mousa HA, El-Naas MH, Zacharia R, Judd S (2018) Bio-
International collaborative project from Ministry of Science and                regeneration of activated carbon: a comprehensive review. Sep Purif
Technology (Grant No. 2017YFE0107300), and the National Natural                 Technol 197:345–359. https://doi.org/10.1016/j.seppur.2018.01.015
Science Foundation of China (51708534, 51678551, and 51478450).            Fernandez-Rendon E, Cerna-Cortes JF, Ramirez-Medina MA, Helguera-
                                                                                Repetto AC, Rivera-Gutierrez S, Estrada-Garcia T, Gonzalez-y-
                                                                                Merchand JA (2012) Mycobacterium mucogenicum and other non-
Compliance with ethical standards                                               tuberculous mycobacteria in potable water of a trauma hospital: a
                                                                                potential source for human infection. J Hosp Infect 80:74–76.
Conflict of interest The authors declare that there are no conflicts of         https://doi.org/10.1016/j.jhin.2011.10.003
interest.                                                                  Fuente A, Muro-Pastor AM, Merchán F, Madrid F, Pérez-Martínez JI,
                                                                                Undabeytia T (2019) Electrocoagulation/flocculation of
Ethical statement This article does not contain any studies with human          cyanobacteria from surface waters. J Clean Prod 238:117964.
participants or animals performed by any of the authors.                        https://doi.org/10.1016/j.jclepro.2019.117964
                                                                           Gaveau A, Coetsier C, Roques C, Bacchin P, Dague E, Causserand C
                                                                                (2017) Bacteria transfer by deformation through microfiltration
                                                                                membrane. J Membr Sci 523:446–455. https://doi.org/10.1016/j.
                                                                                memsci.2016.10.023
References                                                                 Gensberger ET, Polt M, Konrad-Köszler M, Kinner P, Sessitsch A, Kostić
                                                                                T (2014) Evaluation of quantitative PCR combined with PMA treat-
                                                                                ment for molecular assessment of microbial water quality. Water Res
Albergamo V, Blankert B, Cornelissen ER, Hofs B, Knibbe WJ, van der             67:367–376. https://doi.org/10.1016/j.watres.2014.09.022
    Meer W, de Voogt P (2019) Removal of polar organic                     Gerrity D, Arnold M, Dickenson E, Moser D, Sackett JD, Wert EC (2018)
    micropollutants by pilot-scale reverse osmosis drinking water treat-        Microbial community characterization of ozone-biofiltration sys-
    ment. Water Res 148:535–545. https://doi.org/10.1016/j.watres.              tems in drinking water and potable reuse applications. Water Res
    2018.09.029                                                                 135:207–219. https://doi.org/10.1016/j.watres.2018.02.023
Bae S, Lyons C, Onstad N (2019) A culture-dependent and metagenomic        Gibert O, Lefèvre B, Fernández M, Bernat X, Paraira M, Calderer M,
    approach of household drinking water from the source to point of            Martínez-Lladó X (2013) Characterising biofilm development on gran-
    use in a developing country. Water Res X:100026. https://doi.org/           ular activated carbon used for drinking water production. Water Res 47:
    10.1016/j.wroa.2019.100026                                                  1101–1110. https://doi.org/10.1016/j.watres.2012.11.026
4544 Appl Microbiol Biotechnol (2020) 104:4533–4545
Gillespie S (2016) Chapter 3 - current status of molecular microbiological Lin W, Yu Z, Zhang H, Thompson IP (2014) Diversity and dynamics of
techniques for the analysis of drinking water. In: Nigel C, Martin D, microbial communities at each step of treatment plant for potable
Thompson K (eds) . Academic Press, San Diego, pp 39–58 water generation. Water Res 52:218–230. https://doi.org/10.1016/j.
Gillespie S, Lipphaus P, Green J, Parsons S, Weir P, Juskowiak K, watres.2013.10.071
Jefferson B, Jarvis P, Nocker A (2014) Assessing microbiological Liu Y, Zhong Q, Wang J, Lei S (2018) Enumeration of Vibrio
water quality in drinking water distribution systems with disinfec- parahaemolyticus in VBNC state by PMA-combined real-time quanti-
tant residual using flow cytometry. Water Res 65:224–234. https:// tative PCR coupled with confirmation of respiratory activity. Food
doi.org/10.1016/j.watres.2014.07.029 Control 91:85–91. https://doi.org/10.1016/j.foodcont.2018.03.037
Hammes F, Berney M, Wang Y, Vital M, Köster O, Egli T (2008) Flow- Liu L, Xing X, Hu C, Wang H, Lyu L (2019) Effect of sequential UV/free
cytometric total bacterial cell counts as a descriptive microbiological chlorine disinfection on opportunistic pathogens and microbial com-
parameter for drinking water treatment processes. Water Res 42: munity structure in simulated drinking water distribution systems.
269–277. https://doi.org/10.1016/j.watres.2007.07.009 Chemosphere 219:971–980. https://doi.org/10.1016/j.chemosphere.
Helling A, Kubicka A, Schaap I, Polakovic M, Hansmann B, Thiess H, 2018.12.067
Strube J, Thom V (2017) Passage of soft pathogens through Loret JF, Dumoutier N (2019) Non-tuberculous mycobacteria in drinking
microfiltration membranes scales with transmembrane pressure. J water systems: a review of prevalence data and control means. Int J
Membr Sci 522:292–302. https://doi.org/10.1016/j.memsci.2016. Hyg Environ Health 222:628–634. https://doi.org/10.1016/j.ijheh.
08.016 2019.01.002
Hong S, Tang X, Wu N, Chen H (2018) Leakage of soluble microbial Lui GY, Roser D, Corkish R, Ashbolt NJ, Stuetz R (2016) Point-of-use
products from biological activated carbon filtration in drinking water water disinfection using ultraviolet and visible light-emitting diodes.
treatment plants and its influence on health risks. Chemosphere 202: Sci Total Environ 553:626–635. https://doi.org/10.1016/j.scitotenv.
626–636. https://doi.org/10.1016/j.chemosphere.2018.03.123 2016.02.039
Hoslett J, Massara TM, Malamis S, Ahmad D, van den Boogaert I, McQuillan RV, Stevens GW, Mumford KA (2018) The electrochemical
Katsou E, Ahmad B, Ghazal H, Simons S, Wrobel L, Jouhara H regeneration of granular activated carbons: a review. J Hazard Mater
(2018) Surface water filtration using granular media and mem- 355:34–49. https://doi.org/10.1016/j.jhazmat.2018.04.079
branes: a review. Sci Total Environ 639:1268–1282. https://doi. Mombini S, Rezatofighi SE, Kiyani L, Motamedi H (2019) Diversity and
org/10.1016/j.scitotenv.2018.05.247 metallo-β-lactamase-producing genes in Pseudomonas aeruginosa
Hu Y, Jiang L, Zhang T, Jin L, Han Q, Zhang D, Lin K, Cui C (2018) strains isolated from filters of household water treatment systems. J
Occurrence and removal of sulfonamide antibiotics and antibiotic Environ Manag 231:413–418. https://doi.org/10.1016/j.jenvman.
resistance genes in conventional and advanced drinking water treat- 2018.10.068
ment processes. J Hazard Mater 360:364–372. https://doi.org/10.
Moritz MM, Flemming HC, Wingender J (2010) Integration of
1016/j.jhazmat.2018.08.012
Pseudomonas aeruginosa and Legionella pneumophila in drinking wa-
Hu D, Lin W, Zeng J, Wu P, Zhang M, Guo L, Ye C, Wan K, Yu X (2019)
ter biofilms grown on domestic plumbing materials. Int J Hyg Environ
Profiling the microbial contamination in aviation fuel from an air-
Health 213:190–197. https://doi.org/10.1016/j.ijheh.2010.05.003
port. Biofouling 35(8):856–869. https://doi.org/10.1080/08927014.
Oliver JD, Hite F, McDougald D, Andon NL, Simpson LM (1995) Entry
2019.1671977
into, and resuscitation from, the viable but nonculturable state by Vibrio
Huang K, Zhang XX, Shi P, Wu B, Ren H (2014) A comprehen-
vulnificus in an estuarine environment. Appl Environ Microbiol 61(7):
sive insight into bacterial virulence in drinking water using
2624–2630. https://doi.org/10.1177/002215540205000815
454 pyrosequencing and Illumina high-throughput sequenc-
ing. Ecotoxicol Environ Saf 109:15–21. https://doi.org/10. Perrin Y, Bouchon D, Delafont V, Moulin L, Héchard Y (2019)
1016/j.ecoenv.2014.07.029 Microbiome of drinking water: a full-scale spatio-temporal study
Ikonen J, Pitkänen T, Kosse P, Ciszek R, Kolehmainen M, Miettinen IT to monitor water quality in the Paris distribution system. Water
(2017) On-line detection of Escherichia coli intrusion in a pilot- Res 149:375–385. https://doi.org/10.1016/j.watres.2018.11.013
scale drinking water distribution system. J Environ Manag 198: Pinto D, Almeida V, Santos MA, Chambel L (2011) Resuscitation of
384–392. https://doi.org/10.1016/j.jenvman.2017.04.090 Escherichia coli VBNC cells depends on a variety of environmental
Kibbee RJ, Örmeci B (2017) Development of a sensitive and false- or chemical stimuli. J Appl Microbiol 110(6):1601–1611. https://
positive free PMA-qPCR viability assay to quantify VBNC doi.org/10.1111/j.1365-2672.2011.05016.x
Escherichia coli and evaluate disinfection performance in wastewa- Schurer R, Schippers JC, Kennedy MD, Cornelissen ER, Salinas-Rodriguez
ter effluent. J Microbiol Methods 132:139–147. https://doi.org/10. SG, Hijnen W, van der Wal (2019) Enhancing biological stability of
1016/j.mimet.2016.12.004 disinfectant-free drinking water by reducing high molecular weight or-
Klappenbach JA, Dunbar JM, Schmidt TM (2000) rRNA operon copy ganic compounds with ultrafiltration posttreatment. Water Res 164:
number reflects ecological strategies of bacteria. Appl Environ 114927. https://doi.org/10.1016/j.watres.2019.114927
Microbiol 66(4):1328–1333. https://doi.org/10.1128/AEM.66.4. Shao S, Wang Y, Shi D, Zhang X, Tang CY, Liu Z, Li J (2018) Biofouling
1328-1333.2000 in ultrafiltration process for drinking water treatment and its control
Korotta-Gamage SM, Sathasivan A (2017) A review: potential and chal- by chlorinated-water and pure water backwashing. Sci Total Environ
lenges of biologically activated carbon to remove natural organic 644:306–314. https://doi.org/10.1016/j.scitotenv.2018.06.220
matter in drinking water purification process. Chemosphere 167: Shi P, Jia S, Zhang XX, Zhang T, Cheng S, Li A (2013) Metagenomic
120–138. https://doi.org/10.1016/j.chemosphere.2016.09.097 insights into chlorination effects on microbial antibiotic resistance in
Lee DY, Shannon K, Beaudette LA (2006) Detection of bacterial patho- drinking water. Water Res 47:111–120. https://doi.org/10.1016/j.
gens in municipal wastewater using an oligo nucleotide microarray watres.2012.09.046
and TaqMan real-time PCR. J Microbiol Methods 65(3):453–467. Shi P, Zhou S, Xiao H, Qiu J, Li A, Zhou Q, Pan Y, Hollert H (2018)
https://doi.org/10.1016/j.mimet.2005.09.008 Toxicological and chemical insights into representative source and
Li W, Zhang J, Wang F, Qian L, Zhou Y, Qi W, Chen J (2018) Effect of drinking water in eastern China. Environ Pollut 233:35–44. https://
disinfectant residual on the interaction between bacterial growth and doi.org/10.1016/j.envpol.2017.10.033
assimilable organic carbon in a drinking water distribution system. Shirasaki N, Matsushita T, Matsui Y, Murai K (2017) Assessment of the
Chemosphere 202:586–597. https://doi.org/10.1016/j.chemosphere. efficacy of membrane filtration processes to remove human enteric
2018.03.056 viruses and the suitability of bacteriophages and a plant virus asAppl Microbiol Biotechnol (2020) 104:4533–4545 4545
surrogates for those viruses. Water Res 115:29–39. https://doi.org/ Wang JH, Lu J, Zhang YX, Wu J, Zhang C, Yu X, Zhang Z, Liu H, Wang
10.1016/j.watres.2017.02.054 WH (2018) High-throughput sequencing analysis of the microbial
Slimani S, Robyns A, Jarraud S, Molmeret M, Dusserre E, Mazure C, community in coastal intensive mariculture systems. Aquac Eng 83:
Facon JP, Lina G, Etienne J, Ginevra C (2012) Evaluation of 93–102. https://doi.org/10.1016/j.aquaeng.2018.10.001
propidium monoazide (PMA) treatment directly on membrane filter Warsinger DM, Chakraborty S, Tow EW, Plumlee MH, Bellona C,
for the enumeration of viable but non cultivable Legionella by Loutatidou S, Karimi L, Mikelonis AM, Achilli A, Ghassemi A,
qPCR. J Microbiol Methods 88:319–321. https://doi.org/10.1016/j. Padhye LP, Snyder SA, Curcio S, Vecitis CD, Arafat HA,
mimet.2011.12.010 Lienhard JH (2018) A review of polymeric membranes and process-
Song J, Chen L, Chen H, Sheng F, Xing D, Li L, Zhang Y, Rittmann B es for potable water reuse. Prog Polym Sci 81:209–237. https://doi.
(2018) Characterization and high-throughput sequencing of a org/10.1016/j.progpolymsci.2018.01.004
trichlorophenol-dechlorinating microbial community acclimated Wei G, Liang H, Ma J, Mei H, Chen ZL, Han ZS, Li GB (2011)
from sewage sludge. J Clean Prod 197:306–313. https://doi.org/10. Membrane fouling control in ultrafiltration technology for drinking
1016/j.jclepro.2018.06.061 water production: a review. Desalination 272:1–8. https://doi.org/10.
Stoddard SF, Smith BJ, Hein R, Roller BRK, Schmidt TM (2014) rrnDB: 1016/j.desal.2011.01.051
improved tools for interpreting rRNA gene abundance in bacteria WHO (2006) Guidelines for drinking water quality, First Addendum to
and archaea and a new foundation for future development. Nucleic Third Edition. World Health Organization Recommendations 1
Acids Res 43:D593–D598. https://doi.org/10.1093/nar/gku1201 Wolz C, Lehmann R, Vasil ML (1994) A new extracellular protein of
Storey DG, Raivio TL, Frank DW (1991) Effect of regB on expression Pseudomonas aeruginosa PA103 regulated by regA. Microbiology
from the P1 and P2 promoters of the Pseudomonas aeruginosa 140(Pt 7):1755–1761. https://doi.org/10.1099/13500872-140-7-1755
regAB operon. J Bacteriol 173(19): 6088–94. https://doi.10.1128/ Wu X, Li C (1997) Investigation on microbial contamination of drinking
jb.173.19.6088–6094.1991 water caused by inferior water purifier. J Environ Health 21
Su F, Luo M, Zhang F, Li P, Lou K, Xing X (2009) Performance of Wu L, Cui W, Zhang Y, Ge G, Chen Z, Wang G, Li Z (2012) Survey on
microbiological control by a point-of-use filter system for drinking hygienic situation of outlet water from household water filters in
water purification. J Environ Sci 21:1237–1246. https://doi.org/10. Shanghai. J Environ Occup Med 129:475–480
1016/S1001-0742(08)62410-9 Zacharias N, Kistemann T, Schreiber C (2015) Application of flow cy-
Telli AE, Doğruer Y (2019) Discrimination of viable and dead Vibrio tometry and PMA-qPCR to distinguish between membrane intact
parahaemolyticus subjected to low temperatures using Propidium and membrane compromised bacteria cells in an aquatic milieu. Int J
Monoazide – quantitative loop mediated isothermal amplification Hyg Environ Health 218:714–722. https://doi.org/10.1016/j.ijheh.
(PMA-qLAMP) and PMA-qPCR. Microb Pathog 132:109–116. 2015.04.001
https://doi.org/10.1016/j.micpath.2019.04.029 Zamyadi A, Romanis C, Mills T, Neilan B, Choo F, Coral LA, Gale D,
Vaz-Moreira I, Nunes OC, Manaia CM (2017) Ubiquitous and persistent Newcombe G, Crosbie N, Stuetz R, Henderson RK (2019)
Proteobacteria and other gram-negative bacteria in drinking water. Diagnosing water treatment critical control points for cyanobacterial
Sci Total Environ 586:1141–1149. https://doi.org/10.1016/j. removal: exploring benefits of combined microscopy, next-
scitotenv.2017.02.104 generation sequencing, and cell integrity methods. Water Res 152:
Wang D (2017) Study on the effects of bacterial contamination of house- 96–105. https://doi.org/10.1016/j.watres.2019.01.002
hold water purification equipment and water contact material on Zhang Y, Ping Y, Zhou R, Wang J, Zhang G (2018) High throughput
microbial growth. Master, Chinese Center for Disease Control and sequencing-based analysis of microbial diversity in dental unit wa-
Prevention terlines supports the importance of providing safe water for clinical
Wang Y, Hammes F, Düggelin M, Egli T (2008) Influence of size, shape, use. J Infect Public Health 11:357–363. https://doi.org/10.1016/j.
and flexibility on bacterial passage through micropore membrane jiph.2017.09.017
filters. Environ Sci Technol 42:6749–6754. https://doi.org/10. Zhou Z, Hu B, Bao R, Gao X, Shen Y, Cui Y, Wei S, Zhou Q (2012)
1021/es800720n Impact factor for microbiological contamination of water purifier.
Wang R, Guan S, Sato A, Wang X, Wang Z, Yang R, Hsiao BS, Chu B Chin J Nosocomiol 22:2580–2582
(2013) Nanofibrous microfiltration membranes capable of removing
bacteria, viruses and heavy metal ions. J Membr Sci 446:376–382. Publisher’s note Springer Nature remains neutral with regard to jurisdic-
https://doi.org/10.1016/j.memsci.2013.06.020 tional claims in published maps and institutional affiliations.You can also read