Safeswim Impact Evaluation - Have improvements to Safeswim changed Aucklanders' awareness and behaviour? - Knowledge Auckland
←
→
Page content transcription
If your browser does not render page correctly, please read the page content below
Safeswim Impact Evaluation
Have improvements to Safeswim changed
Aucklanders’ awareness and behaviour?
Jesse Allpress, Alexandra Clark, Esther Rootham, Ting Huang

March 2018                       Technical Report 2018/004

Safeswim impact evaluation
Have improvements to Safeswim changed
Aucklanders’ awareness and behaviour?
March 2018                       Technical Report 2018/004

Dr Jesse Allpress
Alexandra Clark
Dr Esther Rootham
Ting Huang

Research and Evaluation Unit

Auckland Council
Technical Report 2018/004

ISSN 2230-4525 (Print)
ISSN 2230-4533 (Online)

ISBN 978-1-98-855580-5 (Print)
ISBN 978-1-98-855581-2 (PDF)
This report has been peer reviewed by the Peer Review Panel.
 Review completed on 27 March 2018
 Reviewed by two reviewers

 Approved for Auckland Council publication by:

 Name: Eva McLaren
 Position: Acting Manager, Research and Evaluation (RIMU)
 Date: 27 March 2018

Recommended citation
Allpress, J. A., Clark, A., Rootham, E. M., Huang, T. (2018). Safeswim impact evaluation:
Have improvements to Safeswim changed Aucklanders’ awareness and behaviour?
Auckland Council technical report, TR2018/004

Acknowledgments
This research was supported by Surf Life Saving Northern Region, who provided
significant administrative support for recruitment of on-beach research assistants.

© 2018 Auckland Council
This publication is provided strictly subject to Auckland Council’s copyright and other intellectual property
rights (if any) in the publication. Users of the publication may only access, reproduce and use the publication,
in a secure digital medium or hard copy, for responsible genuine non-commercial purposes relating to
personal, public service or educational purposes, provided that the publication is only ever accurately
reproduced and proper attribution of its source, publication date and authorship is attached to any use or
reproduction. This publication must not be used in any way for any commercial purpose without the prior
written consent of Auckland Council.

Auckland Council does not give any warranty whatsoever, including without limitation, as to the availability,
accuracy, completeness, currency or reliability of the information or data (including third party data) made
available via the publication and expressly disclaim (to the maximum extent permitted in law) all liability for
any damage or loss resulting from your use of, or reliance on the publication or the information and data
provided via the publication. The publication, information, and data contained within it are provided on an "as
is" basis.
Main messages
In November 2017 a new and improved Safeswim water quality reporting programme was
launched in Auckland.

An evaluation of the new Safeswim programme reveals changes to the programme had a number
of positive impacts on beach users’ awareness and behaviour:
    • Awareness of Safeswim and regular usage of the website has increased notably.
    • Awareness that it is sometimes unsafe to swim due to pollution is high and has increased
       since November 2017.
    • A culture of telling friends, family and other beach users about Safeswim is developing and
       provides fertile ground for future behaviour change efforts.
    • Media coverage of water quality issues has increased dramatically since the new Safeswim
       programme was launched, most of which mentions Safeswim.
    • Interest amongst beach users in learning more about Safeswim and water quality is high.

However, much work is to be done to broaden this awareness and further motivate behaviour
change:
   • Around half of all beach users still have not heard about Safeswim.
   • Many of those who have heard of Safeswim are not in the habit of using it regularly.
   • On-beach signage is inconsistent and requires review.
   • There remains widespread misunderstanding of what is causing poor water quality and the
      likelihood of getting sick after swimming in polluted water.
   • The general awareness of water quality issues at Auckland’s beaches is often not
      translating into accurate perceptions about the beaches people visit regularly. Many visitors
      rated the water at Safeswim long-term no-swim sites as being of better quality than
      Auckland overall.

The evaluation reveals a number of opportunities to improve Safeswim and further change
behaviour:
   • An evidence-based behaviour change campaign is proposed to increase awareness and to
      motivate further behaviour change.
   • Improvements to website functionality are suggested to make Safeswim easier and more
      attractive to use.

Safeswim impact evaluation 2018                                                                       i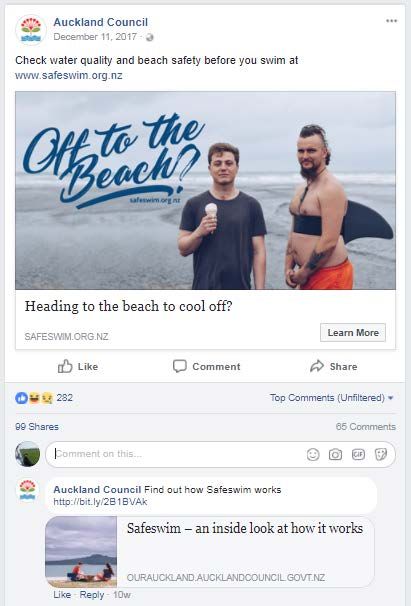
Executive summary
In November 2017, Safeswim – Auckland’s water quality reporting system – was changed from a
weekly monitoring system to a predictive modelling approach that provides real-time water quality
forecasts for beaches and freshwater sites around Auckland.

This report presents an evaluation of the impact of the new Safeswim programme on beach users’
awareness, attitudes and behaviour. The evaluation data sources include pre rollout and post
rollout online surveys to track changes in attitudes and awareness over time, a survey of visitors on
beaches (post-rollout only), and a media analysis.

Importance and awareness of water quality issues
Almost all Auckland beach users (94 per cent) rated the quality of the water at Auckland’s beaches
and lagoons as important, a trend that has been stable over time.

Awareness that it is sometimes unsafe to swim at Auckland beaches and lagoons due to polluted
water increased +11 percentage points post rollout, to 87 per cent aware.

Only around half of all respondents (54 per cent) were able to accurately identify the primary
pollutant (human and animal faeces), although this has increased +7 percentage points since the
rollout of Safeswim upgrades.

Ten per cent of 2018 survey respondents reported that they or their children have at some point
swum despite a sign or someone telling them the water quality was poor. Of those who had swum,
21 per cent reported that they or their children had become sick afterwards.

Attitudes toward checking water quality
Most people surveyed post rollout agreed that swimming in poor quality water causes illness (85
per cent), that it is important to check water quality before swimming (73 per cent) and that
checking before swimming will prevent illness (73 per cent). One-third (33 per cent) of people
surveyed agreed that other people close to them regularly check water quality before swimming,
reflecting an important perception that checking water quality is normal and expected. The strength
of all perceptions above has increased since the rollout of the new Safeswim.

Trust and mistrust of water quality reporting
Most post rollout survey respondents who were aware that water quality is reported for Auckland
beaches reported trusting those ratings (75 per cent), similar to pre rollout.

Feelings of mistrust stemmed primarily from misunderstandings about how and how often water
quality ratings are produced. The majority of those who mistrusted the ratings believed they were
based on physical samples and that they were likely out of date. Others doubted the ratings’
accuracy, didn’t trust the messenger, or had previously swum under a ‘high risk’ warning and didn’t
get sick so assumed there is little value in paying attention to future warnings.

Use of Safeswim
The percentage of Aucklanders who had heard of Safeswim and who had ever visited the website
increased markedly since November 2017, up +15 and +10 percentage points, respectively.

Safeswim impact evaluation 2018                                                                     ii
Awareness and usage of Safeswim
 The proportion of online panel members who have visited the
 Safeswim website tripled

                                          47% - Heard of Safeswim before

  32%

                                          15% - Ever visited Safeswim

   5%

   Pre rollout                    Post rollout

Nine per cent of all beach visitors who were surveyed on Auckland beaches had checked
Safeswim prior to arriving at the beach. A further 37 per cent didn’t check Safeswim before visiting
the beach, but reported knowing about Safeswim. Fifty-four per cent of beach visitors didn’t check
Safeswim and didn’t know what it was.

There is a strong need to further motivate those who know about Safeswim to use the programme,
and educate and engage those who do not know about the programme.

Word of mouth, Facebook and television were particularly important ways that people heard about
Safeswim, indicating the importance of social channels of communication.

Beach visitors were clear on whether they would swim under ‘low risk’ and ‘high risk’ water quality
ratings. They were much less sure about whether they should swim under ‘fair’ conditions,
however, and would benefit from greater guidance on the appropriate behaviour under these
conditions.

A range of reasons for were offered for not proactively checking Safeswim:
    • Lack of knowledge that there was an issue at their beach or how they would check.
    •    Preferring to rely on visual cues at the beach or lagoon to determine whether it is safe to
         swim or not, including ‘trusting their eyes’, taking cues from whether other visitors were
         swimming, or expecting to see on-beach signs.
    •    Forgetting or laziness was commonly reported, indicating stimulating motivation via public
         communications and encouraging habit formation is important.
    •    Low access to technology or internet access.

Safeswim impact evaluation 2018                                                                    iii
•     A minority of people reported weighing up the risks and deciding that the enjoyment of a
          swim on a hot day outweighed the risks.

Future Safeswim improvements should focus on addressing these barriers to usage.

Safeswim in the media
The number of water-quality related media articles has increased markedly since the rollout of the
new Safeswim programme. In the 12 months to November 2017 there were 32 articles on
Auckland’s water quality; in the four months following November 2017 there were 74 articles on
water quality.

Number of water quality articles per week
  12

  10
                                                                             New Safeswim website goes live
   8

   6

   4

   2

   0
  16/10/2016   5/12/2016   24/01/2017 15/03/2017   4/05/2017   23/06/2017 12/08/2017   1/10/2017   20/11/2017   9/01/2018   28/02/2018

                                                               Week ending

Coverage of Safeswim has also increased, with 76 per cent of post rollout articles mentioning
Safeswim, compared to 28 per cent of articles pre rollout. Coverage of specific ‘high risk’ alerts and
events disrupted by poor water quality also increased markedly post rollout.

Public engagement with Safeswim
On-beach researchers took some time after the survey to tell beach users about Safeswim. The
majority of beach users were engaged and interested in talking about Safeswim and water quality
issues and this proved to be a good opportunity to engage and inform the public.

On-beach researchers heard reports of some beach visitors warning other beach users about
Safeswim water quality alerts. This should be encouraged in future engagement activities.

Beach signs
A range of new on-beach signs were trialled as part of the new Safeswim programme, including
electronic signs, movable pavement blades administered by Surf Life Saving, and static ‘Check
before you swim’ approach signs.

Across all beaches, only 13 per cent of beach users noticed a sign about water quality.

Safeswim impact evaluation 2018                                                                                                          iv
One in eight beach users noticed water quality signs during
their visit
87%
13%
Saw a sign about Did not see any signs
water quality
n = 618
This awareness of signs ranged from 26 per cent (Bethells Beach) to only 3 per cent (Eastern
Beach), and visitors were more likely to notice signs at beaches with natural entry and exit funnels.
The findings indicate that the current sign configuration is inadequate as a primary warning system
and should be reviewed.
Perceptions of water quality at long-term no-swim beaches
Forty-nine per cent Auckland beach users surveyed rated Auckland’s water quality as ‘good’ or
‘excellent’ overall, down from 56 per cent in 2017.
Worryingly, many respondents rated Safeswim long-term, no-swim warning sites as higher quality
than the Auckland average, indicating the message about site-specific water quality is not getting
through to everyone.
Improvements to Safeswim
A number of improvements to Safeswim are outlined, drawing on best-practice in behaviour
change approaches.
Improvements focus on:
• A proactive, ‘social’ behaviour change campaign to further boost awareness and motivate
use of Safeswim.
• Improvement to the Safeswim website functionality so the system is easier and more
attractive to use.
• Conducting a thorough review of the Safeswim signage approach, ensuring this review is in
alignment with the behaviour change campaign above.
Safeswim impact evaluation 2018 vTable of contents
1.0 Background and Context ............................................................................................. 1
1.1 Safeswim ........................................................................................................... 1
1.2 Evaluating changes to Safeswim ....................................................................... 2
2.0 Results ........................................................................................................................ 4
2.1 Water quality is important to Aucklanders .......................................................... 4
2.2 Awareness of water quality issues in Auckland.................................................. 5
2.3 Trust and mistrust of water quality ratings.......................................................... 9
2.4 Attitudes toward checking water quality ........................................................... 11
2.5 Are people using Safeswim?............................................................................ 13
2.6 Why are people not using Safeswim? .............................................................. 20
2.7 Safeswim in the media ..................................................................................... 21
2.8 Beach signs ..................................................................................................... 27
2.9 Influence of water quality on swimming behaviour ........................................... 33
2.10 Public interest in learning more and taking action ............................................ 34
3.0 Summary of Findings ................................................................................................ 35
4.0 Improvements to Safeswim ....................................................................................... 37
4.1 A framework for effective behaviour change .................................................... 37
4.2 Bringing it all together ...................................................................................... 42
Appendix A On-beach visitor survey sample ............................................................... 43
Appendix B Online panel survey samples ................................................................... 46
.
Safeswim impact evaluation 2018 vi1.0 Background and Context
A number of Auckland’s beaches and lagoons are sometimes contaminated with faecal
matter, putting swimmers and people engaged in water activities at risk of illness. 1
In many areas, contamination is infrequent and temporary; for others it is a frequent and
long-standing problem.
The sources and causes are varied, and include wastewater overflows during heavy rain,
dry-weather wastewater system faults, poorly maintained private septic systems, and effluent
from animals such as birds, dogs and stock.
1.1 Safeswim
Safeswim.org.nz is Auckland’s system for informing the public about beach and lagoon water
quality. The system is led by Auckland Council and Watercare, in partnership with Auckland
Regional Public Health Service, and Surf Lifesaving Northern Region.
Although the Safeswim programme has been around for a number of years, in 2017 it was
redeveloped from a weekly monitoring programme to a real-time predictive model. This new
model draws on many years of monitoring results, historical weather and other data in order
to be able to predict water quality risk.
Real-time weather, tide and wastewater system data is fed into the model in order to predict
current and future water quality at 84 beaches and 8 freshwater locations around Auckland
on the Safeswim website.
Safeswim provides forecasts up to two days into the future. The forecasts are updated
regularly as weather and other conditions change.
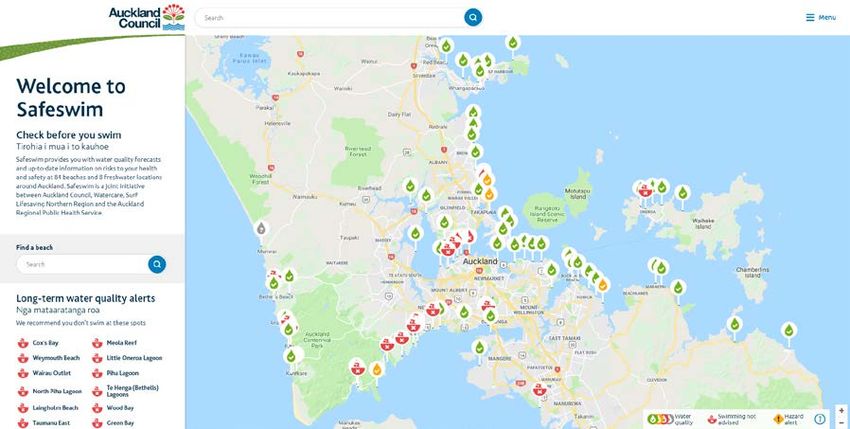
The new Safeswim system was rolled out in November 2017, for the 2017/2018 summer
season. The rollout of the new Safeswim system has included a new website (an example of
which is shown in Figure 1), new on-beach signage (described in Section 2.8), and public
communications.
1
http://www.mfe.govt.nz/publications/fresh-water/microbiological-water-quality-guidelines-marine-and-
freshwater-0
Safeswim impact evaluation 2018 1Figure 1. Screenshot of the new Safeswim website (March 2018), showing beach specific
risk ratings
1.2 Evaluating changes to Safeswim
Auckland Council’s Research and Evaluation Unit (RIMU) has conducted an independent
evaluation of the impacts of changes to the Safeswim programme.
The evaluation focuses on changes in Auckland beach users’ awareness, knowledge and
behaviour, and draws on behaviour change research to recommend improvements to the
programme.
Three sources are used:
• On-beach intercept surveys of 627 beach visitors, conducted in February 2018
• ‘Pre rollout’ and ‘post rollout’ surveys using an online panel of 1,000+ Auckland
beach users, conducted April 2017 and February 2018, respectively.
• An analysis of 106 media articles published between November 2016 and February
2018.
The on-beach survey of visitors was conducted at the following sites:
• Mission Bay (n = 235)
• Red Beach (n = 149)
• Takapuna Beach (n = 130)
• Eastern Beach (n = 67)
• Bethells Lagoon (n = 46)
Online surveys of Aucklanders were conducted using a professional market research panel;
one conducted pre Safeswim rollout (April 2017, n = 1,034) and one post rollout (February
2018, n = 1,024).
Survey quotas were applied to match as closely as possible the Auckland population in terms
of age, ethnicity and sub-region. To be included in the survey, respondents needed to live in
Auckland and have swum, supervised children who have swum, or gathered shellfish in
Safeswim impact evaluation 2018 2Auckland in the last 12 months. The surveys used the same questions and were conducted using separate samples. See Appendix A and Appendix B for further information on sample characteristics. Although all survey questions were designed to minimise social desirability response bias (i.e. providing a ‘correct’ response or response that reflects socially desirable characteristics), due to the nature of many of the survey questions it is possible that some respondents overstated their awareness and current behaviour. Safeswim impact evaluation 2018 3
2.0        Results

2.1        Water quality is important to Aucklanders

Both beach visitors and online panel respondents were asked about water quality and
pollution. The majority of Auckland beach visitors (84 per cent) stated that they were
concerned about pollution.

Most Auckland beach visitors are concerned about pollution at
Auckland beaches
                                                         Agree            Neutral               Disagree

                                  84%                                           12%                    4%

 60%                                                80%                                                     100%
 n = 594

Figure 2. Beach visitors’ concern about pollution at beaches and lagoons

As shown in Figure 3, the vast majority of Auckland online panel members rated both the
quality of the water at Auckland's beaches / lagoons, and having beaches / lagoons that are
free of litter, as very important to them (rating of ‘4’ or ‘5’ out of 5).

Importance of different beach and lagoon characteristics to Aucklanders
Quality of water and beach cleanliness rated as 'important' to most
                                            94% - Quality of the water at Auckland's beaches and lagoons
92%                                         93% - Having beaches / lagoons that are free of litter

                                            75% - How the beach / lagoon feels underfoot
73%
                                            71% - Having Surf Lifesavers patrolling the beach
67%

30%
                                            26% - Being able to gather shellfish from
                                                - Auckland's beaches / lagoons

 Pre rollout                        Post rollout

Figure 3. Importance of water quality to an online panel of Aucklanders

Safeswim impact evaluation 2018                                                                                    4
The feeling underfoot (e.g. sandy vs muddy bottom), and the presence of Surf Lifesavers,
were rated as important by 75 per cent and 71 per cent of respondents, respectively. The
ability to gather shellfish was unimportant to a significant percentage of beach users.
The importance of these different beach / lagoon characteristics has remained relatively
stable over the last 12 months.
2.2 Awareness of water quality issues in Auckland
When asked to rate the water quality of Auckland’s beaches overall, 49 per cent of post-
rollout online panel respondents rated the water quality as ‘good’ or ‘excellent (‘4’ or ‘5’ on a
5-point scale). This is down from 56 per cent in the summer prior to the recent Safeswim
rollout.
Overall ratings of water quality at Auckland beaches
Half of survey respondents rate the overall water quality at
Auckland's beaches as 'good' or 'excellent'
56%
49%
Pre rollout Post rollout
Figure 4. Online panel members’ overall perception of the quality of Auckland beaches
Those people who reported visiting sites with long-term no-swim warnings were asked to rate
the water quality at these sites. Many visitors perceived these sites to have high water
quality, indicating that the message about issues at these sites is not getting through to the
public.
Safeswim impact evaluation 2018 5Water quality is seen as 'good' or 'excellent' at a number of 'long-term no-swim' sites
Percentage of beach users rating the quality of water as good or excellent
Piha North Lagoon 73%
Armour Bay* 67%
Cox's Bay 59%
Wood Bay* 57%
Clarks Beach 56%
Piha South Lagoon 53%
Green Bay 50%
Auckland overall 49%
Meola Reef 44%
Laingholm Beach* 42%
Titirangi Beach 41%
Weymouth Beach 40%
Bethells Lagoon 31%
* < 10 people provided a rating for this location
Figure 5. Online panel members’ ratings of Safeswim long-term no-swim sites
Most visitors who were surveyed at beaches reported understanding the causes of pollution
at Auckland beaches and lagoons (73 per cent) and the risks of swimming when water
quality is poor (80 per cent).
Most beach visitors felt that they understood the causes and risks of
polluted water
Agree Neutral Disagree
I understand the cause of pollution at Auckland
73% 19% 8%
beaches and lagoons
I understand the risks of swimming when water
80% 11% 9%
quality is poor
0% 20% 40% 60% 80% 100%
ns = 557-582
Figure 6. Beach visitors’ understanding of the causes and risks of poor water quality
Online panel members were asked similar questions about their awareness and knowledge
of water quality issues in Auckland. The majority of respondents post-rollout (87 per cent)
reported being aware that it is sometimes unsafe to swim due to pollution, up from 76 per
cent prior to the rollout of the new Safeswim (see Figure 7).
Safeswim impact evaluation 2018 6Awareness that it is sometimes unsafe to swim due to pollution
Awareness increasing across Auckland
87%
76%
Pre rollout Post rollout
Figure 7. Online panel members’ awareness that it is sometimes unsafe to swim at Auckland
beaches and lagoons due to pollution
Respondents were asked to identify the primary pollution source making some beaches
unsafe to swim (see Figure 8). Post rollout, 54 per cent of respondents could identify human
and animal faeces as the primary pollutant, up from 47 per cent prior to the rollout.
Safeswim impact evaluation 2018 7Identification of the primary pollution source making some beaches
unswimmable
Faeces increasingly being recognised as the primary problem
54% - Human and animal poo / faeces
47%
25%
22% - Litter and dumping of rubbish
11% 9% - Not sure
8% 7% - Paint and chemicals tipped down drains
5% 5% - Other
5%
2% - Heavy metals from roof coatings and cars
Pre rollout Post rollout
Figure 8. Understanding of pollution sources amongst online panellists
A total of 57 per cent of online panel members reported being aware that water quality
ratings are reported for many of Auckland’s popular beaches and lagoons following the
rollout of Safeswim, similar to the pre rollout figure (55 per cent).
Fifty-nine per cent of those who were aware of water quality ratings could identify Auckland
Council as the organisation primarily responsible for water quality monitoring in Auckland,
down from 66 per cent pre rollout.
People were asked what they thought could be done to improve the pollution at Auckland’s
beaches and lagoons. While many people didn’t know what could be done, a substantial
number of detailed responses were provided, including:
• Addressing littering and rubbish issues
• Fixing struggling wastewater infrastructure to prevent overflow issues
• Preventing dumping of waste to drains
• General raising of awareness
• Better recycling and disposal options for chemicals
Safeswim impact evaluation 2018 8• More monitoring and enforcement
These suggestions indicate that, although not all beach users are certain of the causes and
solutions to Auckland pollution problem, many are aware of the need for improvements to
wastewater infrastructure.
When asked specifically about what is causing some beaches to be contaminated with
human and animal faeces in an open-ended question, beach users provided a range of
responses, as summarised in Table 1. Only approximately half of those surveyed indicated
an understanding that ageing sewage and wastewater systems are contributing to the
contamination of beach water (50% in 2017and 53% in 2018). A significant number of people
attribute beach contamination to local level problems such as littering, degraded toilet
facilities and freedom campers or dog owners not cleaning up after their pets.
Pre Rollout Post Rollout
Counts % Counts %
Sewage or wastewater infrastructure problems 502 50% 503 53%
Animals (dogs, farm animals) 211 21% 139 15%
Irresponsible people 165 17% 127 13%
Flooding/heavy rain 117 12% 173 18%
Toilets/diapers/campers at the beach 77 8% 61 6%
Maintenance, monitoring and enforcement 42 4% 45 5%
Crowding, population growth 35 4% 28 3%
Dumping/ litter 26 3% 27 3%
Septic tanks 20 2% 6 1%
Other 19 2% 27 3%
Don’t know 116 12% 117 12%
Table 1 Understanding of causes of beach contamination amongst on-line panellists
About one quarter of respondents did not know what illness or diseases might be associated
with swimming in water polluted with human/animal faeces (25% in 2017 and 26% in 2018).
However, many correctly guessed gastrointestinal issues (34% in 2017, 37% in 2018) and
skin infections (10% in 2017, 13% in 2018).
The general lack of certainty on what illnesses are associated with swimming in
contaminated water provides an opportunity for Safeswim communications to better inform
the public of the consequences of swimming when faecal indicator bacteria counts are high.
2.3 Trust and mistrust of water quality ratings
Of those who were aware of the published water quality ratings 75 per cent reported trusting
them, similar to 77 per cent pre rollout.
Safeswim impact evaluation 2018 9Trust in published water quality ratings Three-quarters of online panel members report 'trusting' water quality ratings 77% 75% Pre rollout Post rollout Figure 9. Trust of water quality ratings amongst an online panel of Aucklanders Those who answered that they do not trust published water quality ratings were asked to state why. The vast majority of respondents noted they don’t fully trust the ratings because they don’t know how up-to-date they are. Many believed that the ratings are still based on physical sampling and that tide and weather conditions make the ratings quickly out of date. A large number were distrustful due to being unsure how the ratings are produced. Others felt that the ratings are sometimes or often inaccurate and so shouldn’t be fully trusted, regardless of the warning content. A smaller group of people reported mistrust of the messenger (council and scientists) and, in some cases, a perception that there is an agenda behind the ratings produced. A small number of respondents reported mistrusting published ratings because they or their children had swum at a site with a high risk rating and didn’t get sick. Although this reflects a poor understanding of risk and probability, Safeswim does not currently provide adequate guidance on what risk ratings mean in terms of the likelihood of developing some water-related illness. Future behaviour change and engagement activities should address these areas of distrust, particularly the perception that the ratings are based on out-of-date samples. Safeswim impact evaluation 2018 10
2.4        Attitudes toward checking water quality

Beach visitors were asked what they thought the benefits were of checking the water quality
before swimming. The vast majority of the 509 beach visitors who answered mentioned
avoiding illness from swimming in contaminated water.

       “Avoid getting sick from contaminated water”

       “Keeping safe from bacteria in water”

       “I have small children so knowing what the conditions are and what the clarity of water
       is helps with keeping them healthy and safe”

       “For your own safety and you can warn families and friends…”

Future communications might benefit from highlighting avoiding potential illness as a way to
motivate Aucklanders to check Safeswim before they swim.

Online panel respondents were asked a range of questions about checking water quality.
Most agreed that swimming in poor quality water causes illness (85 per cent), that it is
important to check water quality before swimming (73 per cent) and that checking before
swimming will prevent illness (73 per cent).

Notable increases were seen in ratings of how important it is to check water quality before
swimming (+8 percentage point increase), in the ease of finding information on the quality of
Auckland’s beaches and lagoons (+11 percentage point increase), and the perception that
other people who are important to respondents check water quality (+7 percentage point
increase).

Safeswim impact evaluation 2018                                                              11
Attitudes toward checking water quality
Information rated as easier to find and a culture of checking is
developing
85% - Swimming in poor quality water will cause illness
82%
73% - It is important to check water quality before swimming
73% - Checking before swimming will prevent illness
67%
65%
44% - Information on water quality is easy to find
33% 33% - Other people often check water quality
26%
Pre rollout Post rollout
Figure 10. Online panel members’ attitudes toward checking water quality
The perception that close relatives and friends often check water quality before they swim
links to a perception that a social norm exists for checking water quality. As social norms
have been shown to be powerful motivators of behaviour (see Section 4.1.3 for more
discussion), further strengthening this perception is likely to encourage Aucklanders to
regularly check water quality before swimming.
Safeswim impact evaluation 2018 122.5 Are people using Safeswim?
Every beach visitor was asked whether they had checked Safeswim before visiting the beach
that day.
Nine per cent of all beach visitors had checked Safeswim before visiting the beach. A further
37 per cent didn’t check Safeswim before visiting the beach, but reported knowing what
Safeswim is.
Fifty-four per cent of beach visitors didn’t check Safeswim and didn’t know what it is.
One in eleven beach visitors checked Safeswim before
visiting
54%
37%
9%
Checked Safeswim Didn't check, but Didn't check and
before visiting the know what don't know what
beach Safeswim is Safeswim is
n = 617
Figure 11. How many beach visitors checked Safeswim before visiting the beach
Online panel members were asked both before and after the new Safeswim rollout whether
they had heard of Safeswim before, and whether they had ever visited the website. Both
awareness and website usage increased markedly post rollout. Prior to the rollout, 32 per
cent of respondents had heard of Safeswim and only 5 per cent had ever visited the website.
Four months after the new Safeswim website was launched, this awareness had increased
to 47 per cent and website visitation to 15 per cent of respondents.
Safeswim impact evaluation 2018 13Awareness and usage of Safeswim
The proportion of online panel members who have visited the
Safeswim website tripled
47% - Heard of Safeswim before
32%
15% - Ever visited Safeswim
5%
Pre rollout Post rollout
Figure 12. Awareness and usage of Safeswim amongst an online panel of Aucklanders
When asked to identify what Safeswim is, just over half of all beach visitors (55 per cent)
selected either or both ‘information on beach water quality’ and ‘other beach hazard
information’ responses.
One in two beach visitors could correctly identify what Safeswim is
Information on beach water quality 50%
Information on hazards at beaches 25%
Not sure 35%
Information on rips and swimming between the flags 24%
Swimming-related weather and tide information 24%
Recommendations for where to swim in Auckland 21%
Swimming and water safety lessons for Aucklanders 13%
Guidelines for staying safe when boating 11%
n = 618
Figure 13. Beach visitors’ understanding of what Safeswim is
As with beach visitors, online panel members were asked to indicate what they thought
Safeswim was. Prior to the launch of the new Safeswim, most people incorrectly thought
Safeswim impact evaluation 2018 14Safeswim was swimming and water safety lessons or information on rips and swimming
between the flags. Only one in four (26 per cent) correctly identified that Safeswim was about
information on beach and lagoon water quality. 2 Figure 14 shows that knowledge has
improved markedly, where 40 per cent of respondents identified water quality post rollout.
A total of 50 per cent of respondents selected either or both ‘information on beach water
quality’ and ‘other beach hazard information’ responses post rollout.
Knowledge of what Safeswim is has increased markedly amongst online panel
members
42%
40% - Info on beach water quality
Info on rips and swimming between the flags
34% 34% - Where to swim in Auckland
33% - Info on hazards at beaches
32% - Swimming and water safety lessons
30%
29%
26%
25% - Weather and tide information
24%
22% - Not sure
19% 19% - Guidelines for staying safe when boating
Pre rollout Post rollout
Figure 14. Understanding of what Safeswim is amongst an online panel of Aucklanders
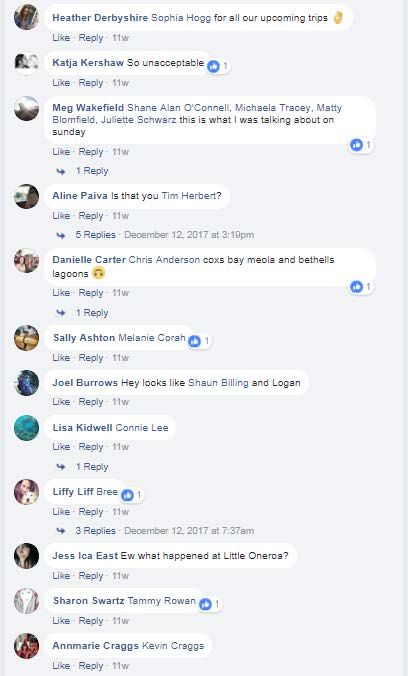
In the post rollout survey, those who reported having heard of Safeswim before were asked
where they had heard of it (see Figure 15). Social channels, where people were told by
friends and family – notably word of mouth and Facebook – proved to be important ways that
people heard of Safeswim. An example of the ‘social transmission’ of information via
Facebook can be seen in Figure 16, where individuals tagged their friends to encourage
them to look at a Safeswim advertisement.
Social sharing and social norms around informing others on beaches should be encouraged
in future communications campaigns. This is discussed more in Section 4.1.3.
2
The response option ‘information on hazards at beaches’ was included only in the post rollout survey
Safeswim impact evaluation 2018 15How online panel members heard of Safeswim
Word of mouth, Facebook and TV important communication channels
Word of mouth 29%
Facebook 22%
Television 21%
Not sure 17%
Our Auckland - print & online 15%
Radio 15%
Google search 11%
Neighbourly 9%
MetService website 7%
Newspaper article 5%
Other website(s) 5%
Other 3%
Twitter 3%
n = 480
Figure 15. How an online panel of Aucklanders heard about Safeswim (post rollout only)
Consistent with the findings that people heard about Safeswim from others, our on-beach
researchers heard stories of members of the public warning other beach visitors who were
swimming when water quality was reported as poor on Safeswim.
Additionally, on-beach surveying was used as an opportunity to engage with the public about
water quality and Safeswim. After visitors had completed the survey, the researchers talked
to them about Safeswim and water quality issues at the beach. The majority of people were
keen to discuss Safeswim and to learn more.
This engagement and enthusiasm provides a platform for future behaviour change activities
suggested in Section 4.1.
Safeswim impact evaluation 2018 16Figure 16. Example of the public sharing Safeswim information with their friends on Facebook Safeswim impact evaluation 2018 17
2.5.1 Likelihood of swimming under different Safeswim ratings
Beach visitors were asked whether they or their family would swim under the four different
Safeswim conditions, with images of the warnings as they appear on the Safeswim website:
Low Risk, Fair, High Risk (temporary), and High Risk (long-term).
More than 90 per cent of visitors were clear on whether they would or would not swim under
low risk and high risk conditions. Beach visitors were less clear about the appropriate course
of action under fair conditions, however. Fifty-eight per cent were happy to swim, but 25 per
cent felt it wasn’t worth the risk, and 18 per cent were unsure.
Future communications may wish to focus on providing clearer guidance to the public on how
to interpret ‘fair’ risk warnings.
Whether beach visitors would swim under different risk ratings
More visitors unsure what ‘fair’ means
Yes No Not sure
Low risk 92% 3% 5%
Fair 58% 25% 18%
High risk (temporary) 3% 90% 6%
High risk (long-term) 3% 92% 5%
ns = 603-610 0% 20% 40% 60% 80% 100%
Figure 17. Likelihood of swimming under different Safeswim risk ratings
2.5.2 Website reliability
Although a detailed review of website performance is outside the scope of this evaluation,
some survey respondents reported frustration to our on-beach researchers (February 2018)
that they had tried to check the Safeswim website but it was unavailable when they needed
it.
Anecdotally, RIMU accessed the Safeswim website regularly throughout the 2017/2018
summer period and experienced relatively frequent instances where the website would not
load. Typically the outage would last a few minutes and it would return after periodic
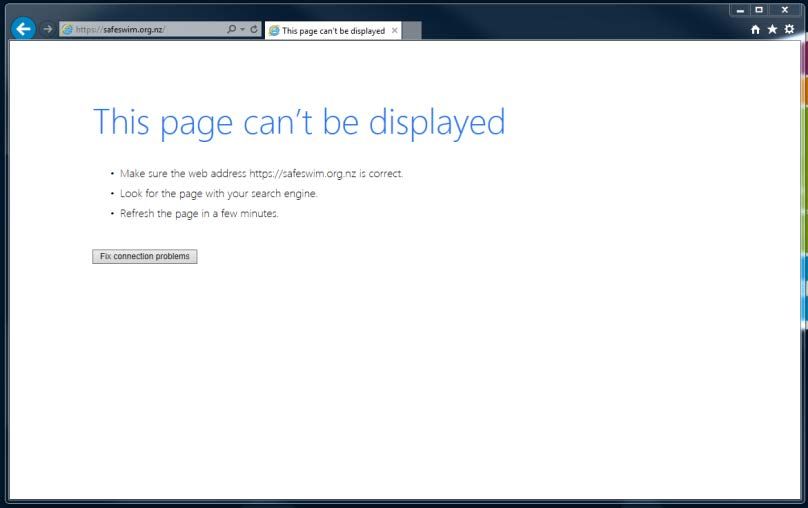
refreshing. Figure 18 and Figure 19 show the errors encountered.
Safeswim impact evaluation 2018 18Figure 18. Safeswim loading error: Google Chrome Figure 19. Safeswim loading error: Internet Explorer Safeswim impact evaluation 2018 19
2.6         Why are people not using Safeswim?

Beach visitors were asked whether there is any reason they would not proactively check a
beach or lagoon's water quality before swimming.

Future communication efforts should focus on addressing these reasons.

The 272 people who wrote an answer provided a range of reasons for not checking:
    •      Lack of knowledge featured heavily – many people reported being unaware that
           there was an issue or that checking was even necessary. Others were unsure of
           where and how they would check, even if they wanted to.
    •      Some reported relying on visual cues at the beach or lagoon to determine whether
           it was safe to swim or not. A number of people reported ‘trusting their eyes’ to tell if
           water was polluted (with some mentioning litter as a proxy for water quality), while
           others said they would take cues from whether other visitors were swimming. Some
           people expected to be explicitly told by others if water quality was poor, either via on-
           beach signs or news articles.
    •      Forgetting or laziness was listed by a number of people, indicating stimulating
           motivation via public communications and encouraging habit formation is important.
    •      Low access to technology or internet access was noted by some, along with a lack
           of preparedness due to spontaneous beach visits.
    •      A minority of people reported weighing up the risks and deciding that the enjoyment
           of a swim on a hot day outweighed the risks.

A range of reasons were offered for not checking water quality before
swimming
 Unaware that there is an issue and that checking is necessary                               13.2%

             Assumption that the beach would be safe to swim                                 13.2%

                            Not sure how to go about checking                               12.5%

                       Would trust eyes to assess water quality                   7.7%

        Expect there to be signs or to be actively told by others          5.5%

           Would take cue from others' behaviour at the beach         4.4%

                                                          Forget                                     16.2%

                                                        Laziness                     8.8%

                                             No internet access               7.0%

                                     Spontaneous visit to beach     3.3%

     Need for a swim in hot weather outweighs perceived risk        3.7%

                                   Other miscellaneous reasons                                         17.3%

 n = 272

Figure 20. Beach visitors’ reasons for not checking water quality before swimming

Safeswim impact evaluation 2018                                                                                20
2.7 Safeswim in the media
Online panel members were much more likely to have read something about water quality at
Auckland's beaches or lagoons post rollout (69 per cent) than pre rollout (52 per cent).
This +17 percentage point increase is likely reflective of an increase in the number of articles
as well as the greater public concern with water quality.
Reading about water quality in auckland
More Aucklanders reported having read something about water
quality at Auckland's beaches and lagoons
69%
52%
Pre rollout Post rollout
Figure 21. Percentage of online panel members’ who had read about water quality in
Auckland in the previous 12 months
2.7.1 Media Analysis
An internet scan for New Zealand media articles was conducted for the period of 1
November 2016 to 28 February 2018 using a range of key words relating to water quality 3.
A total of 106 articles were identified including news, features and opinion pieces. Although
every effort was made to include all relevant articles, it is likely some articles were missed.
We believe the search is sufficient to provide an indication of the trends in media coverage
on the topic.
3
Auckland beaches and water quality, Safeswim, water quality alert, contaminated, beach signs,
beach signage, sewage, unfit to swim, beaches closed, beach warnings, targeted rate, stormwater
systems, polluted beaches, faeces, poo tracker, health warnings, beach closure, and bacterial levels.
Safeswim impact evaluation 2018 21Table 2 presents the sources of published articles. The largest source of articles was the
New Zealand Herald, which consisted of 37 per cent of the sample. Stuff made up another
quarter of the articles (Stuff coverage included republished articles from local level press
including North Shore Times and Western leader), followed by Radio New Zealand at 15 per
cent and Newshub at 13 per cent.
Media Source Count % of total
New Zealand Herald 39 37%
Stuff 4 25 24%
Radio New Zealand 15 14%
Newshub 13 12%
1NewsNow 5 5%
Newstalk ZB 2 2%
The Spinoff 2 2%
Newsroom 1 1%
New Zealand Geographic 1 1%
Radio Live 1 1%
Weekend Herald 1 1%
Voxy 1 1%
Total 106 100%
Table 2. Source of water quality media articles
2.7.1.1 Coverage of water quality has increased
Looking at media coverage since November 2016 shows that water contamination at
Auckland beaches and lagoons has received increased attention this summer. Thirty two
articles were found in the year prior to the launch of the new Safeswim programme. In just
under five months since the launch, at least another 74 have been published.
January and February 2018 had a particularly high number of articles, coinciding with a
period of disruptive weather and a number of ‘high risk’ Safeswim ratings for beaches across
Auckland.
Pre rollout Post rollout
Count % Count %
Total articles 32 30% 74 70%
Table 3. Media coverage of water quality
4
This includes 6 North Shore Times, 3 Western Leader, and 1 Central Leader article.
Safeswim impact evaluation 2018 22Number of water quality articles per week
12
10
New Safeswim website goes live
8
6
4
2
0
16/10/2016 5/12/2016 24/01/2017 15/03/2017 4/05/2017 23/06/2017 12/08/2017 1/10/2017 20/11/2017 9/01/2018 28/02/2018
Week ending
Figure 22. Number of media articles per week (Nov 2016 - February 2018)
2.7.1.2 Coverage of Safeswim has increased
Safeswim now features in most media discussions of the contamination of Auckland’s
beaches. The majority of media articles (76 per cent) discussing the water quality issues
facing Auckland’s beaches published since November 2017 mentioned the Safeswim
website. Safeswim was only mentioned in 28 per cent of the articles that were published in
the year prior to the launch of the new website.
Pre rollout Post rollout
Count % Count %
Mentioned Safeswim 9 28% 56 76%
Table 4. media coverage of Safeswim
Fourteen per cent of the articles that mention Safeswim since November 2017 included
some form of negative impression of the Safeswim website and / or beach signage,
compared to no articles published prior to the Safeswim rollout. The negative coverage can
be summarised as:
• The new Safeswim monitoring system will decrease the amount of actual water
quality testing and / or will lead to the use of a ‘machine to dictate actions,’ i.e. an
overreliance on modelling to determine whether beaches are safe for swimming
(Editorial, ‘Safeswim serving up nonsense, 18 Feb 18, NZH)
• Water quality alerts are confusing, unreliable or suspect, as captured by the following
headline: ‘Swimmers question council website showing city beaches unsafe’ (Stuff, 8
Nov 17).
• Signage is inadequate: ‘Swimmers unaware of low water quality at Auckland beach’
(RNZ, 3 Jan 18)
Safeswim impact evaluation 2018 23• Water quality alerts are making a mountain of a molehill and there is a hidden agenda
behind them: ‘I think we are being played…’ (Roughan editorial, ‘Beach closures
adding insult to whingery’, Weekend Herald, 24 Feb 18)
In about half of these articles, the negative views are countered, at least to some extent, with
an explanation of the Safeswim programme. For the strongest example of this see: ‘Scientist
answers sceptics about Auckland Council's SafeSwim website,’ Stuff, 23 Jan 18).
Twelve per cent of the articles mentioning Safeswim since November 2017 included a minor
typo such as referring to the programme as SwimSafe or SafeSwim.
A smaller number of articles inaccurately made reference to a swimming ban or
misrepresented how Safeswim works. The percentage of articles misrepresenting Safeswim
was relatively stable over time (6 per cent prior to the launch; 5 per cent after the launch).
Source Title Reference
Newstalk ZB, 22 Revealed: Auckland’s dirtiest ‘Swimming has been banned at 10
Jan 2017 beaches Auckland beaches this summer
because of worsening pollution from
human and animal wastes.’
NZH, 24 Jan Auckland’s water shock: Bacteria ‘Swimming has also been banned
2017 levels ‘dangerously high’ at 10 Auckland beaches this
summer because of worsening
pollution from human and animal
wastes.’
NZH, 11 Feb 18 Swimming ‘not advised’ at ‘Lifeguards shut the whole beach
Auckland beaches after when a fault caused a stormwater
wastewater overflow drain to overflow.’
Newshub, 12 Feb Swimming off limits at 50 ‘Swimming is off limits at around 50
18 Auckland beaches Auckland beaches.’
NZH (editorial), Safeswim serving up nonsense ‘machine to dictate actions’
22 Feb 18
Weekend Herald Beach closures adding insult to 'extended closed periods'
(Roughan, whingery
editorial) 24 Feb
18
Table 5. Nature of Safeswim inaccuracies in the media
2.7.1.3 Coverage of water quality alerts and ‘cancelled events’ has increased
Prior to the Safeswim launch, half of the articles mentioned at least one beach that had a
water quality alert. This increased to 80 per cent after Safeswim was launched.
Safeswim impact evaluation 2018 24Only 3 per cent of the articles published in the period prior to November 2017 mentioned a
cancelled or relocated public event. This proportion jumped to 14 per cent following the
launch of Safeswim.
Pre rollout Post rollout
Count % Count %
Mentioned water quality alert 16 50% 49 80%
Mentioned cancelled / relocated events 1 3% 10 14%
Table 6. Media coverage of water quality alerts and disrupted events
2.7.1.4 Coverage of the source(s) of the problem
A significant majority of articles we analysed made at least a passing reference to the
source(s) of the contaminated water at Auckland’s beaches. Prior to the launch of the
Safeswim 91 per cent of articles discussed the source of the problem. Following the launch
of the new Safeswim, the proportion has dropped to 74 per cent, although this should be
interpreted in light of the overall increase in articles – the raw number of articles mentioning
the source of water quality issues in Auckland was 55 in the five months from November
2017, compared to 29 in the year prior. A greater percentage of articles post Safeswim
launch reported on a beach water quality alert, a cancelled event or Safeswim itself without
going into further depth.
Pre rollout Post rollout
Count % Count %
Discussed source(s) of problem 29 91% 55 74%
Table 7. Media coverage of source of water quality issues
The sources of the problem most commonly referred to were:
• Heavy rain leading to sewage and stormwater overflows: ‘A pungent mix of raw
sewage and stormwater from areas of the city served by a century-old sewerage
system is pushed out to sea when it overflows during periods of heavy rain.’
(Fonseka, Oct 6, 2017)
• The adverse impact of long dry spells followed by a heavy rain event is sometimes
mentioned, as is the increased frequency of extreme weather events.
• Farm contamination and polluted road runoff is also discussed in some articles.
• Blocked or damaged wastewater pipes was a topic of discussion particularly at the
end of January 2018, covering events on the North Shore: ‘Auckland's worst sewage
spill in 25 years in clean-up mode’ (Stuff, 31 Jan 2018).
• The potential contribution of more intensive urban development as well as illegal
connections to the wastewater system are also occasionally cited as contributing
factors.
Safeswim impact evaluation 2018 252.7.1.5 Solutions to water quality issues
In the year prior to the launch of Safeswim 72 per cent of articles discussed solutions to
Auckland’s water quality issues. This has dropped to 53 per cent since November 2017,
although the raw number of articles is higher in the last five months than in the 12 months
prior to the launch of Safeswim.
Pre rollout Post rollout
Count % Count %
Discussed solution(s) 23 72% 39 53%
Situation getting worse/ more urgency 12 38% 16 22%
needed
Table 8. Media coverage: solutions to water quality issues
The solutions most commonly discussed in the media were upgrades to the city’s stormwater
and wastewater systems. The time and cost requirements of these infrastructure upgrades
attracted a great deal of attention. In recent media coverage, the proposed Long-term Plan
and targeted rate to raise money for these city works was also raised. Less frequent were
references to programmes to upgrade faulty septic tanks. One article in particular addressed
the issue of water management at the city level more broadly and promoted the concept of
‘water sensitive’ urban development (New Zealand Geographic, May 2017, ‘No swimming.’).
A significant portion of the media coverage discusses the willingness or reluctance of rate
payers to take on the required extra costs associated with addressing the water quality
problem. The fact that the North Shore had already upgraded its infrastructure and that most
of the infrastructure requiring improvement is based in the isthmus, but will be paid for by all
residents, are the types of issues sometimes raised. In addition, it is sometimes mentioned
that even the planned upgrades will not solve the problem entirely. Also receiving some bad
press is Auckland Council’s application for a renewal of their consent to discharge
stormwater for the next thirty five years.
Just over a quarter of the articles (26%) made reference to either the water quality situation
getting worse and/or the issue requiring more urgency on the part of decision-makers. Of the
articles published prior to November 2017, this was the case 38 per cent of the time whereas
once Safeswim was launched, this decreased to 22 per cent of the articles published. The
reasons are likely similar to the decrease in the proportion of articles of reporting on solutions
to water quality since the launch of the new Safeswim programme; that is, the rise in articles
that report simply on Safeswim, water quality alerts or cancelled or relocated public beach
events.
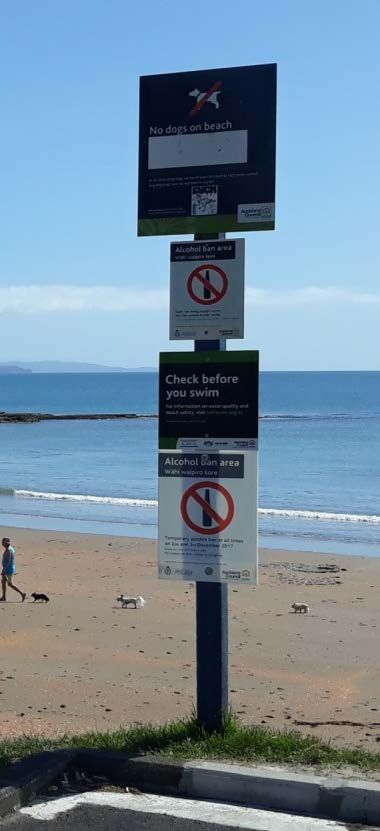
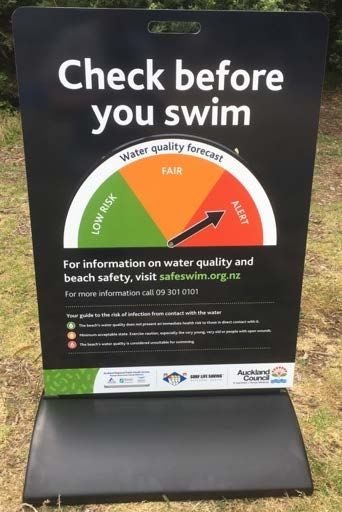
Safeswim impact evaluation 2018 262.8 Beach signs
Three sign types were designed and trialled as part of the 2017 Safeswim development:
• Small, static approach signs were installed at all Safeswim locations (although at the
time of our research some of these signs had been removed by unknown individuals).
• Three electronic signs have been installed: one at Mission Bay (active from 3
November), Takapuna (late February) and St Marys Bay (Early February).
• Pavement blades were placed on beaches by Surf Life Saving guards during patrol
hours at 11 beaches.
Static approach sign Adjustable pavement blade Electronic sign
Figure 23. Water quality signs at beaches
2.8.1 How many people noticed signs?
All beach visitors were asked if they had seen any signs about water quality during their visit.
Only 13 per cent of beach visitors reported seeing signs on the day they were surveyed,
indicating the current sign configuration is inadequate to function as a primary warning
system.
Safeswim impact evaluation 2018 27One in eight beach users noticed water quality signs during
their visit
87%
13%
Saw a sign about Did not see any signs
water quality
n = 618
Figure 24. Whether beach visitors noticed water quality signs
The level of sign awareness varied considerably by beach (see Figure 25 for a breakdown by
beach).
Bethells Lagoon – where Surf Life Saving patrols placed a pavement blade at the one main
entrance to the beach, and where a permanent ‘long-term no-swim’ sign is present – had the
highest awareness, with 26 per cent of surveyed visitors noticing one of these two signs. The
percentage of visitors who noticed signs at other beaches was:
• Red Beach: 18 per cent
• Takapuna Beach: 12 per cent
• Mission Bay: 11 per cent
• Eastern Beach: 3 per cent.
People were most likely to report seeing a pavement blade put out by Surf Life Saving (Red
Beach and Bethells Beach) or an electronic sign if present (i.e. Mission Bay and Takapuna
Beach).
Very few beach users noticed static approach signs, with the exception of Bethells Lagoon,
where 11 per cent of people surveyed noticed the ‘long-term no swim’ sign. At beaches other
than Bethells, less than one per cent of people saw a static “Check before you swim”
approach sign.
Figure 25 on the following page summarises the percentage of visitors who noticed signs at
each beach. The dark blue represents the total proportion of visitors who noticed a sign, with
light blue bars explaining the components.
Eastern beach is not included, as none of the three per cent of visitors who reported noticing
a sign could correctly identify what it was or said.
Safeswim impact evaluation 2018 28Bethells Lagoon Red Beach
15.2%
26.1% 8.9%
17.8% 1.4%
10.9% 2.1%
N/A N/A 5.5%
Noticed Identified Identified Identified Identified Did not Noticed Identified Identified Identified Identified Did not
a sign electronic pavement small non-Safeswim provide a a sign electronic pavement small non-Safeswim provide a
n = 46 sign blade static approach… sign description sign blade static approach… sign description
n = 146
Takapuna Beach Mission Bay
6.2%
12.3% 7.9%
0.8% 0.8% 11.4%
4.6% 0.4% 0.9%
2.2%
Noticed Identified Identified Identified Identified Did not Noticed Identified Identified Identified Identified Did not
a sign electronic pavement small non-Safeswim provide a a sign electronic pavement small non-Safeswim provide a
sign blade static approach… sign description sign blade static approach… sign description
n = 130 n = 229
Figure 25. Beach visitor awareness of water quality signs, by beach
Safeswim impact evaluation 2018 29You can also read