The 2019 Kinder Houston Area Survey - Tracking Responses to the Economic and Demographic Transformations through 38 Years of Houston Surveys

Page created by Angela Morales
 
CONTINUE READING
The 2019 Kinder Houston Area Survey - Tracking Responses to the Economic and Demographic Transformations through 38 Years of Houston Surveys
Building Better Cities
                                                                               Building Better Lives

The 2019 Kinder
Houston Area Survey
Tracking Responses to the Economic and
Demographic Transformations through
38 Years of Houston Surveys

STEPHEN L. KLINEBERG, FOUNDING DIRECTOR, KINDER INSTITUTE FOR URBAN RESEARCH             MAY 2019
The 2019 Kinder Houston Area Survey - Tracking Responses to the Economic and Demographic Transformations through 38 Years of Houston Surveys
We define our success through yours
We can only be successful if our employees, customers and the communities we serve have the
opportunity to achieve their own vision of success. Bank of America is helping to build a better tomorrow
by using our capital, expertise and innovation to foster a diverse workforce to address societal issues like
climate change, gender equality and economic mobility. Shared success means creating responsible,
sustainable growth for our company and our world.

Learn more at bankofamerica.com/about.

Connect with us:             @BofA_News

©2019 Bank of America Corporation | AR64WX5V | ESG-236-AD
The 2019 Kinder Houston Area Survey - Tracking Responses to the Economic and Demographic Transformations through 38 Years of Houston Surveys
CONTENTS               1

     Contents
2    Introduction; Survey Methodology

4    Highlights from the Thirty-Eighth Year

7    The Houston Economy across the 38 Years

11   The Education Crisis and the Growing Inequalities

15   Feeling More at Home with Houston’s Burgeoning Diversity

20   After Harvey

23   Continuity and Change in Political Orientations

27   Concluding Note

               Tracking Responses to the Economic and Demographic Transformations Through 38 Years of Houston Surveys
The 2019 Kinder Houston Area Survey - Tracking Responses to the Economic and Demographic Transformations through 38 Years of Houston Surveys
xiqu
                                                                                                                             inho
                                                                                                                                 silva
                                                                                                                                      /flic
                                                                                                                                           kr

                      r
                   ick
               a/fl

                          Introduction
          osilv
   u  inh
xiq

                          F
                                 or 38 years, Rice University’s Kinder Houston Area Survey has been tracking systematically
                                 the continuities and changes in the perceptions and experiences of successive representative
                                 samples of Harris County adults. Through intensive interviews with a total of more than 46,000
                          Houston area residents, the surveys have been measuring the trends among Harris County residents
                          in their life experiences, attitudes, and beliefs during almost four decades of remarkable economic,
                          demographic, and technological change.

                          Under contract with Simon & Schuster, a new book exploring the national implications of this
                          research, entitled Prophetic City: Houston on the Cusp of a Changing America, is scheduled for
                          publication early in 2020. In this report, we assess the findings from the 2019 survey and look back
                          on 38 years of systematic assessments of attitudes and beliefs to ask about the way the views of
                          area residents have changed in response to new challenges.

                          Few cities exemplify more clearly than Houston the trends that are refashioning the social and
                          political landscape across all of America. The high-tech, knowledge-based, global economy
                          is generating mounting inequalities based primarily on access to quality education. As urban
                          centers compete for the most talented individuals and the most innovative companies, quality-
                          of-place attributes will increasingly determine the fates of cities. Meanwhile, an epic demographic
                          transformation is underway, as this city and country, once predominantly composed of European
                          nationalities, is rapidly becoming a microcosm of all the world’s ethnicities and religions. Nowhere are
                          these new realities more sharply articulated than here in the Houston region.

                          In this report, we show that area residents are growing more concerned about the pervasive
                          inequalities in economic opportunities and they are more insistent than in earlier years on the need
                          for policies to reduce the income disparities and improve the public schools. Here, at the forefront
                          of the nation’s demographic transformations, all of Houston’s major ethnic communities have
                          been expressing more favorable attitudes toward immigration, and they are more likely over the
                          years to report that they have close personal friends from all the different ethnicities. We note the
                          importance for Anglos and blacks of age or date of birth, and for Hispanics and Asians, of whether

                          The 2019 Kinder Houston Area Survey
The 2019 Kinder Houston Area Survey - Tracking Responses to the Economic and Demographic Transformations through 38 Years of Houston Surveys
INTRODUCTION                3

they are U.S. natives or foreign-born, in accounting for
differences among the respondents in their embrace of                     Survey Methodology
the new diversity.
                                                                          The 38th annual Kinder Houston Area Survey was
We also measure the degree to which the participants                      conducted between February 4 and March 14, 2019
in the 2019 survey, more than a year and a half after                     by SSRS in Media PA. The intensive 30-minute
Hurricane Harvey, have grown less concerned than they                     interviews reached (50 percent by landline, 50
were in 2018 about the region’s vulnerability to flooding                 percent by cell phone) a scientifically-selected,
and are less inclined to support specific government                      randomly-generated, representative sample of 1,000
interventions intended to mitigate future flooding. And we                adults living in Harris County.
ask if that lessening of support for specific policies has also
                                                                          The responses from all 38 years of surveys are
softened concerns about climate change and reduced the
                                                                          “weighted” to correct for variations in the likelihood
perceived need for better land-use planning. Finally, we
                                                                          of selection and to align the samples more closely
take stock of the ongoing changes in political orientations:
                                                                          with known population parameters. This helps to
Harris County, which has long been evenly split between
                                                                          ensure that the data we report will accurately reflect
Republicans and Democrats, is now increasingly aligned
                                                                          the characteristics of the county’s overall population
with the Democratic Party, and we explore area residents’
                                                                          along such dimensions as race or ethnicity, age,
changing views over the years on the direction in which the
                                                                          gender, educational attainment, and homeownership.
country is moving, on the need for criminal justice reform,
                                                                          When asking about changes over time, we assess
and on attitudes toward abortion and homosexuality.
                                                                          the similarities and differences in the weighted
This 38-year research program would not have been                         responses given by successive representative
possible without the continued generous support and                       samples of Harris County residents when responding
steadfast encouragement of the Kinder Foundation and                      to identically-worded questions that have been
Houston Endowment Inc., along with so many other                          positioned similarly in the survey instrument.
corporations, organizations, friends, colleagues, and
                                                                          No other city in America has been tracked in this
students who have repeatedly affirmed the value of this
                                                                          way over so many years. Few more clearly exemplify
continuing effort to measure systematically the changing
                                                                          the remarkable changes that are underway across
views of Houston area residents as they respond to the
                                                                          the country.
new realities. Our heartfelt thanks to all!

                                                                                                                                                                   Joe Wolf/flickr

                                                          Tracking Responses to the Economic and Demographic Transformations Through 38 Years of Houston Surveys
The 2019 Kinder Houston Area Survey - Tracking Responses to the Economic and Demographic Transformations through 38 Years of Houston Surveys
xiqu
     inho
          silv
              a/fl
                  ick
                     r

                         Highlights from
                         the Thirty-Eighth Year
                         The Houston economy since 1982
                         !! For almost four decades, the surveys have measured area residents’ subjective assessments of
                            local job opportunities, as the oil boom collapsed and then recovered into the ups and downs of
                            a more problematic economy. In recent years, after oil prices fell from dizzying heights in 2014
                            to lows in 2015, positive evaluations of the local economy rebounded once again, to reach what
                            now looks like a new, more stable plateau of modest long-term growth.

                         !! Ratings of local job opportunities as excellent or good were expressed by 67 percent of this year’s
                            survey participants; the figures were 69, 62, 63, and 67 in the past five years. This may be a good
                            time for Houston to plan seriously for the new investments that will be needed in order to improve
                            the region’s prospects for sustained prosperity in today’s economy.

                         !! When asked in 2019 to name the biggest problem facing people in the Houston area today, traffic
                            was the predominating concern, just as it has been in the past five years; but this time it was cited
                            by 36 percent of all the respondents, up significantly from 25 percent in the 2018 survey, when 15
                            percent spontaneously named floods and storms as their dominant concerns.

                         The education crisis and the growing inequalities
                         !! The low-skilled, well-paid blue-collar jobs are disappearing in the wake of globalization and
                            automation. Some form of post-secondary education is now required for almost all well-paying
                            jobs, yet only 22 percent of the students who began the eighth grade in Houston-area schools in
                            2006 had completed any college-level program by 2017, twelve years later.

                         !! The survey respondents in 2019 decisively affirmed, by 67 to 33 percent, the necessity for
                            education beyond high school in order to qualify for a well-paid job. Blacks and Hispanics appear

                         The 2019 Kinder Houston Area Survey
The 2019 Kinder Houston Area Survey - Tracking Responses to the Economic and Demographic Transformations through 38 Years of Houston Surveys
HIGHLIGHTS FROM THE THIRTY-EIGHTH YEAR                           5

  to be far more aware than Anglos of the new realities            Feeling more at home with Houston’s
  and are even more certain about the importance of                burgeoning diversity
  obtaining such post-secondary credentials.
                                                                   !! In the census of 1960, fully 74 percent of the Harris
!! We have asked the survey participants over the years                County population was composed of non-Hispanic
  if they thought the public schools had enough money,                 whites, 20 percent were African Americans, and 6
  if it were used wisely, to provide a quality education, or           percent were Hispanics. During the past 30 years,
  whether the schools will need significantly more money. In           this historically black/white southern city has been
  1995 and 1997, clear majorities believed that the schools            transformed into one of the most ethnically diverse
  had all the money required. In subsequent years through              metropolitan regions in the entire country.
  2009, the respondents were evenly divided on this issue.
                                                                   !! Previous reports on this research have documented
  When we asked the same question again in 2018, area
                                                                       the continually increasing numbers of U.S.-born Anglos
  residents had changed their minds: By 56 to 42 percent,
                                                                       who express support for the new immigration. Here
  they were now clear in asserting that the schools will need
                                                                       we present the responses of blacks and Hispanics
  more money if they expect to provide a quality education.
                                                                       as well, and we find that the positive attitudes toward
!! The survey questions measuring economic well-being                  immigration in general have been increasing steadily in
  remind us of the financial insecurity that is so pervasive           all ethnic communities.
  in the Houston area. Almost four out of ten of the
                                                                   !! In alternating years since 2002, we have asked the
  survey participants in 2019 said they did not have $400
                                                                       respondents about close personal friendships or
  in savings to draw on in case of an emergency. One-
                                                                       romantic relationships with people from other ethnicities.
  fourth of all area residents do not have health insurance
                                                                       In all four communities and with regard to all of the
  and one-third said they had difficulty during the past
                                                                       other major ethnic groups, the numbers who say they
  year paying for the groceries to feed their families or
                                                                       have close interethnic friendships have been growing
  covering the costs of housing. Partly in response to
                                                                       significantly across the board.
  these persistent inequalities, the respondents in growing
  numbers are now calling for public policies to reduce            !! Among Anglos and African Americans, a key
  the financial inequities and strengthen the safety net.              determinant of both cross-ethnic friendships and of

                                                                                                                                                                 whittlz/flickr

                                                        Tracking Responses to the Economic and Demographic Transformations Through 38 Years of Houston Surveys
The 2019 Kinder Houston Area Survey - Tracking Responses to the Economic and Demographic Transformations through 38 Years of Houston Surveys
6         HIGHLIGHTS FROM THE THIRTY-EIGHTH YEAR

                                                                                                                               Osbornb/flickr
     romantic relations is the respondents’ age or year of          survey participants in 2019 were every bit as concerned
     birth: Younger respondents have been growing up in             as they were in 2018 about the impact of climate
     a world of thriving interethnic friendships; they take for     change, and they were even more insistent on the need
     granted what most older Houstonians are less ready to          for better land-use planning to guide development in the
     accept. For Hispanics and Asians, the most powerful            Houston area.
     determinant of interethnic friendships is whether they
     are first-generation immigrants or the U.S.-born children    Continuity and change in political orientations
     of earlier waves of immigrants.
                                                                  !! The residents of Harris County, long evenly split
                                                                    between Republicans and Democrats, have become
After Harvey
                                                                    increasingly affiliated with the Democratic Party in
!! Hurricane Harvey was the worst rainfall event ever to            recent times. The partisan differences in beliefs about
     hit the continental United States, but more than a year        the direction of the country have moderated, with
     and a half has passed since the storm made landfall            Republicans becoming somewhat less optimistic and
     in August 2017. The survey respondents are less likely         Democrats less pessimistic, over the past year.
     today than in 2018 to mention concerns about flooding
                                                                  !! Support for alternatives to mandatory prison sentences
     when asked to name the biggest problem facing people
                                                                    for nonviolent drug offenders has increased in the
     in the Houston area.
                                                                    years since 2011, but the partisan divisions have also
!! Even though more than three-fourths of the respondents           grown. After a seeming convergence in the 2016 survey,
     in 2019, the same proportion as in 2018, said it was           Democrats are now much more likely than Republicans
     virtually certain that Houston will experience more            to call for criminal justice reform and for ending the
     severe storms in the next ten years, they were less            practice of mass incarceration.
     inclined today than in 2018 to call for prohibiting
                                                                  !! The new Democratic (and more secular) direction can
     construction in flood-prone areas or for raising taxes to
                                                                    also be seen in the sea-change that has taken place
     buy out homes that have repeatedly flooded.
                                                                    among the survey participants in their support for
!! At the same time, little change has occurred in area             gay rights and, to a lesser extent, in their support for
     residents’ broader perspectives on flooding issues. The        abortion rights as well.

The 2019 Kinder Houston Area Survey
The 2019 Kinder Houston Area Survey - Tracking Responses to the Economic and Demographic Transformations through 38 Years of Houston Surveys
kr
        flic
    olf/
  eW
Jo

                                                                                                                                          - Ad
                                                                                                                                              am
                                                                                                                                                   Ree
                                                                                                                                                      der
                                                                                                                                                            -/flic
                                                                                                                                                                  kr

                 The Houston Economy
                 across the 38 Years

                 W
                              hen we conducted the first survey in this series as a class project at Rice University
                              in March of 1982, it turned out to be at the height of Houston’s economic boom.
                              Corporations such as Hughes Tool Company, Cameron Iron Works, Compaq Computer,
                 Conoco, Exxon, Silver Eagle Distributors, Continental Airlines, Pennzoil, and Texaco were providing
                 steady incomes and pensions to a broad spectrum of Houston residents. Almost 50 percent of
                 all U.S. oil refining was taking place in the petrochemical plants along the Ship Channel, including
                 the plastic products, technical equipment, and industrial chemicals at the heart of the industry.
                 Meanwhile, the Texas Medical Center and the Houston Port were in the midst of their own
                 spectacular growth.

                 Figure 1 gives the official unemployment rates in Harris County during February in each of the
                 38 years, along with the survey participants’ negative ratings (fair or poor) of local job opportunities.
                 The data provide a vivid reminder of the economic upheavals the Houston area has undergone, while
                 also documenting the remarkable convergence between the objective data as recorded each year by
                 the U.S. Bureau of Labor Statistics and the subjective impressions of the local economy as given by
                 successive representative samples of Harris County residents.

                 The 1982 survey reflected the booming economy. In March of that year, more than three-fourths
                 of the respondents (76 percent) rated job opportunities in the Houston area as excellent or good;
                 47 percent said their personal financial situations were getting better and 63 percent thought
                 they would be even better off three or four years down the road. Two months later, the oil boom
                 collapsed. The price of a barrel of Texas crude dropped from about $32 in early 1982 to less than
                 $28 by the end of 1983, but Houston had been building and borrowing in the expectation of $50
                 oil. Within 18 months, a region that had known only growing prosperity recorded a net loss of nearly
                 100,000 jobs.

                                                    Tracking Responses to the Economic and Demographic Transformations through 38 Years of Houston Surveys
The 2019 Kinder Houston Area Survey - Tracking Responses to the Economic and Demographic Transformations through 38 Years of Houston Surveys
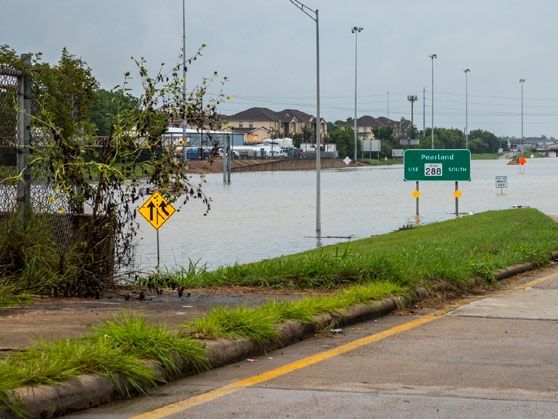
8                                       THE HOUSTON ECONOMY ACROSS THE 38 YEARS

     Figure 1                                                                              Source: U.S. Department of Labor, Bureau of Labor Statistics. Unemployment rates are not seasonally adjusted. Kinder Houston Area Survey (1982–2019).

     The official unemployment rates and negative ratings of job opportunities (1982–2019)
                                         10.5                    10.1                                                                                                                                                             100%
                                                     9.8                                                      Official unemployment rates in Harris County
                                                                                                              Negative ratings of job opportunities                                                                               90%
                                          9.5                         86%

                                                                                                                                                                                                                                         PERCENT GIVING NEGATIVE RATINGS
                                                                                                                                                                              8.6                                                 80%
                                                                                      72%
       OFFICIAL UNEMPLOYMENT RATES

                                          8.5                                                                                                                                        8.4                                          70%
                                                                                                                                                                         61%
                                                                                     7.8                                                57%                                                                                       60%
                                          7.5                                                                                                                    53%                          7.3
                                                                               55%                                                            6.8                                                6.8                              50%
                                          6.5                                                                                                                  41%         6.6
                                                          6.7                                                                                                                                            36%                      40%
                                                                                                                     32%34%                                                                                             30%
                                                                                                                                                                                              5.7         5.6                     30%
                                          5.5        28%

                                                                               5.1                                                                                                                                       4.8 20%
                                          4.5 4.7
                                                                                                                                                                                                4.3                               10%
                                                                                                                                                                   4.3                                                   4.2
                                                                                                                                4.0
                                          3.5                                                                                                                                                                                     0%
                                                82         84   86        88   90    92        94       96        98       00         02       04        06        08         10         12         14    16        18
                                                YEAR OF SURVEY

     Figure 2                                                                                                                                                                                    Source: Kinder Houston Area Survey (1982–2019).

     Positive ratings of job opportunities in the Houston area (1982–2019)
                                         100
                                          90
                                                                               Percent rating job opportunities as “excellent” or “good.”
       PERCENT GIVING POSITIVE RATINGS

                                          80
                                                71
                                                                                                                               68                                                                             69             67 67
                                          70                                                                                                                                                                            63
                                                                                                                                                                   58                               58 60
                                          60
                                                                                                                                                                                                                   62
                                                                                                                                                                                              48
                                          50              43                    42                                                                  41
                                          40
                                          30         36                                                                                                                                  35

                                          20                                               25

                                          10
                                                                     11
                                           0
                                                82        84    86        88    90   92         94         96        98        00        02         04        06         08         10         12        14        16        18
                                                YEAR OF SURVEY

There was a slight improvement in 1984; then came                                                                                   As the economy diversified and overbuilding made
the second major blow when the falling price of oil hit                                                                             Houston’s cost of living cheaper than almost anywhere
bottom in late 1986 at less than $10 a barrel. By the                                                                               else in the country, rapid population growth resumed
time of the 1987 survey, one out of every seven jobs                                                                                in the 1990s, but now it was primarily due to the influx
that had been in Houston in 1982 had disappeared; 86                                                                                of immigrants from Asia, Latin America, Africa, and the
percent of the survey participants gave negative ratings                                                                            Caribbean. The regional economy would experience
to job opportunities, and 72 percent spontaneously cited                                                                            several more wild swings over the next decades, pretty
poverty, unemployment, and homelessness as the biggest                                                                              much tracking with the rest of America. As indicated in
problems facing people in the region.                                                                                               Figure 1, the local unemployment rates hit successive

The 2019 Kinder Houston Area Survey
THE HOUSTON ECONOMY ACROSS THE 38 YEARS                                              9

   Figure 3                                                                                                                                              Source: Kinder Houston Area Survey (1982–2019)

   What is “the biggest problem facing people in the Houston area today?” (1982–2019)
                              80                                                                                                                                      Traffic
                                                    71                       70                                                                                       Economy
                              70
                                                                                                                                                                      Crime
                              60
     PERCENT OF RESPONDENTS

                                   51
                              50                                                                                47
                                                                                                                                     44
                                                                                                                                               39
                              40                                                                                           35                                                          36
                                                                        30                                                                                              29
                              30 26                                                                                                       25                                 24
                                                                                                             27
                                                                                                                                                                        21
                              20                                                                                                                                             16 25
                                                                                                                                                                                14 15
                                                                                                                                                                        21
                              10                                                                           14                                                                15
                                   10                                                                                      10                                                          11
                               0
                                   82   84    86         88   90   92        94   96   98     00      02        04    06        08        10        12        14        16        18
                                   YEAR OF SURVEY

peaks in 1993, 2003, and during the Great Recession of                                             Houston’s business leaders have identified the kinds
2008–2010.                                                                                         of investments that these times require. Oil and gas
                                                                                                   companies will need to evolve toward the incorporation
In the years after that, the local economy continued to
                                                                                                   of new energy systems, exploiting the state’s abundance
improve steadily, until the price of Texas crude soared
                                                                                                   of wind and solar, and they will need to develop effective
to the giddy heights of $100 a barrel by 2014, before
                                                                                                   ways to capture the CO2 emissions that are generated
declining sharply, falling to below $30 by the end of 2015,
                                                                                                   by the burning of fossil fuels. The Texas Medical Center
when once again, office space in brand-new commercial
                                                                                                   will need to grow into a significant biotechnology cluster,
buildings and large, stately homes were available for rent
                                                                                                   moving beyond health care to become the third coast for
at bargain prices. The region’s unemployment rate was 4.3
                                                                                                   the life sciences, along with San Francisco and Boston.
percent in February 2015; it rose to 4.7 percent in 2016
                                                                                                   The four-mile-long innovation corridor being developed in
and to 5.6 percent in 2017, before falling once again to
                                                                                                   Midtown will need to build more high-tech incubators and
4.8 in 2018 and to 4.2 in February 2019. As indicated in
                                                                                                   attract new venture-capital investments.
Figure 2, the percentages of Harris County residents giving
positive ratings to local job opportunities have held steady                                       Houston’s remarkable ethnic diversity will continue to
in the low to mid 60s from 2015 through 2019.                                                      be a major asset in drawing immigrants from all over
                                                                                                   the world and in consolidating the city’s position in the
Oil prices have stabilized at around $60 per barrel, and
                                                                                                   global economy, with the Houston Port serving as a major
the economy is growing once again, but at a much slower
                                                                                                   gateway into the worldwide marketplace. Undergirding
pace than earlier in the decade, and more slowly than in
                                                                                                   all of these initiatives is the need to nurture a much more
other Texas cities or in the nation as a whole. The data give
                                                                                                   highly educated workforce ready to do the jobs of the
the distinct impression that the local economy has arrived
                                                                                                   knowledge economy. And in order to convince more of the
at a steady state: In the past five years, there has been no
                                                                                                   best trained minds to choose Houston as the place to live
consistent change in assessments of job opportunities.
                                                                                                   and work, continuing improvements will be needed in the
It seems clear that Houston’s economic success in the
                                                                                                   region’s overall quality of place—its resiliency in the face of
years ahead will depend to a large degree on a willingness
                                                                                                   severe storms, its air and water quality, its parks, bayous
to make significant investments in the industries and the
                                                                                                   and recreation areas, its venues for sports, arts, and
quality-of-life attributes that will build prosperity in the
                                                                                                   culture, its centers of walkable urbanism; its mobility and
twenty-first century economy.

                                                                                       Tracking Responses to the Economic and Demographic Transformations Through 38 Years of Houston Surveys
10        THE HOUSTON ECONOMY ACROSS THE 38 YEARS

                                                                                                            then, the numbers citing crime as
                                                                                                            the biggest problem in Houston
                                                                                                            decreased steadily, to 16 percent in
                                                                                                            2014 and then up slightly in the next
                                                                                                            two years before declining to just 14
                                                                                                            percent in 2018 and 15 percent in
                                                                                                            2019. When asked specifically, later
                                                                                                            in the interviews, if they were worried
                                                                                                            that they or a member of their family
                                                                                                            will become the victim of a crime, the
                                                                                                            proportion of survey participants who
                                                                                                            said they were very worried dropped
                                                                                                            from 43 percent in 1995 to 33 percent
                                                                                                            in 2008, 30 percent in 2015, and 25
                                                                                                            percent in the 2019 survey.
Donald Rogers/flickr

                                                                                                            Meanwhile, as economic concerns
                                                                                                            have lessened and population
                                                                                                            growth continues apace, traffic
                                                                                                            congestion has once again become
                       transit. Much has been accomplished along these lines,          the dominating preoccupation. The percentage of area
                       but much more will be needed in the years ahead.                residents who spontaneously named traffic as Houston’s
                                                                                       biggest problem grew from single digits in the early 1990s
                       Houston’s changing fortunes are also reflected in the
                                                                                       to 47 percent in 2004; concerns about traffic faded during
                       open-ended question that begins each survey interview,
                                                                                       the recession years between 2009 and 2012, when
                       asking the respondents: “What would you say is the
                                                                                       economic anxieties once again predominated. Starting in
                       biggest problem facing people in the Houston area today?”
                                                                                       2015, however, traffic congestion was once again cited
                       Figure 3 depicts the proportions who spontaneously
                                                                                       as the biggest problem by pluralities of 28, 29, 24, and 25
                       named traffic, the economy, or crime as Houston’s biggest
                                                                                       percent in each of the ensuing years. In the 2019 survey,
                       problem. The data provide another graphic reminder of the
                                                                                       the proportion naming traffic as the most serious problem
                       upheavals that have marked this region’s history during the
                                                                                       jumped to 36 percent. There were no meaningful changes
                       38 years of surveys.
                                                                                       in the proportions mentioning crime, at 15 percent this
                       In the booming years of the 1970s and early 1980s, when         year, or the economy, down slightly to 11 percent in 2019,
                       an average of 260 vehicles were being added every day           from 14 and 16 percent in the previous two years.
                       to Houston’s streets and freeways, traffic congestion was
                                                                                       The 11-point jump this year in spontaneous mentions
                       the dominating concern, continuing well into the recession
                                                                                       of traffic as the biggest problem facing people in the
                       years. Not until the full force of the oil-boom collapse had
                                                                                       Houston area seems clearly to have been due, at least in
                       registered in the prolonged downturn of the mid-1980s
                                                                                       part, to the drop from 15 percent in the 2018 survey to 7
                       did the survey respondents become preoccupied with
                                                                                       percent this year in the numbers who named flooding as
                       economic issues. The percentages naming the economy
                                                                                       the dominating problem. Now that Houston’s vulnerability
                       as the most serious problem in the Houston area peaked
                                                                                       to flooding is losing some of its subjective salience and
                       at 71 percent in early 1987, at precisely the lowest point in
                                                                                       immediacy, traffic has reemerged as by far the greatest
                       the recession.
                                                                                       preoccupation, the most obvious long-term challenge to
                       By the 1990s, the recovery was underway and worries             Houston’s quality of life, as growing numbers keep trying
                       about crime, fueled by the crack cocaine epidemic,              to find a way to get around in this sprawling, automobile-
                       were now predominating, mentioned spontaneously by              dependent metropolis.
                       70 percent of area residents in 1995. In the years since

                       The 2019 Kinder Houston Area Survey
Ken
                                                                                                                                                     Lun
                                                                                                                                                        d/flic
                                                                                                                                                              kr

    ink
       /flic
            kr   The Education Crisis and
                 the Growing Inequalities
telw

                 P
                        roblematic as it is, traffic congestion is clearly not the most critical factor that will determine
                        Houston’s prospects in the twenty-first century. That distinction surely belongs to the
                        challenge of preparing today’s young people for the jobs that will be generated in the
                 new knowledge-based, global economy. In a nationwide shift that began around 1980 and has
                 accelerated since then, the availability in America of well-paying blue-collar jobs, requiring only
                 modest levels of formal education and technical skills, has fallen precipitously, as a consequence of
                 outsourcing and automation, further compounded by political denial and government paralysis.

                 As reported by the Georgetown University Center on Education and the Workforce, 32 percent of
                 all the jobs that existed in America in 1973 were available to high school dropouts and another 40
                 percent required no more than a high school diploma. In sum, almost three-quarters of all American
                 jobs in the 1970s required no more than a high school degree. By 2020, in sharp contrast, 65
                 percent of all the available jobs will require some kind of post-secondary training. Yet according to a
                 recent analysis, of all the students in Houston-area schools who were enrolled in the eighth grade in
                 2006, only 22 percent had obtained any post-secondary certificate or degree by 2017, twelve years
                 later.

                 Area residents clearly recognize the practical importance of access to a quality education. In 2019
                 the survey participants were asked about this statement: “In order to get a job that pays more than
                 $35,000 a year, you need to have at least one or two years of education beyond high school.” As
                 seen in Figure 4, 67 percent overall agreed with that assertion; fewer than a third disagreed. In 2018,
                 area residents were more evenly divided on this question, at 54 to 46 percent.

                 Many Houstonians continue to believe that, if only Hispanics and African Americans valued
                 education and understood its importance the way the Anglos and Asians do, we would have no
                 problem: Everyone would get the education they need to succeed in America. So it is important

                                                     Tracking Responses to the Economic and Demographic Transformations through 38 Years of Houston Surveys
12                              THE EDUCATION CRISIS AND THE GROWING INEQUALITIES

      Figure 4                                                                                                                                  Source: Kinder Houston Area Surveys (2019)

      The need for education beyond high school to qualify for a well-paid job (2019)
                                                        “In order to get a job that pays more than $35,000 a year, you need
                                                         to have at least one or two years of education beyond high school.”
                                 80                                                        Disagree           Agree                                            76

                                 70                67                                                    68                      66
        PERCENT OF RESPONDENTS

                                 60                                        55

                                 50                                  45

                                 40                                                                                        34
                                            33                                                 32
                                 30                                                                                                                  24
                                 20

                                 10

                                  0
                                         All Respondents         US-born Anglos            US-born Blacks              US-born Hispanics   Foreign-born Hispanics

      Figure 5                                                                                                                             Source: Kinder Houston Area Surveys (1995–2018)

      The adequacy of funding for the public schools in Houston (1995–2018)
                                 60
                                                 [Have enough money]                                                                                             56
                                          54                                                        54
                                                         55                                                                      51
                                                                     49            49                                                        48
                                 50
                                                                                                    46            46
        PERCENT OF RESPONDENTS

                                                                     49                                                          49
                                                                                   42                                                        46                  42
                                                                                                                  46
                                 40       38             37

                                                 [More money will be needed]                    Which comes closer to your opinion about the
                                 30                                                             public schools in Houston: “The schools have
                                                                                                enough money, if it were used wisely, to provide
                                                                                                a quality education”; or: “In order for the schools
                                 20
                                                                                                to provide a quality education, significantly more
                                                                                                money will be needed.”
                                 10
                                         1995           1997        1999          2001          2003            2005            2007       2009                 2018
                                                 Significantly more money will be needed                  The schools have enough money, if it were used wisely

to acknowledge, as indicated in the breakdown of                                                      If Houston’s African-American and Hispanic young people
responses by ethnicity in Figure 4, that African Americans                                            are not getting the education they need to succeed in
and Hispanics, by 68 and 66 percent, respectively, are                                                today’s economy, it is demonstrably not because they
much more inclined than Anglos, at 55 percent, to affirm                                              do not value that education or recognize its importance.
the importance of post-secondary education. Hispanic                                                  It is because these two communities are the most likely
immigrants, by a margin of 76 to 24 percent, are by far the                                           to be living in areas of concentrated disadvantage, in
most likely to acknowledge the high levels of educational                                             overcrowded, underfunded inner-city schools, with all the
attainment that are required to qualify for a decent job in                                           additional out-of-class barriers that poverty imposes on a
America today.                                                                                        young person’s ability to succeed in the public schools—

The 2019 Kinder Houston Area Survey
THE EDUCATION CRISIS AND THE GROWING INEQUALITIES                                       13

   Figure 6                                                                                                                        Source: Kinder Houston Area Surveys (2017–19)

   The prevalence of economic hardship in Harris County today (2017–2019)
                               45
                                            39
                               40
                                                                                                             35
                               35                                                                                                          33
      PERCENT OF RESPONDENTS

                                                                               31
                               30
                                                              25
                               25
                               20
                               15
                               10
                                5
                                0
                                    Could not come up      No health   Household income           Had problem paying            Had problem paying
                                    with $400 in case of   insurance   less than $37,500           for housing in the              for food in the
                                     emergency (2019)        (2019)          (2019)                 past year (2018)              past year (2017)

the decaying neighborhoods, the constant threats of                                 schools have all the money they need to provide a good
hunger and homelessness, the unmet social, medical and                              education. During the ensuing ten years, from 1999
dental needs, the continuing disruptions as impoverished                            through 2009, the respondents were evenly divided in their
families keep moving in search of cheaper apartments.                               assessments of the adequacy of school funding.

Add to this a clear-eyed view of the new demographic                                We asked that same question again ten years later. In 2018
realities—the rapidly aging population of Anglos and the                            a solid majority of area residents (by 56 to 42 percent) were
disproportionate numbers of underserved minorities among                            now clear in their view that the schools will need significantly
the children of Houston. According to the latest U.S.                               more money in order to provide a quality education. The
Census, more than 70 percent of everyone in Harris County                           data underscore a potentially consequential shift among
who is under the age of 20 is African-American or Hispanic,                         area residents in their understanding of the urgent need for
and too many are graduating from high school unprepared                             larger and more sustained investments in public education
for college and unqualified for the jobs that will pay a living                     if Houston is to succeed in the new economy.
wage and enable them find a place in the new economy. If
                                                                                    The formidable inequalities in school attainment are
the educational deficits are not addressed effectively and
                                                                                    reflected, not surprisingly, in deepening disparities in
soon, the stage will be set for an exploding underclass of
                                                                                    family incomes and in measures of economic well-being
Houston citizens who will have been systematically cut off
                                                                                    more generally. Figure 6 presents five different indicators
from the chance to earn enough money to support a family
                                                                                    of poverty as measured in the surveys. The interviews
in today’s high-tech global economy.
                                                                                    in 2019 asked the representative sample of Harris
The survey participants have been asked over the years                              County residents what they would do if they suddenly
if they thought the public schools in the Houston area                              had to come up with $400 to deal with an unexpected
generally have enough money, if it were used wisely, to                             emergency. Almost four out of ten (39 percent) said they
provide a quality education; or whether they believed                               either would have to borrow the money or they would
instead that, “In order for the schools to provide a quality                        simply not be able to come up with that kind of money
education, significantly more money will be needed.” As                             right now. Just 60 percent of Harris County residents said
seen in Figure 5, during the mid-1990s, when the question                           they had enough in savings to meet a $400 emergency
was first asked, decisive majorities, by 54 and 55 percent                          expense. These Houston figures are similar to those
to 38 and 37 percent, were clear in their belief that the                           recorded in the national polls.

                                                                        Tracking Responses to the Economic and Demographic Transformations Through 38 Years of Houston Surveys
14                              THE EDUCATION CRISIS AND THE GROWING INEQUALITIES

                        Figure 7                                                                                                                     Source: Kinder Houston Area Surveys (2009–2019)

                        Support for programs to reduce the inequalities in American society (2009–2019)

                                                   70                                                                               66                      66
                                                                                                             62                                                              62
                                                                                        59
                                                   60                                                                                          62
                                                                              52                                         59                                                  53
                                                           50                                     58
                          PERCENT OF RESPONDENTS

                                                                                                                                                            47
                                                   50               45                            45                                44
                                                                                        41
                                                                                                             39
                                                   40                                                                                          43
                                                           34
                                                                    30
                                                   30
                                                                                         The government should take action to reduce income differences in America.
                                                   20                                    Government has a responsibility to help reduce the inequalities in America.
                                                                                         Welfare benefits generally give poor people a chance to get started again.
                                                   10                                    Most people who receive welfare benefits are really in need of help.

                                                    0
                                                          2009     2010      2011      2012      2013       2014       2015        2016       2017         2018            2019

                  The Texas Medical Center is the greatest conglomeration                                      The widespread prevalence of poverty and homelessness
                  of medical institutions in the world, but Houston is also                                    in this affluent metro area is becoming increasingly difficult
                  among the major American cities that have the highest                                        to ignore. In alternating years between 2009 and 2019,
                  percentage of children without health insurance. Fully one-                                  as indicated in Figure 7, the surveys have replicated
                  fourth of all the participants in the 2019 survey said they                                  four questions that ask about the role of government in
                  and their families did not have health insurance. Almost                                     expanding economic opportunities and in reducing the
                  one-third reported total household incomes of less than                                      impact of concentrated disadvantage.
                  $37,500. In the 2018 survey, 35 percent said they had
                                                                                                               The proportions who agree that the government should
                  difficulty paying for housing, and 33 percent in 2017 said
                                                                                                               take action to reduce income differences between rich
                  they had a serious problem buying the groceries they
                                                                                                               and poor in America grew from 45 percent in 2010
                  needed to feed their families during the past year.
                                                                                                               to 62 percent in 2014 and to 66 percent in 2018.
                                                                                                               The percentages who assert that government has a
                                                                                                               responsibility to help reduce the inequalities grew from
                                                                                                               50 percent in 2009 to 62 percent in this year’s survey.

                                                                                                               The respondents were also asked if they believed that
                                                                                                               most people who receive welfare benefits are really in
                                                                                                               need of help, or are taking advantage of the system. The
                                                                                                               percentages who thought that welfare recipients really
                                                                                                               need the help grew from 30 percent in 2010 to 47 percent
                                                                                                               in 2018. And 53 percent of the survey respondents in
                                                                                                               2019, up from 34 percent in 2009, claimed that welfare
                                                                                                               benefits generally give poor people a chance to get started
                                                                                                               again; only 44 percent in 2019 asserted instead that
                                                                                                               such handouts encourage poor people to stay poor and
                                                                                                               dependent.
Joe Wolf/flickr

                  The 2019 Kinder Houston Area Survey
r
           ick
       k/fl
     uc
  yL
Ro

                  Feeling More at                                                                                                       2C2
                                                                                                                                           KPh
                                                                                                                                              oto
                                                                                                                                                 grap
                                                                                                                                                     hy/fl
                                                                                                                                                          ickr

                  Home with Houston’s
                  Burgeoning Diversity

                  T
                         hroughout its history, Houston was essentially a bi-racial Southern city dominated and
                         controlled by white men. In 1960, Harris County was 70 percent Anglo and 20 percent African
                         American. In the space of the last thirty years, it has been transformed into one of the most
                  ethnically and culturally diverse metro areas in the country. By 2016, the census estimates indicate
                  that Anglos now comprised 31 percent of the county’s total population; Hispanics were 42 percent,
                  blacks were 19 percent, Asians and others were 8 percent.

                  All of the region’s ethnic groups are now minorities, all of them called upon to build something
                  that has never existed before in human history—a truly successful, inclusive, equitable, and united
                  multiethnic society that will be Houston, and Texas, and America as the twenty-first century unfolds.
                  The surveys suggest that area residents are adapting pretty well in the process of navigating this
                  remarkable transition.

                  One of the most consistent and consequential trends the surveys have recorded is the continuing
                  improvements in support for immigration and the increasingly positive attitudes toward Houston’s
                  diversity. The proportion of U.S.-born Anglos in Harris County, for example, who said they were
                  in favor of granting illegal immigrants a path to legal citizenship if they speak English and have
                  no criminal record has continued to grow, from 56 percent in 2010 and 60 percent in 2012 to 65
                  percent in 2016 and to 71 percent in this year’s survey.

                  Figure 8 shows the changes on three additional questions, which we have been asking since the
                  1990s. The proportion of U.S.-born Anglo respondents who believed that immigrants generally
                  contribute more to the American economy than they take grew from 30 percent in 1994 to 48
                  percent in 2018. The numbers asserting that the increasing immigration into this country today mostly

                                                    Tracking Responses to the Economic and Demographic Transformations through 38 Years of Houston Surveys
16                              FEELING MORE AT HOME WITH HOUSTON’S BURGEONING DIVERSITY

      Figure 8                                                                                                                                         Source: Kinder Houston Area Surveys (1994–2019)

      Attitudes toward immigrants among U.S.-born Anglos in Houston (1994–2019)
                                 80
                                                                               68                                            69                   68                         70
                                  70
                                                           59
                                 60                                                                   56
        PERCENT OF RESPONDENTS

                                                                                                                                                                      54
                                                                         52                     50                                          50 50                                   49
                                 50                                                  47                           46
                                                           44                                                          44
                                                                                           42
                                                                                                                                                                             48
                                 40                                 36                                     42
                                                      33
                                       30                                                                                    37
                                 30
                                                                                                                          29
                                 20                   Immigrants to the U.S. generally contribute more to the American economy than they take.
                                                      The increasing immigration into this country today mostly strengthens American culture.
                                  10
                                                      Houston’s increasing ethnic diversity will become a source of great strength for the region.
                                  0
                                       94 95 96 97 98 99 00 01 02 03 04 05 06 07 08 09 10                                         11     12 13 14 15 16               17     18 19
                                       YEAR OF SURVEY

      Figure 9                                                                                                                                         Source: Kinder Houston Area Surveys (1995–2019)

      Support for admitting more or the same number of legal immigrants in the next ten years,
      in three U.S.-born ethnic communities (1995–2019)
                                 100
                                                                                                                                                       86           87            88
                                 90
                                                                    82                    82
                                                                                                     77      77                             79                                    78
                                 80                                            73                                                                                   73
                                                           71                                                                                          72
        PERCENT OF RESPONDENTS

                                                 66                                                                               67        68
                                  70
                                                                                                     62                                                72                         74
                                                                    59                                                  60        59                                71
                                 60              57                                                          55
                                         52                53                             53
                                                                                                     50                                                           U.S.-born Anglos
                                 50                                            46                            46         46        47
                                                                    53                    42                                                                      U.S.-born Blacks
                                 40      33                44                                                                                                     U.S.-born Hispanics
                                 30                                            33
                                         31
                                 20                                                  “During the next ten years, would you like to see the U.S.
                                               Percent saying, “more”                 admit more, fewer, or about the same number of legal
                                  10           or “the same number.”                  immigrants as were admitted in the last ten years?”
                                  0
                                        1995    1997       1999   2001        2002    2003       2005       2007       2009       2011     2013        2015       2017         2019

strengthens, rather than threatens, American culture grew                                                  communities also growing more comfortable with diversity
from 33 percent in 1997 to 49 percent in this year’s survey.                                               and immigration over the years? In alternating surveys
And the percentage of U.S.-born Anglos who thought                                                         since 1995, we have asked the respondents whether
that Houston’s diversity will eventually become a source of                                                they think the United States should admit more, fewer, or
great strength for the city, rather than a growing problem,                                                about the same number of legal immigrants in the next ten
increased from 59 percent in 1998 to 70 percent in 2018.                                                   years as were admitted in the past ten years. In all three of
                                                                                                           Houston’s major ethnic communities, as Figure 9 indicates,
Have comparable changes been occurring among
                                                                                                           the trends are similar and compelling.
U.S.-born blacks and Hispanics? Are the two minority

The 2019 Kinder Houston Area Survey
FEELING MORE AT HOME WITH HOUSTON’S BURGEONING DIVERSITY                                                17

The percent of U.S.-born Anglos who were calling on                 truly American? Are they remaining in their co-ethnic
the country to admit more or the same number of legal               enclaves, keeping with their foreign ways, and refusing to
immigrants in the next ten years grew from 33 percent in            assimilate? All those early fears are rapidly fading in this
1995, to 59 percent in 2001, to 62 percent in 2005, to              new world of thriving interethnic friendships and increasing
68 percent in 2013, and to 78 percent in 2019. In very              rates of intermarriage.
similar fashion, the percentage of U.S.-born blacks calling
                                                                    In alternating years since 2002, we have asked the survey
for the same number or more immigrants to be admitted
                                                                    respondents if they had close personal friends from each
increased from 31 percent in 1995 to 74 percent today.
                                                                    of the other three major ethnic groups in Houston. The
Among U.S.-born Hispanics, the numbers grew from 52
                                                                    numbers increased in every community with regard to
percent to 88 percent.
                                                                    every ethnicity. The proportion of Anglos who said they
The respondents from all three U.S.-born communities                had a close friend who was African-American grew from
are increasingly rejecting the call for further restrictions        69 percent in 2002 to 80 percent in 2019. The numbers of
on the number of new immigrants coming to America.                  blacks who had a close friend who was Asian expanded
Undocumented immigration has slowed in recent years,                from 32 to 54 percent. The percentage of Hispanics with
so the fear of an invasion of dangerous foreigners has              an Anglo friend grew from 49 to 65 percent. The numbers
faded. The immigration concerns today have much more                of Asians with a close personal friend who was Hispanic
to do with addressing the desperate needs of the large              increased from 53 to 83 percent.
numbers of refugees seeking asylum, rather than with
                                                                    In an earlier report, we asked whether the increase among
undocumented immigrants thought to be pouring into this
                                                                    U.S.-born Anglos in their support for immigration and in
country, threatening American jobs and public safety.
                                                                    their comfort with diversity was because they have been
The continuing growth in the numbers of Asians and                  changing their minds about the impact of immigration (i.e.,
Hispanics in America today is no longer due primarily               intracohort change). Or were the more positive attitudes
to the influx of new immigrants; it is mainly attributable          due instead to the coming of age of younger Anglos who
instead to the coming of age of the 100-percent American            are entering adulthood with more positive attitudes toward
young people who are the U.S.-born children of the                  immigration and diversity than those of their elders (cohort
immigrants who came here 25 and 30 years ago. Will the              succession)? The second hypothesis was the one most
new immigrants ever learn English? Will they ever become            clearly supported by the data: The major force responsible

   Figure 10                                                                                       Source: Kinder Houston Area Surveys (2007, 2011, 2014, 2016, 2018)

   Interethnic romantic relationships by age among Anglos and Blacks (2007–2018, combined)
               “Have you ever been in a romantic relationship with someone who was not Anglo/Black?”

   58+42 61+39 52+48 42+58 29+71 18+82
         58%                 61%                 52%                        42%                            29%                                 18%

   67+33 55+45 53+47 35+65 26+74 18+82
         67%

        18–29
                             55%

                             30–39
                                                 53%

                                                 40–49
                                                                            35%

                                                                            50–59
                                                                                                           26%

                                                                                                          60–69
                                                                                                                                               18%

                                                                                                                                                 70+

                                                         Tracking Responses to the Economic and Demographic Transformations Through 38 Years of Houston Surveys
18        FEELING MORE AT HOME WITH HOUSTON’S BURGEONING DIVERSITY

for the more welcoming attitudes among Anglos was the                 this city and nation as they undergo the transition into a
ongoing replacement of one generation by the next.                    multiethnic world.

Each successive cohort of Anglos and African Americans                Among Hispanics and Asians, meanwhile, the most
is bringing more positive interethnic attitudes into the              important determinant of interethnic friendships, not
public arena. Today’s older respondents grew up in the                surprisingly, is whether they are the U.S.-born children
America of the 1960s and 1970s; that was a profoundly                 of earlier waves of immigrants, or whether they are first-
different era from the 1990s and 2000s, when the younger              generation immigrants themselves, more likely to be
generations were coming of age. Biography intersects                  ensconced in their co-ethnic enclaves and less likely to be
with history to shape the way people experience the                   fluent in English. Figure 11 shows that relationship among
world: Among Anglos and African Americans, one of the                 Hispanics in Houston.
most powerful predictors of comfort with diversity and
                                                                      Fully 80 percent of the U.S.-born Hispanics, compared to
of interethnic friendships is simply their age or year of
                                                                      62 percent of the first-generation immigrants, report having
birth. Older respondents are less likely than their younger
                                                                      a close personal friend who is Anglo. The generational
counterparts to report having close personal friends
                                                                      differences in friendship networks are even greater with
from the other ethnic communities. Figure 10 depicts
                                                                      regard to relationships between Hispanics and blacks:
the differences by age among Anglos and blacks in the
                                                                      79 percent of the American-born Hispanics, but just
proportions who report having been in an interethnic
                                                                      49 percent of the first-generation Hispanic immigrants,
romantic relationship.
                                                                      said they had a close personal friend who was African-
The Anglo and African-American respondents were asked                 American. When asked if they had ever been in a romantic
on five different occasions in the past twelve years if they          relationship with someone who was not Hispanic, 57
had ever been in a romantic relationship with someone                 percent of the U.S.-born respondents said they had,
who was not of their ethnicity. As indicated in the Figure,           compared with 22 percent of the immigrants.
some 60 percent of those in their 20s and 30s answered in
                                                                      Figure 12 depicts a very similar pattern among the two
the affirmative. The numbers declined to about 40 percent
                                                                      groups of Asians. The Asian immigrants are far less likely
among the respondents aged 50 to 59, then dropped to
                                                                      than the U.S.-born to have close personal friends from the
29 and 26 percent for those aged 60 to 69, and to just 18
                                                                      other ethnic communities; but note that they are more likely
percent for ages 70 and older. The successive generations
                                                                      to have such friends than are the Latino immigrants, fewer
have come of age under distinctly different circumstances.
                                                                      of whom are middle-class professionals or fluent English
Younger Americans of all ethnicities across most of the               speakers. Thus 71 percent of Asian immigrants, compared
country have been growing up in a world where ethnic                  to 62 percent of their Hispanic counterparts, said they
diversity is part of their lived experience and close intergroup      have a close personal friend who is Anglo; and 61 percent
relationships are increasingly common. The world of the               of the Asians, in contrast to 49 percent of the Hispanics,
2000s and 2010s, when the younger generations were                    have a close personal friend who is African American.
coming of age, is a place of thriving interethnic friendships         The figures were more comparable when asking about
and increasing rates of intermarriage. This is a decidedly            romantic relationships: 50 percent of U.S.-born Asians and
different era compared to the more rigidly segregated world           57 percent of U.S.-born Hispanics said they had indeed
of the 1960s and 1970s, when today’s older Americans                  been in a relationship of that sort, compared to 32 and 22
were moving into adulthood.                                           percent of the first-generation immigrants.

There is a well-known law of human nature that states in              Consistent with these findings, the surveys indicate that 28
essence: “What I am familiar with feels right and natural.            percent of all married U.S.-born Hispanics in Harris County
What I’m unfamiliar with feels unnatural and somehow                  are married to non-Hispanics. The U.S. Census reports
not quite right.” The more recent generations of area                 that Asian Americans are the most likely of all the major
residents are taking for granted what earlier generations             racial or ethnic communities in America to live in mixed
still find difficult to accept. The ongoing replacement of            neighborhoods and to marry across racial lines: Of all the
the generations will surely help to smooth the evolution of           Asian newlyweds between 2015 and 2017, for example,

The 2019 Kinder Houston Area Survey
FEELING MORE AT HOME WITH HOUSTON’S BURGEONING DIVERSITY                                            19

   Figure 11                                                                                                                        Source: Kinder Houston Area Surveys (2007–2018)

   Interethnic friendships among U.S.-born and foreign-born Hispanics (2007–2018)
                              100
                              90                                                           U.S.-Born Hispanics                 Hispanic Immigrants
                                        80                    79
                              80
     PERCENT OF RESPONDENTS

                               70
                                                62
                              60                                                                                                        57
                                                                      49                          48
                              50
                              40
                              30                                                                            26
                                                                                                                                                   22
                              20
                               10
                               0
                                    Have a close friend   Have a close friend                Have a close friend                    Have been in a
                                      who is Anglo          who is Black                       who is Asian                      romantic relationship
                                                                                                                                  with a non-Hispanic

   Figure 12                                                                                                                        Source: Kinder Houston Area Surveys (2007–2018)

   Interethnic friendships among U.S.-born and foreign-born Asians (2007–2018)
                              100
                              90                                                           U.S.-Born Asians                Asian Immigrants
                                        81
                                                                                                  78
                              80                              73
                                                71
     PERCENT OF RESPONDENTS

                               70                                                                          63
                                                                      61
                              60
                                                                                                                                        50
                              50
                              40
                                                                                                                                                   32
                              30
                              20
                               10
                               0
                                    Have a close friend   Have a close friend               Have a close friend                     Have been in a
                                      who is Anglo          who is Black                     who is Hispanic                     romantic relationship
                                                                                                                                   with a non-Asian

almost three out of ten (29 percent) had married someone                              suggested, is not so much an ethnic divide, as a class
who was not Asian. Black intermarriage rates have more                                divide, although the two (of course) are closely interrelated.
than tripled in the past forty years, growing from 5 percent                          Today’s global, high-tech, knowledge-based economy
in 1980 to 18 percent today.                                                          is generating a growing middle class and a growing
                                                                                      underclass in all four of America’s ethnic communities,
This nation is moving inexorably into what sociologists
                                                                                      predicated above all else on access to quality education.
have been calling a “trans-racial” world, where ethnicity is
becoming more fluid and inherently less relevant. The real
danger for the future of Houston and America, many have

                                                                           Tracking Responses to the Economic and Demographic Transformations Through 38 Years of Houston Surveys
kr
        flic
    olf/
  eW
Jo

                                                                                                                                      J. D
                                                                                                                                          anie
                                                                                                                                              l Es
                                                                                                                                                  care
                                                                                                                                                      ño/
                                                                                                                                                         flick
                                                                                                                                                              r

                 After Harvey

                 A
                            re the effects of Hurricane Harvey fading from public consciousness or has a new and
                            lasting determination to strengthen government controls taken hold in an effort to mitigate
                            the effects of future flooding? The 2019 survey replicated several questions from 2018 to
                 measure the stability of the concerns that area residents were expressing when asked about these
                 issues so soon after the storm made landfall in August 2017. As shown in Figure 13 and as noted
                 earlier, flooding issues were less salient in 2019 than the year before, when the respondents were
                 asked to name the biggest problem in the Houston area today.

                     Figure 13                                                                           Source: Kinder Houston Area Survey (2017–19)

                   20+15+
                      24+15161AW 15+
                                 26+1514AW 35+1511717AW
                     The biggest problem in Houston: The rise and fall of spontaneous concerns
                     about flooding

                                                                    15%           15%                       17%                15%
                             24%                20%

                                                                                                      7%
                         13%                                  15%
                         1%          2017                             2018                                        2019
                                                                                        25%           11%
                                                       24%                              34%                                            36%
                           16%
                            14%                                 14%
                                      15%                                                                    15%
                                                                            15%

                                                 Don’t know         Crime                     Flooding
                                                 Traffic            Economy                   Other

                 The 2019 Kinder Houston Area Survey
AFTER HARVEY                      21

   Figure 14                                                                                                                                 Source: Kinder Houston Area Surveys (2018–2019)

   The likelihood of future storms and support for flood-mitigation controls (2018–2019)
                               100
                               90                                                                                                                                     2018
                               80                  76    75
                                                                                         71
      PERCENT OF RESPONDENTS

                                                                                                                                                                      2019
                                70
                               60                                                                56                                         55
                                                                                                                                                    50
                               50
                               40
                               30
                               20
                                10
                                0
                                     It is almost certain that the Houston   % favor prohibiting any additional             % favor increasing local taxes to
                                      region will experience more severe     construction in areas of Houston              enable government agencies to buy
                                        storms during the next 10 years       that have repeatedly flooded.                 out more of the homes that have
                                         compared to the past 10 years.                                                            repeatedly flooded

Only one percent of the respondents in February 2017,                                          of the respondents in this year’s survey. Similarly though
before Harvey, thought of flooding and storms when                                             less dramatically, 50 percent today, compared to 55
asked to name the most salient issue in the Houston                                            percent in 2018, said they were in favor of increasing local
region. Shortly after that great rainfall event, 15 percent                                    taxes to enable government agencies to buy out more of
spontaneously named the floods as the biggest problem.                                         the homes that have repeatedly flooded. The instinctive
Attention to storms and resiliency faded to just 7 percent                                     resistance to an increase in government controls over the
in 2017, and mentions of traffic jumped from 25 to 36                                          initiatives of the private sector is still firmly embedded, it
percent. Has the declining salience of flooding issues                                         would seem, in Houston’s basic DNA.
affected area residents’ continued
willingness to support major
interventions intended to reduce the
region’s vulnerability to future storms?
Figure 14 suggests that it has in some
respects but not in others.

There has been no change at all from
last year to this in the clear majorities,
at 76 and 75 percent who agree, “It is
almost certain that the Houston region
will experience more severe storms
during the next ten years compared to
the past ten years.” However, support
for more stringent government
regulations has declined. In 2018, 71
percent were in favor of prohibiting
any additional construction in areas of
                                                                                                                                                                                                    G Witteveen/flickr

Houston that have repeatedly flooded;
that was the case for just 56 percent

                                                                                    Tracking Responses to the Economic and Demographic Transformations Through 38 Years of Houston Surveys
22                                 AFTER HARVEY

                            Figure 15                                                                                                         Source: Kinder Houston Area Surveys (2010–2019)

                            Concerns about climate change and calls for better land-use planning (2010–2019)
                                                                       The threat of climate change                       “We need better land-use planning to
                                                                       is a “very serious problem.”                        guide development in the Houston area.”
                                                   80                                                                80                                                 75
                                                                                                                            68                        70
                                                   70                                                                70                64
                          PERCENT OF RESPONDENTS

                                                   60                                                                60
                                                                                                      52   53
                                                   50                                     46                         50
                                                                        42       40
                                                             39
                                                   40                                                                40

                                                   30                                                                30

                                                   20                                                                20

                                                   10                                                                10

                                                    0                                                                 0
                                                            2010       2012     2014     2016     2018     2019             2014       2017          2018             2019

                    Two other questions, depicted in Figure 15, make it clear                                as the memory of the storm has receded, the perceived
                    that continuing changes are taking place in the survey                                   seriousness of climate change is unchanged, at 53
                    participants’ broader perspectives. In 2010, only 39                                     percent, in the 2019 survey.
                    percent thought that the threat of climate change was a
                                                                                                             The respondents in 2019 were also asked if they
                    very serious problem. That concern grew to 46 percent
                                                                                                             believed that “we need better land-use planning to guide
                    in 2016, and then jumped to 52 percent in 2018, soon
                                                                                                             development in the Houston area,” or if they agreed
                    after Harvey. Instead of any lessening of concern today
                                                                                                                                 instead that “people and businesses
                                                                                                                                 should be free to build wherever they
                                                                                                                                 want.” The proportion calling for more
                                                                                                                                 effective land-use planning grew from
                                                                                                                                 64 percent in 2017 to 70 percent in
                                                                                                                                 2018, and then increased further to
                                                                                                                                 75 percent in 2019.

                                                                                                                                   The surveys underline the profound
                                                                                                                                   ambivalence that so many feel about
                                                                                                                                   how to respond to the growing
                                                                                                                                   dangers of flooding: Area residents
                                                                                                                                   continue to resist any additional
                                                                                                                                   government interference in developer
                                                                                                                                   decisions, even as they also clearly
                                                                                                                                   recognize the region’s deepening
                                                                                                                                   vulnerability to severe storms and the
                                                                                                                                   need for new forms of public action.
Adam Baker/flickr

                    The 2019 Kinder Houston Area Survey
Continuity and Change
               kr
          /flic
       an
   Uthm
Ed

                    in Political Orientations

                    H
                             arris County residents are gradually becoming both more secular (see the rise of the
                             “Nones” in last year’s report) and more aligned with the Democratic Party. Beginning in
                             1984, the survey participants were asked if they would call themselves a Republican, a
                    Democrat, an Independent, or something else. Those who did not indicate an affiliation were asked
                    if they thought of themselves as closer to the Republican or Democratic Party. Figure 16 shows the
                    percentages of area residents over the years who chose Republican or Democrat in answer to either
                    of these two questions.

                    Through most of the early years of the survey, at least until 2005, area residents were evenly divided
                    between the two political parties. In that year, 37 percent of the survey participants said they were
                    affiliated with or leaning toward the Republican Party and 35 percent said they leaned toward
                    the Democrats. In the surveys since then, however, the proportion of Democrats has increased
                    decisively, reaching 52 percent in 2016, 44 percent in 2018, and 48 percent in this year’s survey.
                    Meanwhile, the numbers of Republicans have hardly changed at all, at around 29 to 33 percent
                    across all the years. The partisan gap looked as if it might be closing in 2018, but it expanded again
                    to reach a differential of almost 20 points in 2019.

                    Figure 17 shows the partisan divides on the question of whether the country is headed for better
                    times or more difficult times. In February 2017, soon after Donald Trump’s election, the survey
                    revealed a striking, if unsurprising, reversal in perspectives on the American future as expressed by
                    Republicans and Democrats.

                    The 2018 survey found an even stronger separation, with 71 percent of Republicans asserting that
                    the country was headed for better times and 76 percent of Democrats convinced instead that more
                    difficult times now lay ahead. That was the largest gap ever seen on this question, so it was not
                    surprising to find the divide moderating in this year’s survey, as the Democrats became somewhat

                                                       Tracking Responses to the Economic and Demographic Transformations through 38 Years of Houston Surveys
You can also read