Smart Energy Bay Area - pacific EnvironmEnt
←
→
Page content transcription
If your browser does not render page correctly, please read the page content below
pacific Environment

        Bay Area
     Smart Energy
                      2020
                                         By Bill Powers, P.E.
                                         Powers Engineering
                             Executive
                             Summary     March, 2012
Download the entire report at
                 www.PacificEnvironment.org/BASE2020
                                     FUNDED BY CONTRIBUTIONS FROM

                                                            Peter Camejo Fund for Environmental Justice

                                                          Communications Workers of America, AFL-CIO

          Bay Area Smart Energy 2020                      Technical editor: Katheryn Rhodes, P.E.
                                 Executive Summary
                                                          Technical review: Jaleh Firooz, P.E.
                                   By Bill Powers, P.E.
                                  Powers Engineering,     Technical contributions:
                                  San Diego, California
                                          March, 2012     Christopher S. Hein, Ph.D.

                                      Executive editor:   Luis Reyes

                                             Rory Cox
      Dedicated to the memory of Charles McGlashan

We would like to thank the following for the donations
that made this possible: Jessica Aiona, Deborah
Behles, Krista Brown, Allan Dahlquist, Linda Dardarian
and Terry Carroll, Barbara Hanscome and Matthew
Mumper, Ed Mainland, Shani Kleinhaus, John
Schulteis/Renewable Operations, Kirsten Schwind,
Toni Smith, Elizabeth Stampe, and Al Weinrub.
Pacific Environment

Forward
The window of opportunity to build             the energy future of California is wide open.
In 2011, Governor Jerry Brown called for a 33 percent renewable portfolio standard by 2020,
AND for over half of that generation to come from locally generated, “distributed” power
sources. As this is an unprecedented goal in the US, the Governor is seeking advice. And that is
why Bay Area Smart Energy 2020 is needed now.

Bay Area Smart Energy 2020 is a roadmap to rapid,       Oakland-based Ella Baker Center and local lead-
cost-effective conversion to clean energy that relies   ers like Van Jones. Progressive labor leaders have
on local resources. Our region is the right place       strongly supported California’s landmark climate
to build the grid of the future. The San Francisco      change laws, understanding that clean energy is the
Bay Area is one of the world’s leading centers of       growth industry of the 21st century.
clean energy innovation and environmental aware-
ness. The region has a long tradition of environ-       Despite these promising Bay Area conditions,
mental leadership dating back to John Muir, and         however, less than 20 percent of our region’s elec-
the Bay Area is host to technology leaders, pro-        tric power today comes from truly clean sources.
gressive venture capitalists, effective government,     Amazingly, clean energy is too often under attack,
environmentally-oriented labor leadership, and          with many politicians across the US working to
hundreds of leading environmental and social jus-       undermine clean energy incentive programs, while
tice organizations.                                     offering no solutions to solve climate change or put
                                                        people back to work.
Silicon Valley is a lightning rod for clean energy
innovation, hosting countless companies that are        If we build it, we will win. As this report dem-
developing cutting edge technologies in solar,          onstrates so well, the tools and technology already
wind, and energy efficiency, along with the soft-       exist and are becoming more efficient, sophisti-
ware and integration technology to make it all          cated and cost-effective. By developing local, clean
work. Many of these successful and promising            energy projects and production, we will put people
companies were jumpstarted with billions of dollars     to work, reinvigorate our regional economy, and
from local venture capitalists.                         build a truly healthy and sustainable energy future.

Regional academic institutions like UC Berkeley,        Let’s get going!
Lawrence Berkeley National Lab and Stanford are
leading the way in clean energy research, while our
elected leaders regularly support laws and programs
to incentivize a cleaner, greener environment. The      Francesca Vietor
concept of “green collar jobs” has caught fire in the   Environment Program Officer, San Francisco Foundation and
Bay Area, thanks to the vision of groups like the       Commissioner, San Francisco Public Utilities Commission

                                                                                                                       1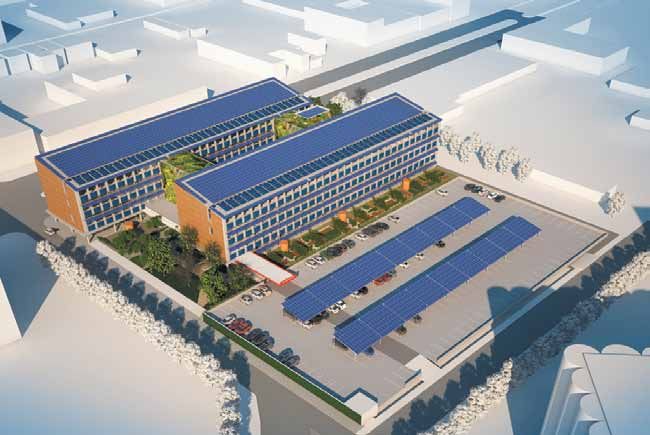
Bay area smart energy 2020

     1. Executive Summary
     Bay Area Smart Energy 2020         (BASE 2020) is a       The peak demand met by Bay Area utilities will
     distributed generation strategy for minimizing green-     decline by more than 50 percent, from approximately
     house gas (GHG) emissions from electricity usage          14,000 megawatts (MW) today to 6,500 MW in
     in the nine counties surrounding San Francisco            2020, as energy efficiency, state-of-the-art air condi-
     Bay. BASE 2020 prioritizes energy efficiency, roof-       tioning and commercial building chiller systems, local
     top and distributed solar photovoltaics (PV) of all       PV, combined heat and power, and battery storage
     types, and local combined heat and power plants to        displace grid power. This will substantially reduce air
     meet the Bay Area’s electricity needs. BASE 2020          pollution in Bay Area communities adjacent to large
     is to a large degree the application of California’s      existing natural gas-fired peaker plants that will oper-
     strategic energy vision, embodied in the California       ate much less frequently on hot summer days.
     Energy Action Plan and the California Energy Efficiency
     Strategic Plan, to the Bay Area.
                                                               BASE 2020 at a Glance
     A framework objective of BASE 2020 is to con-              •• Solar PV: Nearly 4,000 MW of local PV will
     vert existing homes and businesses to zero net                be installed in the Bay Area by 2020 to achieve
     energy buildings. This is a core strategy of the              zero net energy targets. The inflow of this local
     Energy Efficiency Strategic Plan, which was co-               PV on hot summer days will reduce natural
     authored by Pacific Gas & Electric (PG&E), the                gas-fired peaker plant air pollution, relieve grid
     Bay Area’s investor-owned (private) utility. The              congestion, and reduce wear-and-tear on grid
     concept of “zero net energy” is to develop or                 equipment in the Bay Area.
     retrofit buildings so they produce at least as much
     electricity on site as they use. A combination of          •• Energy Efficiency: Efficiency measures will
     energy efficiency measures and rooftop PV are                 reduce Bay Area electricity demand from
     used to achieve zero net energy. Following a                  approximately 58,000 gigawatt-hours per year
     similar timeline to that established in the Energy            to about 42,000 gigawatt-hours per year. This
     Efficiency Strategic Plan, BASE 2020 envisions the            represents an average energy efficiency reduc-
     conversion of 25 percent of existing Bay Area                 tion, compared to a 2008 baseline, of 25 to 30
     homes and commercial buildings to zero net ener-              percent in Bay Area residential, commercial, and
     gy buildings by 2020. All new homes and busi-                 industrial buildings, and agricultural operations.
     nesses will be built as zero net energy structures         •• Air Conditioning: Electricity consumption
     from 2015 onward.                                             by air conditioning units, the primary cause of
     BASE 2020 will achieve a Bay Area GHG reduc-                  high summertime peak loads, will be reduced
     tion from electricity usage of more than 60 per-              50 percent by 2020 – consistent with the Energy
     cent, compared to a 2008 baseline year, relying on            Efficiency Strategic Plan – by methodical phase-in
     proven off-the-shelf technologies and policies. At            of high efficiency replacement units and on/off
     the same time, BASE 2020 will lower utility costs             cycling of most units on hot days.
     for Bay Area businesses and residents over a “busi-        •• Combined Heat and Power: 840 megawatts
     ness as usual” case, in large part due to: 1) emphasis        of new combined heat and power will also be
     on cost-effective energy efficiency measures and 2)           added in the Bay Area, using a fuel mix consist-
     the ongoing, spectacular drop in PV system prices.            ing of at least 50 percent biomethane or biogas.

2
Pacific Environment

•• Geothermal: Up to 300 megawatts of addi-            1.1 – The Policy Context
   tional geothermal capacity will be added at the     For BASE 2020 to drive the Bay Area to a robust
   The Geysers in Sonoma County through cooling        clean energy economy based on zero net energy
   system upgrades to existing geothermal units.       buildings, utility actions must be brought into
•• Wind: 300 megawatts of planned and under            alignment with the state’s Energy Efficiency Strategic
   construction wind additions in Solano County        Plan. One example is PG&E’s ability to purchase
   are incorporated into BASE 2020.                    renewable energy credits from rooftop PV system
                                                       operators to help the company meet its 2020 RPS
•• Energy Storage: 400 megawatts of battery            target of 33 percent. This provides a mechanism
   storage will be integrated with the Solano          to enhance the economics of rooftop PV while
   County wind production area to convert Solano       reducing overall RPS costs to ratepayers.
   County wind power into a round-the-clock
   baseload resource. 200 megawatts of distrib-        California’s Energy Action Plan prioritizes energy
   uted battery storage, which can be expanded         efficiency over all other methods for addressing
   over time, will be integrated with residential      electricity demand. State policy views rooftop PV
   and commercial PV systems to serve as peaking       as integral to achieving the energy efficiency ideal
   capacity and to provide the structure for com-      – zero net energy buildings. California’s Energy
   munity-scale microgrids.                            Efficiency Strategic Plan and BASE 2020 rely on
                                                       local distributed PV to achieve zero net energy
•• Financing and Policy Tools: The primary             buildings.
   vehicles to achieve the reduction in GHG emis-
   sions will be 1) Property Assessed Clean Energy     Yet state policy has not yet directly addressed the
   (PACE); 2) clean energy payments – also known       fundamental conflict between a state strategy that
   as feed-in tariffs – to incentivize maximum         is built around zero net energy buildings, which
   local PV development; and 3) the expansion of       will substantially reduce demand for utility-supplied
   Community Choice Aggregation. PACE is a             electricity, and the traditional investor-owned
   financing mechanism pioneered in Berkeley and       utility revenue model that is dependent on ever-
   refined in Sonoma County that allows home           expanding demand for utility-supplied electricity.
   and business owners to invest in energy efficien-   Investor-owned utilities increase revenue by build-
   cy and rooftop PV with no up-front expense.         ing more transmission lines, distribution substations,
   Repayment is realized as an assessment added to     power plants, and meters, and passing along the
   property taxes. Carefully calibrated clean energy   cost of this infrastructure to ratepayers at a guaran-
   payments in Germany have led to very high PV        teed rate-of-return. This model must change.
   installation rates, approximately 7,000 megawatts
   per year, with average PV system installed costs
   that are much lower than those in California.
   Community Choice Aggregation allows local
   communities to form a public energy author-
   ity separate from PG&E to select the sources
   of electricity supply and the quantity of green
   power provided to customers. Community
   Choice Aggregation was successfully launched
   in Marin County in 2010, is in the process of
   being launched in San Francisco, and is under
   consideration in Sonoma County.                     One of the geothermal power plants at The Geysers.

                                                                                                                              3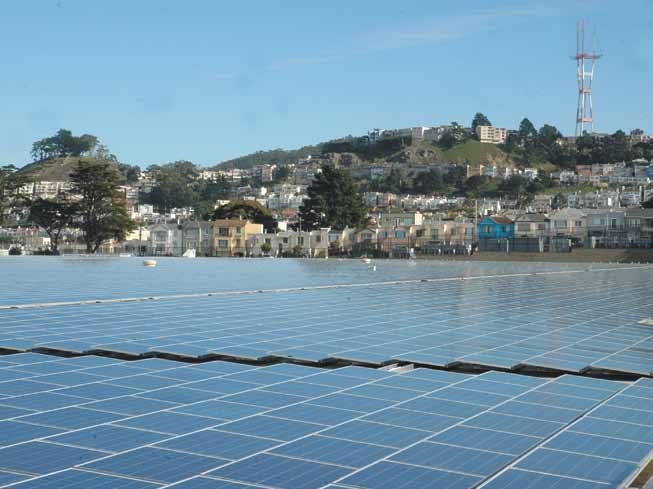
Bay area smart energy 2020

     1.2 BASE 2020 Sources of Energy
     1.2.1 Solar PV                                              action in 2010. These renewable energy credit pay-
     The Bay Area will displace nearly 8,000 gigawatt-           ments, currently capped at $50 per megawatt-hour
     hours per year of electricity purchases through the         through 2013, have the potential to shift the renew-
     installation of nearly 4,000 megawatts of rooftop           able energy playing field in favor of rooftop PV.
     PV. The addition of this amount of PV represents            Net metering does not shift costs to customers with-
     the quantity necessary for 25 percent of existing           out rooftop PV when all relevant costs and benefits
     Bay Area residential and commercial buildings to            of net-metered PV systems are evaluated together.
     achieve zero net energy by 2020.1                           Net metering does accelerate California’s shift to
     Solar electricity generated on the distribution grid        green energy. However, the current cap on net-
     at or near the point-of-use has an “avoided cost”           metered PV capacity, five percent of peak utility
     (meaning the cost that would be borne by the util-          demand, will become an obstacle in the near-term
     ity to produce and deliver the same electricity from        to zero net energy building retrofits if this cap is not
     new conventional sources) of over $0.22 per kilo-           revised upward or removed entirely.
     watt-hour without including the renewable energy            Rooftop PV is cost-effective. Commercial roof-
     value of the solar electricity. As a result, an equitable   top PV systems are being built in California with
     payment for this solar electricity, in the range of         contract prices of $0.14 per kilowatt-hour. This
     $0.20 per kilowatt-hour, would place no addi-               compares to utility-scale PV and solar thermal
     tional financial burden on utility customers without        contracts approved by the CPUC in 2011 ranging
     rooftop PV systems. Any distributed PV program              from $0.15 to 0.18 per kilowatt-hour. Residential
     payment structure that fairly accounts for rooftop          systems have been installed in California for as little
     PV value will result in rapid growth in rooftop PV          as $4.40 per watt, equivalent to about $0.20 per
     installations.                                              kilowatt-hour. Germany has the highest PV instal-
     The state’s “Million Solar Roofs” program, which            lation rate in the world at over 7,000 megawatts
     includes the California Solar Initiative, will add 3,000    per year, and is installing residential rooftop PV at
     megawatts of primarily rooftop PV by the end of             an average of $3 per watt and small commercial
     2016. About 550 megawatts of this capacity will             rooftop PV at $2.70 per watt. These PV capital
     be added in the Bay Area. This is a “net metering”          costs are equivalent to $0.14 per kilowatt-hour and
     program, meaning the solar generators swap electric-        less than $0.10 per kilowatt-hour, respectively.2
     ity with PG&E at retail electricity rates. The solar        The German labor market is more expensive than
     generator can be credited with up to 100 percent            the California market.
     of the building’s annual electricity demand. Net            One reason for the lower installed cost of German
     metering at retail electricity rates is a core financial    PV systems is standardized permitting. The
     element in the cost-effectiveness of zero net energy        Department of Energy is funding the development
     building retrofits.                                         of a scalable standard template for solar PV permit-
     Currently PV installed under net metering does not          ting, inspection and interconnection by states, utili-
     count directly toward the utility’s 33 percent RPS          ties and local jurisdictions. The Bay Area will be
     target. However, the green attribute of net-metered         a pilot site for establishing a regional standardized
     solar electricity, the renewable energy credit, may         solar permitting process under the Department of
     now be purchased by PG&E to count toward the                Energy program.
     33 percent RPS target as a result of California             Germany has achieved its high rooftop PV installa-
     Public Utility Commission (CPUC) regulatory                 tion rate using a simple clean energy payment sys-

4
Pacific Environment

tem (or feed-in tariff) that provides PV generators        term contract for the 250 megawatt Mojave solar
some income above the cost of production. The              thermal project objected to ratepayers paying $1.25
payments are revised on a six-month basis to assure        billion over market price for this one project, stat-
that clean energy payment pricing reflects current         ing that ratepayers should be getting double the
PV market costs. It is reasonable to assume that at        renewable energy for the cost of the contract.
high volume under a similar clean energy payment
program, the California rooftop PV market would            Contract terms between utilities and generators for
reflect the same PV cost efficiencies being realized       renewable energy of all types and natural gas-fired
in the German market.                                      turbines are confidential. This confidentiality is con-
                                                           troversial. Legislation signed into law in 2011, SB
PV panels equipped with integrated microinverters          836, is beginning to shed light on the cost of spe-
that convert direct current electricity to alternating     cific RPS contracts. Greater contract transparency
current at the panel are reducing cost and simplify-       would draw attention early to high-priced contract
ing installation. The lowest published cost to date for    proposals and should lower the cost of future long-
residential PV systems in California, $4.40 per watt,      term utility-scale contracts entered into by PG&E.
is being offered by Open Neighborhoods in Los
Angeles for a 2 kilowatt system using microinverters.      In addition, remote utility-scale projects generally
In general, PV system prices are anticipated to con-       require new transmission capacity to reach demand
tinue falling at a rate of about 15 percent per year for   centers. Transmission is expensive. The cost of
at least the next few years.                               new transmission lines to reach remote solar and
                                                           wind sites could exceed $15 billion statewide if
California’s utility-scale RPS program is produc-          the investor-owned utility RPS compliance strat-
ing some results, but at great cost to ratepayers.         egy is followed. Upgrading the existing transmis-
According to the CPUC’s Division of Ratepayer              sion system to accommodate these new power
Advocates, the renewable energy contracts signed           flows will add billions more in cost. As a result,
by PG&E and California’s other investor-owned              a large ground-mounted PV array in the Mojave
utilities through the summer of 2010 will incur $6         or Colorado Desert produces electricity at an all-
billion in additional costs above the baseline mar-        in cost, including the cost of new transmission,
ket reference price if they are built. Many more           as much as 50 percent greater than the cost-of-
high-priced contracts have been signed since 2010.         electricity produced by a 500 kilowatt PV array on
For example, the dissenting commissioner on the            a big box retail outlet or similar large commercial
November 2011 CPUC vote to approve a long-                 building in Oakland.

                                                                               The Vaca Dixon solar project. Photo: Next 100.com

                                                                                                                                   5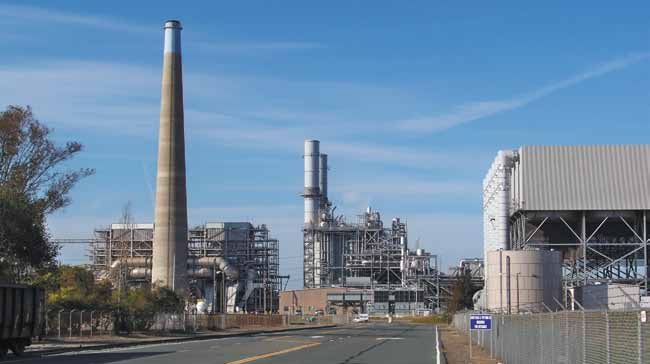
Bay area smart energy 2020

     Conclusions/Recommendations:                            •• An equitable clean energy payments program in
                                                                California would provide a mechanism for the
      •• Nearly 4,000 megawatts of rooftop PV will
                                                                state to replicate the rapid rooftop PV growth
         need to be online in the Bay Area by 2020 to
                                                                rate in Germany.
         meet the BASE 2020 rooftop PV target.

      •• The avoided cost to PG&E of rooftop PV sys-
                                                             1.2.2 Combined Heat and Power
         tems in the Bay Area is at least $0.22 per kilo-
         watt-hour without considering the value of the      Combined heat and power refers to facilities that
         renewable energy credits.                           use a small gas turbine, engine, or fuel cell to gen-
                                                             erate both electricity and useful heat. Combined
      •• Any price paid for rooftop PV below $0.22 per       heat and power facilities are commonly found at
         kilowatt-hour would benefit all ratepayers by       college campuses, hospitals, and commercial and
         providing electricity at a lower cost than PG&E     industrial complexes.
         would charge if it were supplying the same
         electricity from new conventional sources, after    BASE 2020 incorporates the AB 32 Global Warming
         time-of-delivery cost, line losses, and transmis-   Solutions Act Scoping Plan target of 4,000 megawatts
         sion and distribution costs are accounted for.      of new combined heat and power by 2020. A pri-
                                                             mary role of the new combined heat and power
      •• New commercial rooftop PV systems in                will be to displace coal power purchases by PG&E,
         California can deliver electricity at contract      purchases made either directly from in-state coal
         prices in the range of $0.14 per kilowatt-hour      generators or as a component of wholesale power
         without state PV incentives.                        market purchases. This will result in approximately
                                                             840 megawatts of new combined heat and power
      •• Lowest-cost residential PV systems can deliver      in the Bay Area by 2020.
         electricity at $0.20 per kilowatt-hour without
         state PV incentives.                                The avoided cost to PG&E of combined heat and
                                                             power in the Bay Area is about $0.18 per kilowatt-
      •• Rapid price declines continue in both the com-      hour. Combined heat and power projects can cost-
         mercial and residential rooftop PV markets.         effectively deliver electricity at contract prices as
      •• The renewable energy credits associated with        low as $0.12 per kilowatt-hour. The fuel composi-
         net-metered rooftop PV can be sold as tradable      tion target for combined heat and power in BASE
         renewable energy credits to assist PG&E reach       2020 is 50 percent biogas or biomethane, combined
         its RPS target.                                     with natural gas, to reduce the GHG footprint of
                                                             new combined heat and power to approximately
      •• Both net-metering and clean energy payment          300 pounds of CO2 per megawatt-hour. This is less
         PV programs will make substantial contributions     than half the GHG footprint of a state-of-the-art
         to meeting the BASE 2020 rooftop PV target.         base load combined cycle plant.

      •• Equitable net metering must be preserved and        Conclusions/Recommendations:
         existing net metering caps lifted for zero net
         energy programs like PACE to function to their      •• Any fixed payment paid to combined heat and
         potential.                                             power operators below $0.18 per kilowatt-hour
                                                                would benefit all PG&E ratepayers.
      •• Equitable clean energy payments that closely
         track real-time PV price reductions are a proven    •• Establish a fixed payment for combined heat and
         mechanism for rapidly expanding rooftop PV             power of at least $0.12 per kilowatt-hour to assure
         installations at lowest cost.                          that combined heat and power projects are built.

6
Pacific Environment

1.2.3 Geothermal                                           1.2.4 Wind
The conversion of the existing geothermal plants           300 megawatts of new wind projects already
at The Geysers to parallel wet-dry cooling sys-            planned or under construction in Solano County
tems, which should reduce evaporative water loss           are incorporated into BASE 2020.
by 80 to 90 percent over current practice, could
increase sustainable output from The Geysers by
                                                           1.2.5 Energy Storage
as much as 300 megawatts. Total installed capac-
ity at the The Geysers reached nearly 2,000                400 megawatts of battery storage will be integrated
megawatts during the geothermal plant building             to the Solano County wind production area to
boom of the 1980s. Production from The Geysers             provide 400 megawatts of peaking power and to
dropped dramatically in the late 1980s due to too          smooth output from the wind generators. 200
much geothermal reservoir steam/water being                megawatts of battery storage will also be added to
evaporated in the wet cooling towers used on all           residential and commercial Bay Area buildings to
of the nearly 20 geothermal plants located there.          absorb mid-day PV output, provide peaking capac-
The construction of a treated wastewater and               ity, address the intermittency of solar electricity
freshwater pipeline to The Geysers in the late             production, and serve as the foundation of commu-
1990s, to inject 8 million gallons per day into the        nity-scale microgrids that can operate around-the-
geothermal reservoir, stabilized output at around          clock on electricity supplied by rooftop PV. Pilot
900 megawatts.                                             community energy storage projects are underway at
                                                           various utilities. The cost of this battery capacity, in
The incremental production from parallel wet-              2012 prices, is less than the expected capacity pay-
dry cooling retrofits could potentially produce            ments for new peaking gas turbines.
the lowest cost renewable energy in the state and
would improve the sustainability of the geothermal         Conclusions/Recommendations:
resource. However, given that all of the geothermal         •• Energy storage is a good match for the high
plants are using the same extended geothermal res-             summertime output of Solano County wind
ervoir, a comprehensive conversion of all the exist-           farms. The California Energy Commission
ing geothermal plants would be necessary to realize            should conduct a study of the economic and
the full benefit of the wet-dry cooling conversions.           grid reliability benefits of integrating 400 mega-
                                                               watts of battery storage with the Solano County
Conclusions/Recommendations:                                   wind farms.
•• The California Energy Commission should con-
   duct a comprehensive evaluation of the cost and          •• If the study results are favorable, the state should
   benefits of retrofitting existing geothermal plants         move forward with the regulatory steps neces-
   at The Geysers with parallel wet-dry cooling                sary to bring the 400 megawatt battery storage
   systems to increase sustainable output at The               facility online prior to 2020.
   Geysers by up to 300 megawatts.                          •• 200 megawatts of distributed battery storage
•• The conclusions of this study, if favorable, would          should be added at the neighborhood level.
   serve as the basis for initiating necessary regulato-       Community energy storage systems are a green
   ry steps to retrofit the existing geothermal plants         substitute for conventional peaking gas turbine
   at The Geysers to parallel wet-dry cooling.                 resources and an essential building block in
                                                               eventual community-level microgrids.

                                                                                                                      7
Bay area smart energy 2020

     1.2.6 Solar Hot Water                                                 Conclusions/Recommendations:
     Solar hot water heating is a cost-effective and rela-                   •• The state’s current solar hot water program must
     tively untapped option for reducing natural gas                            grow to hundreds of thousands of installations
     demand. An analysis conducted of solar water heat-                         per year over the next decade if solar hot water
     ing natural gas savings potential in California deter-                     systems are to put significant downward pressure
     mined a potential reduction of approximately 120                           on residential and commercial natural gas con-
     billion cubic feet of natural gas per year, about 20                       sumption.
     days of natural gas supply. This is about 5 percent
     of the yearly statewide consumption of natural gas.                     •• The 2020 solar hot water target for PG&E
                                                                                should be about 1.5 million systems, equal to
     The Solar Hot Water and Efficiency Act of 2007                             about 25 percent of PG&E’s customers. This
     authorized a ten-year incentive program for solar                          is consistent with the target of retrofitting 25
     water heaters with a goal of promoting the instal-                         percent of PG&E homes and businesses with
     lation of 200,000 systems in California by 2017.                           rooftop PV by 2020. Over half of these retrofits
     This is an average installation rate statewide of                          would occur in the Bay Area. A second target
     20,000 systems per year. Germany has installed                             is to reach and sustain a solar hot water retrofit
     as many as 200,000 solar hot water systems in                              rate of 200,000 per year by 2020 in PG&E ter-
     one year. PG&E has over 5 million residential                              ritory.
     and commercial customers. An installation rate of
     200,000 systems per year is a realistic and achiev-
     able goal in PG&E territory.

                                    170,735-sq.-ft. net zero emissions office building prototype in St. Louis, Mo. Illustration: Hellmuth, Obata and Kassabaum.

8
Pacific Environment
1.3 Energy Efficiency and Peak Demand Reduction
1.3.1 Energy Efficiency Industrial plants and agricultural operations would
The Energy Efficiency Strategic Plan calls for 25 per- reduce electricity consumption by 25 percent and
cent of residences to reach 70 percent reduction 15 percent respectively by 2020, consistent with
in electricity usage by 2020. Rooftop PV must be the goals in the Energy Efficiency Strategic Plan.
added to reach a 70 percent reduction. Adding a
number of additional PV panels to a planned resi- 1.3.2 Air Conditioning
dential rooftop PV system to reach 100 percent Air conditioning is a major source of peak energy
reduction – zero net energy – is straightforward demand in the Bay Area. The CPUC estimates air
and cost-effective. For this reason, the Energy conditioning loads are responsible for more than
Efficiency Strategic Plan goal is modified in BASE 30 percent of the total load on hot summer days.
2020 to a target of 25 percent of residences achiev- BASE 2020 adopts the Energy Efficiency Strategic
ing 100 percent reduction in net electricity usage Plan target of a 50 percent reduction in air condi-
by 2020. The remaining 75 percent of existing tioning loads by 2020. Achieving this peak demand
homes will reduce electricity demand by 30 per- reduction target will reduce Bay Area peak load by
cent through energy efficiency measures by 2020. over 2,000 megawatts.
Multi-family residences will reduce grid demand by
40 percent by 2020, using a combination of energy Central air conditioning units have an average use-
efficiency and rooftop PV. ful service life of 10 to 14 years. As a result, well
over 50 percent of operating central air condition-
BASE 2020 establishes a target of 25 percent of ing units in the Bay Area will be due for replace-
commercial buildings reaching zero net energy by ment by 2020 through normal attrition. Cost-
2020. This is in essence a mid-point target to the effective state-of-the-art central air conditioning
Energy Efficiency Strategic Plan goal of 50 percent of units have less than one-half the electricity demand
existing commercial buildings reaching zero net of typical older operating units. New state-of-the-
energy by 2030. 75 percent of existing commer- art units have a much lower electricity demand
cial buildings will reduce electricity usage by 30 than new units meeting only the federal minimum
percent by 2020 using energy efficiency measures. efficiency standard.
The net effect of achieving these energy efficiency
targets will be a reduction of about 30 percent in Incentive funds should be paid at the contractor
grid-supplied electricity to homes and commercial level to cover the cost difference between a new
buildings in the Bay Area in 2020 compared to the minimum efficiency unit and a state-of-the-art
baseline year of 2008. unit. This would mean that the net price of the
most efficient unit offered by heating and ventila-
BASE 2020 also establishes a uniform goal of tion contractors to consumers in the Bay Area is the
2015 for all new homes and commercial build- same as less efficient units. This will ensure that all
ings to be zero net energy. This uniform goal new units are high efficiency units. Assuming each
compares to the Energy Efficiency Strategic Plan replacement on average reduces unit electricity con-
targets of zero net energy for all new homes by sumption by 50 percent, and half the existing units
2020 and for all new commercial buildings by are replaced due to natural attrition in 10 years, the
2030. The BASE 2020 goal is consistent with the electricity consumption of the entire population of
goal established by Austin, Texas in 2007, which central air conditioning units in the Bay Area will
requires all new homes to be zero net energy drop about 25 percent over the next decade.
capable by 2015.
9Bay area smart energy 2020
Electronic on/off cycling controls are inexpensive •• Air conditioning loads are responsible for at least
and simple to install. PG&E has a program to install 30 percent of summer peak loads.
these on/off controls on 25 percent of existing
central air conditioning units. Adding cycling con- •• Incentive funds should be used to cover the cost
trols to all existing and new central air condition- difference between a minimum efficiency cen-
ing units will provide the capability to reduce the tral air conditioning unit and a state-of-the-art
instantaneous electricity demand from the entire air unit at the contractor level. This will ensure that
conditioner population by an additional 30 to 40 all new replacement units are high efficiency
percent, as half these units would be in off mode at units, reducing demand in the units that are
any given time while the other half are operational. replaced by about 50 percent on average.
•• Adding cycling capability to all existing and new
Conclusions/Recommendations: central air conditioning units will provide the
•• Achieving the energy efficiency targets in BASE capability to reduce the instantaneous air condi-
2020 will reduce electricity demand in the Bay tioner electricity demand by an additional 30 to
Area by approximately 25 to 30 percent in 2020 40 percent.
compared to a 2008 baseline year.
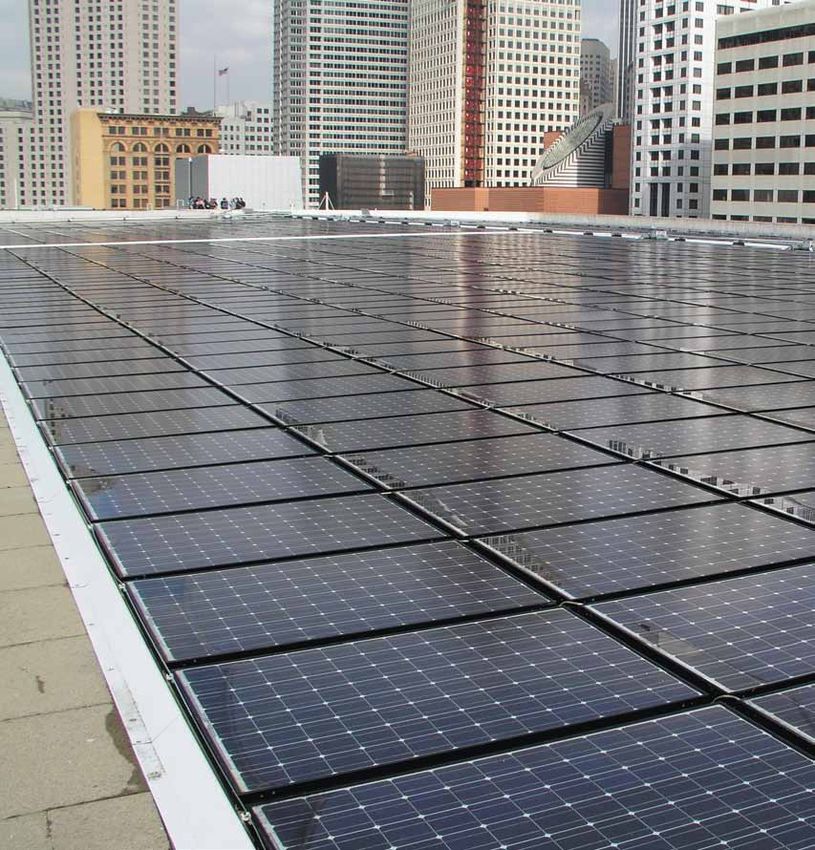
Sunset Reservoir solar project. Photo: San Francisco Public Utilities Commission
10Pacific Environment
1.4 Independent Clean Energy Alternatives to Achieve
BASE 2020
PG&E’s energy efficiency program is Federal housing corporations Fannie Mae and
not meeting minimum targets established by the Freddie Mac indicated in July 2010 that they
CPUC. PG&E is not the ideal entity to lead the would not purchase mortgages on properties with
effort to achieve the ambitious zero net energy PACE assessments. This suspended development
goals in the Energy Efficiency Strategic Plan and of PACE programs, especially residential PACE,
BASE 2020. In contrast, an independent non-profit in most parts of California and across the coun-
organization, the Energy Trust of Oregon, con- try. Lawsuits have resulted in a formal comment
trols public goods funds collected by the Oregon procedure at the Federal Housing and Finance
investor-owned utilities for electricity and natural Authority, the federal agency that oversees Fannie
gas efficiency measures and administers programs Mae and Freddie Mac, that may lead to resolution
intended to maximize efficiency gains and rooftop of this controversy. Federal legislation has been
PV. The Energy Trust of Oregon is well regarded proposed to resolve this issue as well. Commercial
by Oregon stakeholders as effective. buildings and homes with no mortgage, which
account for about one-third of residential housing
The administration of public goods funds by third stock, are unaffected by the Fannie Mae/Freddie
parties to maximize energy efficiency is a proven Mac position on PACE assessments.
concept, as demonstrated by the Energy Trust of
Oregon. California also has off-the-shelf regulatory PACE programs offer a financially manageable
and legislative options that provide for independent mechanism for homeowners and business owners
pursuit of maximum energy efficiency and rooftop to achieve zero net energy in existing residential
PV. These include Property Assessed Clean Energy and commercial buildings. PACE is independent of
(PACE) and Community Choice Aggregation. utility-funded energy efficiency programs. PG&E
does offer a limited on-bill financing program for
commercial customers that mirrors the PACE pro-
1.4.1 – Property Assessed Clean Energy
gram in numerous respects. A new program, on-
Berkeley pioneered an innovative, no upfront bill repayment, is under study. The on-bill repay-
cost funding mechanism where the city or private ment program would allow private investors to
investors provide low-interest financing to prop- collect for energy efficiency improvements through
erty owners to pay for energy efficiency improve- PG&E’s existing billing process.
ments and rooftop PV installations. The financing
is repaid as property assessments semi-annually with
property tax payments. California PACE legisla- 1.4.2 – Community Choice Aggregation
tion, AB 811, was passed into law in 2008. Sonoma California law allows local government to pur-
County has continuously operated a successful resi- chase electricity on behalf of their residents
dential and commercial PACE program since 2009, and businesses through a mechanism known
the Sonoma County Energy Independence Program. as Community Choice Aggregation (CCA). A
This program serves as the model for the privately- CCA is a public energy authority. CCAs allow
financed, $100 million commercial PACE program more local control of electricity supply, increased
launched in Sacramento in September 2011. San renewable energy, and increased local economic
Francisco launched its commercial PACE program, benefits from local renewable energy develop-
GreenFinanceSF-Commercial in October 2011. ment. The investor-owned utility (PG&E, in the
11Bay area smart energy 2020
case of the Bay Area) continues to provide trans- 1.4.3 – Clean Energy Payments
mission and distribution service to CCA custom- California has the authority to designate a state
ers. Large CCAs serving hundreds of thousands agency to establish and administer a clean energy
of customers in Ohio and Massachusetts have payment program (also known as “feed-in tariff”
been operating for a number of years. The Marin program), buy the energy at the set payment rates,
Energy Authority launched its CCA program, and require the investor-owned utilities to purchase
Marin Clean Energy, in May 2010. Marin Clean a specific amount of the electricity generated. The
Energy is the state’s first operational CCA. Federal Energy Regulatory Commission (FERC)
Marin Clean Energy is in the process of expand- has acknowledged that a state requirement that
ing its customer base from 14,000 customers to investor-owned utilities purchase electricity from a
approximately 100,000 customers, as all Marin state-owned corporation at specified rates would not
County residents will have the opportunity to be preempted by FERC’s authority over wholesale
participate in mid-2012. The San Francisco Public power sales. The state could adopt this approach as
Utilities Commission is in the process of launching an alternative to the CPUC’s complex clean energy
its CCA program, CleanEnergySF, with an initial payment proceedings. CPUC clean energy payment
participation target of 75,000 customers. Sonoma proceedings have consistently resulted in rates that
County is considering the formation of a CCA. are too low to get either rooftop PV or combined
heat and power projects built in quantity.
CCAs provide some of the services of a public
utility. The Bay Area has a number of small public Conclusions/Recommendations:
electric utilities. The cost of electric service pro- •• Revival of PACE programs in the Bay Area
vided by Bay Area public utilities is consistently is necessary to create a dynamic alternative
10 to 20 percent or more lower than equivalent for achieving the goals of BASE 2020. PACE
service from PG&E. Some of the Bay Area public requires little intervention by local or state gov-
utilities, most notably Alameda Municipal Power, ernment to make rapid strides in energy effi-
are achieving substantially higher levels of renew- ciency and rooftop PV.
able energy sales than PG&E. Two of the pub-
lic utilities, Silicon Valley Power and Palo Alto •• CCA offers a viable alternative to Bay Area cit-
Utilities, offer customers 100 percent renewable ies and counties currently served by PG&E to
energy service at less cost than the standard PG&E increase local control of electricity supply and
tariff for equivalent service. Marin Clean Energy increase the contribution of local renewable
now offers its customers options with varying energy.
renewable energy content: 25 percent, 50 percent,
or 100 percent. •• California’s Department of General Services has
contract expertise and administers the state’s
Recent changes to CCA legislation allow the CCA revolving loan program under the Energy
to administer public goods funds collected from Efficient State Property Revolving Fund.
CCA customers. These funds have historically been General Services could serve as the state gov-
controlled by the investor-owned utility. The CCA ernment entity that sets clean energy payment
can now independently determine how these funds rates for rooftop PV and combined heat and
will be used to maximize energy efficiency reduc- power, purchases the energy at the set rates, and
tions in the CCA jurisdiction. requires each investor-owned utility to purchase
a specific amount of these resources.
12Pacific Environment
1.5 – Rethinking the Grid
1.5.1 – Grid Upgrades These new generators, who do not currently pay
The existing Bay Area distribution grid, without fees to export to the grid, will reduce PG&E grid
substantial modification, can already absorb the costs and reduce the need for new distribution grid
electricity flow from nearly 4,000 megawatts of capital expenditures. Distribution grid costs will drop
new local PV that will be added under BASE 2020. overall. These cost reductions may equal or exceed
Electricity flows in one direction in a conventional the rate that customers with rooftop PV reduce their
grid operation. Safety devices, like circuit breakers, grid power purchases. In this scenario grid costs
will open if flow is reversed. The cost to retrofit a will not be shifted to customers without PV, as this
large distribution substation with smart two-way smaller group of customers will share a smaller cost.
microprocessor-controlled circuit breakers is low, A fair grid cost sharing system is necessary.
on the order of several hundred thousand dollars. Historically, financing the building and mainte-
To realize the full local PV and combined heat and nance of the grid was simple – costs were spread
power potential of the distribution grid, two-way out among all residential, commercial, and indus-
flow is necessary. trial customers, and generators paid nothing beyond
The California Energy Commission has been the initial cost of interconnecting to the grid.
advocating that California utilities be required to If a thorough and fair review indicates that genera-
incorporate smart grid features, including full two- tors should pay a fee to export electricity to the grid
way flow, since 2007. According to its Smart Grid to finance grid costs, then all generators, including
Deployment Plan 2011-2020, PG&E is making prog- large generators that currently pay nothing to export
ress on the necessary grid upgrades. It has installed to the grid, should be charged the same fee per
circuit breakers with full automatic control on over kilowatt-hour of exported electricity. Otherwise,
50 percent of its substations, with a goal of 100 utility-scale generators that exclusively export elec-
percent conversion by 2015. PG&E is also making tricity, whether conventional or renewable, would
other upgrades, such as adding voltage optimization obtain a de facto economic advantage over rooftop
controls on distribution feeders to support high lev- PV generators while contributing to the grid con-
els of PV generation. With these upgrades, PG&E is gestion problem that rooftop PV systems relieve.
largely resolving technical barriers to the rapid devel-
opment of the Bay Area’s full local power potential.
1.5.3 – Monitoring Distributed PV
There has been no significant utility effort to date in
1.5.2 – Fair Financing of Distributed
California to monitor or control the dispatch of non-
Generation
utility owned rooftop PV on distribution circuits.
Local PV systems produce and deliver electricity The monitoring and dispatch control of commercial-
where it is needed, during high demand daylight scale rooftop PV is considered essential to reliable
hours. As a result, this solar electricity reduces grid operation in Germany, where approximately
rates to all customers by displacing high cost peak- 25,000 megawatts of distributed PV is online as of
ing power, relieving congestion on the electrical the beginning of 2012 (see graphic, next page). This
grid, reducing wear-and-tear on grid hardware like unnecessary “blindness” can lead to grid reliability
transformers, and by delaying or eliminating the issues during certain weather and load conditions.
need to expand the grid. One simple step that needs to be taken by PG&E
Achieving the targets in BASE 2020 and the Energy and other California utilities is to monitor and con-
Efficiency Strategic Plan will result in nearly a mil- trol the dispatch of commercial-scale rooftop PV
lion new solar generators in the Bay Area by 2020. owned by third parties.
13Bay area smart energy 2020
Solar Market Segments, Germany, 2010
Building-Integrated PV
100 kWp)
Rooftop
Ground-Mounted
15%
Photos: National Renewable Energy Laboratory, Photographic Information eXchange
Source: Statistics of the Federal Network Agency, BSW-Solar Estimates Shares according to installed capacity.
14Pacific Environment
1.6 Displacement of Fossil Fuel Generation by BASE 2020
A significant source of PG&E’s GHG emissions A second justification offered is the need to retire
is from power purchased on the wholesale power once-through cooled steam boiler plants in the Bay
market and identified as “unspecified” in the 2009 Area due to their impact on marine life. PG&E
PG&E power mix. These power purchases include has identified only two once-through cooled
coal. BASE 2020 will displace all coal usage over steam boiler units in its service territory, located in
the next decade with baseload combined heat and Pittsburg, as necessary for Bay Area grid reliability.
power, increased geothermal output from existing It would be much cheaper and more efficient to
plants at The Geysers, and the integration of bat- retrofit these existing boiler plants to cooling towers
tery storage with existing wind power in Solano and use them as a back-up peak power supply for
County. another decade or two, than to build new gas tur-
bine plants that will be in operation for 50 years.
The second source of PG&E coal power pur-
chases is long-term contracts with a few California Conclusions/Recommendations:
coal-fired co-generation plants. BASE 2020 will
displace these sources over the next decade, •• BASE 2020 will rapidly drive down demand
and replace them with the same clean baseload for grid power, obviate the need for any new
resources to be used to displace PG&E imported utility-scale natural gas plants, and end any reli-
coal power purchases. ance on coal power.
PG&E is proposing to contract for over 2,000 •• Actual PG&E reserve margins are considerably
MW of new natural gas-fired gas turbine plants to higher than necessary to assure grid reliability
be built in the Bay Area over the next few years. on hot days. Peak demand has been static or
The expense of having this new gas turbine capac- declining in recent years. Peak loads will steadily
ity available will be on the order of $600 million decline if BASE 2020 is implemented.
per year for 20 years. This is despite high electric- •• Solar PV is completely reliable on hot summer
ity reserve margins in the range of 30 to 40 per- afternoons when peak loads occur in the Bay
cent, that assure grid reliability on hot days when Area. There is no significant cloud cover dur-
electricity use is highest. Actual reserves margins ing these periods. There is no reliability need
are much higher than the required 15 to 17 per- to build peaking gas turbines to back-up PV in
cent, and indicate that PG&E already has an excess anticipation of significant cloud cover on the
of generation available to meet any reasonably hottest days.
foreseeable demand without new gas-fired plants.
There has been no growth in peak demand in •• The cost of retrofitting wet cooling towers at
recent years that would justify adding more peak- the power plant in Pittsburg to eliminate the
ing capacity. marine impacts of once-through cooling would
be much lower than building new gas turbine
A primary justification for these new turbines, peaking capacity to replace these units.
offered by PG&E and the California Independent
System Operator, is the need to back-up solar and •• The $600 million per year of PG&E ratepayers
wind resources. Solar PV is completely reliable on will pay for four new gas turbine power plants
hot summer afternoons when peak loads occur in in the Bay Area would be sufficient to pay for
the Bay Area. There is no significant cloud cover more than half of the nearly 4,000 MW of new
during the hottest hours of the summer when the local PV, at 2012 PV prices, that will be added
highest electricity demand occurs. in the Bay Area under BASE 2020.
15Bay area smart energy 2020
1.7 Ratepayer Benefits from BASE 2020
The reduction of demand for PG&E-supplied •• This same merit order benefit applies to natural
electricity and natural gas, achieved through energy gas demand reduction realized by use of com-
efficiency measures, PV, combined heat and power, bined heat and power, solar hot water heating,
geothermal, wind, and solar hot water, also reduces and substitution of biomethane or biogas for
the price of electricity and natural gas in wholesale pipeline natural gas. Payments for these tech-
energy markets. This is known as the “merit order nologies and fuels must incorporate the value
effect.” It reduces the cost of electricity and natural of the merit order benefit to assure that the
gas for all ratepayers. deployment of technologies and fuels that are
bringing net price benefits to all natural gas con-
The merit order effect of distributed generation in sumers are not inappropriately constrained by
Germany, an electricity market two times the size inadequate incentive budgets.
of the California market, reduced the wholesale
electricity price to German customers by approxi- •• The California Energy Commission should veri-
mately $5 billion in 2009. fy the merit order effect of the energy efficiency
and distributed generation targets in BASE
PG&E buys a significant amount of electricity and 2020 on the wholesale market price of electric-
natural gas from wholesale markets. The market ity. The results of this verification would serve
price benefits of reduced demand caused by energy as the basis for increasing funding for energy
efficiency measures and local clean energy will sub- efficiency and demand response programs and
stantially outweigh the transaction costs, especially for shifting all distributed generation transaction
interconnection costs, that currently hamper or costs, including interconnection costs, to PG&E
prevent the deployment of local PV and combined ratepayers.
heat and power projects.
•• The California Energy Commission should
Conclusions/Recommendations: conduct a similar verification of the merit order
•• The merit order benefit of distributed PV and effect of the BASE 2020 targets for combined
combined heat and power on wholesale electricity heat and power, solar hot water heating, and
prices is substantially greater than the transaction natural gas substitution with biogas and bio-
costs, especially interconnection costs, imposed by methane on the wholesale market price of natu-
PG&E on distributed PV and combined heat and ral gas. The results would serve as the basis for
power developers. These transaction costs should increasing incentives for solar hot water systems
be absorbed by PG&E as the net economic bene- and biogas and biomethane fuel production.
fit to all PG&E customers of having these PV and
combined heat and power systems online substan-
tially outweighs the transaction costs.
16Pacific Environment
1.8 GHG Reductions Achieved by BASE 2020
Achieving BASE 2020 targets will result in a Table 1-1 summarizes estimated 2008 GHG
reduction of more than 60 percent in Bay Area GHG emissions from electricity usage in the Bay Area.
emissions from electricity usage by 2020. Peak demand The term GHG is used interchangeably with
on the grid will decline by more than 50 percent. carbon dioxide (CO2) in BASE 2020.
Table 1-1. Total Bay Area GHG Emissions from Electricity Consumption in 2008
CO2 emission 2008 CO2 2008 Bay Area
Bay Area
Source GWh3 factor emissions CO2 emissions
fraction
(tons/MWh) (million tons) (million tons)
PG&E bundled customers 81,983 0.32 26.2 0.6 15.7
PG&E Direct Access
6,376 0.48 3.1 0.6 1.8
customers
Bay Area public utilities 5,327 0.32 1.7 1.0 1.7
Bay Area total 19.2
Table 1-2. CO2 Reduction Achieved by Implementing BASE 2020
Quantity of Avoided CO2 Net CO2
Source of CO2 emissions Fuel type
reduction emissions reduction
CO2 reduction (million tons) displaced
(GWh) (million tons) (million tons)
Energy efficiency 15,448 0 natural gas 4.9 4.9
Rooftop PV 6,799 0 natural gas 3.4 3.4
Combined Heat and Power 6,770 1 imported 3.2 2.2
New geothermal 2,234 0 imported 1.1 1.1
New wind with energy storage 867 0 imported 0.4 0.4
Total reduction 12.0
Table 1-2 summarizes the actions to be taken in The Bay Area peak load reductions on PG&E and
BASE 2020 to reduce GHG emissions and the Bay Area public utility systems that would occur
GHG reductions achieved. Net GHG emissions as a result of BASE 2020 are shown in Table 1-3.
from electricity usage would decline from 19 Electricity purchased from Bay Area utilities would
million tons per year in 2008 to 7 million tons per decline at peak from about 14,000 megawatts in
year in 2020, a reduction of more than 60 percent. 2008 to approximately 6,500 megawatts in 2020.
17Bay area smart energy 2020
This is more than a 50 percent reduction in the central air conditioners and commercial build-
peak demand met with grid power. The majority ing chiller plants.3 The remaining peak demand
of the reduction in peak demand for utility-sup- reduction on the grid will be demand displace-
plied grid power will come from energy efficiency ment by rooftop PV, combined heat and power,
measures in general, as well as from more efficient and battery storage.
Table 1-3. Bay Area Peak Load Reduction Achieved by Implementing BASE 2020
Peak load
Source of reduction Basis of reduction (MW) reduction
(MW)
Energy efficiency 25 percent reduction in demand on average from energy efficiency measures 2,500
Cooling load represents about 30 percent of peak load. Highest efficiency cen-
Air conditioner/ tral air conditioning (CAC) units replace worn-out units, 50 percent reduction.
chiller plant efficiency 50 percent reduction targeted for commercial building chiller plants. Cycling 2,100
improvement capability built into new CAC units to allow 50 percent online, 50 percent
offline at peak. A 50 percent turnover in CAC population is assumed.
3,800 MWac of rooftop PV added by 2020. 50 percent of this capability, 1,900
Rooftop PV 1,900
MWac, is available at peak.
200 megawatts of battery storage will be added to residential and commercial
Bay Area buildings to absorb mid-day PV output, provide peaking capacity,
Battery storage associ-
address the intermittency of solar electricity production, and serve as the 200
ated with rooftop PV
foundation of community-scale microgrids that can operate around-the-clock
on electricity supplied by rooftop PV.
Combined heat and 840 MW of combined heat and power is added to Bay Area, removing equiva-
840
power lent amount of load from utility demand at peak.
Total Bay Area peak load reduction 7,540
18Pacific Environment
At a Glance
Bay Area Energy Projects
and Programs
19Bay area smart energy 2020
ALAMEDA
)$&,/,7< 2QOLQH0:
%LRJDV
&RPELQHG&\FOH
*HRWKHUPDO
+\GURHOHFWULF
3HDNHU7XUELQH
3KRWRYROWDLF
5HQHZDEOH&+3 *URXSRI
YDULRXV
1RQ5HQHZDEOH&+3 VPDOOHUSODQWV
6WHDP%RLOHU
0LOHV
:LQG
Alameda County
•• City of Berkeley pioneered the Property
Assessed Clean Energy (PACE) program for
residential buildings.
•• Alameda Municipal Power offers a high vol-
ume of renewable energy to their customers at
significantly lower rates than PG&E. Landfill
biogas-fueled electricity is a significant percent-
age of the Alameda Municipal Power electricity
supply.
•• Altamont, one of the US’ first major wind
farms, is controversial due to a high volume of
avian deaths.
•• Russell City and Mariposa natural gas power
plants proposed for the region would add 800
MW’s of natural gas capacity, if built.
•• Climate Action Plans passed in Albany, Berkeley,
Emeryville, Oakland, Hayward, and Alameda
with reduction targets ranging from 25 to 80 per-
cent reduction by 2020.
•• Combined heat and power facilities provide power
at UC Berkeley campus, among other places.
•• Distributed PV potential is 3,764 MW.
20Pacific Environment
CONTRA COSTA MARIN
(
(
)$&,/,7< 2QOLQH0:
)$&,/,7< 2QOLQH0:
%LRJDV %LRJDV
&RPELQHG&\FOH &RPELQHG&\FOH
*HRWKHUPDO *HRWKHUPDO
+\GURHOHFWULF +\GURHOHFWULF
3HDNHU7XUELQH 3HDNHU7XUELQH
3KRWRYROWDLF 3KRWRYROWDLF
5HQHZDEOH&+3 *URXSRI 5HQHZDEOH&+3 *URXSRI
1RQ5HQHZDEOH&+3
YDULRXV
VPDOOHUSODQWV 1RQ5HQHZDEOH&+3
( YDULRXV
VPDOOHUSODQWV
6WHDP%RLOHU 6WHDP%RLOHU 2
0LOHV 0LOHV
:LQG :LQG
Contra Costa County Marin County
•• Hosts over 50 percent of the Bay Area’s emis- •• The Marin Energy Authority is California’s first
sions from fossil fuel power plants. energy purchasing program under the state’s
Community Choice law.
•• Home to the Bay Area’s remaining “once-
through cooling” power plants, Contra Costa •• Marin County Climate Action Plan targets 15
and Pittsburg. percent GHG reduction below 1990 levels by
2015. San Rafael has a 25 percent reduction tar-
•• Martinez Climate Action Plan targets a 25 per- get by 2020.
cent reduction in GHG emissions by 2020.
•• Distributed PV potential is 551 MW.
•• Distributed PV potential is 2,264 MW.
Gateway and Contra Costa power plants, Antioch. Photo: Pacific Environment
21You can also read