PREMIUM Establishing a path towards - Through Sustainable Growth - CenterPoint Energy ...

Page created by Ralph Nichols
 
CONTINUE READING
PREMIUM Establishing a path towards - Through Sustainable Growth - CenterPoint Energy ...
Establishing a path towards

PREMIUM
Through Sustainable Growth…

CenterPoint Analyst Day
September 2021
CenterPoint Energy Analyst Day – September 2021
PREMIUM Establishing a path towards - Through Sustainable Growth - CenterPoint Energy ...
CAUTIONARY STATEMENT AND OTHER DISCLAIMERS
This presentation and the oral statements made in connection herewith contain statements concerning our expectations, beliefs, plans, objectives, goals, strategies, future operations, events, financial position, earnings, growth, costs, prospects, capital investments or performance or underlying
assumptions and other statements that are not historical facts. These statements are “forward-looking statements” within the meaning of the Private Securities Litigation Reform Act of 1995.

You should not place undue reliance on forward-looking statements. Actual results may differ materially from those expressed or implied by these statements. You can generally identify our forward-looking statements by the words “anticipate,” “believe,” “continue,” “could,” “estimate,” “expect,”
“forecast,” “goal,” “intend,” “may,” “objective,” “plan,” “potential,” “predict,” “projection,” “should,” “target,” “will,” or other similar words. The absence of these words, however, does not mean that the statements are not forward-looking.

We have based our forward-looking statements on our management’s beliefs and assumptions based on information currently available to our management at the time the statements are made. Any statement in this presentation regarding future events, such as CenterPoint Energy’s carbon
emission reduction goals, including its net-zero emission goals, and its ability to achieve such goals and related timing thereof, the advancement of and use of new technologies for alternative energy sources, CenterPoint Energy’s ability to continue to modernize its distribution grid, executive
management continuity and succession planning, future board composition, corporate governance commitments, strategic plans and value creation, capital investments, business opportunities, future financial performance and results of operations, renewable energy growth objectives, growth
and guidance (including earnings and customer growth, utility and rate base growth expectations), the expected closing of previously announced strategic transactions, and any other statement that is not historical facts are forward-looking statements. We caution you not to place undue reliance
on any forward-looking statements and that assumptions, beliefs, expectations, intentions and projections about future events may and often do vary materially from actual results. Accordingly, we cannot assure you that actual results will not differ materially from those expressed or implied by our
forward-looking statements.

Important factors that could cause actual results to differ materially from those indicated by the provided forward-looking information include risks and uncertainties relating to: (1) the performance of Enable, the amount of cash distributions CenterPoint Energy receives from Enable, Enable’s
ability to redeem the Enable Series A Preferred Units in certain circumstances and the value of CenterPoint Energy’s interest in Enable; (2) the integration of the businesses acquired in the merger with Vectren Corporation (Vectren), including the integration of technology systems, the outcome of
shareholder litigation filed against Vectren that could reduce the benefits of the merger, the ability to realize additional benefits and commercial opportunities from the merger, including the development of new opportunities and the performance of projects undertaken by Energy Systems Group, a
subsidiary of CenterPoint Energy, which are subject to, among other factors, the level of success in bidding contracts and cancellation and/or reductions in the scope of projects by customers and obligations related to warranties, guarantees and other contractual and legal obligations; (3) the
recording of impairment charges; (4) industrial, commercial and residential growth in CenterPoint Energy’s service territories and changes in market demand, including the demand for CenterPoint Energy’s non-utility products and services and effects of energy efficiency measures and
demographic patterns; (5) timely and appropriate rate actions that allow recovery of costs and a reasonable return on investment, including the timing and amount of natural gas purchase costs associated with the February 2021 winter storm event recovered; (6) future economic and political
conditions in regional and national markets and their effect on sales, prices and costs; (7) weather variations and other natural phenomena, including the impact of severe weather events on operations and capital, such as impacts from the February 2021 winter storm event; (8) CenterPoint
Energy’s or Enable’s business strategies and strategic initiatives, restructurings, joint ventures and acquisitions or dispositions of assets or businesses, including the announced sale of our Natural Gas businesses in Arkansas and Oklahoma, which we cannot assure will be completed or will have
the anticipated benefits to us, and the merger of Enable with Energy Transfer, which we cannot assure will be completed or will have the anticipated benefits to us or Enable; (9) the outcome of litigation, including litigation related to the February 2021 winter storm event; (10) the ability of retail
electric providers (REPs), including REP affiliates of NRG Energy, Inc. and Vistra Energy Corp., to satisfy their obligations to CenterPoint Energy and Houston Electric, including the negative impact on such ability related to COVID-19 and the February 2021 winter storm event; (11) the COVID-
19 pandemic and its effect on CenterPoint Energy’s and Enable’s operations, business and financial condition, the industries and communities they serve, U.S. and world financial markets and supply chains, potential regulatory actions and changes in customer and stakeholder behaviors relating
thereto; (12) state and federal legislative and regulatory actions or developments affecting various aspects of CenterPoint Energy’s businesses (including the businesses of Enable), including, among others, energy deregulation or re-regulation, pipeline integrity and safety, regulations relating to
climate change, air emissions, carbon, waste water discharges and the handling and disposal of coal combustion residuals, and changes in regulation and legislation pertaining to trade, health care, finance and actions regarding the rates charged by our regulated businesses; (13) direct or
indirect effects on CenterPoint Energy’s or Enable’s facilities, resources, operations and financial condition resulting from terrorism, cyber attacks or intrusions, data security breaches or other attempts to disrupt their businesses or the businesses of third parties, or other catastrophic events such
as fires, ice, explosions, leaks, severe weather events, pandemic health events or other occurrences; (14) tax legislation, including the effects of the Coronavirus Aid, Relief, and Economic Security (CARES) Act and the comprehensive tax reform legislation informally referred to as the Tax Cuts
and Jobs Act (which includes but is not limited to any potential changes to tax rates, tax credits and/or interest deductibility), as well as any changes in tax laws under the Biden administration and uncertainties involving state commissions’ and local municipalities’ regulatory requirements and
determinations regarding the treatment of excess deferred income taxes and CenterPoint Energy’s rates; (15) CenterPoint Energy’s ability to mitigate weather impacts through normalization or rate mechanisms, and the effectiveness of such mechanisms; (16) actions by credit rating agencies,
including any potential downgrades to credit ratings; (17) matters affecting regulatory approval, legislative actions, construction, implementation of necessary technology or other issues with respect to major capital projects that result in delays or cancellation or in cost overruns that cannot be
recouped in rates; (18) the impact of unplanned facility outages or other closures; (19) CenterPoint Energy’s ability to fund and invest planned capital and the timely recovery of CenterPoint Energy’s investments, including those related to Indiana Electric’s generation transition plan as part of its
most recent IRP; (20) CenterPoint Energy’s ability to successfully construct and operate electric generating facilities, including complying with applicable environmental standards and the implementation of a well-balanced energy and resource mix, as appropriate; (21) the sufficiency of
CenterPoint Energy’s insurance coverage, including availability, cost, coverage and terms and ability to recover claims; (22) commercial bank and financial market conditions, CenterPoint Energy’s access to capital, the cost of such capital, and the results of CenterPoint Energy’s financing and
refinancing efforts, including availability of funds in the debt capital markets; (23) changes in rates of inflation; (24) inability of various counterparties or customers to meet their obligations to CenterPoint Energy; (25) the extent and effectiveness of CenterPoint Energy’s and Enable’s risk
management and hedging activities, including but not limited to, financial and weather hedges; (26) timely and appropriate regulatory actions, which include actions allowing securitization, for any future hurricanes or other severe weather events, or natural disasters or other recovery of costs; (27)
CenterPoint Energy’s or Enable’s ability to recruit, effectively transition and retain management and key employees and maintain good labor relations; (28) changes in technology, particularly with respect to efficient battery storage or the emergence or growth of new, developing or alternative
sources of generation; (29) the impact of alternate energy sources on the demand for natural gas; (30) the timing and outcome of any audits, disputes and other proceedings related to taxes; (31) the transition to a replacement for the LIBOR benchmark interest rate; (32) the effect of changes in
and application of accounting standards and pronouncements; (33) CenterPoint Energy’s ability to execute operations and maintenance management initiatives, targets and goals; and (34) other factors discussed in CenterPoint Energy’s Annual Report on Form 10-K for the fiscal year ended
December 31, 2020, CenterPoint Energy’s Quarterly Report on Form 10-Q for the quarters ended March 31, 2021 and June 30, 2021 and other reports CenterPoint Energy or its subsidiaries may file from time to time with the Securities and Exchange Commission.

This presentation contains time-sensitive information that is accurate as of September 23, 2021. Some of the information in this presentation is unaudited and may be subject to change. We undertake no obligation to update the information presented herein, except as required by law.

Use of Non-GAAP Financial Measures

The Company provides guidance based on non-GAAP Utility Net income, non-GAAP long term funds from operations (FFO) and non-GAAP utility earnings per share. Generally, a non-GAAP financial measure is a numerical measure of a company’s historical or future financial performance that
excludes or includes amounts that are not normally excluded or included in the most directly comparable GAAP financial measure. Please refer to the Appendix for detailed discussion of the use of non-GAAP financial measures presented herein.
.

CenterPoint Energy Analyst Day – September 2021                                                                                                                                                                                                                                                                    2
PREMIUM Establishing a path towards - Through Sustainable Growth - CenterPoint Energy ...
Executive Kickoff

COMPANY PROFILE
                                                                              (1)                                                        Minnesota Gas                                                            MI
                                         Financial Statistics
                                                                                                                                                                                   MN
                                                                                                                                         Ohio Gas
                                                                                                                                                        (5)

      Stock Price $26.22                                Total Assets – $36B
                                                                                          (1)                                            Arkansas Gas
                                                                                                                                         Texas Gas
                                                                                                                                                                                                        WI
                                                                                                                                         Mississippi Gas
      Market Cap – ~$16B                                Non-GAAP Utility Net Income – $757M
                                                                                                                      (2)
                                                                                                                                          Houston Electric                                                                       MI

      Enterprise Value – ~$32B
                                                         Credit Rating – BBB / Baa2
                                                                                                     (3)
                                                                                                                                          Company HQ
                                                                                                                                          North Indiana Gas                              IA

      Payout Ratio – 55%                                                                                                                 Southern Indiana Gas & Electric
                                                                                                                                                          (5)                                                               IN
                                                                                                                                          Oklahoma Gas
                                                                                                                    (4)                                                                                                                    OH
   Electric Transmission & Distribution and Power Generation                                                                              Louisiana Gas                                                      IL
                                                                                                                                          Power generation

                               more than                                                                                                                                                      MO

                              2.7 million                                                 2 states
                                                                                                                                                                                                                                      KY

                                                                                                                                                                                              AR                       TN
                              METERED CUSTOMERS                                                                                                                        OK

                                                                                    (5)
                                   Natural Gas Distribution                                                                                                                                             MS

                                                                                                                                                                TX                            LA
                               more than

                              4.7 million                       (6)
                                                                                          8 states
                              METERED CUSTOMERS

Note: Refer to slide 2 for information on forward-looking statements and see slide 93 for information on non-GAAP measures, including Utility EPS, Utility net income, and respective assumptions. See slide 86 for a reconciliation of non-
GAAP Utility Net Income to its most directly comparable GAAP financial measure. See appendix for endnotes.

CenterPoint Energy Analyst Day – September 2021                                                                                                                                                                                                 3
PREMIUM Establishing a path towards - Through Sustainable Growth - CenterPoint Energy ...
Executive kickoff

Executive Kickoff
Dave Lesar
President and Chief Executive Officer

CenterPoint Energy Analyst Day – September 2021   4
PREMIUM Establishing a path towards - Through Sustainable Growth - CenterPoint Energy ...
Executive kickoff

OUR TEAM

               Dave Lesar *                                Kristie Colvin                              Scott Doyle *                    Lynne Harkel-Rumford                       Monica Karuturi
President and Chief Executive Officer            SVP and Chief Accounting Officer                     EVP of Natural Gas          SVP and Chief Human Resources Officer         SVP and General Counsel

                                    Gregory Knight *                        Kenny Mercado *                                Jason Ryan *                          Jason Wells *
                               EVP of Customer Transformation               EVP of Electric Utility                  SVP of Regulatory Services           EVP and Chief Financial Officer
                                   and Business Services                                                               and Government Affairs
* denotes today’s presenters

CenterPoint Energy Analyst Day – September 2021                                                                                                                                                           5
PREMIUM Establishing a path towards - Through Sustainable Growth - CenterPoint Energy ...
Executive kickoff

ANALYST DAY AGENDA

                      Time                        Event                                                     Presenter(s)

                     9:00 AM                      Executive kickoff                                         Dave Lesar

                     9:20 AM                      Integrating industry-leading Net-Zero commitments         Jason Wells

                     9:30 AM                      Investing in our utility businesses                       Kenny Mercado and Scott Doyle

                    10:00 AM                      Delivering clean & resilient services for our customers   Gregory Knight

                    10:10 AM                      Serving constructive regulatory jurisdictions             Jason Ryan

                    10:20 AM                      Path towards sustainable financial growth                 Jason Wells

                    10:35 AM                      Closing: Key takeaways                                    Dave Lesar

                                                                             Brief Intermission

                    10:45 AM                      Q&A Session                                               Management Panel

             12:00 PM – 2:00 PM                   Lunch and Breakout sessions at Hyatt Regency Houston      Various CenterPoint teams

CenterPoint Energy Analyst Day – September 2021                                                                                             6
PREMIUM Establishing a path towards - Through Sustainable Growth - CenterPoint Energy ...
Executive kickoff

YESTERDAY’S GREAT HEADLINES….

                                             8% Utility EPS Growth
                                                                                           (1)
                                                                                                   For 2021 (Top decile) (2)
                                        6% - 8% Utility EPS Growth                                 5-year annual growth (Top decile) (2)
                                                                   (1)

                                                                          $16B+                    2021 – 2025 Capital Plan
                                                                     10% CAGR (3)                  Rate Base Growth

                                Moving to a purely regulated utility                               Supporting a transaction to allow for future midstream exit (4)

               $300M ATM equity issuance over 5-year plan
                                   No block equity needs
                                                                                                   Utilizing asset sales to efficiently recycle capital for growth

                                                           1% - 2% YoY O&M
                                                                                                   Focusing on cost control with opportunity for reinvestments
                                                           Reduction Target (5)

                                                         1% - 2% annual avg
                                                                                                   Serving jurisdictions with organic customer growth
                                                          customer growth (6)

                                                                                                                                   ….THAT WE WILL IMPROVE UPON TODAY
Note: Refer to slide 2 for information on forward-looking statements and slide 93 for information on non-GAAP measures, including Utility EPS and Utility EPS assumptions. See appendix for endnotes.

CenterPoint Energy Analyst Day – September 2021                                                                                                                                                         7
PREMIUM Establishing a path towards - Through Sustainable Growth - CenterPoint Energy ...
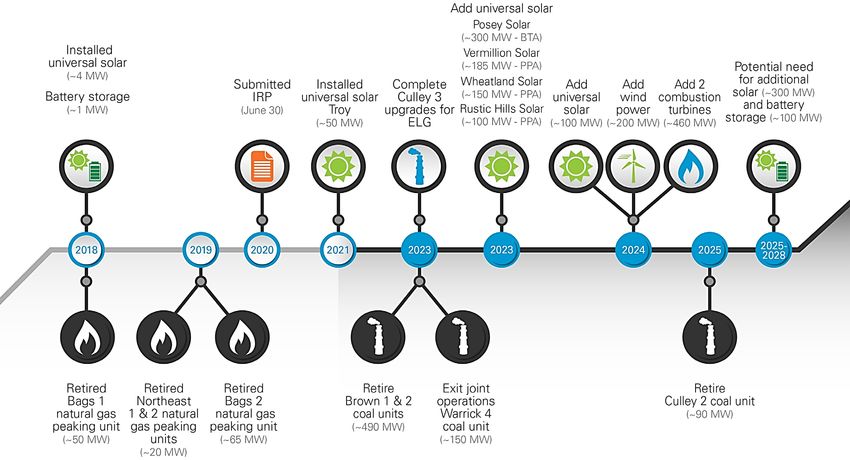
Executive kickoff

TODAY’S HEADLINES….

CenterPoint Energy Analyst Day – September 2021   8
PREMIUM Establishing a path towards - Through Sustainable Growth - CenterPoint Energy ...
Executive kickoff

HEADLINE 1 – INCREASING UTILITY EPS GROWTH GUIDANCE….

                                                                                                                                             8%
                                                                               Expected annual growth in 2021, 22, 23 and 24

                                                                                                                                 6% - 8%
                                                                                            Expected annual growth from 2025-30

                                                                  This would double Utility EPS and dividends in less than
                                                                                          10 years

                                                                 ….THIS IS TOP DECILE UTILITY EPS GROWTH FOR THE INDUSTRY                                                                               (1)

Note: Refer to slide 2 for information on forward-looking statements and slide 93 for information on non-GAAP measures, including Utility EPS and Utility EPS assumptions. See appendix for endnotes.

CenterPoint Energy Analyst Day – September 2021                                                                                                                                                               9
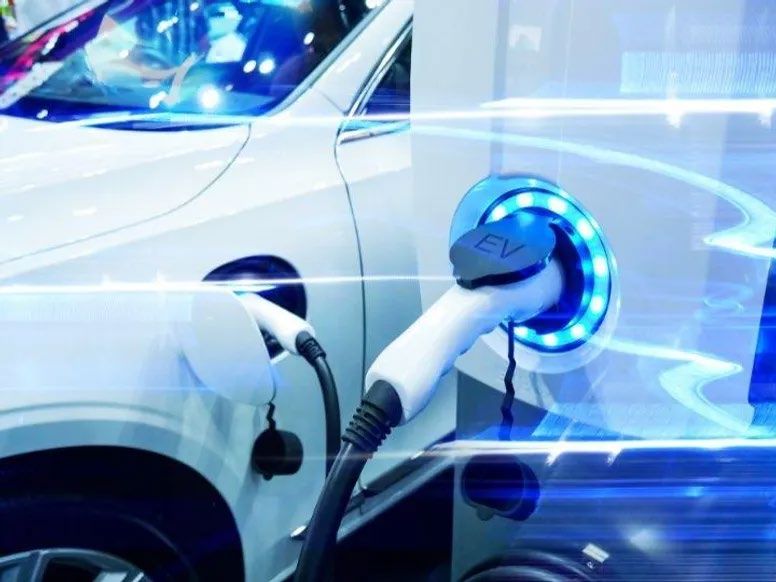
PREMIUM Establishing a path towards - Through Sustainable Growth - CenterPoint Energy ...
Executive kickoff

HEADLINE 2 – INCREASING CAPITAL INVESTMENT….

                                                                                           Increasing our current 5-year capital plan   (1)
                                                                                                                                              to
                                                                                                             $18B+
                                                                                                              from $16B+

                                                                                                    We are announcing today a new
                                                                                                             $40B+
                                                                                                       10-year capital plan      (2)

                                                                                                   ~$1B of additional reserve capital
                                                                                                        No spending cliff here

                                               ….TO CONTINUE TO INVEST IN SAFETY AND RESILIENCY OF OUR SERVICE
Note: Refer to slide 2 for information on forward-looking statements. See appendix for endnotes.

CenterPoint Energy Analyst Day – September 2021                                                                                                    10
Executive kickoff

HEADLINE 3 – NO EQUITY NEEDS TO FUND GROWTH….

                                                                                                               Announcing the
                                                                                                             elimination
                                                                               of our previously communicated $300M of ATM equity needs           (1)

                                                                                                                Announcing
                                                                                                   no external equity issuance
                                                                                                       for the full 10-year capital plan

                                                                                                                   Utilizing
                                                                                                                  >$3B
                                                                              of after-tax proceeds to efficiently fund growth and pay down debt (2)

Note: Refer to slide 2 for information on forward-looking statements. See appendix for endnotes.

CenterPoint Energy Analyst Day – September 2021                                                                                                         11
Executive kickoff

HEADLINE 4 - ELIMINATING MIDSTREAM EXPOSURE….

                                                                                                       We expect to exit midstream by
                                                                                                            end of 2022        (1)

                                                                                                   Announcing a contingent forward sale of
                                                                                                               50 million
                                                                                                       Energy Transfer common units

                                                                                                                 Anticipate
                                                                                                       >40% monetization             (1)

                                                                           by end of 2021, including Energy Transfer preferred units

                                                                                                           ….BECOMING A PURELY REGULATED UTILITY
Note: Refer to slide 2 for information on forward-looking statements. See appendix for endnotes.

CenterPoint Energy Analyst Day – September 2021                                                                                                    12
Executive kickoff

HEADLINE 5 – ANNOUNCING A NET-ZERO CARBON TARGET….

                                                                                                             Net Zero direct emissions by

                                                                                                                                        2035
                                                                     with clear and transparent steps across all jurisdictions,
                                                                                          no exclusions

                                                                                                                   An industry-leading goal

                                                                                                                           ~15           years
                                                                                                             ahead of the peer average           (1)

                                              ….THAT IS MORE AGGRESSIVE THAN OTHER UTILITIES WITH GENERATION
Note: Refer to slide 2 for information on forward-looking statements and slide 93 for Net Zero disclaimer. See appendix for endnotes.

CenterPoint Energy Analyst Day – September 2021                                                                                                        13
Executive kickoff

HEADLINE 6 – MAINTAINING A STRONG BALANCE SHEET….

                                                                                                                                 Plan supports

                                                                                                                      14% - 15%
                                                                                   long-term FFO/Debt                                          (1)
                                                                                                                                                     over the 10-year plan
                                                                                                                                 Starting in 2022

                                                                                                                Expect parent level debt at

                                                                                                                                    ~20%
                                                                                                                        by the end of 2022

Note: Refer to slide 2 for information on forward-looking statements and slide 93 for information on non-GAAP measures, including long-term FFO assumptions. See appendix for endnotes.

CenterPoint Energy Analyst Day – September 2021                                                                                                                                           14
Executive kickoff

HEADLINE 7 – MAINTAINING COST DISCIPLINE AND SERVING
GROWING REGIONS….

                                                                                                                   Plan maintains

                                                                                                                   1% - 2%
                                                                             Annual O&M               (1)
                                                                                                            reductions through continuous improvement

                                                                                                                   1% - 2%
                                                                                                    Organic annual customer growth       (2)

                                                                                                                   1% - 2%
                                                                                              Potential incremental load growth from EVs       (3)

                                                                                                   ….KEEPING SERVICE AFFORDABLE FOR CUSTOMERS
Note: Refer to slide 2 for information on forward-looking statements. See appendix for endnotes.

CenterPoint Energy Analyst Day – September 2021                                                                                                         15
Executive kickoff

OUR 10-YEAR FINANCIAL PLAN….
       Scenario assuming 2021E-2024E annual Utility EPS growth of 8% and 2025E-2030E annual Utility EPS growth of 7%

                                      Rate Base Growth                                                Utility EPS Growth                                       Dividend Growth

                                                                              ~$37B+                                                       $2.38 (1)                                                    $1.21 (1)
                                                                         2030E Rate Base                                             2030E Utility EPS                                    2030E Dividend per Share

                       ~$16B+                                                       $1.17                                                 $0.60 (2)
             2020 Ending Rate Base                                      2020 Ending Utility EPS                                2020 Dividend per Share

                                                                             ….IS A COMPELLING AND SUSTAINABLE VALUE PROPOSITION
Note: Refer to slide 2 for information on forward-looking statements and slide 93 for information on non-GAAP measures, including Utility EPS and Utility EPS assumptions. See appendix for endnotes.

CenterPoint Energy Analyst Day – September 2021                                                                                                                                                                      16
Executive kickoff

PREMIUM UTILITY BENCHMARK COMPARISONS….
                                                                                                                                                                                            CNP vs.
                                                                 Headline                        CenterPoint                            Premium Utilities
                                                                                                                                                                             (1)

                                                                                                                                                                                        Premium Utilities

                                               Utility EPS Growth
                                                                                  (2)
                                                                                                           8%                                         5 - 7%                                           Top

                                               Rate Base Growth
                                                                                  (3)
                                                                                                           9%                                         6 - 8%                                           Top

                               Dividend Per Share Growth
                                                                                  (4)
                                                                                                           8%                                         5 - 7%                                           Top

                                        External Equity Needs
                                                                                  (5)
                                                                                                           0%                                         0 - 5%                                        Among Top

                                                       Net-Zero Goal
                                                                                  (5)
                                                                                                         2035                                    2048 average                                          Top

                                                 Customer Growth
                                                                                  (6)
                                                                                                         1-2%                                          0-1%                                            Top

                                        Balance Sheet Metrics
                                                                                  (7)
                                                                                                         Baa2                                   Baa1 /Baa2                                           Inline

            ….HIGHLIGHTS COMPELLING GROWTH AND VALUE PROPOSITION FOR STAKEHOLDERS
Note: Refer to slide 2 for information on forward-looking statements and slide 93 for Net Zero disclaimer and information on non-GAAP measures, including Utility EPS and Utility EPS assumptions. “Premium Utilities” include AEE, CMS, LNT,
WEC, and XEL. See appendix for endnotes.

CenterPoint Energy Analyst Day – September 2021                                                                                                                                                                                                 17
Executive kickoff

OUR NEW PREMIUM VALUE PROPOSITION
10 YEAR PLAN
                                                                                      Delivering industry-leading Utility EPS growth of 8% annually through 2024 and
                                                                                                                (1)
                                                                                    6-8% annually through 2030 ; targeting Dividend growth in line with Utility EPS growth

                                                                               Increasing 5-year Capital plan to $18B+, and introducing 10-year Capital plan of $40B+,
                                                                                                 with more potential well beyond our 10-year horizon

                                                                                       Utilizing >$3B in proceeds; No external equity issuance planned through 2030

                                                                                          Executed contingent forward sale of Energy Transfer common units ; plan to
                                                                                                                                                                                                                   (2)

                                                                                                              accelerate future midstream exit

                                                                                  Industry-leading Net Zero direct emissions by 2035 target; nearly 15 years ahead of
                                                                                                                    peer average (3)

                                                                              Maintaining balance sheet health; long term FFO/Debt (4) target of 14%-15% through 2030

                                                                                                                                                                               (5)                                                         (6)
                                                                                Keeping rates affordable through maintained O&M                                                      discipline and customer growth

                                                                                     Becoming a Pure-play Regulated Utility with a consistent track record of delivery

Note: Refer to slide 2 for information on forward-looking statements and slide 93 for Net Zero disclaimer and information on non-GAAP measures, including Utility EPS and long term FFO/Debt and their related assumptions. See appendix for
endnotes.

CenterPoint Energy Analyst Day – September 2021                                                                                                                                                                                                  18
Executive kickoff

SERVING GROWING AND PREMIUM JURISDICTIONS….
                      Population Growth: 2010 to 2020 (1)                                                 ~56%+ of 2021E Rate Base Dedicated to Texas
                                                                                                       Houston is currently the 4th largest city in the U.S. and
                                                                                                         is the only one growing among the top 4 cities (1)

                                                                                                             Houston ranks #1 in diversity in the U.S. (2)
                                                                                                          Houston is home to 21 Fortune 500 companies
                                                 15%
                                                15.3%                                                     2nd only to New York and 2x as many as Dallas (3)
                                                                                                                                                            (4)
                                                                                                              – Hewlett Packard Enterprise and NRG Energy
                                                                                                                   relocated to Houston in the past year

                                               TX
                                                                                                    Texas Medical Center is the world’s largest medical center
                                              15.9%                                                 and on its own is the 8th largest business district in U.S. (5)

                                  Houston Electric                                                         Houston Electric customer growth projected to
                                  Company HQ                                                                         continue at 2% annually (6)
                                  Texas Gas

                                                                                                   Austin-San Antonio Corridor – one of the fastest-growing regions
                                                                                                   in the U.S. with 50%+ population growth expected by 2030 (7)

     ….ANCHORED BY STRONG MACRO DRIVERS IN THE GREATER HOUSTON AREA
Note: Refer to slide 2 for information on forward-looking statements. See appendix for endnotes.

CenterPoint Energy Analyst Day – September 2021                                                                                                                    19
Executive kickoff

SERVING GROWING AND PREMIUM JURISDICTIONS….
            Population Growth by State: 2010 to 2020 (1)                                                                ~30% of 2021E Rate Base Dedicated to IN + MN
                 MN                IN                                                                                        Minnesota’s population outgrew the U.S.
                 8%               5%                                                                                             average over the last decade(1)

                                                                                                                          Second to Minnesota, Indiana had the highest
                                                                                                                          population growth in the Midwest over the last
                                                                                                                                           decade (1)
                                                                                      Minnesota Gas
                                                                                                                        Minnesota’s and Indiana’s real GDP increased 7.5%
                                                                                      North Indiana Gas
                                                                                      Southern Indiana Gas & Electric
                                                                                                                        and 6.8%, respectively, in Q1 2021 compared to the
                                                                                                                                    U.S. growth rate of 6.4%(2)

                                                                                                                         Minnesota and Indiana are home to 42 Fortune
                                     MS
                                                             OH                                                                       500 Companies (3)
                                     -%
                       LA                                    2%
                       3%                                                                                                          Constructive regulatory jurisdictions
                                                                                      Ohio Gas                            All gas jurisdictions (except MN) passed legislation
                                                                                      Mississippi Gas
                                                                                                                                       to prohibit natural gas ban
                                                                                      Louisiana Gas

                     ….ANCHORED BY STRONG MACRO DRIVERS IN MINNESOTA AND INDIANA
Note: Refer to slide 2 for information on forward-looking statements. See appendix for endnotes.

CenterPoint Energy Analyst Day – September 2021                                                                                                                                  20
Executive kickoff

$40+ BILLION OF SUSTAINABLE CAPITAL INVESTMENTS OVER 10 YEARS….

                               ~$18+ Billion 5-Yr Capital Plan

                                                               ~$4.7
                                                                                                                                                                 ~$22 billion
$ in billions

                                     ~$3.8                                              ~$3.7
                ~$3.5                                                                                             ~$3.2

                2021E                2022E                     2023E                     2024E                    2025E                                           2026E – 2030E

          ….TO PROVIDE SAFE, RESILIENT, AFFORDABLE, AND CLEAN SERVICES FOR OUR CUSTOMERS
Note: Refer to slide 2 for information on forward-looking statements. Includes the effect of AR and OK gas LDCs dispositions expected to be completed by 2022.

CenterPoint Energy Analyst Day – September 2021                                                                                                                                   21
Executive kickoff

ESTABLISHING A PATH TOWARDS PREMIUM….
                                                                    Through Sustainable Growth

     Sustainable, resilient,
                                                                                                 Sustainable Positive
             and                                                        Sustainable Growth for
                                                                                                    Impact on our
      affordable service                                                    Shareholders
                                                                                                     Environment
        for Customers

                                                                                             ….FOR ALL STAKEHOLDERS
Note: Refer to slide 2 for information on forward-looking statements.

CenterPoint Energy Analyst Day – September 2021                                                                         22
Integrating industry-leading Net Zero Commitments

Integrating Industry-leading Net Zero Commitments
Jason Wells
Executive Vice President and Chief Financial Officer

CenterPoint Energy Analyst Day – September 2021        23
Integrating industry-leading Net Zero commitments

ESTABLISHING INDUSTRY-LEADING CARBON REDUCTION TARGETS
                          Scope 1 & 2 Emissions                                                                                                                    Scope 3 Emissions

                       Utility with generation to announce                                                                                                  Utility to announce Scope 3 carbon
  1st                  Net-Zero goal (Scope 1 & 2) by 2035
                      ~15 years ahead of peer average goals                                          (1)
                                                                                                                                      1st                   reduction goal by 2035 that applies
                                                                                                                                                                to all operating jurisdictions                                     (1)

                                          Net-Zero Carbon Target                                                                                                       Carbon Reduction Target
                 2025              2030             2035             2040              2045                2050                               2025              2030             2035             2040              2045             2050
             CNP                                                                                                                          CNP      20% - 30% reduction by 2035
           Peer A                                                                                                                       Peer A

           Peer B                                                                                                                       Peer B
                                                                                                                                        Peer C
           Peer C
                                                                                                                                        Peer D
           Peer D
                                                                                                                                        Peer E
           Peer E
                                                                                                                                        Peer F    35% reduction by 2050
           Peer F
                                                                                                                                        Peer G
           Peer G
                                                                                                                                        Peer H
           Peer H                                                                                                                        Peer I
            Peer I                                                                                                                       Peer J
            Peer J                                                                                                                      Peer K    Net Zero by 2050, excluding some businesses

Note: Refer to slide 2 for information on forward-looking statements and slide 93 for Net Zero disclaimer. See appendix for endnotes. See definitions for emission scopes on slide 85. Our Scope 2 estimates exclude Texas electric T&D assets
in the line loss calculation and exclude emissions related to purchased power between ’24E-’26E. Our Scope 3 estimates exclude the emissions of transport customers and emissions related to upstream extraction.

CenterPoint Energy Analyst Day – September 2021                                                                                                                                                                                                  24
Integrating industry-leading Net Zero commitments

ACCELERATE TO NET ZERO SCOPE 1 AND 2 EMISSIONS BY 2035….

                                                                                                ~60%                                                            ~40%
                                                                                      Actions Underway                                                   Future Actions
     5.2MM Annual MT
                                         (1)

               2020 Actual

                                                                          Retire coal units                  Retire coal unit                              Culley 3 coal unit
                                                                      AB Brown 1&2 and Exit                  Culley 2 by 2025                        to be addressed in the next IRP
                                                                     Warrick 4 coal unit by 2023

                                                                                                                                                                                                                 Net Zero
                                                                                                                                                                                                                  2035
                                                                                                                                                                                                                       (3)

                                                                      Coal retirements partially Modernize Pipe and Fleet;                                    Offsets and
                                                                      offset by gas CT plant in Enhance Leak detection                                     renewable credits
                                                                                2024 (2)

                                                                                                 ….THROUGH CLEAR AND TRANSPARENT STEPS
Note: Refer to slide 2 for information on forward-looking statements and slide 93 for Net Zero disclaimer. See appendix for endnotes. See definitions for emission scopes on slide 85. As Texas is in an unregulated market, our Scope 2
estimates exclude Texas electric T&D assets in the line loss calculation and exclude emissions related to purchased power between ’24E-’26E.

CenterPoint Energy Analyst Day – September 2021                                                                                                                                                                                            25
Integrating industry-leading Net Zero commitments

NET ZERO GOALS REQUIRES MINIMAL OFFSETS
Potential Scenario
       5.2 MM                                                                 Only ~10 -15% of net-zero goal is achieved through offsets or credits
      Annual MT
        of CO2
                                                                                                  Offset mechanism                                                                      % of 2035 Emission Balance

                                                                               ROW management and owned property                                                                                              ~30%
                                                                                       Ex: native plantings, pollinator habitat, etc.
                       ~85 - 90% of
                       reduction is
                       through active
                       measures                                                                 Forestry / Land Use                                                                                           ~50%
                                                                                              Ex: managed pine forests in MS

                                                                                            Examples of other credits

                                                                                   Energy Efficiency, Renewables (1)

                                                                                                                                                                                                              ~20%
                     ~10%-15%
                     reduction through
                     offsets                                                      Alternative Fuels (Hydrogen & RNG)
       0 MM MT
        of CO2
Note: Refer to slide 2 for information on forward-looking statements and slide 93 for Net Zero disclaimer. See appendix for endnotes. See definitions for emission scopes on slide 85. As Texas is in an unregulated market, our Scope 2 estimates
exclude Texas electric T&D assets in the line loss calculation and exclude emissions related to purchased power between ’24E-’26E.

CenterPoint Energy Analyst Day – September 2021                                                                                                                                                                                                      26
Integrating industry-leading Net Zero commitments

ESTABLISHING INDUSTRY LEADING SCOPE 3 EMISSION
REDUCTION BY 2035

   20MM Annual MT (1)                                                      Currently Underway                                                                    New Actions
          2021 Estimate

                                                                                                                                                                                                                           20%-30%
                                                                                                                                                                                                                           reduction
                                                                                                                                                                                                                              by
                                                                                                                                                                                                                             2035
                                                                Energy Efficiency       Hydrogen Pilots           Commercial                   RNG Offsets          High efficiency  New Technology
                                                                  Conservation              5-10%                 CCS Pilots                      20%                 appliances
                                                                                                                                                                                    Enhanced Hydrogen
                                                                  Improvement                                       1-5%                                             Demand side
                                                                                                                                                                     management       Further Offsets
                                                                    Programs
                                                                                                                                                                                           30%
                                                                      10%                                                                                           Weatherization
                                                                                                                                                                 Smart Home Programs
                                                                                                                                                                         25%
                20% - 30% reduction
                     by 2035 (2)

                                                                                               ….PRIMARILY UTILIZING EXISTING TECHNOLOGY
Note: Refer to slide 2 for information on forward-looking statements and slide 93 for Net Zero disclaimer. Interim target reductions as measured against 2020. See appendix for endnotes. See definitions for emission scopes on
slide 85. Our Scope 3 estimates exclude the emissions of transport customers and emissions related to upstream extraction.

CenterPoint Energy Analyst Day – September 2021                                                                                                                                                                                        27
Integrating industry-leading Net Zero commitments

COMMITMENT TO GOVERNANCE AND EXECUTIVE ALIGNMENT ON ESG

   Board ESG Oversight                                         Refreshed and Diversified Board           Establishing Independent Governance
   Governance committee will
     become Governance,
                                                                                                   55%            Newly established
                                                                            are women or minorities            Independent Chairman
      Environmental and
   Sustainability Committee
                                                                                                                    Now 1 of 7
                                                                                                   66%         Utilities in proxy peer group
                                                                                                                                               (1)

                                                                                                                   with Independent Chair
     Environmental measures                                        have been on the board 5 years
         to be included in                                                    or less
     2022 compensation plan

       VP of environment and
           sustainability

Note: Refer to slide 2 for information on forward-looking statements. See appendix for endnotes.

CenterPoint Energy Analyst Day – September 2021                                                                                                      28
Integrating industry-leading Net Zero commitments

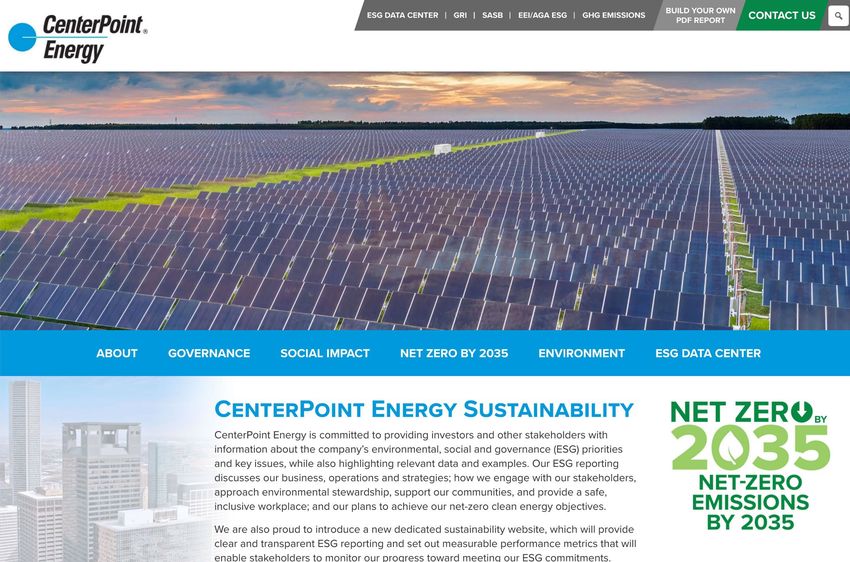
ENHANCED ESG COMMITMENTS AND OUR ESG REPORTING….
                                          What’s New
    Launched a dedicated ESG website to provide regular
    updates

    Enhanced engagements with ESG Ratings firms
                                           What’s Next
    Integrating emission reduction goals into executive
    compensation (2022)

    Progressing towards UN Sustainable Development
    Goal alignment as we develop a path for sustainable
    financing (2022)

    Implementing our Net Zero strategy will enable us to
    regularly report on our progress

                                                                        …. AS WE PROGRESS OUR ESG STORY
Note: Refer to slide 2 for information on forward-looking statements.

CenterPoint Energy Analyst Day – September 2021                                                           29
Investing in our Electric business

Investing in our Electric business
Kenny Mercado
EVP of Electric Utility

CenterPoint Energy Analyst Day – September 2021   30
Investing in our Electric business

PREMIUM JURISDICTIONS….
                                              Houston Electric                                                                                      Value Proposition

       TX                                                   ~2.6M Metered Customers
                                                            ~4,000+ mi of Transmission Line
                                                                                                                              Superior utility driven by $23B+
                                                                                                                                     of sustainable capital investments through 2030
                                                            55,000+ mi of Distribution Line
                                                            ~1/4 of ERCOT Summer Peak load                                            System Growth
                                                              Houston Electric
                                                              Company HQ                                                               System Reliability and Resiliency
                                               Indiana Electric                                                                        Renewable Integration
                                        IN                  ~150k Metered Customers                                          Constructive regulatory mechanisms
                                                            1,000+ mi of Transmission Line
                                                            7,000+ mi of Distribution Line
                                                                                                                              Strong, consistent O&M discipline
                                                            ~1,300 MW of Generation Capacity                                 Continued focus on safety and
                                                             Indiana Electric
                                                             Indiana electric HQ
                                                                                                                                     reliability

                                                       ….WITH FOCUS ON GROWTH, RESILIENCY, AND RENEWABLES
Note: Refer to slide 2 for information on forward-looking statements. Customer data as of June 30, 2021; Operational data as of December 31, 2020

CenterPoint Energy Analyst Day – September 2021                                                                                                                                        31
Investing in our Electric business

SUSTAINABLE CAPITAL INVESTMENTS
                      2021E-2030E: $23B+ of Capital                                                 Investments for Future State by 2030E

                                                   Other
                                                    4%                                                             ~$11 Billion
                                                                                                         System Growth and Improvement
                                                                                                      Supported by 2%+ Annual Customer Growth

                             Renewables +
                                                  (1)
                                                                                                                    $8 Billion+
                                 14%                                                                      System Resiliency and Reliability
                                                                   Growth /                         To Modernize, Harden, and Upgrade existing system
                                                              Customer Additions
                                                                     47%
                                                                                                                    $3 Billion+
                          Resiliency &
                           Reliability                                                              Clean Energy Investment and Enablement (1)
                              35%
                                                                                                          Integrating our Net-Zero Transition and
                                                                                                           Preparing for accelerated EV adoption

                                                                                                         ~$1 Billion – Technology and Misc.

                                                                                                   ….DRIVING A DECADE OF GROWTH
Note: Refer to slide 2 for information on forward-looking statements. See appendix for endnotes.

CenterPoint Energy Analyst Day – September 2021                                                                                                         32
Investing in our Electric business

~$11B TO ENABLE GROWTH AND ECONOMIC DEVELOPMENT….
                                                            2021E-2030E Capital Dedicated to Growth and Improvement

                    Transmission                                                                                          Distribution

                                                                                                                    32 new / 90 upgraded
                        ~230 MW                                                                                      substations for capacity by 2030
                                                      (1)
                  annual throughput growth

                                                                                                                        4,500+ miles
                      ~400 miles                                                                                      of new underground residential
                                                                                                                         distribution lines by 2030
              of new overhead transmission lines
                           by 2030
                       ~10% system growth                                                                               2,000+ miles
                                                                                                                 of new overhead distribution lines by 2030
                                                                                                                            ~3% system growth

                      ~600 miles
         of transmission capacity upgrades by 2030                                                                        ~400 miles
                                                                                                   Houston, TX     of upgraded distribution lines by 2030

                                                                              ….AND SUPPORT ~2% ANNUAL CUSTOMER GROWTH                                            (2)

Note: Refer to slide 2 for information on forward-looking statements. See appendix for endnotes.                                           Photo by South Austin Gallery

CenterPoint Energy Analyst Day – September 2021                                                                                                                            33
Investing in our Electric business

~$8B+ TO INVEST IN RELIABILITY AND RESILIENCY OF OUR SYSTEM….
   Upgrading T&D system to address                                                  Creating a smarter system to                      Executing on new tools enabled by
     extreme weather conditions                                                          improve reliability                                  recent legislation

                          280 miles                                                                     2.6 million                                     ~$1B
        transmission modernization and hardening                                      advanced meter upgrades and expanding                       capital opportunities
                                                                                                 intelligent grid
                       1,000 miles                                                 Enhanced status monitoring and management
                                                                                                                                                     500 MW
         distribution modernization and hardening                                                                                         emergency backup generation capacity
                                                                                          near customer delivery points

                                  120                                             Optimizing EMS to improve operational flexibility                  ~25 MW
                                                                                              during extreme events                                  battery storage
       resiliency and reliability substation upgrades

                        ~550 miles                                                                                                      3 transmission projects
   major underground modernization and hardening                                                                                             identified through economic test

  ….THROUGH HARDENING OF TRANSMISSION, SUBSTATION, AND DISTRIBUTION GRID
Note: Refer to slide 2 for information on forward-looking statements. EMS – Energy Management System.

CenterPoint Energy Analyst Day – September 2021                                                                                                                                  34
Investing in our Electric business

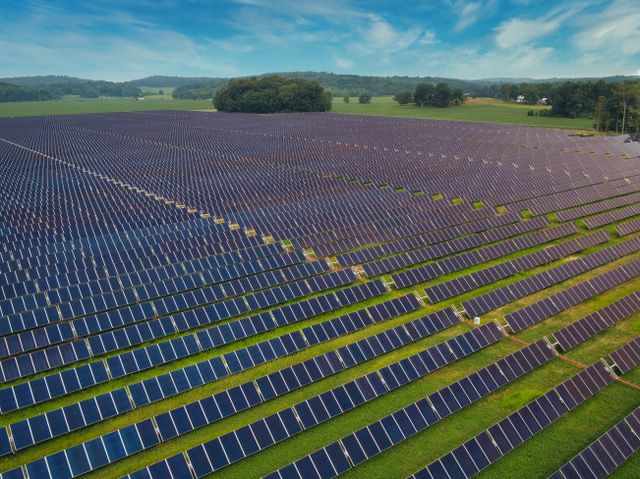
~$3B+ OF CAPITAL SUPPORTING CLEANER ENERGY DEMANDS….

                Direct
           Renewable                                                                   2035                               1.1 GW                                             Future
          Investments                                                       Net Zero Target                  Renewable Generation                        (1)
                                                                                                                                                               Integrated Resource Plan
Expanding renewable                                                            supported by renewable           targeted to be online by end of 2024 to          to address remaining coal facility and
                                                                               generation investments              support customers’ energy needs             further renewable opportunities in Indiana
   portfolio in Indiana

          Supporting
         Renewables                                                                $750M+                                       12                                              25+
         Investments                                                            Investments                  Utility-scale Solar Projects                            Storage Projects
Connecting renewable                                                         related to interconnects for            Currently under construction;                      currently evaluated for
generation in Houston                                                     renewables over 10-year horizon      expecting 10+ renewable projects in 2022                     2022 and 2023

            Long-term                                                            ~2M tons                                    ~$80                                             ~125k
           Investment
           Opportunity                                                      CO2 Emissions                          Additional Margin                                 Home Equivalent
                                                                                                                                                         (3)
                                                                         avoided    annually (2)
                                                                                           by electrifying     per vehicle per year due to load growth                annual electric usage from
      Supporting EV                                                        across our Houston territory                                                                     EVs by 2030
expansion in Houston

                                                                                                   ….DRIVE UTILITY INFRASTRUCTURE EXPANSION
Note: Refer to slide 2 for information on forward-looking statements. See appendix for endnotes.

CenterPoint Energy Analyst Day – September 2021                                                                                                                                                             35
Investing in our Electric business

FOCUSED AND DISCIPLINED APPROACH TO OPERATIONAL EXCELLENCE…
                                                                                                                                                              (2)
                             Continuous Improvement and O&M Efficiency Examples                                                       O&M per Customer

                               Actions                                                             Benefits
                                                                                                                               $240
                                                                                                                                      $235
                                                                                         Testing and inspection efficiency                   $225
    Continuous Improvement –                                                                                                                            $215
                                                                                         30%+ Truck rolls reduced for
         Major Underground and                                                                                                                                      $205
                                                                                          MUG maintenance (1)
         Substation maintenance process
                                                                                         60%+ Truck rolls reduced for
         improvement                                                                      substation maintenance (1)
                                                                                                                               2021E 2022E 2023E 2024E 2025E
    Capital Investments –                                                               Reduction in outage events
     Hardening and increased resiliency                                                  Reduction in equipment
    Continued Underground of T&D                                                         replacement                         Consistent 1st quartile O&M per
     System                                                                                                                      Customer performance               (3)

                                                                                                                                         (Houston Electric)

             ….USING CONTINUOUS IMPROVEMENT TO ACHIEVE OPERATIONAL EFFICIENCIES
Note: Refer to slide 2 for information on forward-looking statements. See appendix for endnotes.

CenterPoint Energy Analyst Day – September 2021                                                                                                                            36
Investing in our Natural Gas business

Investing in our Natural Gas business
Scott Doyle
EVP of Natural Gas

CenterPoint Energy Analyst Day – September 2021   37
Investing in our Natural Gas business

PREMIUM JURISDICTIONS WITH RUNWAY FOR GROWTH….
                                                     Gas LDCs                                                                                                       Value Proposition

                                         IN
                                                                                                                                Stable Growth Driven by $16B+
              MN
                                                     OH                                                                                of sustainable capital investments through 2030
                                                                                                                                Robust capital investments serving:
                                                             ~4.7mm Metered Customers                     (1)
                                                                                                                                       Modern resiliency needs
                                                             99,000+ mi of Distribution Mains (2)
                                                                                                                                       #1 Gas LDC by system miles                                   (4)

                           OK
                                        AR                   65,000+ mi of Service Lines (3)
                                                                                                                                       #2 Gas LDC by customer count                                       (4)

                    TX                  LA
                                                MS                Northern Indiana Gas
                                                                  Southern Indiana Gas
                                                                                                                                       Reducing carbon intensity
                                                                  Oklahoma Gas
                                                                  Louisiana Gas                                                       Constructive regulatory mechanisms
                                                                  Minnesota Gas
                                                                  Ohio Gas
                                                                  Arkansas Gas
                                                                                                                                      Strong, consistent O&M discipline
                                                                  Texas Gas
                                                                  Mississippi Gas
                                                                                                                                      Continued focus on safety and reliability
                                                                  Company HQ

                                                                                                          ….RESILIENT, RELIABLE, AND SUSTAINABLE
Note: Refer to slide 2 for information on forward-looking statements. Customer data as of July 31, 2021; Operational service data as of December 31, 2020 and main data as of August 24, 2021. See appendix for endnotes.

CenterPoint Energy Analyst Day – September 2021                                                                                                                                                                             38
Investing in our Natural Gas business

SUSTAINABLE CAPITAL INVESTMENT….
                       2021E-2030E Capital: $16B+                                              (1)
                                                                                                       Investments for Future State by 2030E
                             Peak Shaving and                               Smart Metering

                                                                                                                      $14 Billion+
                             Renewable Supply                                Technology
                                   2%                                            4%

                                                                 Growth /
                                                                                                       of System modernization / improvement
                                                                 Customer                            10,000+ miles of legacy steel / plastic pipe replacement
                                                                 Additions
                                                                    6%

                                                                                                                       $1 Billion+
                                                                                                     mains for new growth and customer additions

                                             System                                                                    $0.7 Billion
                                         Modernization
                                         & Improvement                                                         smart metering technology
                                              88%

                                                                                                                       $0.3 Billion
                                                                                                         peak shaving and renewable supply

          ….DRIVES GROWTH FOR SHAREHOLDERS, CUSTOMERS, AND ENVIRONMENT
Note: Refer to slide 2 for information on forward-looking statements. See appendix for endnotes.

CenterPoint Energy Analyst Day – September 2021                                                                                                                 39
Investing in our Natural Gas business

$14B+ FOR RESILIENCY AND SYSTEM MODERNIZATION….
                     Pipe Modernization Plan
Miles:            576                               1,045                                1,063
                                                                                                                                           Plan to
                                                                                                                  Average
                                                                                                                                     Eliminate
                                                                                                                 960                cast iron by 2024 &
 (% of total)

                                                                                                                                    bare steel by 2025
                                                                                                               miles/year for
                                                                                                               replacement            Pipeline Methane
                                                                                                                                         Emissions
                                                                                                                                     (thousand metric tons)

                                                                                                             >13,500                 626
                                                                                                                                              ~33% reduction

                                                                                                                                               534
                                                                                                           Miles replaced next 15                         361
                                                                                                            years;
Investing in our Natural Gas business

$1.7B+ OF CAPITAL FOR GROWTH AND IMPROVEMENTS….
                                                                                        2021E-2030E Capital Investments

      Supporting Customer Growth
                                                                                                                                                                  800+
                                #1                                                                                                                 Pipeline miles/ year for growth
       in customer count in MN                               (1)

                                                   (2)
                 1%+ growth in MN
                                                                                                                                                   Investments in Intelis Meters
                               #1                                                                                                                                  25%
        in customer count in IN (1)                                                                                                                              converted
                                                  (2)
                  1%+ growth in IN                                                                                                                           by year end 2025
                                                                                                                                                  Replacement schedule through
                                #2                                                                                          Minneapolis, MN

        in customer count in TX (1)                                                         Highly Efficient Heating Source
                                                                                                                                                                  2031
              2% growth in Houston (3)                                         95%+ efficiency in fuel conversion for home heating              Improving reliability, safety, emissions and customer
                                                                                                                                          (4)                          experience
         1%+ growth in S.TX corridor
                                                           (2)             compared to 30% efficiency derived from fossil fuel generation

                                                    ….PROVIDING SAFE AND RELIABLE SERVICE FOR CUSTOMERS
Note: Refer to slide 2 for information on forward-looking statements. See appendix for endnotes.

CenterPoint Energy Analyst Day – September 2021                                                                                                                                                         41
Investing in our Natural Gas business

SUPPORTING CLEANER ENERGY DEMANDS….
                                                        Driving a Cleaner Natural Gas System and Reducing Carbon Intensity

                                                                                                                                                       H2

                                   Natural Gas Innovation Act (MN)                                                                          Hydrogen Pilot (MN)
                                                                                                                                 1MW Green Hydrogen pilot by 4Q 2021
                                         Pathway for next generation fuels
                                                                                                                                 2 projects under review
                                         Innovation Plan to be submitted 2022
                                                                                                                                 System can accommodate 5-10% Hydrogen

                                                  Fleet Electrification                                                                  RNG (MN, IN, & TX)
                                        Plan to electrify 100% of our light fleet                                                  Feed in tariff (MN)
                                                  (1)
                                         by 2030                                                                                    5+ projects under review

              ….ALIGNING CARBON REDUCTION STRATEGY WITH CAPITAL INVESTMENTS
Note: Refer to slide 2 for information on forward-looking statements. See appendix for endnotes. RNG – Renewable Natural Gas.

CenterPoint Energy Analyst Day – September 2021                                                                                                                           42
Investing in our Natural Gas business

CONTINUOUS IMPROVEMENTS….
                                                                                                                                           (2)
                         Continuous Improvement Examples                                                                O&M per Customer

                             Actions                                          Benefits
                                                                                                          $160
  and Inspection

                    Align inspection                                 Reporting                                     $150
   Meter Testing

                                                                                                                              $145         $140
                     procedure with                                    processing time                                                                 $135
                     best practices                                   15%+ Truck rolls (1)
                    Standardize
                     processes
                                                                                                          2021E      2022E    2023E        2024E       2025E
                    Enhance safety                                   Leak response
  Intelis Meter

                     feature                                           time
   Technology

                     (Auto-shutoff)                                   Service disruption
                    Incorporate remote  50-75%(3) Truck
                     shutoff feature                                                                             Consistent 1st quartile O&M per
                                          rolls
                                                                                                                    Customer performance         (4)

                                                                                                   ….REDUCE O&M AND BENEFIT CUSTOMERS
Note: Refer to slide 2 for information on forward-looking statements. See appendix for endnotes.

CenterPoint Energy Analyst Day – September 2021                                                                                                                43
Delivering clean, resilient and affordable services for our customers

Delivering Clean, Resilient and Affordable Services for our Customers
Gregory Knight
EVP of Customer Transformation and Business Services

CenterPoint Energy Analyst Day – September 2021                         44
Delivering clean, resilient & affordable services for our customers

INVESTING FOR THE FUTURE….
  A premium utility is critical to meet the evolving
  needs and aspirations of a thriving community.
  It’s willing to make the investment and be the enabler
  that drives the future.
  A future that is:
   Sustainable
   Resilient
   Equitable
   Affordable
  A Community Where People & Businesses Want To:
   Live
   Work
   Play
   Invest

CenterPoint Energy Analyst Day – September 2021                       45
Delivering clean, resilient & affordable services for our customers

MEETING THE EVOLVING NEEDS OF OUR CUSTOMERS & COMMUNITIES…
           Drive Sustainability
                                                                   Resilient Now
      and Equitable Economic Growth                                                                Drive Affordability and Safety
                                                                                                          with Innovation

   Supporting energy transition                         Foundational Partnership               Digital transformation and automation
   Equitable economic development                       Developing first Energy Master Plan    Creating a more agile workforce

                                                  …. WITH SAFE, CLEAN, RESILIENT & AFFORDABLE ENERGY
CenterPoint Energy Analyst Day – September 2021                                                                                           46
Delivering clean, resilient & affordable services for our customers

CUSTOMERS EXPECT CENTERPOINT ENERGY TO LEAD…

              Green Fuels                                                   Renewables                   Gas Conservation       Electric Vehicles
    Target Innovation plan                                               >1GW by 2024                       Programs            3500% anticipated
                                                                                                   (1)

            in 2022                                                                                      $19.5M customer bill   growth in adoption
   1st Hydrogen pilot in 2021                                                                              savings in 2020            by 2030
                                                                                                                                   in Houston
                                                                                                                                              (2)

                            H2

                               OVER 7 MILLION CUSTOMERS ACROSS OUR FOOTPRINT                                                         (3)

                                                                            …. IN THE TRANSITION TO CLEAN ENERGY SOLUTIONS
Note: Refer to slide 2 for information on forward-looking statements. See appendix for endnotes.

CenterPoint Energy Analyst Day – September 2021                                                                                                      47
Delivering clean, resilient & affordable services for our customers

COLLABORATING FOR THE FUTURE: METRO – 100% ZERO EMISSION BUS
PROCUREMENT BY 2030

 CenterPoint Energy is developing a targeted 10-year energy
  and infrastructure plan in support of METRO’s 2030 goal
 Established one of the strongest commitments to electrification
  in the nation, anticipated to result in 120 MW load
 Currently over 1,250 buses, expected to grow to 1,500 by 2030
                                                                                                   (1)
 1/3 of all Downtown employees rely on METRO daily
                                                                (1)
 Over 110 million rides annually
                                                                (1)
 Serving over 1,303 square miles                                                                        “The future success of METRO and Houston’s
                                                                                                         transition to a sustainable and resilient future is
                                                                                                         dependent upon CenterPoint Energy’s partnership.”
                                                                                                            Tom Jasien, METRO Deputy Chief Executive Officer

Note: Refer to slide 2 for information on forward-looking statements. See appendix for endnotes.

CenterPoint Energy Analyst Day – September 2021                                                                                                                48
Delivering clean, resilient & affordable services for our customers

COLLABORATING FOR THE FUTURE: MINNESOTA AND INDIANA

                   Largest university system in Minnesota                                                   Fortune 500 Global Manufacturer
                                                                                                             Headquartered in Evansville, IN
                      Carbon neutrality by 2050
                                                                                                                      25% by 2025
               attained through multiyear project to install                                           Goal to reduce Greenhouse Gas emission
                                                                                                                                              (2)

                        high-efficiency equipment
                                                                                                               1.1 GW renewable generation
                       ~$5.4 million or 1 million Dth                                              aligns with commercial customers sustainability goals
                     saved in natural gas cost annually
                                                        (1)
                                                                                                                       in the region
                                   8,900 cars removed
                                        equivalent

Note: Refer to slide 2 for information on forward-looking statements. See appendix for endnotes.

CenterPoint Energy Analyst Day – September 2021                                                                                                            49
Delivering clean & resilient services for our customers

BUILDING FOR THE FUTURE

CenterPoint Energy Analyst Day – September 2021           50
Serving constructive regulatory jurisdictions

Serving Constructive Regulatory Jurisdictions
Jason Ryan
SVP of Regulatory Services and Government Affairs

CenterPoint Energy Analyst Day – September 2021     51
Serving constructive regulatory jurisdictions

COMMITMENT TO PROVIDING AFFORDABLE ELECTRIC SERVICE….
               Historic rates have remained affordable…                                                      …and we believe future rates will too

      5 Year Average TX                                                        Historical
    Electric Bill Change
                         (1)
                                                                              Bill Mitigants

                                          2.2%
                        0.9%                                      Transition Bond II and III
                                                                      ended in 2019                             Customer
                                                                                                                 Growth
                                                                  Expiration of AMS meter          Rates      1-2% annual
                                                                                                                customer       Structural
                                                                      deployment surcharge         (Based
                                                                                                                  growth       Headroom
    (4.0%)                                                                                         on new
                                                                                                                                CEHE’s           O&M
                                                                                                   capital       EV-driven
                                                                                                                load growth  Securitization   Discipline
      CNP               TX             Inflation                                                    plan)                   bonds ending (2) 1-2% O&M
                      Electric                                                                                                                                Effective
                                                                                                                             ~8% reduction of reduction (3)
                       Utility                                                                                                 vol. charge                     Rates
                       Peers                                                                                                                    per year

   Houston Electric rate growth has been below peer average
                        over last 5 years

                            ….EXECUTING $40B+ CAPITAL PLAN WITH MINIMAL CUSTOMER IMPACT
Note: Refer to slide 2 for information on forward-looking statements. See appendix for endnotes.

CenterPoint Energy Analyst Day – September 2021                                                                                                                           52
Serving constructive regulatory jurisdictions

COMMITMENT TO PROVIDING AFFORDABLE NATURAL GAS SERVICE….
        Historically
                                                                                                   ……and we believe future rates will be too
    affordable rates …

          Average Historic                                                   Impact of
           Monthly Gas
                       (1)
                                                                         Natural Gas Price

                                               $73.9
                                                                50% hedged supply in 2021
                                             $40.9
                                                                                                                          Customer
                                                                Forward price projected                        Rates      Growth
                                                                    lower; Mid $3-range by                     (Based    1-2% annual
                                                                                                               on new     customer
                                                                    mid-2022 (3)                                                         O&M
                                                                                                               capital      growth     Discipline
                                                                                                                plan)
                                                                                                                                        1-2% O&M        Effective
                                                                                                                                                  (4)
                                                                                                                                       reduction         Rates
    2009          2014         2019          2021   (2)
                                                                                                                                         per year
                        TX           MN

       Average Gas bills have
        remained affordable

                             ….EXECUTING $40B+ CAPITAL PLAN WITH MINIMAL CUSTOMER IMPACT
Note: Refer to slide 2 for information on forward-looking statements. See appendix for endnotes.

CenterPoint Energy Analyst Day – September 2021                                                                                                                     53
Serving constructive regulatory jurisdictions

CONSTRUCTIVE SOLUTIONS….

                                              ~80%                                                   Regulatory Highlights              Stakeholder Benefits
of 10-year Capital plan recoverable through interim mechanisms (1)

                              Traditional                                                                  Existing Mechanisms          Reasonable cost recovery
                  Rate case rate case                                                                      for timely recovery of       minimizes customer impact
                 with forward    ~5%
                   test year                                                                                 major storm costs            and earnings volatility
                      ~10%
          Interim
       mechanisms                                                                                          New Winter storm cost Reasonable cost recovery
        with CPCN
         required (2)                                                                                       recovery initiated in all   minimizes customer impact
            ~5%                                                                                                impacted states            and earnings volatility

                                              Interim (3)
                                            Mechanisms (2)
                                                                                                            Generation transition
                                               ~80%                                                                                      Clean energy transition
                                                                                                            proceedings in Indiana
                                                                                                                                          good for communities
                                                                                                                   on plan

                                                                                                   ….FOR OUR CUSTOMERS AND INVESTORS
Note: Refer to slide 2 for information on forward-looking statements. See appendix for endnotes.

CenterPoint Energy Analyst Day – September 2021                                                                                                                     54
Serving constructive regulatory jurisdictions

INNOVATIVE POLICY FOR RESILIENT AND CLEAN SERVICES….
                                                              Legislative Highlights Supporting Pillars of ESG

                          Texas                                                 Indiana                    Minnesota                  Gas Jurisdictions
                                                                                                                                            (Except MN)

                   Use of emergency
                   generation

                   Procurement of long
                   lead-time items for
                   widespread outages
                                                                    Securitization of unrecovered Natural Gas Innovation Act      Law prohibiting natural gas
                   Use of battery storage                           rate base related to transition facilitates developments of   bans by municipalities and
                                                                    from coal                       clean energy resources such   local governments
                   New transmission                                                                 as renewable natural gas
                   through economic                                                                 (RNG), hydrogen, and carbon
                   justification                                                                    capture to benefit our
                                                                                                    customers
                “S”ocial benefit                                        “E”nvironmental benefit      “E”nvironmental benefit            “S”ocial benefit

                                                           ….SUPPORTS A SUSTAINABLE $40B+ 10-YEAR CAPITAL PLAN
Note: Refer to slide 2 for information on forward-looking statements.

CenterPoint Energy Analyst Day – September 2021                                                                                                                 55
Sustainable financial growth

Sustainable Financial Growth
Jason Wells
Executive Vice President and Chief Financial Officer

CenterPoint Energy Analyst Day – September 2021        56
Sustainable financial growth

SUSTAINABLE FINANCIAL GOALS….

                           Earnings per Share                                                                                                        Efficient Financing
                 Reaffirming 2021E Utility EPS Guidance:                                                                        Utilizing $3B+ of expected after-tax proceeds
                              $1.25 - $1.27                                                                                          to fund growth and paydown debt (1)
                Establishing 2022E Utility EPS Guidance:                                                                        Eliminating planned external equity issuance
                              $1.35 - $1.37
                                                                                                                                     through 2030
                   Targeting 8% Utility EPS annual growth
                               through 2024
                                                                                                                                Maintaining targeted Long term FFO/Debt
                                                                                                                                     of 14% - 15% through 2030      (2)

             Targeting 6% - 8% Utility EPS annual growth
                            through 2030

  Targeting Dividend growth in line with Utility EPS growth

                                                               ….TO DELIVER 10-YEAR $40B+ CAPITAL INVESTMENT PLAN
Note: Refer to slide 2 for information on forward-looking statements and slide 93 for information on non-GAAP measures, including Utility EPS, Long term FFO/Debt and their assumptions. Includes the effect of AR/OK LDCs disposition
expected to be completed by end of 2021. See appendix for endnotes.

CenterPoint Energy Analyst Day – September 2021                                                                                                                                                                                          57
Sustainable financial growth

COMMITTED TO FULLY EXITING MIDSTREAM ….                                                                              (1)

                50 million                                                                          >40%                     End of 2022
                                                                                                  monetization
        Contingent forward sale                                                          Anticipated by end of 2021        Target exit of midstream
          of Energy Transfer                                                                                                  Moving to purely
             common units                                                                   including ~$370M of Energy         regulated utility
                                                                                              Transfer preferred units
      25% of CNP’s ownership in
     Energy Transfer common units

                                                                              ….MOVING TO A PURELY REGULATED UTILITY BY 2022
Note: Refer to slide 2 for information on forward-looking statements. See appendix for endnotes

CenterPoint Energy Analyst Day – September 2021                                                                                                       58
Sustainable financial growth

$40+ BILLION OF SUSTAINABLE CAPITAL INVESTMENTS….
               $ in billions

                               ~$18+ Billion 5-Yr Capital Plan                                                                  ~$22 Billion                                                Capital Recovery

                                                          ~$4.7

                                      ~$3.8                                      ~$3.7                                                                              $16B+
                ~$3.5                                        $1.9                                                                                                  10-year
                                                                                                       ~$3.2                       ~$9 billion
                                                                                                                                                                     Gas
                                       $1.4                                       $1.4

                                                                                                                                                                                                ~80%
                 $1.4                                                                                                                                               Capital
                                                                                                        $1.5
                                                                                                                                                                                              of 10-year Capital plan
                                                                                                                                                                   $23B+                    recoverable through interim
                                                            $2.8                                                                                                   10-year                        mechanisms
                                                                                                                                                                                                               (1)

                                      $2.4                                        $2.3                                            ~$13 billion
                 $2.1                                                                                                                                              Electric
                                                                                                       $1.7
                                                                                                                                                                   Capital

               2021E                 2022E                 2023E                2024E                 2025E
                                                                                                                                 2026E – 2030E
                                                     Gas                            Electric

  ….TO PROVIDE SAFE, RESILIENT, AFFORDABLE, AND CLEAN SERVICES FOR OUR CUSTOMERS
Note: Refer to slide 2 for information on forward-looking statements. Includes the effect of AR and OK gas LDCs dispositions expected to be completed by 2022. See appendix for endnotes.

CenterPoint Energy Analyst Day – September 2021                                                                                                                                                                           59
Sustainable financial growth

EFFICIENTLY FUNDING INDUSTRY-LEADING GROWTH….
                                                           No Planned External Equity Issuance Needed through 2030

                                    Funding Incremental Capital                                                          Funding Capital
                                          2021E – 2025E                                                                   2026E – 2030E

                  ~$2.3B                                                                              ~$22B
           ~$0.3B                                                                                                   Parent Debt
         Eliminated            ~$0.3B           Incremental Gas LDC Proceeds                                        In line with ~20% parent to total debt
            ATM

                                                                                     (1)
                               ~$0.5B           Midstream Exit and Other
                                                                                                                    Regulatory Debt
                                                                                                                    In line with authorized capital structure
                                                New Cash Flow Opportunities
                               ~$0.5B            Cash savings from repairs tax
                                                 Indiana coal securitization
         + ~$2B

                               ~$1.0B
                                                                                                                    Operating Cash Flows
                                                Regulatory Debt                                                     Not contingent on incremental strategic opportunities

           Uses              Sources                                                               Uses   Sources

                                               ….FOR THE BENEFIT OF OUR SHAREHOLDERS AND CUSTOMERS
Note: Refer to slide 2 for information on forward-looking statements. See appendix for endnotes.

CenterPoint Energy Analyst Day – September 2021                                                                                                                             60
Sustainable financial growth

2021E-2030E RATE BASE GROWTH….
$ in billions
                                                                                                                                                                (1)
                                                                           ~9% Rate Base CAGR over 10-Year Plan

                                                                                                                                                                                            Rate Base projection
                                                                                                           $37B+ Rate Base by 2030                                                                 2021E

                                                                                $27.3                                                                                                             42%
                                                             $25.4                                                               ~$15BE                                                                    58%
                                           $22.6                                                                                     by 2030
                         $19.7                                                  $10.5
       $18.5                                                   $9.6
                                            $8.4                                                                                                                                                   2030E
                          $7.4
        $7.8
                                                                                                                                                                                                  40%

                                            $14.1             $15.8             $16.8                                            ~$22BE                                                                    60%
       $10.8             $12.3                                                                                                       by 2030

      2021E             2022E             2023E              2024E             2025E
                                                                                     Electric                                         Natural Gas

                                                             ....DELIVERING SUSTAINABLE INDUSTRY-LEADING GROWTH
Note: Refer to slide 2 for information on forward-looking statements. Includes the effect of AR and OK gas LDCs dispositions expected to be completed by 2022. See appendix for endnotes.

CenterPoint Energy Analyst Day – September 2021                                                                                                                                                                    61
Sustainable financial growth

INITIATING 2022E UTILITY EARNINGS GUIDANCE….
                                                                                                       $0.02 – $0.03
                                                                       $0.03 – $0.04
                                       $0.07 – $0.08
                                                                                                                                            $0.02
                                                                                                                                                                                                         2021E: Baseline
                                                                                                                                                                                                          Utility EPS of
                                                                                                                                                                                                          $1.25 - $1.27
                                                                                                                                                                                                         2022E: Initiating
                                                                                                                                                                                                          Utility EPS of
                                                                                                                                                                                                          $1.35 - $1.37
    $1.25 - $1.27                                                                                                                                                    $1.35 - $1.37
                                                                                                                                                                                                         8% Utility EPS
                                                                                                                                                                                                          annual growth
                                                                                                                                                                                                          through 2024E
                                                                                                                                                                                                         6% - 8% Utility EPS
                                                                                                                                                                                                          annual growth
                                                                                                                                                                                                          through 2030E

                                                                                                                           (4)
   FY 2021 non-GAAP                Net growth and rate                One-time items                  O&M reductions                Sale of AR&OK gas               FY 2022 non-GAAP
       Utility EPS                        relief (2)                    in 2021 (3)                                                        LDCs                         Utility EPS

                                                                                                                                      ….ACHIEVABLE AND SUSTAINABLE
Note: Refer to slide 2 for information on forward-looking statements and slide 93 for information on non-GAAP measures, including Utility EPS and Utility EPS assumptions. See appendix for endnotes.

CenterPoint Energy Analyst Day – September 2021                                                                                                                                                                                 62
Sustainable financial growth

A PREMIUM DIVIDEND GROWTH STORY…

                                                                                         8%        6%-8%   6%-8%
                                                                                                                   5%-7%     5%-7%          5%-7%   5%-7%
                           Peer leading

                            8%
               Dividend per share growth
                 target through 2024E
                  6-8% through 2030E

                                                                                                                                      (1)
                                                                                CenterPoint                   Premium Utility Peers

                                               ….DRIVING COMPELLING TOTAL RETURNS FOR SHAREHOLDERS
Note: Refer to slide 2 for information on forward-looking statements. See appendix for endnotes.

CenterPoint Energy Analyst Day – September 2021                                                                                                             63
Sustainable financial growth

UPDATED FINANCIAL PLAN….
   2020 Analyst Day                                                                                                                                                         2021 Analyst Day
                               forecast                                                                                                                                                        forecast

                          $16B+                                                                                    +$2B                                                                   $18B+
                 5-year Capital Plan                                                                                                                                              5-year Capital Plan

                          ~$25B                                                                                    +$2B                                                                   ~$27B
                   2025E Rate Base                                                                                                                                                 2025E Rate Base

                $0.40 (at 6%)                                                                           +$0.12 to +$0.15                      (1)                            $0.52 - $0.55
       2020 - 2025E Utility EPS Growth                                                                                                                            2020 - 2025E Utility EPS Growth

                                                                                                                                                       ….A MARKED IMPROVEMENT
Note: Refer to slide 2 for information on forward-looking statements and slide 93 for information on non-GAAP measures, including Utility EPS and Utility EPS assumptions. See appendix for endnotes.

CenterPoint Energy Analyst Day – September 2021                                                                                                                                                           64
Closing – Key takeaways

Closing – Key Takeaways
Dave Lesar
President and Chief Executive Officer

CenterPoint Energy Analyst Day – September 2021   65
You can also read