Efficient Household Appliances: A field study of the contribution of appliance replacement and consumer behaviour to reducing energy use
←
→
Page content transcription
If your browser does not render page correctly, please read the page content below
Efficient Household Appliances:
A field study of the contribution of
appliance replacement and consumer
behaviour to reducing energy use

Research Study Report

Prepared by Professor Matthew Leach, Dr Michael Peters and Dr Shane Fudge
Centre for Environmental Strategy, University of Surrey

October 2012
TABLE OF CONTENTS

Executive Summary______________________________________________ 1
1 Introduction____________________________________________________ 2
  1.1 Aims and objectives________________________________________________ 3
     1.1a Duration of the study ____________________________________________________ 3
  1.2 Methodology______________________________________________________ 3
     1.2a The study sample ______________________________________________________ 3
     1.2b Monitoring equipment____________________________________________________ 4
     1.2c Mid-point interventions___________________________________________________ 5

2 Results________________________________________________________ 6
  2.1 Results from the initial site visit interviews____________________________ 6
     2.1a Environmental and Energy Behaviour_______________________________________ 6
     2.1b Environmental and Energy Attitudes________________________________________ 8
     2.1c Household Appliances__________________________________________________ 11
  2.2 Results from the monitored data_ ___________________________________ 16
     2.2a Appliance usage_______________________________________________________                                       16
     2.2b Effect of household occupancy___________________________________________                                     17
     2.2c Appliance electricity use_________________________________________________                                   18
     2.2d Energy saving practices_________________________________________________                                     21
  2.3 Supplementary qualitative data_ ____________________________________ 22

3 Conclusions and Post-Study Reflections__________________________ 24
  3.1 Conclusions_____________________________________________________ 24
  3.2 Post-study reflections_____________________________________________ 25

References_____________________________________________________ 27
Acknowledgments_______________________________________________ 27

Appendix 1: Household and respondent characteristics_______________ 28
Appendix 2: Appliance use and practices questionnaire _______________ 30
Appendix 3: Degree of stated knowledge by household _______________ 38
Appendix 4: Datasheets for monitored energy consumption____________ 40

This study was sponsored by the Association of Manufacturers of Domestic
Appliances (AMDEA). Replacement appliances were provided by AMDEA members:
Bosch, Indesit, Hoover Candy, Miele, Smeg and Whirlpool

Subjects presented in the photography in this report include participants in the research study undertaken by the University
of Surrey. Appliances shown in the photographs include new models given to the participants by AMDEA for trialling as part
of the study. For reasons of academic research anonymity all participants are bound under the University of Surrey’s Ethics
Committee regulations and cannot be named. The images are the property of AMDEA.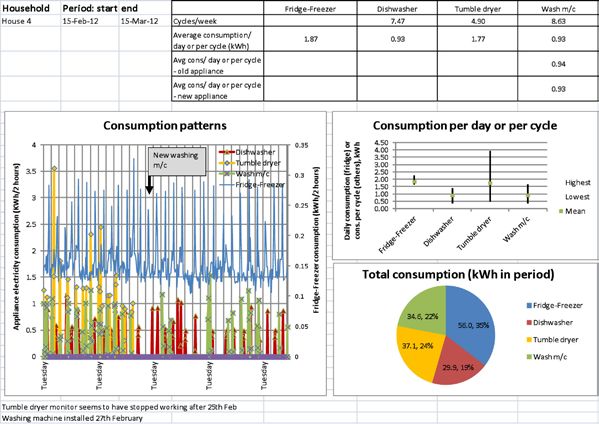
EXECUTIVE SUMMARY

This research project involved a four-month study of five households in the
Borough of Woking in order to ascertain what the role and interrelationship
between technology and education might be in driving more energy efficient
consumer use of modern domestic electrical appliances.

Energy consumption and user behaviour were monitored and a selection
of the appliances replaced with newer models that were rated to have lower
energy usage.

The research had three complementary objectives: (1) Assessing the inherent
energy efficiency of the appliances; (2) Exploring opportunities to use
energy-saving features; and (3) Investigating opportunities and challenges to
changing habits and practices around particular appliances.

In all instances of appliance replacement, savings in energy use were achieved:
fridge-freezer (and combined fridge plus freezer) replacement yielded savings
between 39% and 66%; for dishwashers and washing machines the savings
were between 8% and 21%; and 39% was saved for a tumble-dryer.

The study identified some disconnects between largely pro-environmental
attitudes, and both stated behaviours and appliance usage - some of which
are not currently maximising efficiency. This was qualified, in part, by a range
of practical issues (effectively ‘barriers’) that in the consideration of some
participants, limits their ability to use certain appliances in more energy
efficient ways, e.g. disability, old age, young children etc.

In the ‘test week’ participants carried out a range of previously untested
energy-efficient appliance practices. It became apparent that some of those
barriers could in fact be quite easily overcome, with results that exceeded
the expectations of some participants. For example, changing to a lower
temperature wash, with an appropriate detergent, yielded reductions in energy
use for washing machines of between 35% and 59% and for dishwashing
of 19% to 34%. It should be noted that the cleaning results for one of the
dishwashers were unsatisfactory; however this appliance was 8 years old.

Overall, replacement of an existing appliance with a new energy-efficient
model in all cases yielded improvement in terms of energy consumption.
Changed practices in most cases also enabled reduced energy consumption
with both existing and newer appliances.

We postulate, therefore, that even greater savings are possible by combining
some behavioural change with the purchase and use of new energy-efficient
appliances: a case measured in this study, for example, showed combined
savings of 48% when a 14+ year-old washing machine was replaced, and
a low temperature wash and premium brand detergent were used. A larger
study would be required to explore this area further, allowing incorporation of
control groups and segmentation of the trial.

                                       1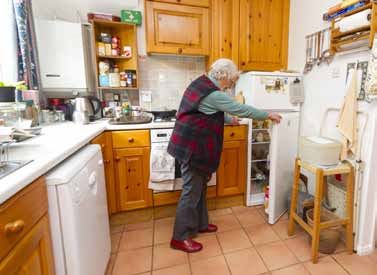
1. INTRODUCTION
This project involved a small scale study of the use and practices around white
domestic appliances in five UK households. The relevance of the study relates to the
fact that domestic energy use is responsible for approximately 31% of total primary
energy consumption in the UK and 27% of total direct carbon dioxide emissions
nationally (House of Commons, 2009; DECC 2011). Eighty-two percent of this total
was accounted for by space and water heating with the remaining 18% attributable
to energy used for lighting and appliances (DECC, 2011). This poses a particular
dilemma for the government as it strives to meet rising housing demand with
increasingly stringent environmental targets. In addition, an increase in incidence of
fuel poverty can be linked to a doubling of electricity prices between 2004 and 2010.

Whilst there have been considerable increases in the energy efficiency of domestic
appliances over the last ten years, the ‘rebound effect’ means that this has not
necessarily resulted in a decrease in their overall energy consumption with much of
the money and energy that is ‘saved’ being ‘spent’ elsewhere.

One approach to increase consumer awareness regarding the energy (in)efficiency
of appliances (as well as to encourage innovation among manufacturers) is energy
labelling, which is currently compulsory throughout the European Union for cold
appliances (fridges and freezers), washing machines, tumble dryers, combined
washer-dryers, dishwashers and ovens. As well as giving consumers a simple at-a-
glance indication of how energy efficient a product is, the scheme has also had an
impact on the product development of household appliances (Which, 2012; Norden,
2007).

Many of today’s appliances are increasingly energy-efficient and there is evidence
to suggest that consumers, in general, are satisfied with them. However, the test
methods applied to energy labelling do not always correspond to the actual use of
the appliances tested. As Norden (2007) points out, although the current energy-
labelling scheme focuses on saving energy, appliances must also function in ways
that are acceptable to the end user. Furthermore, end users perhaps need to
become better versed in the possibilities offered by the appliances’ energy saving
functionality. Therefore, while energy labelling can aid households in purchasing
appliances that save energy, there are more savings still to be made in relation to
the ways in which the appliances are actually used in the home (Norden, 2007).

Patterns and trends around energy use in the home are the result of a complex interplay
between changing lifestyles and practices, growing prosperity and a tendency
towards increased ownership of labour-saving devices; an increasing number of
people and households; and finally, a trend towards ignorance, misunderstanding,
or misuse of the energy saving features of modern appliances, curtailing much of
the potential for efficiency gains (Norden, 2007; Emmert et al, 2010).

                                          2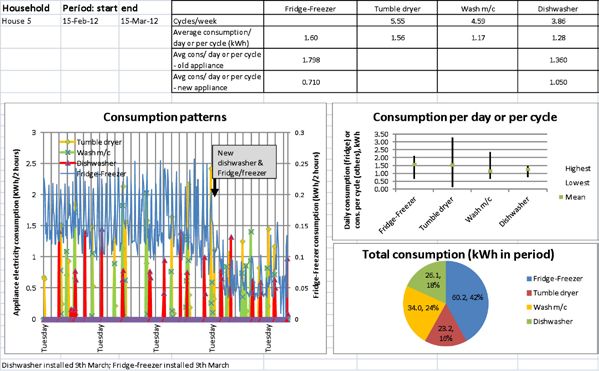
1.1 Aims and objectives of the study
The project itself involved a four month study of five households in the Woking
area in order to ascertain what the role and interrelationship between technology
and education might be in driving more energy efficient consumer use of modern
domestic electrical appliances. Whilst the main aim of the study was to explore the
extent to which switching to more efficient modern appliances (cold and wet) can
enable significant energy savings, the research itself comprised three complementary
objectives:
   1) Assessing the inherent energy
      efficiency of the appliances
   2) Exploring opportunities to use
      energy-saving features
   3) Investigating opportunities and
      challenges to changing habits
      and practices around particular
      appliances

1.1a Duration of the study
The total duration of the study was four
months (beginning 1st January 2012 until the end of April 2012). This was split
into three main monitoring ‘phases’ of one month each, with monitoring in two
households extended to the end of May. A series of mid-point interventions involved
the replacement of specified appliances and requests for participants to undertake
particular changes to their routine practices relating to appliance use. Further details
of these interventions are provided in the methodology section below.

1.2 Methodology
1.2a The study sample
The study sample was assembled in conjunction with Action Surrey - an organisation
that offers advice to residents, schools and businesses on how to reduce energy and
water consumption. It maintains a list of names and addresses of local residents who
have expressed interest in a range of user engagement activities and initiatives in
recent years. The main methodological objective was to connect with four separate
households in the Borough of Woking representative of two principal categories:
(a) single-occupant dwellings, and (b) family-occupant dwellings. Households
representing these two categories were also chosen and roughly matched in terms
of:
    • Location
    • Size and type of home
    • Age and relevance of appliances
    • Number of occupants
    • Age of occupants
It was acknowledged from the outset that representation of the UK population as a
whole was unrealistic given the small scale of the study. However, as depth of inquiry
over breadth of investigation was considered to be one of the guiding principles for
the project, it was felt that this approach would create the conditions for a) robust
and interesting results in relation to the field of study b) providing the basis for
further investigation and policy relevant findings.

                                           3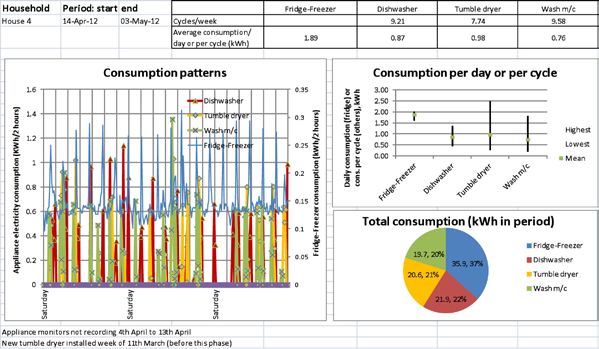
In the initial phase of the project, a shortlist of eligible participants was gathered
numbering approximately twenty households. From this shortlist, four households
comprising two families and two single people were identified and contacted.
Originally the study planned to investigate existing appliances of ten years or more
in age across four households (in order to compare energy consumption between
brand new appliances and those of a considerable, decade or more age difference).
However, introductory telephone conversations with the prospective household
participants revealed that this would not be possible, as there were too few appliances
so old, and therefore the study was revised to ownership of large white appliances
that were six years of age or more.
The four households contacted were all suitable in this regard, and each gave a
commitment to participation involving four of their major white appliances (e.g.
tumble dryer, fridge, washing machine, fridge freezer, dishwasher) being monitored
for energy consumption over a period of twelve weeks, split into two six-week
phases. From the outset, participants were made aware that a mid-point intervention
(approximately six weeks into the study) would take place involving, either the
replacement of their oldest appliance, or a request to undertake a series of changes
to their routine habits and practices around use of their appliances. .
Following an initial site survey at each property, it was discovered that one of the
family homes contained major white appliances which were significantly younger
than the study’s stipulated six year-plus age bracket. It was therefore decided to
augment the sample with one extra family household – one which more closely
matched the age stipulation of the appliances. This household was also sourced via
the Action Surrey database. Full details of the household types, age of properties
and household compositions, amongst other variables, can be found in Appendix 1.
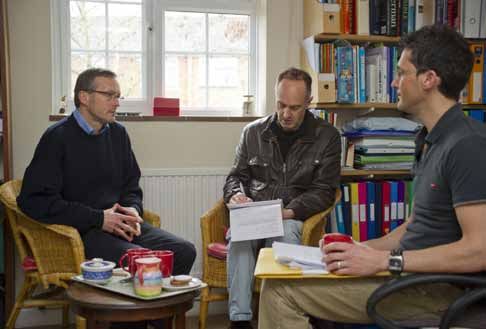
1.2b Monitoring equipment
Following exploratory research by Action Surrey
into suitable equipment for monitoring individual
appliance and whole-of-house electricity
consumption, it was decided that the EnviR Real
Time Home Energy Monitor (manufactured by
the Surrey-based company Current Cost) was
the best option. This particular model was felt
to be the most suitable technology for the aims
of the project and was also awarded Best Buy
status for energy monitors by Which? magazine
in January 2011.
During the initial site visits, four appliances in
each household were fitted with an individual
appliance monitor (IAM) which, working in
conjunction with the main monitoring device,
would record the electricity consumption of each
appliance continuously throughout the study.
4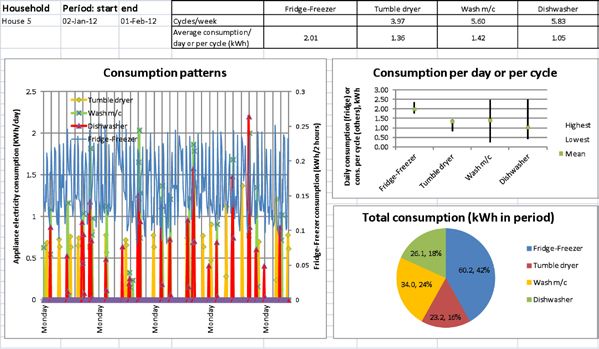
1.2c Mid-point interventions
In order to address the first objective of
the study (assessing the inherent energy
efficiency of the appliances), a selection of the
oldest monitored appliances were replaced
with brand new, energy efficient models
approximately halfway through the study.
These choices were constrained by the need
for the replacements to be like-for-like, most
notably the cold appliances had to have the
same capacity to form a reasonable comparison. The replacement appliances are
therefore not all the very most efficient on the market. Analysis of consumption data
for equal time intervals (approximately 4 weeks) before and after the switch-over
would then be carried out in order to enable comparisons to be made (see Results
section of this report). The first two four-week monitoring, or ‘base phase’ periods
would underpin a subsequent ‘business as usual’ scenario to be assessed. Table 1
sets out the conditions which were set up for the different households and specifically
details which appliances were monitored and which ones were replaced.

Table 1: Original appliances (age in years) and replacements (efficiency rating)
Household                 Cold                                  Wet                       Hot
                                                 Fridge-       Washing                  Tumble
                          Fridge      Freezer                              Dishwasher
                                                 freezer        m/c                      dryer
     1      Original             8         8                       6          New
            Replacement          A+       A++
     2      Original                                  10           14          10
            Replacement                                A          A++
     3      Original                                   5           5           1.5        2
            Replacement                              A++
     4      Original                       5           8           6           8         10+
            Replacement                                           A++                    A++
     5      Original                                  10          1.0          10         10
            Replacement                               A+                       A

The second objective of the study (Exploring opportunities to use energy-saving
features) was mobilized by providing households with a series of practical tips and
recommendations on how to use the energy saving features on their new appliances.

The third study objective (Investigating opportunities and challenges to changing
habits and practices around particular appliances) was introduced in the second
monitoring phase of the study and meant that, for one week, households should
change specific practices around their use of appliances. This followed the completion
of a questionnaire-based interview administered face-to-face, in which participants
were asked a series of questions in relation to use and practices regarding their
appliances (Appendix 2).

                                                 5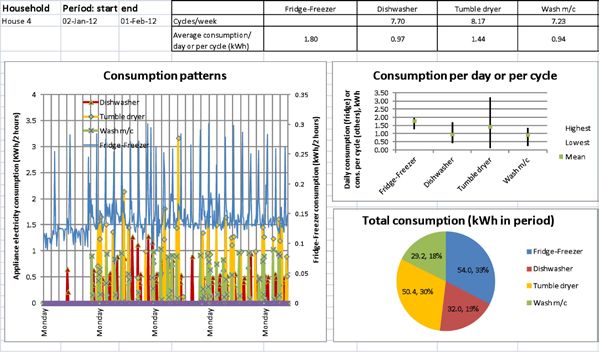
2. RESULTS

In this section we present the research results and analysis. These are set out
through the following sections:

   1) Results from the initial site visit interviews (see Appendix 2 for a copy of the
      questionnaire protocol used);
   2) Results from the monitored electricity consumption data; and
   3) Supplementary qualitative data gathered during site visits to the
      participating households during the course of the study.

2.1 Results from the initial site visit interviews
Each interview began with a series of ‘standard’ socio-demographic questions
(e.g., gender of respondents, age of occupants, working status). The answers
to these questions can be found in Appendix 1, presented in graphic and tabular
formats. The sample included two single occupant households and three family
dwellings. For the purposes of this report the individual households are referred to
henceforward using the labels ‘Household 1, 2, 3, 4, 5’ as shown in Table 2.

Table 2: Occupancy details for each participating household
                             Number of occupants
 Household 1                 1
 Household 2                 1
 Household 3                 5
 Household 4                 5
 Household 5                 3 (4 when student daughter at home during university vacations

2.1a Environmental and Energy Attitudes
One of the reasons that Woking was chosen as the location for the study was the fact
that it is considered to be an area with a reasonably high awareness of environmental
issues. For instance, Woking Borough Council has long been considered to be
one of the more progressive local authorities in the UK (Vase and Tindale, 2011),
developing both its own Combined Heat and Power (CHP) and renewable energy
strategy and also engaging with the public on a range of environmental and energy
initiatives. It was felt that involving participants who had a reasonable understanding
of energy/environmental issues would be an interesting way to explore a) what they
say and what they do, and b) compare their depth of knowledge and understanding
in relation to both their behaviour and also their interaction with new technology.

Therefore, in the initial part of the interview,
participants were asked a series of questions in
order to explore their attitudes on issues related to
energy, the environment and sustainability. In the
first question, a range of environment/sustainability
terms were shown and participants asked to state
how much, if anything, they knew about those
particular issues. The degree of stated knowledge
for each issue is shown in Figure 1.

                                               6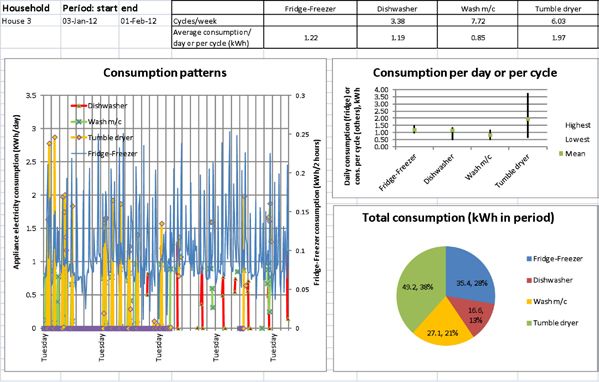
Figure 1: Degree of stated knowledge on environment/sustainability issues

                              Awareness of environmental issues

               Biodiversity    1       1             2           1
                                                                            A lot

           Carbon dioxide
                                   2                 2           1          A fair amount
             emissions

                                                                            Just a little
           Carbon footprint                4                     1
   Issue

                                                                            Nothing - have only
                                                                            heard of the name
           Global warming              3                     2              Nothing - have
                                                                            never heard of it
                                                                            Don't know
           Energy security     1           2                 2

           Climate change          2                     3

                                       Number of responses

It is perhaps surprising, given the high level of routine pro-environmental behaviour
revealed in the next section (see Figure 3), that the level of awareness around some
environmental issues was mixed (i.e. for several issues levels of stated knowledge
included the response ‘Just a little’ - and in the case of biodiversity and energy
security – ‘Nothing, have never heard of it’). These findings are consistent with
a number of studies (Fudge and Peters, 2011; Emmert et al, 2010), which found
that environmental considerations are often couched in a ‘hierarchical’ knowledge
structure and remain subject
to the pragmatism of everyday
lifestyle choices. House-
by-house presentation of
this data for each issue is
presented in Appendix 3.

A related series of
statements around habits
and attitudes was also
shown to the participants.
They were asked to state the
extent to which they agreed
or disagreed with each
statement (Figure 2).

                                                 7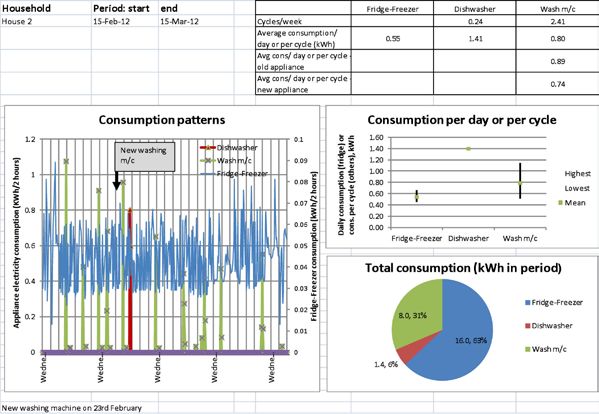
Figure 2: How much do you agree or disagree with these statements?

                                                      Environmental habits/attitudes

                  Environment a low priority compared to other
                               things in my life                                    5

              Prepared to pay more for environmentally friendly
                                 products                           1       1           2           1

                Lifestyle/behaviour doesn't contribute to climate
                                     change
                                                                        2                   3

                                        I need more information             3                   2       Strongly agree
                                                                                                        Tend to agree
  Statement

                     Any changes need to fit in with my lifestyle           3                   2
                                                                                                        Neither agree nor disagree
                                                                                                        Tend to disagree
                     Its only worth doing if they save you money    1           2               2
                                                                                                        Strongly disagree
              Its not worth me doing if others don't do the same        2                   3           Don't know

              The effects of climate change too far in the future   1                   4

                               Find it hard to change my habits     1           2               2

                      Don't give much thought to saving energy                      5

                                                                        Number of responses

2.1b Environmental and Energy Behaviour
The next part of the initial interview was devoted to the broad topic ‘environmental
and energy behaviour’. Here, participants were invited to discuss some of the key
issues involved with home energy use and how this relates to everyday practices.
The opening question invited participants to describe principal issues that influence
their energy use in the home, with regard to both home heating and electricity use in
a more general sense. It was clear from the responses that the overriding influences
for the majority of participants include ‘cost’ and ‘keeping warm’, as indicated by the
following interview extracts:

     “Cost is the main issue... I switch everything off” (Household 1)
     “The three most important issues are cost, efficiency and the environment”
     (Household 2)
     “Primarily cost but also keeping the house adequately warm with having young
     children” (Household 3)
     “A bit of everything but consider warmth as the number one issue” (Household 4)
     “Cost, efficiency and environment…in that order” (Household 5)

For all of the participants, ‘environmental awareness’ also featured as a key
influencing factor, although in every case less so than cost and warmth. A series
of practical considerations (meeting young children’s needs, adequate ambient
temperatures for the disabled, attempts to cut down on waste generally,…) were also
cited as important. In one case (Household 4) it was clear that continual attempts

                                                                            8
are made to reconcile energy efficiency
with the maintenance of a sufficient
level of household warmth: “as far as
possible we try to reduce the need to
have heating on, but at the same time
maintaining warmth in the house”.
Participants were asked whether they
had thought about, or had tried adopting
more efficient heating or electricity
practices. This elicited a wide range of
responses, encompassing the adoption of insulation measures and, in three cases,
the installation of solar PV and solar hot water panels:
“Had a new central heating system installed which involves radiators with
individual thermostats (rather than the previous hot air system that house
had when moved in). Have had the house fully insulated and double glazed
in the last ten years. I have also in the past month had solar PV panels fitted”
(Household 1)
“I had cavity wall insulation installed when I moved in and re-insulated the loft
at the same time. Double glazing was installed. Hot water solar panels were
installed about 12 years ago in anticipation of rising costs and the onset of old
age” (Household 2)
“Solar panels were connected 4/5 days ago. Cavity walls were insulated and 2
years ago we installed a new condenser boiler (the old one was inefficient and
starting to show signs of age). We Installed double glazing and loft insulation”
(Household 4)
Three of the households were thus in the c1% of UK households that have solar
panels of whatever sort.
When asked about the sort of circumstances that might cause them to consider
changing to more efficient ways of home heating and energy use, responses closely
reflected the varied circumstances of the participants. For example, one of the more
affluent family households said that, if moving house, they would consider under-
floor heating and other options (“like on ‘Grand Designs”), but were of the opinion
that “we’re not sure there’s much else that we can do in this house”. Similarly, one
of the other families (Household 5) also conveyed a potential willingness to consider
further changes if moving house. Both the single-occupancy participants alluded to
cost saving as a key determinant of energy decision-making:
“I try to be as careful as possible anyway…in order to save money” (Household 1)
“I wanted solar electric panels to give me cheaper electricity. Other than that,
I am also interested in more efficient appliances, boilers, etc.” (Household 2).
Participants were also asked to consider a number of circumstances that might make
them consider changing their practices to more efficient ways of heating their home
and in relation to other forms of domestic energy use. They were asked to indicate
the extent to which these changes applied to them at the present time (e.g. ‘Don’t
9really want to do this’; ‘Am thinking about doing this’; ‘Am doing this and intend to
keep it up’ etc.). The results (Figure 3) show that a substantial majority of participants
claimed to have already adopted a range of pro-environmental behaviours, with the
intention of these being continued into the future. Notable in this respect were: buying
energy efficient appliances; recycling more; wasting less food; washing clothes at
lower temperatures; putting on extra layers of clothing and to a lesser extent; turning
down thermostats. The two changes that received a majority of responses in the
categories ‘Don’t really want to do this’ and ‘Not applicable’, concerned using the car
less and walking/cycling more, and cutting down on hot water usage.
Figure 3: Responses to statements about changes that people could make to their lifestyles: “which
answer applies to you personally at the moment?”
Cut dow n on hot w ater
useage 2 2 1
Use car less and
Don't really want to do
w alk/cycle more 1 1 2 1 this
Haven't really thought
Buying energy efficient
1 4 about doing this
appliances
Have thought about it but
probably won't do it
Cut dow n on w ater useage 5
Am thinking about doing
this
Recycle more 5
Already doing this but
probably won't keep it up
Waste less food 1 4 Already doing this and
intend to keep it up
Wash clothes at low er
temperatures 1 4 Tried doing this but I've
given up
Put on an extra layer rather Not applicable
than turn up heating 1 4
Turn dow n thermosta 1 3 1
Number of respondents
In many ways these findings are indicative of the complexities contained within the
framework for pro-environmental behaviours (including the ‘segmentation model’)
developed by the Department for Environment, Food and Rural Affairs in 2008. The
model comprises seven segments: (1) “Positive greens”; (2) “Waste watchers”; (3)
“Concerned Participants”; (4) “Sideline supporters”; (5) “Cautious participants”; (6)
“Stalled starters”; and (7) “Honestly disengaged” (Figure 5). The model includes
detailed profiles of each segment covering, for example ecological worldview, socio-
geo-demographics, lifestyle, attitudes towards behaviours and current behaviours,
motivations and barriers, and knowledge and engagement (Defra, 2008). In Figure
5 each segment has been plotted against their relative willingness and ability to act.
10Figure 5: Defra Segmentation model: ‘framework for pro-environmental behaviours’
Results from the attitudinal and stated behaviour questions of this study strongly
indicate that our participants are consistent with the ‘Positive greens’ and ‘Concerned
Consumers’ segments as described in the model – believed to have both a high
potential and a willingness to act.
2.1c Household Appliances
In this section participants were asked a range of questions about household
appliances. The first area of inquiry concerned the main considerations that they
take into account when purchasing a new
electrical appliance. The results in Table 3
show that overall purpose, cost, reliability and
longevity and brand were key factors, with the
energy rating only mentioned by one household.
The EU Framework 7 funded project ‘Barriers and
opportunities to changing consumer behaviour
at EU level’ (BARENERGY) carried out between
2008 and 2010, conducted a series of focus
groups with consumers in 6 European countries.
One of the most striking findings here was that
consumers often automatically equate ‘brand’
with ‘efficiency’ rather than framing the purchase
of an appliance in relation to its efficiency rating.
It is postulated, therefore, that the brand of an
11appliance is often the most accurate marker vis-a-vis other characteristics which are
also important to consumers (longevity, reliability etc.). In this study sample, and to a
lesser extent, factors of space/size, advice from friends, offers and consumer advice
reports were also significant.
Table 3: Considerations taken into account when buying a new appliance
Household Main considerations when buying a new appliance
1 (Single a) “I look to the energy rating first – preferably A triple rated. Cost and brand name
are also important – [Brand X ] seems to be better than most”
2 (Single b) “When I buy something, 1) it has to fit into the available space, 2) cost, 3)
efficiency and how long it is likely to last, 4) take advice from friends, 5) look to
see what is on offer, and 6) I might read a Which report (but not often)”
3 (Family a) “The cost and its longevity are the main considerations”
4 (Family b) “1) Its purpose, 2) cost, reliability and longevity. The brand name is the least
important consideration. We have gone for appliances that suited our needs”.
5 (Family c) “Main considerations are its purpose, brand name and reliability followed by
cost and longevity”
When specifically asked to explain how a product’s ‘energy efficiency’ rates in
comparison to other issues that they identified, the responses indicated that whilst
some of the participants rated it as the most important factor, others wanted to
balance this with cost whilst another household rated it less important than purpose/
brand name/reliability/longevity.
One household cited size of washing machine, and its drum, as the primary factor
of significance (see Table 4). When considered in the context of the environmental
attitude responses (Section 2.1) it is interesting to note that even households
characteristic of the most ‘pro-environmental’ mindsets’ placed energy efficiency
below other purchasing considerations.
Table 4: The relative importance of energy efficiency when buying a new appliance
Household Importance of energy efficiency
1 (Single a) Very important as stated above in previous question
2 (Single b) Would try to choose an energy efficient one, partly for cost saving reasons
3 (Family a) Has to be balanced out with cost as well
4 (Family b) Certainly take it into account. Our washing machine was our latest appliance –
but we bought it primarily for a bigger drum and its speed. The fridge-freezer is
efficient and was bought with this in mind
5 (Family c) This is of equal importance to cost and longevity but not as important as
purpose/brand name/reliability
When asked whether they were aware of and used the current energy labelling
system - one participant had a “feeling that you should choose A or B rated appliances,
but that’s all I know”, while another described himself as only slightly aware, asking
“is it standardised?”.
Similarly, there was no consensus about whether current energy rating practices are
relevant to consumer choices. One householder thought that running costs, rather
than energy ratings, should be labelled; another agreed with the principle of current
rating practice but said that a lot of people bought appliances on appearance. Other
responses to this question are contained in the interview extracts below:
12“Yes, I am aware of energy labels, but they should indicate cost levels of
running the appliance, rather than green to red, so you would know how much
it costs to run per year.”(Household 1)
“I personally am aware, but don’t think people in general take much notice.”
(Household 3)
“…I feel that with a lot of people appliance are bought on looks…however,
if it’s a dishwasher that is hidden behind a cupboard door, the looks aren’t
so important and therefore the efficiency rating could become more salient.”
(Household 4)
In relation to the importance of turning down or switching off domestic appliances
fully (rather than leaving on standby) most of the households stated that they have
the habit of turning off at least some of their appliances fully at night. The appliances
turned off varied, however, usually to suit the habits of the household.
“I try to turn what I can off fully – other than the computer which is my life (the
screen goes off fully but I leave the hard drive on standby – too much time and
hassle to keep powering it up). TV can’t be fully switched off, so I need to get
a special plug for that so it goes off fully automatically when it’s switched off.”
(Household 1)
“Yes, except for TV because switch under bookcase.” (Household 2)
“Do it a lot because I read somewhere about phone chargers using energy
when in standby mode. Do turn following off fully: TV, mobile phone chargers,
laptops. Broadband has to be left on. We don’t argue about it – it’s common
practice in our house.” (Household 3)
“Turn computer, wi-fi and TV off fully.” (Household 4)
“Turn off PC and TV each night out of habit and for safety/environmental
reasons. We all agree on this. The dishwasher/tumble dryer/washing machine
are not on standby when not in use anyway.” (Household 5)
As the interview extracts above reflect,
TVs, broadband and computers are most
often left on standby, and, as far as this
study sample is concerned, kitchen and
washing appliances are not left on standby
when not in use. The interview extracts also
suggest that participants, in general, were
more likely to engage in pro-environmental
‘standby practices’ (e.g. switching off
mobile phone chargers) than adopting
habits and choices such as purchase/use
of energy efficient appliances and reduced
travel patterns, which potentially have far
greater magnitudes of energy and carbon
saving potential. Again, this demonstrates
the tenuous relationship that can often
exist between attitudes and people’s
actual behaviours.
13Participants were asked if they had ever considered not buying or having a product
because they were aware that it was energy intensive or environmentally damaging.
Their responses highlight the fact that consumers buy, or do not buy, products for
a variety of reasons, including assessments of their damage to the environment.
For instance, one householder said that “a product wouldn’t be advertised as
environmentally damaging in the first place if it was”. Another claimed that “I wouldn’t
buy something if it was environmentally damaging”. One household admitted to
avoiding buying certain household cleaning products “for this reason”, while another
said that it only bought products it “needs”, and that if it needed it and it was not
energy efficient, it would still have to have it.
When asked if they would consider it reasonable if companies themselves stopped
producing energy intensive products for the market (i.e. rather than the primary
onus being on consumers to change purchasing habits), most considered that the
emphasis for preventing a market in energy intensive products should rest on both
consumers and producers, for example:
“It has to be a bit of both, but consumer led… consumers need to change
their habits. I don’t fully support new light bulbs, e.g. waste disposal and some
models don’t fit with recessed lighting fittings, etc…Have to be mindful of
whole life cost as well as environmental impact.” (Household 4)
“There should be an onus on consumers and producers.” (Household 5)
Two of the participants, however, felt that manufacturers should take the lead in
stopping production of energy intensive products:
“Manufacturers need to take responsibility!” (Household 1)
“Would help, yes, if manufacturers stopped producing energy intensive
products for the market.” (Household 2)
The final part of this section queried participants on their use of three main
household appliances; their washing machines, tumble dryers and dishwashers.
Most householders in the sample claimed to use their washing machines on low
temperature cycles (40 or even 30 degrees), fill the machine to the full and use
economy buttons where available; and one delayed operation to take advantage of
cheaper night-time electricity rates.
The results indicate that less expensive non-bio detergent brands are favoured.
Families tend to use the machine every day with a small amount of hand washing
carried out for delicate items (Table 5). Participant practices relating to the use of
dishwashers and tumble dryers are presented in Table 6 and Table 7.
14Table 5: participant responses to the question ‘how do you use your washing machine?’
Household Washing machine practice/habits
1 (Single a) Try to cut washes down to a couple of times a week and only wash at 40 degrees.
Split washes up and try to wait until I have a full load, although with my disability
I sometimes have to do smaller loads. Usually put on overnight so I use the night
time rate on electricity use.
2 (Single b) Wash once or twice a week – always make sure it’s full. Use half load button
if absolutely necessary (if I need something quickly). Use non-bio detergents
because of skin sensitivity. Use a brand that is cheap and works. Always wash at
40 degrees. Do a certain amount of hand washing.
3 (Family a) Only make a wash when full. Tend to go on 40 degree cool cycle. Stick with
[Premium Brand] as it seems to clean best. Have used [Premium Brand]
concentrated – but too expensive with a family.
4 (Family b) Only one of the cycles will go down to 30 degrees, and we use this a lot. All
other cycles only go down to 40 degrees, which we use for towels. Use every
day. Doesn’t have an economy button. Always fill machine to full. Go for non-bio
(reaction to daughter’s skin) but mainly go for what is on offer.
5 (Family c) 6 loads a week – normally all done on a Saturday. Different cycles are used for
different types of wash loads. We use non-bio detergent – best available deal
and also use a de-scaler. We always use the energy saving button. We already
wash at low temperatures (occasionally high for linens).
Responses relating to use of the dishwasher seem to reveal a lack of trust in lower
temperature cycles. Use of cheaper detergents (or those that can be purchased ‘in
bulk’ thus lowering the unit price) was a common theme. The use of an ‘eco cycle’
(on models that have this feature) varied among the participating households, as the
comments in Table 6 demonstrate.
Table 6: participant responses to the question ‘tell me about the way you use your dishwasher?’
Household Dishwasher practice/habits
1 (Single a) Use it on demand – i.e. only when full. Stick to the same cycle – normally the
hottest as the plates etc. have been in there a long time before the load is full.
Use [Premium Brand] detergent as it seems to be most reasonable and buy
in bulk. Think it has an energy saving button but always switch it on at night
(to benefit from lower energy tariff). Would be encouraged to use lower energy
cycles I suppose if I did more washes, but that would defeat the object: “I always
wait for a full load otherwise I would use the eco button”.
2 (Single b) Use it once a month – bought it because of a family visit. Don’t put really dirty
things in (wash them by hand) use the normal wash cycle. Use cheapest
detergent I can get ([Supermarket] own normally). Don’t think it has an energy
saving button. In terms of using lower temperature cycles I don’t think it would be
hygienic and not sure you can lower the temperature anyway.
3 (Family a) Use it 3-4 times a week. Use economy cycle. Use [Premium Brand] tablets or
[Premium Brand] gel. Energy saving button is used. Lower temperatures would
not be practical.
4 (Family b) Run it overnight, every night. Might change if more people here. Normally use
50 degree setting but occasionally 65 if very greasy. Use [Premium Brand] or
whatever is on offer. No energy saving button. Would use lower energy cycle if it
cleaned the contents properly. Occasionally use lower temperature cycle.
5 (Family c) Try not to use it until full – then around five times a week. Always use economy
cycle 40-50 degrees. Every so often wife uses ‘normal’ wash. [Brand] tablets
currently used. Always use on energy saving mode – sometimes give an extra
rinse beforehand for heavily soiled plates. Cost of bills and environmental
concerns caused us to switch to lower temperature cycles about a year ago.
15In terms of tumble dryer practice and habits, for those who have tumble dryers, use is
generally seasonal or based on clemency of weather capable of drying clothes (Table
7). There is a general trend towards speed and convenience of drying rather than the
possibilities for saving energy. One participant pointed out that their machine only had
one setting thus making energy saving options for tumble dryer use more difficult.
Table 7: participant responses to the question ‘could you tell me about the way you use your tumble
dryer?’
Household Tumble dryer practice/habits
1 (Single a) Not applicable
2 (Single b) Not applicable
3 (Family a) Use 3 times a week. Not used at all in the summer. Fill it to the maximum. “Go by
what label says on clothes”. “Only has medium-high setting and time dials”. “Only
use it mid Oct to Feb/March (other than in bad weather during Summer)”. “Would
rather have it on high temperature for 30 minutes than on low for an hour”.
4 (Family b) “Don’t use it daily but when I use it I will do two loads on that day”. “Current tumble
dryer is very basic – just has a timer 20-30 minutes”. Occasional use in summer
when raining. No energy saving button. Lower temperature cycles not relevant
for our machine but if you could work out how long it takes to dry particular items
could possibly be more accurate at setting the drying time.
5 (Family c) Use 6 times full loads on a Saturday. One cycle every two days for remainder of
week. ‘Cupboard dry’ and ‘mixed fabric’ settings mainly used – normally check if dry
before end of cycle. In the summer just use it occasionally – weather dependent.
Machine doesn’t have an energy saving button. It would not be practical to use
lower temperature cycles.
2.2 Results from the monitored electricity consumption data
The 3 or 4 major appliances in each household were monitored for three phases:
Phases 1 (January), 1b (mid February to mid March) and Phase 2 (April). The
replacement of the appliances with more efficient models was conducted over a
period of time, either during phase 1b or between phase 1b and phase 2.
The following tables and figures identify the relevant phases and the periods over
which data were measured or averaged. Fuller datasheets for appliance electricity
use for each household and phase are contained in Appendix 4.
2.2a Appliance usage
The usage of each appliance type varied considerably between households. Tables
8a and 8b show the number of cycles per week for each appliance and per occupant.
In all cases the family households used the appliances more frequently than the
individual ones - but the single occupancy households used their washing machines
more frequently per person. Note that occupancy
here includes both adults and children.
The number of dishwasher uses per person per
week varied from 0.4 to 1.89 for singles, and
from 0.69 to 1.59 for families; and for washing
machines, from 1.93 to 4.12 for singles and
from 1.21 and 1.7 for families. For families the
number of uses per occupant for tumble dryers
varied from 0.99 to 1.58 per week.
16Table 8a: Cycles per week - whole household
Old appliances, average across all phases
Household Occupants Dishwasher Washing m/c Tumble dryer
1 1 1.89 4.12
2 1 0.40 1.93
3 5 3.46 6.03 4.95
4 5 7.97 7.93 6.53
5 3 3.26 5.09 4.75
Table 8b: Cycles per week – per occupant
Old appliances, average across all phases
Household Occupants Dishwasher Washing m/c Tumble dryer
1 1 1.89 4.12
2 1 0.40 1.93
3 5 0.69 1.21 0.99
4 5 1.59 1.59 1.31
5 3 1.09 1.70 1.58
2.2b Effect of household occupancy on electricity use
Table 9 shows the average electricity use per day for the original appliances,
normalised by the number of occupants in each household (adults and children are
counted alike).
Table 9: Consumption per day (kWh) - per person
Old appliances, average across all phases
Fridge- Dish- Washing Tumble
Household Occupants Fridge Freezer freezer washer m/c dryer Total
1 1 0.94 0.26 0.42 0.38 0.80
2 1 0.50 0.08 0.25 0.83
3 5 0.20 0.11 0.12 0.26 0.70
4 5 0.37 0.21 0.21 0.29 1.09
5 3 0.63 0.18 0.28 0.33 1.43
This table takes into account the energy efficiency as well as the usage of the
appliances and again reflects very considerable differences in energy consumption.
172.2c Appliance electricity use
The figures below show the mean electricity use per day (for cold appliances) and
per cycle (for washing and laundry appliances). The red bars represent the new
replacement appliances. It is clear that significant reductions are brought about with
the new appliances, as indicated by the lower height of the red bars.
Figure 4: Electricity use by appliance and household
Fridge-Freezer
2.2
2
1.8
1.6
1.4
1.2
kWh/day
1
Existing
0.8
0.6 New
0.4
0.2
0
Note: households 2-5 have combined fridge-freezers and household 1 has separate fridge and
freezer
Note: for household 2, it was discovered that the freezer compartment of the new fridge-freezer
was left ajar for much of the final monitoring phase, due to some residual packing material having
not been removed. This may explain the limited improvement in performance.
Dishwasher
1.8
1.6
1.4
1.2
kWh/cycle
1
Existing
0.8
0.6 New
0.4
0.2
0
1 2 3 4 5 Average
18Washing-machine
1.4
1.2
1
kWh/cycle
0.8
Existing
0.6
New
0.4
0.2
0
1 2 3 4 5 Average
Tumble-dryer
2
1.8
1.6
1.4
kWh/cycle
1.2
1 Existing
0.8
New
0.6
0.4
0.2
0
1 2 3 4 5 Average
Tables 10 and 11 show the same electricity use data for the original and replacement
appliances. Table 12 shows the percentage reduction in electricity use achieved
through appliance replacement.
Table 10: Electricity use per day or per cycle (kWh); old appliances
Average across all phases
Fridge- Dish- Tumble
Household Fridge Freezer freezer washer Wash m/c dryer
1 0.94 0.26 1.57 0.66
2 0.48 1.37 0.93
3 1.09 1.16 0.67 1.71
4 1.85 0.93 0.94 1.60
5 1.92 1.19 1.16 1.47
19Table 11: Electricity use per day or per cycle (kWh); new appliances
Average across all phases
Fridge- Dish- Tumble
Household Fridge Freezer freezer washer Wash m/c dryer
1 0.53 0.20
2 0.45 0.74
3 0.58
4 0.83 0.98
5 0.65 1.09
Table 12: Improvement in electricity use from new appliances
Average across all phases
Fridge- Dish- Tumble
Household Fridge Freezer freezer washer Wash m/c dryer
1 43% 23%
2 6% 21%
3 47%
4 12% 39%
5 66% 8%
Note: for household 2, it was discovered that the freezer compartment of the new
fridge-freezer was left ajar for much of the final monitoring phase, due to some residual
packing material having not been removed. This may explain the limited reduction in
energy usage.
In all instances of appliance replacement, savings in energy use were achieved
with no evident changes to how the appliances were used, demonstrating that
replacing an old with a new energy efficient machine does (unsurprisingly) yield
energy savings of itself.
The savings by type of appliance were:
• fridge-freezer replacement typically yielded savings of 47% to 66% (excepting
the malfunctioning Household 2 unit, see note above)
• the separate fridge and freezer replacements in Household 1 each yielded
significant savings, with an aggregate saving for combined freezing and
refrigeration services of 39%
• dishwashers and washing machines saved between 8% and 21%
• the tumble dryer replacement also yielded high savings (39%): the figures for
tumble dryer energy use per cycle are not reliable, as in practice people use
tumble dryers in a variety of ways, interrupting cycles to add or remove items,
and restarting with extended drying time if items are not found to be dry
enough. However the 39% reduction above reflects a comparison of overall
energy use for tumble drying before and after replacement, and is thus a
reliable indicator.
202.2d Energy saving practices
As described in section 1.2c, a set of changes in practice were requested of four of
the households, reflecting energy saving behaviours that they reported they had not
tried. Household 1 was not asked to make any changes in practices.
Table 13 shows the results of the implementation of these energy saving practices in
the households. Each of the other households was asked to try a change affecting
two or three of their appliances. However, from the data collected it is not possible to
make a comparison of the effect of changes for several of these as the households
were not asked to record the details of their practices in sufficient detail.
The results for those practices that could be assessed do, nevertheless, indicate
strong reductions in energy use.
Table 13: Energy saving practices: 18th to 25th April
Shaded cells indicate the appliance affected was a new replacement
Dishwasher Washing m/c
Low temp Low temp
detergent & detergent &
Household Average low temp Reduction Average low temp Reduction
kWh/cycle kWh/cycle % kWh/cycle kWh/cycle %
1
2 0.74 0.48 35%
3 1.25 1.02 19% 0.82 0.34 59%
4 0.87 0.58 34%
5
For dishwashing, Household 4 tried two washes using a 35deg.C setting with
Premium Brand tablets. This resulted in 34% lower electricity use than their usual
50deg.C setting. However they noted that the loads did not wash as well.
Household 3 (18 month old dishwasher) tried a 45deg.C ‘Fastwash’ using Premium
Brand tablets for five washes. This used 19% less
electricity than their usual 55deg.C ‘Ecowash’, with
satisfactory results.
For clothes washing, Household 2 tried one wash
at 30deg.C with a Premium Brand non-bio in
their new, replacement machine. This used 35%
less electricity than their usual setting. Similarly,
throughout Phase 2 Household 3 (5yo) tried
using a 30deg.C ‘Everyday’ wash, which saved
59% compared to their claimed usual 40deg.C
‘Everyday’ setting.
The shaded cells in Table 13 indicate where the
practice changes were implemented with appliances
that had been replaced. Due to the small sample
size it is not possible to draw clear conclusions;
21however it is evident that for Household 2, even though a new A+ washing machine
was in use, a further reduction in electricity use of 35% could be achieved through a
change in user practice. Although the evidence base is slim, this implies a cumulative
saving from appliance replacement plus behaviour change of 48%.
2.3 Supplementary qualitative data
It was suggested at the beginning of the study that there was a good overall level
of awareness in all of the households in relation to energy efficiency, particularly
regarding the importance of cost. However, as the study unfolded, it was apparent
that this knowledge does not always equate to behaviour. For instance, whilst some
of the participants washed their clothes at lower temperatures, there was variable
knowledge on energy labels, and many of them do not, apparently, look at the energy
labels on appliances. All of the participants felt that they had gained something from
their participation in the project and had taken different things from the experience:
“The monitoring process in particular has made a big difference to the ways
in which we use energy” (Household 4).
“I was already aware [of energy] but the questionnaire made me think more
than anything else. It has not really changed anything as I was doing most of
the things suggested in the first place. My solar panels have been the things
making the most difference I think. Everyone should have solar panels I
think, with batteries to store the power” (Household 2)
This participant argued that the study had influenced him to continue to improve his
energy use:
“I behave completely differently when my wife is not here. I might wear the
same shirt for several days in a row for instance. I behave differently as a
consumer where I might wear the same clothes for longer so that you don’t
do so much washing or ironing for instance” (Household 5).
The presence of a dog was pointed out as adding to the electricity consumption of one of
the single occupant houses:
“…you have done this thinking that there is one person living here, but
having a dog is like having an extra person – in terms of washing his bed
regularly etc.” (Household 1)
This may have some validity as this single person household scored highest for energy
consumption across all appliances on a per person basis.
In relation to the new appliances which had been installed in the household, one of
the participants pointed out:
“I have enjoyed the experience because I would like to be a better energy
consumer. The new appliances have been great for us and they have shown
how more modern appliances can make a difference to energy consumption”
(Household 5)
He went on to say that both new appliances (i.e. fridge-freezer and dishwasher) had
been “a great success…actual usage and space dimensions have been great as
well as functionality.”
22This participant in Household 2 made the point that her age meant that she often
struggled with new technology in general and that this had been the case with the
new appliances that had been installed:
“I found it difficult to get to grips with the technology [new washing machine].”
(Household 2).
The two single occupancy participants highlighted certain practical issues that can
influence the extent to which behavioural practice changes are, or are not, feasible.
For instance one of these participants has disabilities and this serves to limit some
of the behaviours which might be undertaken by other people, and the other one is
elderly:
“As a person with disabilities and requiring walking sticks I cannot carry
heavier loads which will be the case if I use a slower spin.”
“I find it difficult to adapt to new things at my time of life – it’s the same with
my computer.”
As the extracts above highlight, some circumstances mean that changes in
behaviour can be difficult and that there may be a need for more technologically
driven solutions. Other ‘single occupant’ issues raised included:
“I live on my own so I can’t wait for a full load…”
“I never mix “whites” with “coloureds” so my wash loads will be smaller”
“Specialist brands of detergent are so much more expensive and I can’t always
afford them unless they are on special offer…”
“I use specialist brands on heavily soiled items. The cheaper brands cope very
well for lightly soiled clothing”
“I always use my washing machine overnight to save on running costs as I
have a “white meter” [off peak tariff]
233. CONCLUSIONS AND POST-STUDY REFLECTIONS
3.1 Conclusions
Whilst all of the participants considered themselves to be ‘green’ and energy
conscious - and indeed three had recently had solar panels installed - in practice
their actual energy usage and routines leave significant scope for further efficiency
savings. The analysis reveals that the highest household energy use per person
for washing-machines and dishwashers was between double and treble that of the
most energy efficient.
Energy-efficiency was a not a top priority when buying appliances - and
understanding and attention paid to energy labelling was limited. In normal use
participating households had rarely, if ever, tried the lowest temperature settings
for their wet appliances. When challenged with trying a variety of potential energy-
saving measures - such as untangling, and/or pre-sorting, washing before using
the tumble dryer - convenience of not doing so for some participants overcame
their desire to save energy or money. For one participant who did undertake these
suggested changes to tumble dryer practice, the efficiency benefits (both in relation
to drying time and energy usage) became unmistakably evident.
As noted above the participants best fitted the ‘1. Positive Greens’ and ‘5. Concerned
Participants’ categories as set out by Defra in 2008. The DEFRA framework (p8)
revealed that ’segments 1, 2 and 3 offer the most potential in terms of their ability
to act, … Segment 5’s willingness to act is informed by their concerns about others’
actions”. This small study suggests that in practice these groups’ self-perception
of their action on reducing their energy consumption is considerably ahead of their
actual actions and willingness to act in certain areas of appliance use.
In practice and in all cases substantial energy savings could be achieved: in the
case of cold appliances and the tumble dryer predominantly by switching to newer
more energy efficient models; in the wet appliances predominantly by reducing the
temperature of the wash, but also by using newer technologies.
Whilst the cold appliance and tumble dryer savings only required a purchase with
little further effort; behavioural changes were also necessary for the ‘wet’ appliances.
The ‘test week’, when participants were asked to carry out a range of new energy-
efficient practices, demonstrated that some of the perceived barriers to behaviour
change could be quite easily overcome
with limited effort; and give rise to results
that exceeded the expectations of some
participants.
The potential for considerable savings
through behavioural and practice-
oriented changes to the daily use of
appliances appear not always to have
been fully appreciated. A range of
relatively ‘simple’ measures with less
24You can also read