TRACKING THE ENERGY REVOLUTION - CANADA EDITION 2014
←
→
Page content transcription
If your browser does not render page correctly, please read the page content below
TRACKING THE ENERGY REVOLUTION
           CANADA EDITION 2014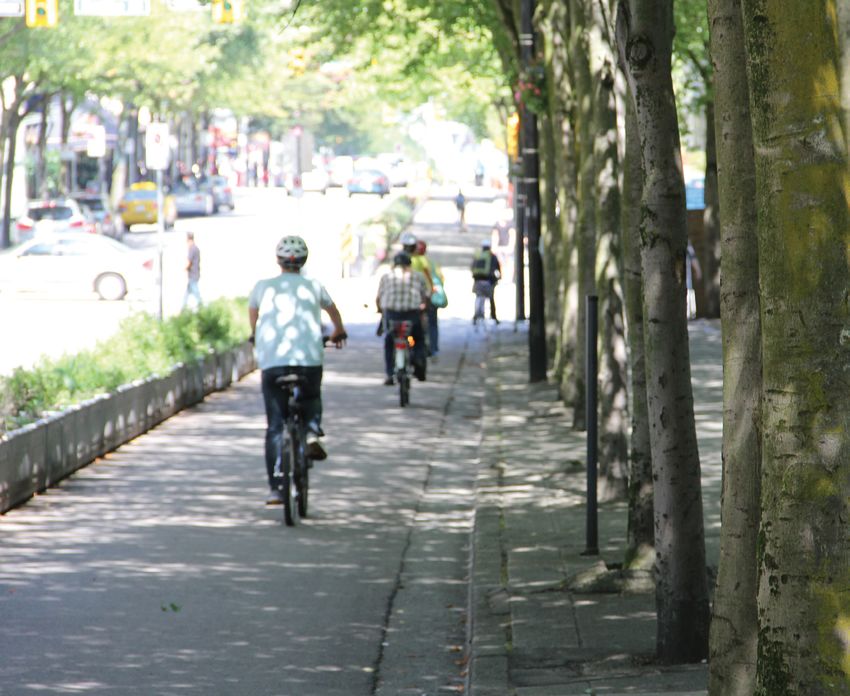
WHAT IS CLEAN ENERGY?
CLEAN ENERGY POLICIES, TECHNOLOGIES, OR SERVICES ARE THOSE THAT
ACCELERATE THE SHIFT TO A RENEWABLE-BASED ENERGY ECONOMY
BY INCREASING RENEWABLE ENERGY SUPPLY,
REDUCING CONSUMER AND INDUSTRIAL ENERGY DEMAND,
IMPROVING THE INFRASTRUCTURE AND SYSTEMS THAT TRANSMIT,
STORE, AND USE ENERGY,
AND ENABLING MARKET PENETRATION OF CLEAN-ENERGY SOLUTIONS.

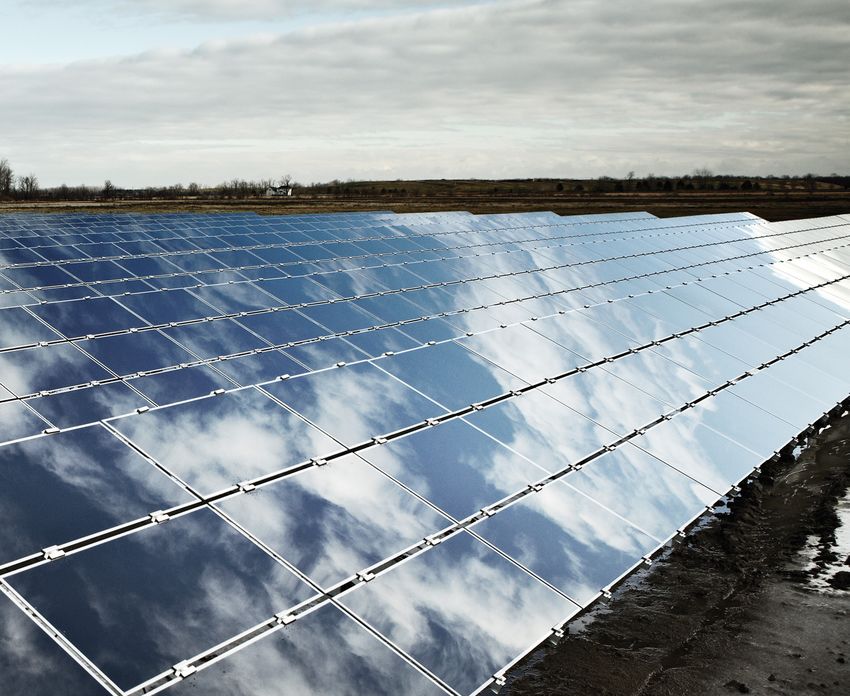
                                                   Enbridge’s Sarnia PV Plant in Sarnia, Ontario. Photo courtesy Enbridge.
SURGING AHEAD
Canada is moving up the clean energy ranks.
But some jurisdictions deserve more credit than others.

This is a public-service announcement: An energy revolution is underway. From                                         But despite that incredible track record, in some respects Canada is still swim-
Shanghai to San Francisco to Surrey, B.C. — and many points between — nations                                         ming upstream. Unlike our American friends, where the clean-energy opportunity
and leading companies are working to reduce their dependence on fossil-based                                          is clearly a national priority, our federal government’s approach could only be
energy sources and increasingly power their economies and industries with energy                                      described as indifferent.
from wind, sun, water, the heat of the earth, and wood waste.
                                                                                                                      In hockey, the best players head to where the puck is going. When it comes to the
Last year, global investment in clean power generation approached that of                                             clean-energy revolution, Ottawa is still lacing up its skates.
fossil-fuel generation. China and the United States led the world for both clean
                                                                                                                      To really get in the game, the federal government needs to start to level the play-
energy investment and installation. A record 6.5 million people worldwide worked
                                                                                                                      ing field for clean energy through effective tax support. We also recommend that
in the sector.
                                                                                                                      Ottawa invest infrastructure dollars in building clean energy and, yes, put a price
Here in Canada, we uncovered some very encouraging action across the coun-                                            on carbon pollution.
try — but also plenty of unrealized potential. Thanks largely to provincial leader-
                                                                                                                      We produced Tracking the Energy Revolution — Canada to identify and com-
ship in Ontario and Québec, and some mightily-determined business leaders, we’re
                                                                                                                      mend public and private clean-energy leadership, while nudging others to more
steadily reducing our dependence on fossil fuels, and attracting investment to
                                                                                                                      aggressively chase their prospects. We outline where Canada stands relative to
build out renewable energy and the infrastructure needed to support it.
                                                                                                                      our southern neighbour and the rest of the world, where the energy revolution is
Here are the numbers behind the good news:                                                                            seeing traction inside our borders, and where it could go next.

©© In 2013, Canada jumped from 12th to seventh place in the G20 for clean-energy                                      This document is the first of an annual series, and the companion to Tracking the
   investment.                                                                                                        Energy Revolution — Global, which we released in September 2014. We hope you
                                                                                                                      find it useful, and welcome your feedback on how it might better serve your needs.
©© Wind, solar, run-of-river, and biomass have grown by 93 percent since 2009, and
   in 2013 Canada hit a record high, building one new wind turbine every 10 hours!
©© Cumulative investment in Canada’s clean energy sector amounted to $24 billion
   over the past five years.
©© Clean energy jobs are growing incredibly fast. Thirty-seven percent more
   Canadians worked in the renewable energy industry in 2013 than in 2009.                                            		Merran Smith
©© As a result, by 2013 the clean energy sector — encompassing manufacturing,                                         		 Director, Clean Energy Canada
   energy efficiency, and biofuels — accounted for more direct Canadian jobs than                                     		merran@cleanenergycanada.org
   the oil sands.

                                                                                                                                                                                    INTRODUCTION | 3
Sources: IRENA, Pew/Bloomberg New Energy Finance. Cover photograph by Joan Sullivan. Report design by Erika Rathje.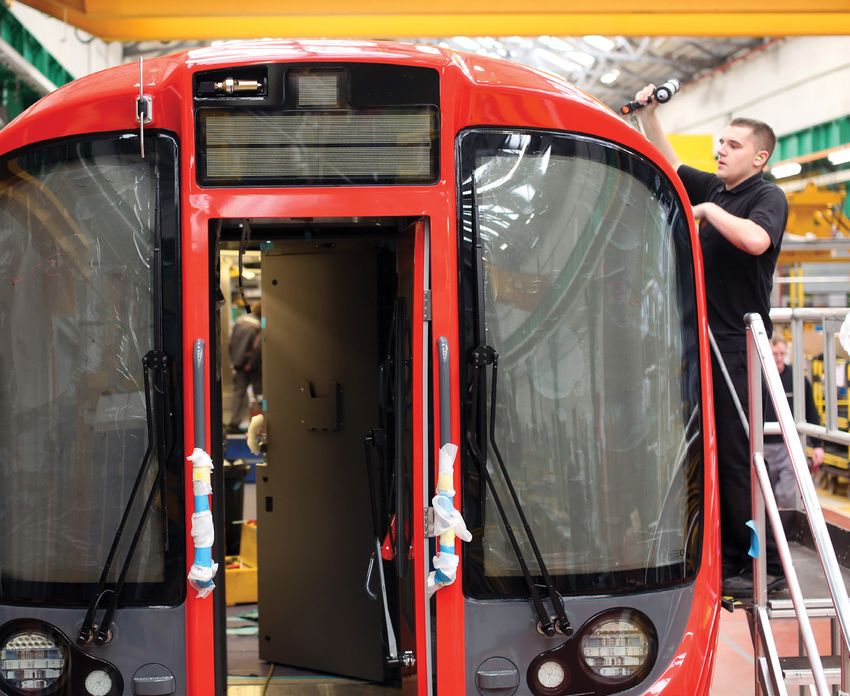
PRICE DROP:
   BIG GROWTH                                                                                                                            SOLAR-POWER EQUIPMENT PRICES HAVE
                                                                                                                                         PLUNGED 60 PERCENT IN CANADA SINCE 2009.
   A survey of clean-power and transportation production, investment, and growth
  Panel by panel and garage by garage, home and busi-          The energy revolution isn’t just about how and where                      Similarly, low-carbon fuel standards in British Columbia
  ness owners, communities, and utilities are steadily         we produce clean power. It’s also about being innova-                     are spurring a small but growing market for renewable
  greening Canada’s energy systems.                            tive in how we use it. Although electric vehicles have                    liquid fuels that are mixed in with the gasoline and
                                                               not yet taken off in significant numbers in Canada,                       diesel Canadians are already using. These policies
  In the past five years, our clean energy capacity
                                                               these are early days. As more models come available                       reduce emissions without requiring people to change
  created by wind, solar, run-of-river and biomass plants
                                                               and charging infrastructure expands — and govern-                         their habits. For instance, British Columbia’s fuel stan-
  has grown 93 percent, and investment followed a
                                                               ments introduce and strengthen policies to support                        dard reduced greenhouse gas emissions by 900,000
  similar path. Credit Ontario’s and Québec’s wind and
                                                               both — we anticipate electrified transportation pow-                      tonnes in 2012, a quarter of the province’s emissions
  solar efforts for the lion’s share of this accomplishment.
                                                               ered by renewable energy sources will play a big role in                  reductions since 2007.
  Meanwhile, in British Columbia, run-of-river hydro
                                                               Canada’s energy shift.
  might not be generating the most electrons in Canada,
  but it is by a wide margin generating the most jobs.

                    FIVE YEARS OF CUMULATIVE NATIONAL GROWTH                                                FIVE YEARS OF CUMULATIVE NATIONAL INVESTMENT
   8% increase in total renewable energy capacity since 2009                                                        $24 billion invested since 2009

                8                                                                                      25

                7
                                                                                                       20
                                                                                                                                                                                  OCEAN
                6                                                                                                                                                                 GEOTHERMAL
                                                                                 Billions of dollars

                5                                                                                                                                                                 BIOMASS
Capacity (GW)

                                                                                                       15
                                                                                                                                                                                  SOLAR
                4
                                                                                                                                                                                  WIND
                                                                                                       10
                3                                                                                                                                                                 LARGE HYDRO
                2                                                                                                                                                                 RUN-OF-RIVER
                                                                                                        5
                                                                                                                                                                                  BIOGAS
                1

                0                                                                                      0
                     2009      2010     2011        2012         2013                                        2009       2010      2011           2012         2013

  4 | A CANADIAN CLEAN ENERGY SNAPSHOT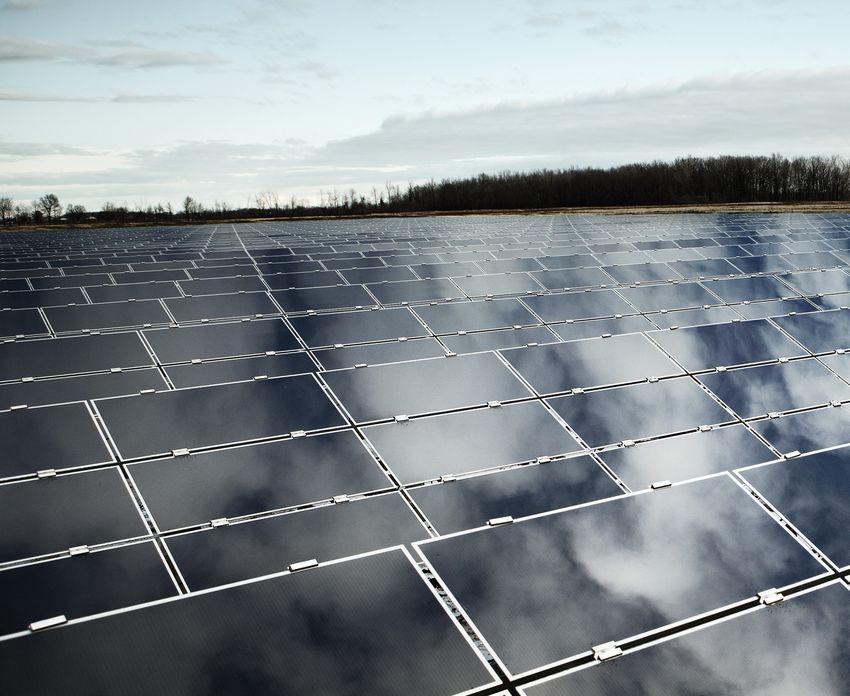
NEW DIRECT OPERATION JOBS IN RENEWABLE ENERGY                                                                                                                        ELECTRIC VEHICLES ON THE ROAD IN CANADA
                              2,200 new jobs since 2009                                                                                                                               2,022% increase since 2010
       2500                                                                                                                                                          6000

                                                                                                                                                                     5000

                                                                                                                                       Number of Electric Vehicles
       2000
                                                                                                                                                                     4000

       1500                                                                                                                                                          3000
Jobs

                                                                                                                                                                     2000
       1000
                                                                                                                                                                     1000

        500
                                                                                                                                                                        2010                2011               2012                          2013

                                                                                                                                                                                                   Cumulative

           2009                  2010                  2011                 2012                  2013
                                                                                                                                                                            5,300
TOTAL DIRECT CLEAN ENERGY JOBS, 2012*                                                                                                                                       electric vehicles on
                                                                                                                                                                                                                         OPPORTUNITY ALERT
                                                                                                                                                                            the road in Canada
                                                                                                                                                                                                                         CANADA IS THE ONLY
  23,700                                                                                                                                                                                                                G7 ECONOMY WITHOUT
                                                                                                                                                                            1,850                                        A FEDERAL ELECTRIC
TOTAL DIRECT OIL SANDS JOBS, 2012                                                                                                                                           available public
                                                                                                                                                                            charging stations                              VEHICLE REBATE.
  22,340
* Note: Clean energy job categories include clean power production and equipment manufacturing, energy efficiency technologies and services (such as smart grids and building envelope technologies), clean transportation, and bioenergy.
Sources: Analytica Advisors, British Columbia Ministry of Energy and Mines, CIEEDAC, International Energy Agency, Petroleum Human Resources Council of Canada, Plug ‘n Drive, WWF Canada.
                                                                                                                                                                                                                                                    5
ROOM FOR IMPROVEMENT:
OTTAWA’S CLEAN ENERGY TRACK RECORD
The key federal programs, funds, and rules keeping carbon in the ground
and innovation in the air

Constitutionally, megawatts are the domain of prov-       In contrast, Ottawa’s coal regulations don’t come into
inces. So if we want to evaluate the federal govern-      force until next July, and the three direct investment
ment’s progress on clean energy, we need to instead       programs are now fully committed and closed to new
look at investment, support, and avoided greenhouse       applicants.
gases. On the latter metric, we’ve analysed Environment
                                                          So our snapshot of Ottawa’s clean energy efforts (seen
Canada data to determine exactly how much carbon
                                                          at right) shows as many lapsed programs as live ones.
pollution various federal clean energy policies will
                                                          The conclusion? Ottawa has laid a foundation for
prevent from heading skyward.
                                                          clean energy, but has done very little to build on it.
The result? Ottawa has laid some of the groundwork,
                                                          A welcome exception to that rule is the federal govern-
with its efforts to cut energy waste and support clean
                                                          ment’s ongoing support for Sustainable Development
energy demonstration and research projects. The
                                                          Technology Canada, an arms-length agency that pro-
federal government has also adopted regulations
                                                          vides critical funding for clean technology projects and
to discourage the construction of conventional coal
                                                          companies. Nicolas Morgan, VP Business Development
plants.
                                                          at Morgan Solar, called it “one of the most successful
But here’s the rub: Only three of Ottawa’s seven most     cleantech funding programs in the world.” Last year,
effective clean energy policies are actually in effect    Ottawa committed $325 million to support eight more
today.                                                    years of its work.

©© Sustainable Development Technology Canada is
   growing its portfolio at a rapid clip.
©© Ottawa’s renewable fuel regulations have been in
   effect since 2011.
©© EcoENERGY Efficiency program of standards and
   labelling remains up and running until 2016.

“The conclusion? Ottawa has
laid a foundation for clean
energy, but has done very
little to build on it.”

6
BY THE NUMBERS: OTTAWA’S CLEAN ENERGY EFFORT
                                                                                                                                                                                                                                      ESTIMATED GHG
RANKING            STATUS                     POLICY                                                             DESCRIPTION                                                                                                          (MT CO2e IN 2020)
                            Live                                                                                      Supports efforts to provide efficiency information and increase
        1                                        ECOENERGY EFFICIENCY                                                 efficiency standards                                                                                                6.5

                          Fully                                                                                       Offers an incentive of $0.01/kWh of electricity produced, for 10 years,
       2               Allocated
                                                 ECOENERGY FOR RENEWABLE                                              for 104 projects built before March 2011                                                                            6.2
                                                 POWER PROGRAM

                         Coming                                                                                       These regulations covering new facilities and facilities at the end of
       3                  Soon
                                                 GREENHOUSE GAS                                                       their economic lives will take effect in July 2015                                                                  3
                                                 REGULATIONS ON COAL-FIRED
                                                 ELECTRICITY GENERATION

                          Fully                                                                                       Supported carbon capture and storage, renewable energy, and other
       4               Allocated
                                                 CLEAN ENERGY FUND                                                    R&D projects between 2009 and this year                                                                             2.8

                            Live                                                                                      This arms-length foundation funds Canadian clean-technology
       5                                         SUSTAINABLE DEVELOPMENT                                              development and demonstration                                                                                       2.1
                                                 TECHNOLOGY CANADA                                                                                                                                                                        AS OF 2012

                            Live                                                                                      Require gasoline and diesel producers to blend biofuels into their
       6                                         RENEWABLE FUEL                                                       products                                                                                                            2
                                                 REGULATIONS

                          Fully                                                                                       Supported efficiency and renewable energy investment in the
       7               Allocated
                                                 PULP AND PAPER GREEN                                                 forestry sector between 2009 and 2012                                                                               1.4
                                                 TRANSFORMATION PROGRAM
Sources: Environment Canada (Canada’s First Biennial Report) supplemented with estimates from Sustainable Development Technology Canada. Estimated emission reductions are presented in millions of tonnes of carbon-dioxide equivalent             7
(Mt CO2e) reduced in 2020. The list excludes federal initiatives not directly relevant to clean energy, federal policies below 0.1 Mt in size, and federal policies with emission reductions that have not been estimated.
PUNCHING ABOVE OUR WEIGHT
Thanks to provincial leadership (merci, Québec, and kudos, Ontario),
Canada is holding its own in the global clean energy revolution

Last year, Canada ranked seventh in the G20 for clean        Canada’s share of the global opportunity grows larger                          We’re off to a good start and, thanks to Ontario and
energy investment — a jump up from a middle-of-the-          when we widen the lens to include manufacturers                                Québec, we’re even punching above our weight. But
pack 12th the previous year, but still far short of global   of renewable generation equipment, electric vehicle                            with targeted support — particularly at the federal
leaders China, the United States, Japan, and others.         parts, efficient building materials, and so on. Canada’s                       level and in Alberta, where it is noticeably absent —
Clean-energy investment clocked in at $6.5 billion           share of this global market is worth about $6.1 bil-                           we could accomplish even greater things.
nationally, a 45 percent increase over the previous          lion — about 0.8 percent of the global market.
year, and the second-biggest such jump behind Japan.
                                                             When compared with the investment going into
Where did the money go? Investors moved $3.6 billion         Canada’s fossil fuel sector, these numbers aren’t huge.
into Canada’s wind sector to build out a series of big       But they aren’t trivial, either. They underscore that
projects, such as Ontario’s South Kent and Alberta’s         clean energy is no longer a niche, but is fast emerging
Blackspring Ridge wind farms. Others took a shine to         as the “new business as usual.” The opportunity will
Canada’s solar sector, to the tune of $2.5 billion. The      only grow larger as demand for both clean electrons
balance went into run-of-river hydro and biomass.            and clean energy innovations soars in the coming years.

CANADA’S GLOBAL RANK

6          GLOBAL RANK
   TH* OVERALL POWER PRODUCTION                              3RD HYDROPOWER PRODUCTION
                                                                       GLOBAL RANK
                                                                                                                                            5TH NEW WIND POWER CAPACITY
                                                                                                                                                            GLOBAL RANK

*Power production from all sources: clean and renewable, fossil fuels, and nuclear.

WHICH NATION IS MORE
ATTRACTIVE TO INVESTORS
                                                               2ND           WHICH NATION’S
                                                                             GOVERNMENTS AND
                                                                                                                                                               1ST
INTERESTED IN RENEWABLE                                                      COMPANIES ARE DRIVING
ENERGY?*                                                       5TH           MORE INNOVATION?**                                                                9TH
Rank from 1 to 40, with one being
the “most attractive”

                                                                                                                                                         * Global Ranking in Renewable Energy Investment Attractiveness (2014)
8 | OUR PLACE IN THE WORLD                                                                                                                                             ** Global Ranking in U.S. Clean Energy Patent Filings (2013)
                                                                                     Sources: Analytica Advisors, Ernst & Young, Pew/Bloomberg New Energy Finance, PriceWaterhouseCooper, Heslin Rothenberg Farley & Mesiti P.C.
THE POWERHOUSE NEXT DOOR
When it comes to clean energy, our biggest customer is also our biggest competitor.
Decoding our three-pronged relationship with the United States.

COMPETITOR                                                COLLABORATOR                                                CUSTOMER
Under President Barack Obama, the United States           Our energy diplomacy is a study in contrasts: While         For Canada’s 119 clean energy companies, U.S. support
has positioned itself as a global clean-energy power      Canada talks up the high-carbon Keystone XL pipeline        for clean energy represents a huge opportunity. It’s
player. The country has increased solar generation        proposal in Washington, our American friends empha-         our top clean energy export market today, and with
more than tenfold and tripled electricity production      size the bilateral Clean Energy Dialogue they pushed        new power plant regulations scheduled to come into
from wind. The world’s second-largest carbon polluter     Ottawa to create in 2009.                                   effect this coming year, American demand for Cana-
is now also the world’s second-biggest clean energy                                                                   dian clean electrons, technologies and services looks
                                                          The Clean Energy Dialogue has helped spur important
producer — trailing only China, the world leader in                                                                   poised to grow.
                                                          cross-border research and collaboration. That includes
both categories.
                                                          studies into the role that hydropower can play in back-     In the northeast, the governors of Massachusetts and
But American clean energy companies aren’t just           ing up variable sources of renewable power, like wind       Connecticut are backing a project that would access
investing domestically: they are increasingly looking     and solar, and opportunities to better integrate Canadian   Québec hydropower to help their states meet their
to grow both within and beyond North America. The         and American power grids to greatly increase the use        clean-energy targets. A few months ago, Vermont,
U.S. International Trade Administration flags Canada      of renewable energy.                                        New Hampshire, Rhode Island and Maine joined
as the top market for American renewable energy                                                                       them, and agreed to share the costs of a proposed $1
                                                          And we’re beginning to see real examples of this
and energy efficiency exporters. President Obama has                                                                  billion transmission line to boost imports from Québec.
                                                          cross-border potential on the ground: Minnesota
prioritized clean energy exports, setting the ambitious
                                                          Power and Manitoba Hydro recently signed an agree-
goal of doubling American exports between 2010
                                                          ment in which the province could store excess North
and 2015.
                                                          Dakota wind power in its hydro reservoirs, and then
                                                          sell that energy back to the midwest market at times
                                                          when the winds lessen.

                      ”
“A LOW-CARBON, CLEAN ENERGY ECONOMY CAN BE                                         ”
                                                          “OUR RELATIONSHIP WOULD GET DEEPER AND STRONGER
AN ENGINE OF GROWTH FOR DECADES TO COME.                   AND PUT US IN A POSITION TO REALLY BE GLOBAL
AND I WANT AMERICA TO BUILD THAT ENGINE.”                  LEADERS IN ENERGY AND CLIMATE CHANGE IF WE
—  President Barack Obama, June 2013                       WORKED MORE CLOSELY TOGETHER.”
                                                          —  Former U.S. Secretary of State Hillary Clinton,
                                                          June 2014
TOP FIVE CLEAN ENERGY TOP FIVE CANADIAN
FINANCIERS FOR THE UTILITIES BUYING GETTING THE JOB DONE
PAST FIVE YEARS* AND PRODUCING The nation’s largest operating and soon-to-be-
operating renewable energy plants and the power
Notice anything unusual here? With one exception,
foreign banks are funding Canada’s clean-energy
CLEAN POWER they produce
revolution. It’s great to see overseas investors have
flagged us as a promising market, but Bay Street
IN 2013
really needs to get with the program.
$1.2 BILLION 46,700 MW
MITSUBISHI UFJ FINANCIAL GROUP INC. HYDRO QUÉBEC
TOKYO, JAPAN 195 MW
14,400 MW
$750 MILLION BC HYDRO FORREST KERR
ALTAGAS
MANULIFE FINANCIAL CORP.
TORONTO, CANADA 7,000 MW
$660 MILLION ONTARIO POWER GENERATION 50 MW
RUTHERFORD CREEK HYDRO
MIZUHO FINANCIAL GROUP INC.
TOKYO, JAPAN
5,500 MW POWER PLANT INNERGEX
MANITOBA HYDRO
$470 MILLION 5,400 MW 112 MW
DEUTSCHE BANK AG, FRANKFURT ONTARIO POWER AUTHORITY
FRANKFURT, GERMANY HOWE SOUND GREEN ENERGY
HOWE SOUND PULP AND PAPER LTD
$360 MILLION
NORDDEUTSCHE LANDESBANK GIROZENTRALE
HANOVER, GERMANY ENOUGH CLEAN ENERGY IS PRODUCED IN CANADA TO POWER 37 MILLION
10 | THE BUILDERS * Dollar values converted from USD to CAD using the Bank of Canada’s conversion rate from December 30, 2013.
Sources: AltaGas, Bloomberg New Energy Finance, CIEEDAC, Hydro Québec, Enbridge.TOP FIVE LARGEST PRIVATE
In service in 2013 CANADIAN CLEAN-ENERGY
Financed and under
construction in 2013
PRODUCERS, 2013**
7,722 MW
Some of Canada’s biggest conventional energy
companies have jumped into clean energy. In
fact, four of Canada’s five biggest renewables
producers are also in the fossil fuel business.
ROBERT-BOURASSA 1,510 MW
TRANSALTA
HYDRO QUÉBEC
1,270 MW
200 MW 300 MW BROOKFIELD ASSET
MANAGEMENT
RIVIERE DU MOULIN WIND LAC-ALFRED WIND FARM
FARM PHASE II ST LAURENT ENERGIES EDF EN CANADA AND ENBRIDGE 890 MW
ENBRIDGE
9 MW
BAY OF FUNDY TIDAL ENERGY
770 MW
80 MW TESTING CENTRE FORCE FIERA AXIUM
INFRASTRUCTURE
SARNIA PV PLANT
200 MW ENBRIDGE
20 MW 650 MW
ATIKOKAN BIOMASS CONVERSION PLANT
ONTARIO POWER GENERATION
130 MW ANNAPOLIS ROYAL TIDAL PLANT
NS POWER
TRANSCANADA
GRAND RENEWABLE PV PLANT
SAMSUNG
G E N E R AT I O N | 1 1
** Capacity number denotes MW of generation under active management.HOW TO MOVE THE NEEDLE:
OUR POLICY RECIPE FOR ENERGY TRANSFORMATION
Lessons from Canadian jurisdictions working to clean up their energy systems
A close look at the provinces that are steadily
reducing their fossil fuel reliance reveals a POLICY ENACTED OUTCOME
consistent pattern. Call it a policy recipe for
a clean-energy transition.
Helped stimulate 800 MW worth of
BC
CLEAN ENERGY ACT, JUNE 2010 clean energy projects. Banned coal-
STEP 1: CUT COAL ENERGY PLAN fired power plants without CCS.
If you have coal power on your grid, pick
a target year to shut it down. If you’re
fortunate enough to not have coal plants in
Allocates $30 million to support
the first place, prevent them from being built. MB ENERGY JOBS FUND APR 2012 local clean-energy technology firms.
STEP 2: RENEWABLES ON THE GRID
Implement either a renewable portfolio As of 2013, the province has installed
standard or a feed in tariff to gradually
CLEAN ENERGY ACT WITH FEED OCT 2009 480 MW worth of renewable elec-
increase the share of renewables on the grid. ON IN TARIFF, CESSATION OF COAL tricity capacity. The government has
The former policy directs utilities to source approved an additional 940 MW
an increasing share of their power from
USE REGULATION of generation. Ontario has closed
clean sources, while the latter requires them and banned all coal-fired power
to pay renewable energy producers a fixed, generation.
long-term price for power.
The province built 400 MW of clean
STEP 3: TRANSPORT CLEAN ELECTRONS ENERGY PLAN ANNOUNCED energy between 2006 and 2013.
QC
Invest in infrastructure as needed to ensure 2006
new renewable sources smoothly feed into
the grid.
Established a target of 40 percent
At right, we’ve highlighted five standout RENEWABLE ENERGY OCT 2010 renewable-sourced electricity by 2020.
provincial examples of how and where REGULATION, RENEWABLE Since September 2011, the province
good policy is cleaning up Canada’s energy NS has approved 200 MW renewable
systems. ELECTRICITY STANDARD, electricity capacity for installation.
FEED IN TARIFF
1 2 | C A N A D A’ S G R E AT E S T H I T S
Sources: Mark Jaccard / Simon Fraser University, Ontario Ministry of Energy, Nova Scotia Department of Energy, Manitoba Hydro.LEADING THE CHARGE BRITISH COLUMBIA ONTARIO
Rebates, plug-in points, and other CEVforBC Electric Vehicle Incentive Program
incentives driving electric-vehicle adoption Between November 2011 and March 2014, Since launching in July 2010, the program has
the province offered rebates of up to $5,000 evolved to offer rebates of up to $8,500 on
across Canada
on clean-fuel vehicles. The program has since the purchase of eligible electric vehicles, plus
The clean energy transition isn’t just about how we expired and not been renewed. $1,000 for home or fleet charging stations.
generate energy; it’s about how we use it, too. Since
GRN Green Licence Plates
Canada lacks a federal electric-vehicle rebate, we’ve
been closely tracking provincial EV incentives, which
have been shown to drive adoption in jurisdictions
QUÉBEC Eligible EV owners can apply for a green
licence plate, which grants them access to
HOV lanes and public charging at transit
such as California and Norway. Plug-in electric vehicles Drive Electric Program
stations.
offer an unbeatable opportunity to reduce pollution Purchasers of eligible vehicles receive rebates
and fossil fuel dependence, and add storage to the between $5,000 and $8,000. The province Education and Awareness
grid. Electric cars are particularly well-suited for juris- also provides up to $1,000 for charging station
Public outreach and events across Ontario,
dictions where renewable power dominates the grid installations. website and factsheets.
or is expanding its role. As with renewable energy
build-out, Ontario and Québec are leading the way. Transportation Electrification Strategy
Who’s next? British Columbia and Manitoba, we’re The province has committed $512 million for
looking at you. EV awareness, infrastructure, and R&D.
A CLIMATE FRIENDLY CANADIAN ENERGY STRATEGY?
After several false starts, provincial leaders outlined the start of something big
In recent years, provincial and territorial leaders have By the summer of 2015, premiers plan to deliver a
landed on the same page: Canada needs an energy Canadian Energy Strategy built on principles like:
strategy. But the premiers’ earlier efforts were largely
focused on getting more oil and gas out of the ground ©© “Addressing climate change”
and off to market. ©© “Transition to a lower-carbon economy through
appropriate initiatives, such as carbon pricing”
That changed this past summer at the Council of the
Federation meeting in Charlottetown, P.E.I. There, the ©© “Increase and diversify the supply and distribu-
leaders of Québec and Ontario signalled that they tion of clean as well as low carbon energy.”
were looking for something different. Under their
leadership, the premiers effectively hit the reset button, If all goes as hoped, the Council of the Federation’s
agreeing to an updated set of objectives that will Canadian Energy Strategy could prove a catalyst for
move clean energy to the heart of the effort. Canada’s clean-energy transition. Stay tuned.
ELECTRIC VEHICLE POLICY | 13
Provincial leaders at the 2014 Council of the Federation in Charlottetown, Prince Edward Island. Photo: Reuters.BRITISH COLUMBIA
Welcome to the land of falling water
NUMBERS AT A GLANCE
British Columbia not only boasts one of the cleanest power grids in North America,
it also has legislation — the Clean Energy Act — that will (mostly) keep it that
way. The 2010 law requires the provincial utility to source at least 93 percent of its
power from clean or renewable energy sources, though the government has since
given would-be LNG producers a free pass to power their operations on natural gas.
95% 950
of grid is clean registered electric
The law also directs provincial utility B.C. Hydro to meet two-thirds of the province’s and renewable vehicles in 2013
incremental electricity needs through efficiency and conservation by 2020.
In recent years, B.C. Hydro has held back on new contracts with independent
power producers — indicating that it has enough power for the foreseeable future. $5.3 BILLION 700
However, it is considering a controversial 1,100 MW dam — the Site C Clean Energy renewable energy available public
Project — which would be located in the province’s northern Peace River region. investment (2009 – 2013) chargers in 2013
Finally, the province also has a permanent legislated ban on coal-fired power gener-
ation without carbon capture and storage.
0.5 GW + 1 GW + 12.1 GW + 0.8 GW = TOTAL CLEAN ENERGY CAPACITY 14.4 GW = 6.7 MILLION 2013
LARGEST PROJECTS BY POWER SOURCE IN BRITISH COLUMBIA
W.A.C. BENNETT DAM BRILLIANT DOKIE WIND PROJECT CANFOR PRINCE GEORGE
B.C. Hydro, Columbia Power, Alterra Power and PULP & PAPER MILL
Hudsons Hope Castlegar GE Financial Services, Canfor, Prince George
2,730 MW = 1,498,418 149 MW = 107,309 Chetwynd
135 MW = 79,583
144 MW = 30,920
14 SPOTLIGHT ON BRITISH COLUMBIA
Sources: CIEEDAC, Clean Energy BC, Fraser Basin Council, Plug n’ Drive, Seabreeze power, WWF-Canada.BC
5 YEARS OF CUMULATIVE GROWTH 5 YEARS OF CUMULATIVE INVESTMENT
11% increase in total capacity since 2009 $5.3 billion invested since 2009
3.0 10
2.5 8
Billions of dollars
2.0
Capacity (GW)
6
1.5
4
1.0
0.5 2
2009 2010 2011 2012 2013 2009 2010 2011 2012 2013
BIOMASS WIND LARGE HYDRO RUN-OF-RIVER
PACIFIC COAST
ACTION PLAN
In October 2013, BC,
Washington, Oregon, and
California committed to
work together to cut climate
pollution and accelerate
the shift to a low carbon
economy.
15
Innergex owns and operates the 50 MW Rutherford Creek project, near Pemberton, British Columbia.ALBERTA
With demand poised to surge and a dynamite resource,
this could be Canada’s next clean energy hotspot NUMBERS AT A GLANCE
With abundant sunshine and rock-steady winds — not to mention biomass, hydro,
and geothermal potential — Alberta can claim some of the best renewable energy
resources in Canada. Unfortunately, its grid is about 85 percent powered by fossil 18% 141
fuels, mostly coal. The province’s power plants are a nationally significant source of of grid is clean registered electric
carbon pollution. and renewable vehicles in 2013
Our recent Power to Change report, produced with the Pembina Institute, demon-
strates that Alberta could reduce its heavy reliance on these fuels and instead gen-
erate its electricity from cleaner sources — a mix of renewable sources with some
$1.6 BILLION 83
renewable energy available public
natural gas — within 20 years. Doing so would slash carbon pollution, improve air investment (2009 – 2013) chargers in 2013
quality, ignite a new industry, and ultimately save ratepayers money. Public support
for such a plan is strong and growing.
For clean-energy producers and enthusiasts, Alberta remains the province to watch.
1.1 GW + 0.1 GW + 0.8 GW + 0.4 GW = TOTAL CLEAN ENERGY CAPACITY 2.4 GW = 730,000 2013
LARGEST PROJECTS BY POWER SOURCE IN ALBERTA
BRAZEAU HALKIRK WIND ALBERTA PACIFIC KANANASKIS PLANT
TransAlta, Drayton Capital Power, Halkirk FOREST INDUSTRIES TransAlta, Seebe
Valley 150 MW = 50,000 Alberta Pacific, Boyle 19 MW = 8,500
355 MW = 36,103 92 MW = 54,235
16 S P O T L I G H T O N A L B E R TA
Sources: CIEEDAC, Clean Energy Canada, The Pembina Institute, The Pembina Foundation, Plug n’ Drive, TransAlta, WWF-Canada.AB
5 YEARS OF CUMULATIVE GROWTH 5 YEARS OF CUMULATIVE INVESTMENT
25% increase in total capacity since 2009 $1.6 billion invested since 2009
3.0 10
2.5 8
Billions of dollars
2.0
Capacity (GW)
6
1.5
4
1.0
0.5 2
2009 2010 2011 2012 2013 2009 2010 2011 2012 2013
WIND
17
The Eastgate Office Building, a 153 KW project in Edmonton, Alberta developed by Great Canadian Solar.SASKATCHEWAN
Canada’s breadbasket has a terrific renewable resource;
all that’s missing is leadership NUMBERS AT A GLANCE
Owing to a deep reliance on coal and natural gas, Saskatchewan’s power sector
releases more carbon pollution per capita than that of any other province. Fossil
fuels supply provincial utility SaskPower with three-quarters of its electricity — some 25.7% 20
scattered hydro and wind pick up the balance. There is no utility-scale solar, and no of grid is clean registered electric
provincial clean-energy policy in place. Instead, the province has chosen to focus on and renewable vehicles in 2013
carbon capture and storage (CCS) to cut emissions from its coal sector via projects
like Boundary Dam, which came online in 2014.
But with a world-class solar and wind resource, Saskatchewan’s clean power oppor-
$70 MILLION 18
renewable energy available public
tunity remains immense. On the plus side, in 2014 municipal utility Saskatoon Light
investment (2009 – 2013) chargers in 2013
and Power opened a 1.3 MW landfill-gas recovery plant that averts the release of
40,000 tonnes of greenhouse gas each year.
0.2 GW + 0.9 GW = TOTAL CLEAN ENERGY CAPACITY 1.1 GW = 440,000 2013
LARGEST PROJECTS BY POWER SOURCE IN SASKATCHEWAN
E.B. CAMPBELL DAM CENTENNIAL WIND WEYERHAEUSER SK*
SaskPower, Tobin Lake POWER FACILITY Weyerhaeuser,
288 MW = 135,364 SaskPower, Prince Albert
Swift Current 63 MW = 30,208
150 MW = 69,000
18 S P O T L I G H T O N S A S K AT C H E WA N *This facility was mothballed in August 2014 due to a lack of economically available feed stock.
Sources: CIEEDAC, SaskPower, Environment Canada National Inventory Report, Plug n’ Drive, Statistics Canada, WWF-Canada.SK
5 YEARS OF CUMULATIVE GROWTH 5 YEARS OF CUMULATIVE INVESTMENT
2% increase in total capacity since 2009 $70 million invested since 2009
3.0 10
2.5 8
Billions of dollars
2.0
Capacity (GW)
6
1.5
4
1.0
It’s a start! 2 It’s a start!
0.5
2009 2010 2011 2012 2013 2009 2010 2011 2012 2013
WIND
19
Something is missing from this photograph. Can you identify what it is?MANITOBA
This great hydroelectric powerhouse is increasingly looking to
play the role of battery for its neighbours NUMBERS AT A GLANCE
Manitoba’s grid stands in stark contrast to its western neighbour: it’s powered by
99.7 percent renewable energy, a mix of hydro and wind. As it expands its capacity,
the provincial crown utility is also exporting surplus power into the midwestern 99.7% 41
United States, with its vast hydroelectric dams serving as backup batteries for of grid is clean registered electric
the region’s burgeoning wind farms. Meanwhile, the province has set a target to and renewable vehicles in 2013
produce a total of 1 GW of wind power by 2016, but without supportive policy, few
expect it will attain it.
$1.8 BILLION 21
renewable energy available public
investment (2009 – 2013) chargers in 2013
0.3 GW + 5.2 GW = TOTAL CLEAN ENERGY CAPACITY 5.5 GW = 3 MILLION 2013
LARGEST PROJECTS BY POWER SOURCE IN MANITOBA
LIMESTONE ST. JOSEPH WIND FARM TOLKO MANITOBA KRAFT
GENERATING STATION Pattern Energy, PAPERS
Manitoba Hydro, Montcalm Tolko, The Pas
Nelson River 138 MW = 50,000 23 MW = 13,560
1,340 MW = 629,819
20 S P O T L I G H T O N S A S K AT C H E WA N A N D M A N I T O B A
Sources: CIEEDAC, Centre for Energy, The Climate Group, Government of Manitoba, Manitoba Hydro, Manitoba Clean Energy Plan, Plug n’ Drive, Saskatchewan Community Wind, WWF-Canada.MB
5 YEARS OF CUMULATIVE GROWTH 5 YEARS OF CUMULATIVE INVESTMENT
7% increase in total capacity since 2009 $1.8 billion invested since 2009
3.0 10
2.5 8
Billions of dollars
2.0
Capacity (GW)
6
1.5
4
1.0
0.5 2
2009 2010 2011 2012 2013 2009 2010 2011 2012 2013
WIND LARGE HYDRO
POWER SMART
Manitoba’s Powersmart
program helps citizens and
businesses save electricity and
natural gas. The program has
avoided the release of 700 kt
of GHG emissions, and saves
ratepayers more than $36
million each year.
21
The LEED-Platinum Manitoba Hydro Place is one of North America’s most energy-efficient office towers. Photo: Manitoba Hydro.FINDING OPPORTUNITY IN CLEAN-ENERGY CHALLENGES
Meet three startups and the innovations they’re shopping to the world
ENERGY STORAGE LIGHTING DISTRICT ENERGY
TEMPORAL POWER LED ROADWAY LIGHTING INTERNATIONAL
Mississauga, Ontario Halifax, Nova Scotia
WASTEWATER SYSTEMS
Electrical grids are getting smarter and carry- The roughly 35 million streetlights across Port Coquitlam, British Columbia
ing more renewable power. That’s a welcome Canada and the United States collectively
change, obviously, but also one that makes it consume enough electricity to light up four The common urban sight of steam billowing
trickier to balance supply and demand. The million homes. For the budget-strapped out of sewer grates is a sure sign of energy
sun doesn’t always shine, the wind doesn’t municipalities that operate them, that’s a big just waiting to be harnessed, and International
always blow, and power demand can shift invoice. Wastewater Systems has come up with an
sharply — but fortunately, this variability is economical way to do just that.
Cue LED Roadway Lighting. Since 2007, the
largely predictable. Enter Temporal Power,
company has manufactured high-efficiency This is important, explains president Lynn
which is creating affordable and reliable
LED streetlights; they’re now illuminating Mueller, because the waste heat in our sewer
energy storage to ensure grids are as respon-
roads in more than 35 countries. pipes represents an untapped supply of
sive as they need to be.
renewable energy, created when buildings
Demand is soaring as more learn about the
Temporal Power has developed an efficient heat water that ends up getting flushed down
potential energy savings that come from
mechanical battery in the form of a fly- the drain. Every person yields roughly 380
transitioning to LED systems. The lights con-
wheel — a magnetically levitating steel rotor litres of 21-degree C sewage daily.
sume up to 60 percent less power. They’re also
that can store electricity in the form of kinetic
designed to last for 20 years, which reduces The company’s sewage heat recovery system
motion for short periods. Flywheels don’t
maintenance costs. takes raw sewage generated from buildings
contain harmful chemicals, they operate for
and extracts and recirculates the residual
years without maintenance, and can charge With more than 275 million streetlights
heat. Energy savings and emissions reductions
and discharge thousands of times without globally, the opportunity for this Canadian
can be as high as 85 percent.
deterioration. firm is immense. No surprise the company
has enjoyed average annual sales growth of The system has been installed in townhouse
CEO Cam Carver says the worldwide appetite
48 percent for the past three years. As CEO developments, condominium buildings and
for short-term energy balancing is growing
Charles Cartmill says, “Business is taking off.” entertainment complexes around Vancouver.
in lockstep with the rise of renewable power.
“Because we are innovators in the waste heat
“Temporal Power offers the lowest total cost
recovery market we’re in a great position,”
of ownership solution with the highest energy
says Mueller. “The market size is incredibly vast.”
flywheels in the world,” he says.
22 | ENTREPRENEURS
Photo: Flywheel vessel created by Temporal Power. Source: Bloomberg New Energy Finance.THE CALGARY CONNECTION
BluEarth Renewables CEO Kent Brown
is our Canadian Innovator of the Year
“We’ve built a large business in a short period of
time in a challenging market,” says BluEarth
Renewables CEO Kent Brown.
Clearly, he’s doing something right.
Last year, under Brown’s leadership, the company
added nearly $400 million worth of PV and hydro-
electric projects to its portfolio — including five
plants that together bring 48.5 MW of clean solar
power onto Ontario’s grid. By the end of 2015,
BluEarth expects to have close to $650 million worth
of hydro, solar and wind plants online, and it’s on
track to have $1 billion of operating assets by 2017.
Brown’s firm does more than simply consult and
accommodate First Nations; it partners with them.
This past year BluEarth and the Batchewana First
Nation — its 50-50 partner — broke ground on the
60 MW Bow Lake Wind Project northwest of Sault
Ste. Marie, Ontario. It will be operational in the com-
ing year, generating not only clean electrons for the
province, but revenue for the nation. The company
also awards annual $3,000 Aboriginal Clean Energy
Scholarships to students pursuing post-secondary
education.
As this report went to press, Brown had just closed
on $81 million in equity financing from Ontario
Teachers’ Pension Plan and ARC Financial — the
firm’s two lead backers.
“We do things differently,” says the born-and-raised
Calgarian, who began his career as an oil-patch
bean counter. “We’re in communities for genera-
tions.” He certainly acts like it.
Photo: Brent MykytyshynONTARIO
Canada’s most populous province kicks coal to the curb
NUMBERS AT A GLANCE
As the first jurisdiction in North America to phase out coal power, supported by
a robust feed-in-tariff (FIT) policy to spur clean power development, Ontario is
a Canadian energy-transition leader. The province’s Long Term Energy Plan lays
the groundwork for its shift to a renewable energy system, and seeks to balance
cost-effectiveness, reliability, clean energy, community engagement, and conserva-
30% 1,500
of grid is clean registered electric
tion. The FIT program has been reformed several times over the years in response and renewable vehicles in 2013
to changing market conditions, but remains a pillar of Ontario’s energy and climate policy.
Having cemented its position as a North American leader in generation, Ontario
now has an opportunity to tap into the huge renewable energy opportunities
$8.7 BILLION 400
that it has in transportation, heating and cooling of buildings, storage, and smart- renewable energy available public
grid integration. investment (2009 – 2013) chargers in 2013
2.7 GW + 0.3 GW + 7.9 GW + 1.0 GW + 0.2 GW + 0.1 GW = TOTAL CLEAN ENERGY CAPACITY 12.2 GW = 4 MILLION 2013
LARGEST PROJECTS BY POWER SOURCE IN ONTARIO
SIR ADAM BECK ATIKOKAN RENEWABLE WOLFE ISLAND LONG SAULT RAPIDS SARNIA SOLAR PROJECT
GENERATING STATION II ENERGY GENERATION ECOPOWER CENTRE Algonquin Power, Enbridge, Sarnia
Ontario Power Ontario Power TransAlta, Cochrane 80 MW = 12,800
Generation, Authority, Atitkokan Wolfe Island 1 18 MW = 1,370 See back cover photo
Niagara River 205 MW = 120,849 98 MW = 54,018
1,418 MW = 666,480
24
Sources: CIEEDAC, Ontario Ministry of Energy, Plug n’ Drive, WWF-Canada.ON
5 YEARS OF CUMULATIVE GROWTH 5 YEARS OF CUMULATIVE INVESTMENT
24% increase in total capacity since 2009 $8.7 billion invested since 2009
3.0 10
2.5 8
Billions of dollars
2.0
Capacity (GW)
6
1.5
4
1.0
0.5
2
2009 2010 2011 2012 2013 2009 2010 2011 2012 2013
BIOMASS SOLAR WIND RUN-OF-RIVER BIOGAS
AFTER COAL WINNING COMBINATION FREE REIN
By avoiding the health In 2020, Ontario’s clean In Ontario, EV owners
and environmental costs electricity policies will can apply for a green licence
of coal power, Ontario provide over 10 times the plate which grants them
saves $3.4 billion cut to carbon pollution than access to HOV lanes and
each year. the federal government’s public charging at
coal-fired electricity transit stations.
regulations.
25
Touching up a wind turbine blade at the PowerBlades factory in Welland, Ontario. Photo: Joan Sullivan.QUÉBEC
Canada’s clean energy revolution has a decidedly French accent
NUMBERS AT A GLANCE
An economic-revitalization policy here has sprouted a forest of wind turbines on
the Gaspé Peninsula. All five of the top new clean energy projects that came online
in 2013 are Québec wind farms — the province has brought enough wind onto the
grid to light up more than a half-million homes. In 2013, Québec managed to retire
its aging nuclear plant. Today, the synergy of wind and hydro power now provide
99%+ 2,075
of grid is clean registered electric
almost every watt of Québec’s electricity. and renewable vehicles in 2013
Awash in surplus power, the province is looking to increase its electricity exports to
neighbouring provinces and the United States while courting industries and man-
ufacturers seeking steady, low-carbon power. The province is also pursuing electric $6.1 BILLION 530
vehicles, and promoting liveable urban density to lessen the need for driving. renewable energy available public
It’s also encouraging clean-energy space heating in homes, businesses, and facto- investment (2009 – 2013) chargers in 2013
ries to reduce natural gas use.
All in all, Québec is demonstrating an impressive commitment to the clean-energy
revolution.
2.4 GW + 0.8 GW + 43.3 GW + 0.1 GW = TOTAL CLEAN ENERGY CAPACITY 46.7 GW = 21 MILLION 2013
LARGEST PROJECTS BY POWER SOURCE IN QUÉBEC
ROBERT-BOURASSA LAC-ALFRED WIND FARM LEBEL-SUR-QUEVILLON MAGPIE PLANT ECO-CENTRE
Hydro-Québec, EDF, Rimouski Fortress Global, Thurso Riviere-St-Jean, Québec City of Montreal,
James Bay 300 MW = 238,990 50MW = 29,475 40 MW = 31,865 Riviere des Prairies
7,722 MW = 6,134,084 .0015 MW = 2
26 S P O T L I G H T O N T H E AT L A N T I C P R O V I N C E S Note: Québec’s renewable energy capacity calculations include the Churchill Falls Dam, located in the Province of Newfoundland and Labrador, as the project is majority-owned by
Hydro Québec and the majority of its power flows onto the Québec grid. Sources: Bloomberg New Energy Finance, CIEEDAC, Government of Quebec, Plug n’ Drive, WWF-Canada.QC
5 YEARS OF CUMULATIVE GROWTH 5 YEARS OF CUMULATIVE INVESTMENT
5% increase in total capacity since 2009 $6.1 billion invested since 2009
3.0 10
2.5 8
Billions of dollars
2.0
Capacity (GW)
6
1.5
4
1.0
0.5 2
2009 2010 2011 2012 2013 2009 2010 2011 2012 2013
WIND LARGE HYDRO RUN-OF-RIVER BIOGAS
UN TRÈS BON PLAN FORESTS OF STEEL
Québec’s Energy Plan, Four of the nation’s five
supported by requests for largest clean energy
clean energy proposals, projects commissioned in
spurred almost half of all 2013 were wind farms in
clean energy investment in Québec.
Canada between 2006
and 2013.
27
Québec’s Electric Circuit is one of Canada’s largest public charging station networks for plug-in vehicles. Photo: Hydro Québec.THE ATLANTIC PROVINCES
Fossil fuels still keep the lights on in several east-coast provinces.
But that’s about to change. NUMBERS AT A GLANCE
Here on the edge of the Atlantic, the clean-energy conversation revolves around
the Maritime Link — a federally-backed $7.7 billion hydroelectric generation and
transmission project that stands to transform the region’s electricity system. 70% 39
When complete in 2017, the link will allow participating provinces to more easily of grid is clean registered electric
share power and develop their own clean energy sources, sharply reducing fossil and renewable vehicles in 2013
fuel dependence.
That said, you don’t have to be big to make a difference. As one example, tiny Prince
Edward Island has made tremendous progress harnessing its wind resource. Publicly-
$1.5 BILLION 105
renewable energy available public
owned wind turbines provide between 18 and 30 percent of the province’s power.
investment (2009 – 2013) chargers in 2013
Meanwhile New Brunswick has cemented its reputation as a regional leader in
smart grid research and development. In 2012, the province announced a partner-
ship with Siemens to develop a Smart Grid Centre of Competence and a compre-
hensive smart grid program.
In Nova Scotia, community and marine feed-in tariffs hold the promise of spurring
new projects. Despite this progress, this year the province slashed funding to
Efficiency Nova Scotia, hamstringing the agency.
0.76 GW + 0.06 GW + 2.81 GW + 0.02 GW + 0.13 GW = TOTAL CLEAN ENERGY CAPACITY 3.75 GW = 1.4 MILLION 2013
LARGEST PROJECTS BY POWER SOURCE IN THE ATLANTIC PROVINCES
CHURCHILL FALLS KENT HILLS EDMUNDSTON PULP MILL TINKER HYDRO STATION ANNAPOLIS TIDAL
GENERATING STATION TransAlta and Natural Twin Rivers Paper Aristook, STATION
Nalcor Energy, Forces Technologies, Company, Edmundston New Brunswick Nova Scotia Power,
Churchill Falls Kent Hills 38 MW = 23,644 35 MW = 16,730 Annapolis Royal
5,428 MW = 3,091,960 150 MW = 39,433 20MW = 2,728
28 S P O T L I G H T O N T H E AT L A N T I C P R O V I N C E S Note: The Churchill Falls Generating Station, located in the Province of Newfoundland and Labrador, has been in Québec’s renewable energy capacity calculations as the dam is majority
owned by Hydro Québec, and the majority of the power it generates flows onto Québec’s grid. Sources: CIEEDAC, Centre for Energy, NB Power, Nalcor Energy, Plug n’ Drive, WWF-Canada.NB NL
NS PEI
5 YEARS OF CUMULATIVE GROWTH 5 YEARS OF CUMULATIVE INVESTMENT
10% increase in total capacity since 2009 $1.5 billion invested since 2009
3.0 10
2.5 8
Billions of dollars
2.0
Capacity (GW)
6
1.5
4
1.0
2
0.5
2009 2010 2011 2012 2013 2009 2010 2011 2012 2013
BIOMASS WIND
A REAL TURN-OFF ON THE RIGHT TRACK MOON POWER
Efficiency Nova Scotia, the Nova Scotia is on track to The Fundy Ocean Research
nation’s first “efficiency utility,” source 40 percent of its Center for Energy, an hour
has reduced demand by 5.5 electricity from renewable south of Amherst, Nova
percent in four years. It’s on sources by 2020. Scotia, is a world-leading
target to cut carbon pollution tidal turbine testing facility.
by over a million tonnes
a year by 2020.
29CITIES LEADING
THE WAY
Three municipalities slashing emissions,
cutting waste, and boosting quality
of life for their residents
GUELPH, ON YELLOWKNIFE, NWT VANCOUVER, BC
By the year 2013, renewable energy sources When launched back in 2006, Yellowknife’s The Greenest City Action Plan, launched in
will help Guelph reduce energy use in build- Community Energy Plan set in motion a 2012, seeks to reduce greenhouse gas emis-
ings, industry and transportation by 50 per- number of municipal clean-energy initia- sions 33 percent below 2007 levels, and reduce
cent per capita, and carbon emissions by 60 tives — from biomass, to waste heat capture, energy use and carbon emissions in existing
percent per capita, below 2006 levels by the to building retrofits — that are still making buildings by 20 percent below the same
year 2031. The city also plans to use combined an impact today. This year the city met its benchmark. Further, the plan sets a goal that
heat and power and waste heat recovery. This target to reduce corporate carbon emissions residents will eventually make the majority
past winter, the city brought online the first 20 percent below 2004 levels. It also reduced of trips by foot, bicycle, and public transit.
of two district energy systems — a second community-wide carbon emissions six per- The fingerprints of the plan can be seen all
is planned for the coming year. It’s the first cent. Within three years, Yellowknife cut its over town, including a well-used and growing
community in North America to establish and corporate emissions 38 percent, exceeding network of separated bike lanes. A city-owned
announce a plan for an interconnected ther- its target by 18 percent. The city oversees a neighbourhood energy utility harvests heat
mal grid to serve industrial, commercial and biomass district energy system that reduces from sewage to help warm homes in a nearby
residential buildings across an entire city. carbon emissions 800 tonnes per year. residential district — reducing carbon pollu-
tion from heating in the area by 60 percent.
30 | LOCAL GOVERNMENT LEADERSHIP
Photo: Paul Krueger via FlickrYT NWT NU
THE NORTH
Nothing comes easy north of 60, but if there’s one thing
northerners know how to do, it’s improvise NUMBERS AT A GLANCE
With vast distances, frigid temperatures, and thin populations, Canada’s northern
territories face profound energy challenges — and innovative solutions.
Sky-high fuel prices are prompting many communities to explore alternative heat-
65.9% $32 MILLION
of grid is clean renewable energy
ing sources. Yellowknife’s Dene First Nation leaders in the village of N’dilo, in the and renewable investment (2009 – 2013)
Northwest Territories, have installed a wood-pellet boiler at a seniors’ home, and
plan to connect the system into the nearby gym and community services building.
Industry is similarly rising to the challenge. In 2012, the Diavik Diamond Mine
began powering its operation with the world’s most northern large-scale
wind-diesel hybrid power facility. This $31 million project is the first large-scale
wind farm in the Northwest Territories. With 17 GwH in annual production, this
project has reduced the mine’s yearly diesel fuel consumption by 3.8 million litres,
and has proven that wind energy is possible in the Arctic.
This year, the Québec provincial government granted $3 million to develop a cut-
ting-edge energy-storage system at Glencore’s Raglan Mine site, in Nunavik —
Québec’s far-north region. The off-grid system will combine wind turbines with
batteries, flywheel, and hydrogen storage. The company expects to reduce annual
diesel consumption by 2.5 million litres.
0.01 GW + 0.02 GW + 0.12 GW = TOTAL CLEAN ENERGY CAPACITY 0.15 GW = 62,000 2013
LARGEST PROJECTS BY POWER SOURCE IN THE NORTH
WHITEHORSE SNARE FORKS DIAVIK MINE WIND FARM
Yukon Energy Northwest Territories Rio Tinto, Lac de Gras
40 MW = 18,916 Power Corporation, 9.2 MW = 1,546
Snare River
11 MW = 5,258
Note: Québec’s renewable energy capacity calculations include the Churchill Falls Dam, located in the Province of Newfoundland and Labrador, as the project 31
is majority-owned by Hydro Québec and the majority of its power flows onto the Québec grid. Sources: CIEEDAC, Federation of Canadian Municipalities.Bombardier’s light-rail manufacturing plant in Derby, U.K. Photo: Getty Images.
WHERE WE CAN GO NEXT
Our long-term success here at home depends to a large extent on our success abroad
Canada has more than enough renewable energy A 2012 Natural Resources Canada analysis from ©© British Columbia’s smart meter expertise, emerg-
to provide all the energy needs of its citizens and global consultants McKinsey offered an upbeat ing cleantech cluster, and carbon pricing policy.
industry today and in 2050, according to the Trottier assessment of our nation’s clean-energy competitive- ©© Ontario’s vehicle manufacturing and cleantech
Energy Futures Project, which in 2013 completed an ness. In addition to our clear advantage in con- capacity, and financial expertise
inventory of Canada’s renewable energy potential. ventional hydropower, the report flagged Canada’s
©© Québec’s transportation equipment manufactur-
potential to take the lead in a number of emerging
Should we choose to revolutionize our energy sys- ing capacity, cleantech sector, and near zero-
clean energy markets — think solar photovoltaics,
tems, Trottier estimates that wind and solar could carbon electricity
marine energy, efficient buildings and industrial pro-
affordably and reliably provide half of Canada’s ©© Atlantic Canada’s marine renewables expertise
cesses, and bioenergy.
electricity needs by 2050 — more than 10 times the and research capacity
amount generated today. This would involve an That lines up with the findings of the National Round
investment of around $400 billion over the next 40 years. Table on the Environment and the Economy. In 2012, Conclusion? Canada’s clean energy opportunity
the think tank surveyed experts across Canada to get spans the nation. It’s time we unlocked that
But pursuing renewable energy here in Canada is potential.
a handle on our low-carbon strengths, and flagged a
not just about cleaning up our own power grids, but
laundry list of core competences including:
also about developing technologies and services and
marketing them around the world.
32 | NEXT STEPS
Sources: Analytica Advisors, Foreign Affairs, Trade and Development Canada, Natural Resources Canada, National Round Table on the Environment and Economy, Trottier Energy Futures Project.FEDERAL POLICY RECOMMENDATIONS
We kicked off this report by characterizing Ottawa’s current approach
to clean energy as indifferent. But change is in the air both at home
and abroad, and the opportunity looms larger than ever. Here’s how
we can capture a bigger slice of it.
Like virtually every national government around the START TO LEVEL THE PLAYING FIELD HELP BUILD CLEAN ENERGY PUT A PRICE ON CARBON
world, Ottawa could be doing more to support clean
energy and cut carbon pollution. FOR CLEAN ENERGY. INFRASTRUCTURE. POLLUTION.
When Ottawa wanted to boost The federal government has Carbon pricing may have become
But unlike some of our peers, the evidence shows that
the oil sands sector in the early a long tradition of supporting the policy that dares not speak
Ottawa needs to be doing a great deal more. So far,
1990s, the federal government nation-building infrastructure its name in Ottawa, but the
federal efforts on climate and clean energy simply
provided the industry tax incen- in partnership with Canada’s rest of the world is moving to
aren’t getting us where the government said we
tives and research support. It’s provinces and municipalities. internalise the costs that carbon
would go.
time to give a similar level of A new Building Clean Energy pollution imposes on all of us.
According to the federal government’s own pub- support to clean energy, starting Fund would speed up Canada’s Jurisdictions that account for
lic forecasts, all climate and clean energy policies with favourable tax treatment for clean energy transition by sup- more than 42 percent of global
adopted in Canada to date will still leave this coun- power storage and solar technol- porting transmission lines, smart GDP have already adopted
try well short of its 2020 climate target. In October ogies in Budget 2015. Currently, grids, infrastructure for electric some form of carbon pricing.
2014, Canada’s environment watchdog concluded Canada accounts for 2.5 percent vehicles, and cutting-edge clean In September 2014, the World
that although the government is considering further of global trade, but only 0.4 per- energy projects across Canada. Bank announced a massive show
measures, they will not be enough “to reverse the cent of the global clean energy of support for carbon pricing that
increasing trend in Canada’s total emissions.” market. included 73 countries, 22 subna-
tional jurisdictions, covering over
As Ottawa seeks out new markets and trade
USD $33 trillion worth of global
agreements, it needs to pay close attention to the
GDP — with Alberta, Québec,
immense opportunities in the global clean energy
British Columbia, and Vancouver
marketplace. With $44 trillion of investment in clean
among them — and more than
energy needed between now and 2050 to to avoid
1,000 companies and investors.
the worst impacts of climate change, Canadian busi-
Carbon pricing will make clean
nesses can contribute environmentally, and benefit
energy choices more competitive
economically.
and give fossil fuel users an incen-
At right, we propose three steps the federal govern- tive to be more efficient.
ment could take to help accelerate Canada’s clean
energy transition.
33You can also read


