Ranking the World's Sulfur Dioxide (SO2) Hotspots: 2019-2020 - A closer look at the colourless gas that is poisoning our air and health - Centre ...
←
→
Page content transcription
If your browser does not render page correctly, please read the page content below
Ranking the World’s Sulfur Dioxide
    (SO2) Hotspots: 2019-2020
     A closer look at the colourless gas
    that is poisoning our air and health
Writers:
Sunil Dahiya, Andreas Anhäuser, Aidan Farrow, Hubert Thieriot, Avinash Chanchal, Lauri
Myllyvirta
Data analysis and graphs:
Hubert Thieriot, Andreas Anhäuser, Lauri Myllyvirta
Project coordinators:
Xinyi Shen, Erin Newport, Minwoo Son, Jiyun Choi
Contributors:
Isabella Suarez, Meglena Antonova, Gokhan Ersoy, Jonathan Moylan, Nhlanhla Sibisi, Pablo
Ramírez, Elena Sakirko, Qian Liu, Ahmed El Droubi, Bondan Andriyanu, Denis Žiško, Erika
Uusivuori
Edited by:
Kathryn Miller
Designed by:
Lauren Austin
Suggested citation:
Dahiya, S., Anhäuser, A., Farrow, A., Thieriot, H., Kumar, A., & Myllyvirta, L. Global SO2 emission
hotspot database. Delhi: Center for Research on Energy and Clean Air & Greenpeace India.
48 pp. October 2020.
Published by:
Center for Research on Energy and Clean Air & Greenpeace India
Ranking the World’s Sulfur Dioxide (SO2) Hotspots: 2019-2020 1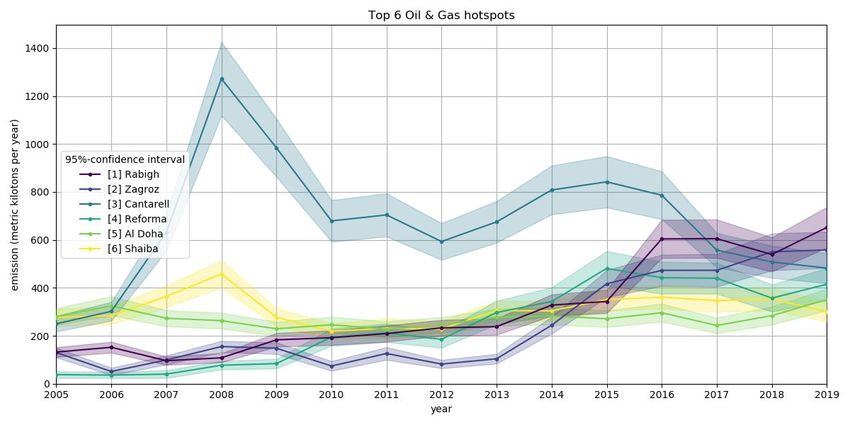
Executive summary
Sulfur dioxide (SO2) is a colourless air pollutant that is invisible to the human eye,
widespread and hazardous to human health. Breathing SO2 increases the risk of health
conditions including stroke, heart disease, asthma, lung cancer and premature death.
The single biggest source of SO2 is
from burning fossil fuels, including coal, oil and gas.
Dangerous levels of SO2 pollution are often found near coal-fired power plants, at oil
refineries and in areas that are dominated by heavy industry.
Report findings
For this CREA/Greenpeace1 report, researchers used satellite data and a global catalogue of
SO2 emissions sources from the United States National Aeronautics and Space
Administration (NASA) to detect emissions hotspots. The data were analysed to identify
source industries and emissions trends.
The findings indicate that anthropogenic SO2 emissions decreased by approximately 6%
worldwide in 2019. For only the second time on record, SO2 emissions decreased in all of the
top three countries with the greatest emissions: India, Russia and China. In India, emissions
fell for the first time in four years because of a reduction in the use of coal.
In 2019, India emitted 21% of global anthropogenic SO2 emissions, which was nearly twice
that of the world’s second largest emitter of SO2, Russia. The primary reason for India’s high
emissions is the expansion of coal-based electricity generation over the past two decades.
Although China was once the world’s biggest emitter of SO2, the country’s emissions have
plummeted by 87% since their 2011 peak, in large part due to strengthened emissions
standards and increased use of scrubbers at power plants. In 2019, China’s anthropogenic
SO2 emissions fell by 5%, the slowest rate of decrease in the past decade.
South Africa also experienced a sharp decline in SO2 emissions in 2019, bringing the
country’s SO2 emissions to their lowest level on record. Further investigations are required
to understand the reasons for such reductions. One of the potential factors could be the
temporary reduction of coal-fired generation capacity that led to the so-called “load
shedding” that year.
By contrast, SO2 emissions rose by 14% in Turkey in 2019, one of the few countries in which
emissions increased in that year. Coal-based energy production remains the major source
of SO2 emissions in Turkey.
The Norilsk smelter site in Russia was the biggest source of anthropogenic SO2 emissions in
the world in 2019. The Rabigh oil and gas hotspot in Saudi Arabia ranked second, and
Zagroz in Iran ranked third.
1
Within this report, "Greenpeace" refers to Greenpeace India, unless otherwise indicated.
Ranking the World’s Sulfur Dioxide (SO2) Hotspots: 2019-2020 2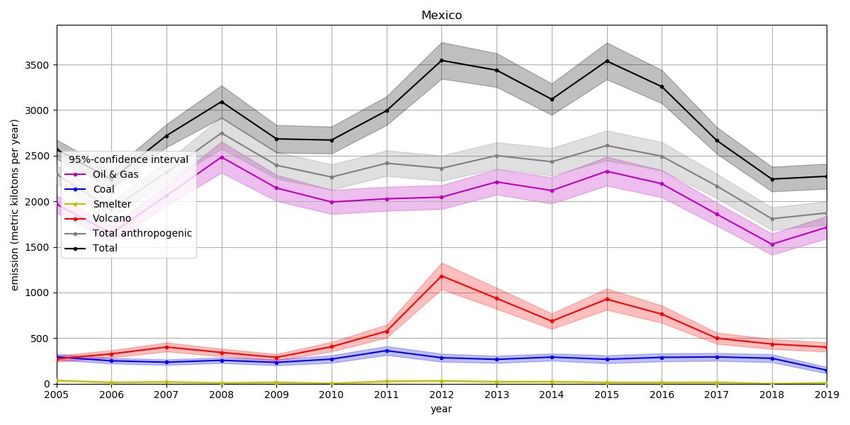
In Southeast Asia, the largest SO2 hotspot was the Suralaya coal cluster in Banten,
Indonesia, followed closely by Singapore’s oil and gas refineries.
Although SO2 concentrations
remain dangerously high, global SO2 levels
have continued to
fall through 2020, probably because of a reduction in energy demand as a result of the
COVID-19 pandemic. The largest reductions were observed in the coal and smelter sectors.
In many industrial areas there was a significant drop in the amount of SO2 detected by
satellites.
Greenpeace urges governments to halt all investment in fossil fuels and shift to safer, more
sustainable energy sources, such as wind and solar. At the same time, there is an urgent
need to strengthen emissions standards and apply flue gas pollution control technology at
power plants, smelters and other industrial SO2 emitters.
It is encouraging that all three countries with the highest emissions reduced their
emissions in 2019, but nonetheless SO2 pollution continues to threaten the health of billions
of people. The single biggest source of SO2 is fossil fuel combustion. In most cases, new
wind and solar technology is cheaper than coal, oil and gas, even before taking the cost of
air pollution and climate change into account.
The solutions to air pollution are clear and widely available. Governments must prioritise
renewable energy, halt investment in fossil fuels, and ensure that every person has access
to safe, clean air.
Ranking the World’s Sulfur Dioxide (SO2) Hotspots: 2019-2020 3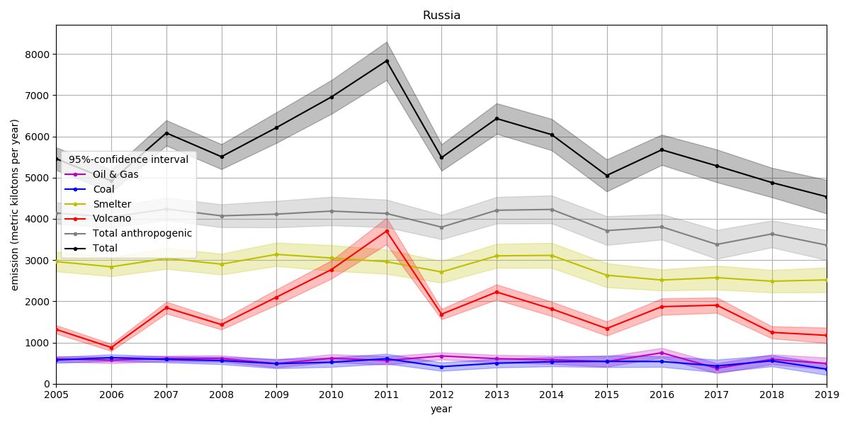
Contents
Contents 4
Introduction 5
Methodology 7
OMI and MEaSUREs SO2 emission catalogue 7
Limitations of satellite-based SO2 observations and emission estimates 9
Data coverage 9
Data uncertainty 9
South America: the South Atlantic Anomaly 9
Source type reclassification and renaming 10
Rankings 11
Interactive pollution map 11
Concentrations analysis in 2020 12
Results and analysis (NASA MEaSUREs) 13
Geographical regions 19
India 19
Russia 21
China 22
Saudi Arabia 23
Mexico 24
South Africa 25
Turkey 26
Europe 27
Australia 29
Southeast Asia 30
Major polluting sectors 31
Coal combustion 31
Oil and gas refining/power generation 34
Smelters 36
2020 trends (OMI Data) 37
Regions 38
Sectors 39
The way forward 43
Appendix A. Data uncertainty ranges 44
Appendix B. Power Station Emission Standards 47
Ranking the World’s Sulfur Dioxide (SO2) Hotspots: 2019-2020 4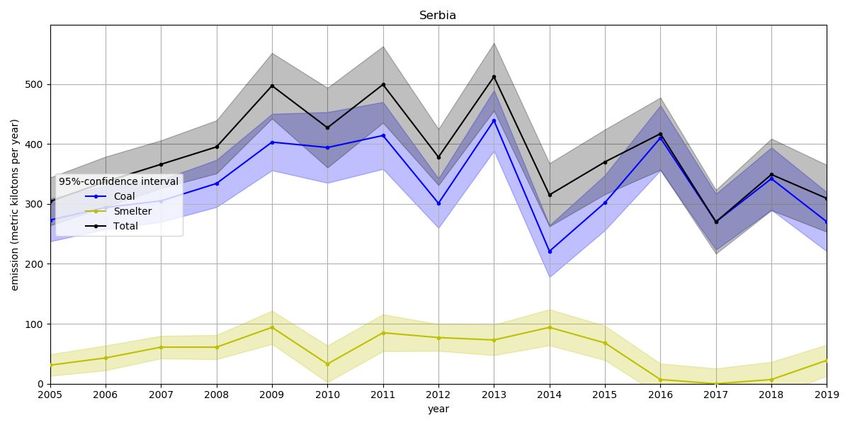
Introduction
Harmful substances are emitted when fossil fuels are burned, which has grave impacts on
both the climate and public health2,3. Combustion processes release greenhouse gases into
the air. Each year, an estimated 4.2 million people die because of exposure to ambient air
pollution, and an additional 3.2 million deaths are caused by indoor and household air
pollution according to an estimate by the World Health Organization (WHO) based on 2016
data4. Research published in 2020 that applied a refined methodology and updated risk
factors for different pollutants concluded that fossil fuel combustion alone caused an
estimated 4.5 million premature deaths in the 2019 and is responsible for approximately
3.3% loss to the GDP globally5.
Sulfur dioxide (SO2) is a toxic gas released when materials that contain sulfur, an element
found in all types of coal and oil resources, are burned. The health impacts caused by the
pollutant result from both direct exposure to SO2 as well as exposure to fine particulate
matter (PM2.5)6, which is produced when SO2 reacts with other air pollutants. Exposure to
SO2 and PM2.5 leads to health problems. Acute symptoms following SO2 exposure include: a
burning sensation in the nose, throat and lungs; breathing difficulties; and harm to the
respiratory system. Severe, chronic health impacts include: dementia7; fertility problems8;
reduced cognitive ability9; heart and lung disease; and premature death10. Researchers
estimate that secondary particles (sulfates and nitrates) formed through chemical
reactions from precursor gases such as SO2 and NOx comprise more than 10% of fine
particles in China11 and India12, and much more during some heavy pollution episodes13.
In addition to health impacts, every combustion process that emits SO2 also releases
substantial quantities of greenhouse gases into the atmosphere. Sources of SO2 thus have
a negative direct effect on human health as well as a negative long term impact on human
wellbeing through their associated emissions of greenhouse gases, which drives global
warming.
2
Ramanathan, V. Climate Change, Air Pollution, and Health: Common Sources, Similar Impacts, and Common Solutions. In:
Al-Delaimy W., Ramanathan V., Sánchez Sorondo M. (eds) Health of People, Health of Planet and Our Responsibility. Springer,
Cham. (2020). https://doi.org/10.1007/978-3-030-31125-4_5
3
Perera, F. Pollution from Fossil-Fuel Combustion is the Leading Environmental Threat to Global Pediatric Health and Equity:
Solutions Exist. Int. J. Environ. Res. Public Health 15(1), 16 (2017). https://doi.org/10.3390/ijerph15010016
4
Schraufnagel, D. E. et al. Air Pollution and Noncommunicable Diseases: A Review by the Forum of International Respiratory
Societies' Environmental Committee, Part 1: The Damaging Effects of Air Pollution. Chest 155(2), 409–416 (2019).
https://doi.org/10.1016/j.chest.2018.10.042
5
Farrow, A., Miller, K. A. & Myllyvirta, L. Toxic air: The price of fossil fuels. Seoul: Greenpeace Southeast Asia. 44 pp. February 2020.
6
Particles with aerodynamic diameter of approximately 2.5 μm.
7
Wu, Y.-C. et al. Association between air pollutants and dementia risk in the elderly. Alzheimers Dement. Amst. Neth. 1(2), 220–228
(2015). https://doi.org/10.1016/j.dadm.2014.11.015
8
Carré, J. et al. Does air pollution play a role in infertility?: A systematic review. Environ. Health 16, 82 (2017).
https://doi.org/10.1186/s12940-017-0291-8
9
Shehab, M.A. & Pope, F.D. Effects of short-term exposure to particulate matter air pollution on cognitive performance. Sci. Rep. 9,
8237 (2019). https://doi.org/10.1038/s41598-019-44561-0
10
Cohen, A. J. et al. Estimates and 25-year trends of the global burden of disease attributable to ambient air pollution: an analysis of
data from the Global Burden of Diseases Study 2015. Lancet 389(10082), 1907–1918 (2017).
https://doi.org/10.1016/S0140-6736(17)30505-6
11
Huang, R. J. et al. High secondary aerosol contribution to particulate pollution during haze events in China. Nature, 514(7521),
218–222 (2014). https://doi.org/10.1038/nature13774
12
Nagar, P.K. et al. Characterization of PM2.5 in Delhi: role and impact of secondary aerosol, burning of biomass, and municipal solid
waste and crustal matter. Environ. Sci. Pollut. Res. 24(32), 25179–25189 (2017). https://doi.org/10.1007/s11356-017-0171-3
13
Wang, G. et al. Persistent sulfate formation from London Fog to Chinese haze. PNAS USA 113(48), 13630–13635 (2016).
https://doi.org/10.1073/pnas.1616540113
Ranking the World’s Sulfur Dioxide (SO2) Hotspots: 2019-2020 5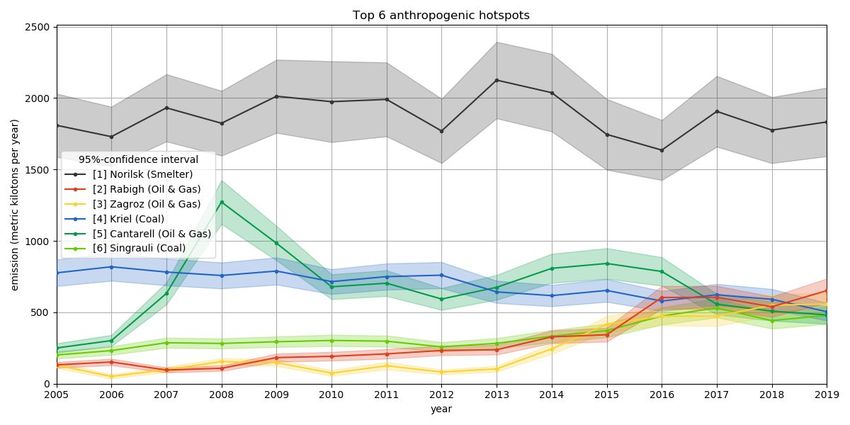
According to NASA MEaSUREs data catalogue more than two-thirds (68%) of SO2 emissions
have anthropogenic origin. SO2 is primarily emitted by industrial facilities that burn fossil
fuels, either to generate electric power or to extract metal from ore (smelter). Other
anthropogenic sources are locomotives, ships and other vehicles or heavy equipment that
burn fuel with a high sulfur content.
Volcanoes are the only major natural source of SO2, accounting for less than one-third (32%)
of present-day SO2 emissions.
By documenting and understanding the global sources of SO2 emissions, measures can be
put in place to stop SO2 pollution, reduce the health impacts of air pollution and expose the
toxic consequences of fossil fuel use. This CREA/Greenpeace report investigates the sources
and geographical distribution of the industries responsible for major SO2 emissions that
have been identified by the United States National Aeronautics and Space Administration
(NASA) across the globe.
Ranking the World’s Sulfur Dioxide (SO2) Hotspots: 2019-2020 6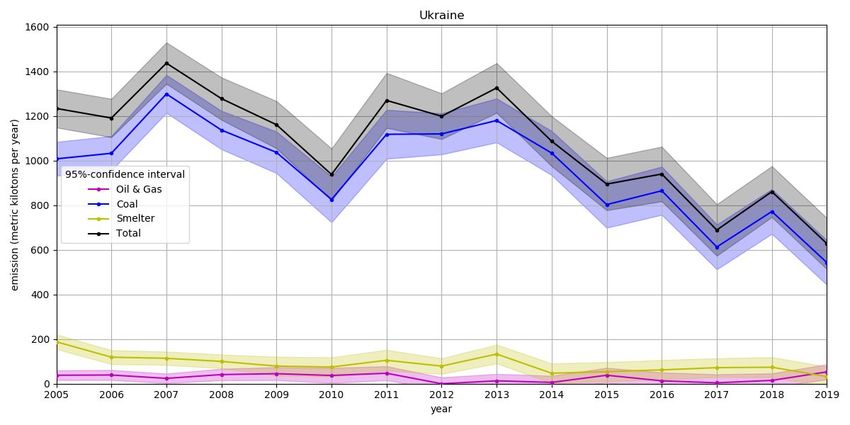
Methodology
Human-maintained catalogues of pollutant emissions sources, such as the Emission
Database for Global Atmospheric Research (EDGAR) inventory14, are sometimes incomplete
or out of date. The reasons for incomplete data sets include: the source may be new; the
strength of the emissions may have changed since the previous revision; or the source may
be unknown or unreported. This CREA/Greenpeace report analyses a global catalogue by
NASA MEaSUREs which lists SO2 emissions sources that have been derived from
satellite-based observations. The regions and industry sectors responsible for major SO2
emissions are identified in the catalogue and emissions trends are assessed through time.
The use of satellite data to detect and quantify major point sources of SO2 provides
annually updated, near worldwide data coverage that is not reliant on emissions reporting
on the ground.
OMI and MEaSUREs SO2 emission catalogue
The NASA Ozone Monitoring Instrument (OMI), a satellite-based device, has been
monitoring air quality from space since 2004 with high consistency. The NASA Making
Earth System Data Records for Use in Research Environments (MEaSUREs) programme
uses the measurements to detect and quantify major point sources of SO2 emissions across
the globe15. Satellite observations estimate the amount of SO2 in the atmosphere above a
point on the Earth’s surface, which is used to identify pollution hotspots (Box 1). NASA uses
a technique based on a comparison of upwind and downwind SO2 levels to make a
quantitative estimate of emissions rates for each hotspot. The emissions estimates are
validated against in situ measurements in the United States and the European Union (EU)16,
17
. Because the technique does not rely on an a priori knowledge of source locations, it also
detects new sources or those that are missing from other emission inventories. NASA’s
worldwide observation coverage makes it possible to identify global pollution hotspots18.
The NASA MEaSUREs SO2 emissions source catalogue provides the geographical location
and rates of emissions for hotspots for each calendar year. The catalogue is used to group
the detected sources into four categories: one natural category (volcanoes) and three
anthropogenic categories: power plant, oil and gas, and smelter. A complete list of all
anthropogenic SO2 emissions hotspots identified by OMI (NASA_Aura Satellite) can be
found here.
14
European Commission, Joint Research Centre (JRC)/Netherlands Environmental Assessment Agency (PBL). Emission Database
for Global Atmospheric Research (EDGAR), release version 4.3.1 http://edgar.jrc.ec.europa.eu/overview.php?v=431, 2016.
15
National Aeronautics and Space Administration. MEaSUREs SO2 source emission catalogue. Retrieved from
https://so2.gsfc.nasa.gov/measures.html on Sept 14, 2020.
16
Fioletov, V. et al. Multi-source SO2 emission retrievals and consistency of satellite and surface measurements with reported
emissions. Atmos. Chem. Phys. 17, 12597–12616 (2017). https://doi.org/10.5194/acp-17-12597-2017
17
Fioletov, V. et al. Multi-Satellite Air Quality Sulfur Dioxide (SO2) Database Long-Term L4 Global V1, Greenbelt, MD, USA, Goddard
Earth Science Data and Information Services Center (GES DISC) (2019). Accessed Sept 23, 2020.
https://doi.org/10.5067/MEASURES/SO2/DATA403
18
Fioletov, V. E. et al. A global catalogue of large SO2 sources and emissions derived from the Ozone Monitoring Instrument. Atmos.
Chem. Phys. 16, 11497–11519 (2016). https://doi.org/10.5194/acp-16-11497-2016.
Ranking the World’s Sulfur Dioxide (SO2) Hotspots: 2019-2020 7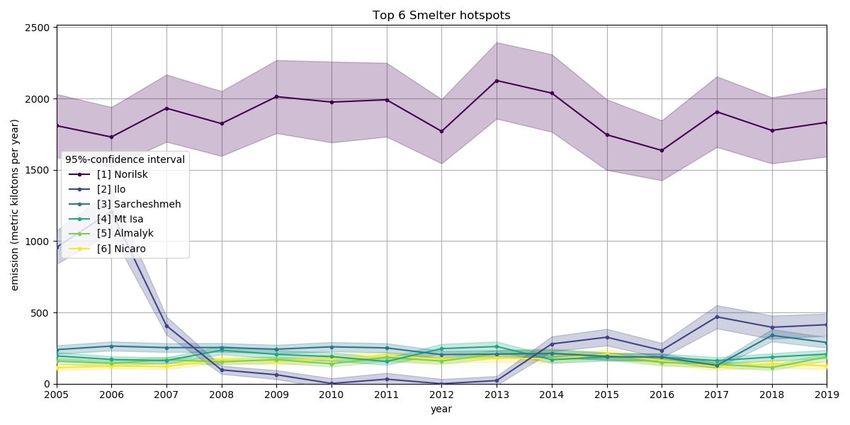
What are SO2 emissions and what is SO2 column amount?
Emission rate:
The emission or emission rate describes the quantity of a pollutant (for example, SO2)
that is released into the atmosphere by a certain source within a certain time period.
The most important sources for SO2 emissions are coal-fired power stations, smelter
sites, the oil and gas industry and volcanoes. Units of emission include ‘kilograms per
hour’, ‘kilotonnes per year’ and ‘megatonnes per year’. The quantity or ‘emission
(rate)’ is only meaningful for sources of SO2 and not for locations away from the
sources.
Column amount
The boundary layer column amount, which is abbreviated to column amount, is the
total amount of an air pollutant that is present in the lowest layer of the Earth’s
atmosphere, which is called the ‘planetary boundary layer’19. For example, this could
be all the SO2 pollution that is found in the (virtual) column of air above a 1 km square
area between the Earth’s surface and the top of the boundary layer. Column amount
is the quantity of pollutant that satellite instruments usually measure because those
instruments can penetrate the entire thickness of the atmosphere. Units for
recording the quantity of air pollutants are ‘kilograms per square metre’ or the
special unit, Dobson unit (DU). Because SO2 sources are located at the Earth’s surface,
they emit into the boundary layer. In general, there is little vertical mixing from the
boundary layer into the atmospheric layers above. The biggest part of the SO2
pollution remains within the boundary layer before it sediments or converts into
other chemicals.
What is the relationship between emission rate and column amount?
Emitted pollutants are dispersed in the atmosphere and transported to locations
away from the source through wind and turbulence, before they sediment or convert
into other chemicals. Therefore, locations that are far from emission sources may also
become polluted. In general, air is more likely to be polluted in the proximity of an
emission source than far away from it. On a map, emission sources are usually
surrounded by an area of high column amount.
Column amount can be used as a proxy for emission, but it is important to note that
the two are not the same thing. For example, a strong wind will blow pollution away
from an emitting source, even if emissions are high. The area close to the source of
the emissions will thus have a relatively low column amount. However, using annual
emission means averages out data anomalies caused by meteorological events such
as high wind. On the map of annual mean emissions, virtually all hotspots are
surrounded by areas with high column amounts of SO2.
Box 1: Definition of SO2 emission rate and SO2 column amount.
19
The planetary boundary layer has a thickness of up to a few kilometers. The thickness varies depending on the time and global
location. The planetary boundary layer is also known as the atmospheric boundary layer.
Ranking the World’s Sulfur Dioxide (SO2) Hotspots: 2019-2020 8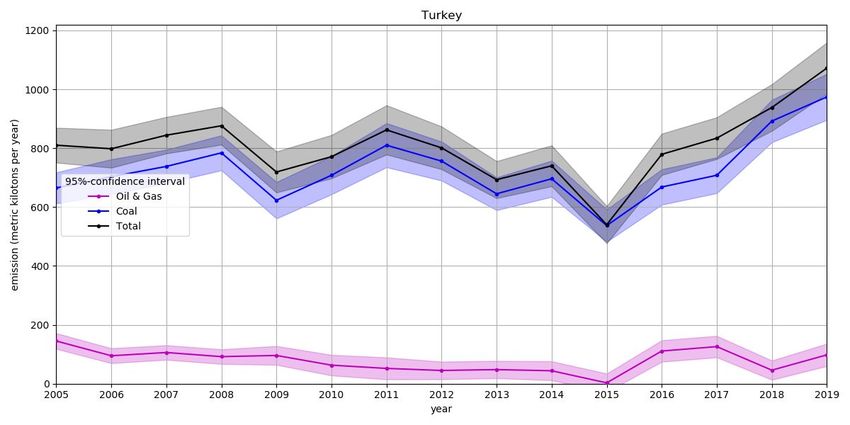
Limitations of satellite-based SO2 observations and
emission estimates
Data coverage
Satellite-based approaches for detecting and quantifying major point sources of SO2
provide near continuous worldwide data coverage. However the satellites are limited by
data resolution, noise and artifacts and so only large SO2 sources
are detected and
quantified reliably; sources that emit less than ~50 kt/yr tend to have large relative
uncertainties20. NASA estimates that sources emitting less than 30 kt/yr are not reliably
detected and that the MEaSUREs catalogue accounts for about half of all known
anthropogenic SO2 emissions
worldwide21. The detection ratio is relatively constant for most
large countries and regions (50±15%) when compared to bottom-up emission inventories
across different regions. Therefore, the dataset can be used to detect regional emissions
trends even though the absolute values of emissions estimates do not necessarily equate
to the total emissions from a country or region.
Data uncertainty
The precision of emissions estimates varies from one hotspot to another. Uncertainty in the
underlying satellite data increases in the high latitudes, reducing confidence in estimates
for hotspots in these regions. For hotspots with low emissions, catalogue estimates of the
emission amount are not reliable because the uncertainty range may be as large as the
value itself. For the country totals presented in the main part of this report, all hotspots
listed in the catalogue are taken into account. When calculating country totals it is
assumed that the uncertainty ranges given by NASA are meaningful even for small
emission values and the errors between different hotspots are not correlated (no
systematic error).
South America: the South Atlantic Anomaly
An additional source of uncertainty of particular importance is the South Atlantic Anomaly
(SAA) (Fig. 1). The SAA affects an area covering part of South America and the southern
Atlantic Ocean. Above this area the Earth’s magnetic field traps high-energy charged
particles and these particles substantially decrease the quality of OMI sensor
measurements, thereby increasing the uncertainty in emission estimations22. As a
consequence, the emissions data for Argentina, Brazil, Chile, Peru, Bolivia, Paraguay and
Uruguay (the latter three are completely absent in the data set) cannot claim the same
accuracy and completeness that prevail in other regions of the world. NASA advises to treat
data from the South America and the southern Atlantic Ocean region with caution.
20
See full hotspot list.
21
Fioletov, V. E. et al. A global catalogue of large SO2 sources and emissions derived from the Ozone Monitoring Instrument. Atmos.
Chem. Phys. 16, 11497–11519 (2016). https://doi.org/10.5194/acp-16-11497-2016
22
Zhang, Y. et al. Continuation of long-term global SO2 pollution monitoring from OMI to OMPS. Atmos. Meas. Tech. 10, 1495–1509
(2017). https://doi.org/10.5194/amt-10-1495-2017
Ranking the World’s Sulfur Dioxide (SO2) Hotspots: 2019-2020 9Figure 1. Visualisation of the area affected by the South Atlantic Anomaly (yellow area) derived from figures and
descriptions presented in Zhang et al (2017)23 and Royal Belgian Institute for Space Aeronomy24. Affected SO2
hotspots are shown in red. Data from the region covered by the anomaly must be used with caution. Sources of
sulfur dioxide that exist in the South America Anomaly may not be detected. Map data copyrighted
OpenStreetMap contributors and available from https://www.openstreetmap.org
Source type reclassification and renaming
The original NASA MEaSUREs data set provides a name and source type for each hotspot.
Source types are either ‘power plant’, ‘oil and gas’, ‘smelter’ or ‘volcano’. T
he dominant
industry of a hotspot cluster may have changed over the years since first publication in
2005, but the change may not be reflected in the source type classification in NASA’s
catalogue.
In this CREA/Greenpeace report, classifications and names in the catalogue have been
updated when source sectors are known to have changed or when hotspot naming is not
intuitive. The following modifications are made:
● Reclassification. The NASA source type ‘power plant’ is replaced with the source
type ‘coal’ if it is a coal-fired power plant, or replaced with ‘oil and gas’ for gas-fired
power plants/stations. A manual review of all listed anthropogenic hotspots in the
original catalogue was carried out and (re)classified as ‘coal’, ‘oil and gas’ or ‘smelter’.
23
Zhang, Y. et al. Continuation of long-term global SO2 pollution monitoring from OMI to OMPS. Atmos. Meas. Tech. 10, 1495–1509,
(2017). https://doi.org/10.5194/amt-10-1495-2017
24
Royal Belgian Institute for Space Aeronomy. 2011. https://sacs.aeronomie.be/info/saa.php (Accessed: 28.09.2020)
Ranking the World’s Sulfur Dioxide (SO2) Hotspots: 2019-2020 10● Secondary industries. Hotspots can in reality be an aggregation of multiple
individual nearby SO2 sources from more than one industry. In such cases,
information describing secondary industries was added to better represent the
contributions of individual emitters within a larger hotspot, rather than just that of
the biggest emitter. The secondary information is contained in the final data set.
Rankings, however, are performed based on the principal source type.
● Renaming. In some cases, the hotspots in the catalogue have been renamed so
that they are more readily identifiable to the reader. The names of the principal
polluters are used where NASA has used a company name, and this is the only
identifiable source in the region, this naming choice has been left unchanged. In
cases where additional potential sources were identified, the name of the
geographical region is used instead.
All modifications are documented in the full hotspot list.
Rankings
We used the modified catalogue to rank countries by SO2 emissions at key hotspots. We
also ranked the emissions clusters themselves according to their annual emissions of
anthropogenic SO2.
Interactive pollution map
An interactive map showing the raw OMI SO2 column amounts together with the locations
of the SO2 emission sources listed in the NASA catalogue is available at
energyandcleanair.github.io/202008_hotspots/ (see Box 1 for the difference between
column amount and emission rate). Fig. 2 shows a screenshot of the map.
Figure 2: Column amount of SO2 detected by the Ozone Monitoring Instrument (OMI) sensor in 2019. The
interactive map can be found at https://energyandcleanair.github.io/202008_hotspots/
Ranking the World’s Sulfur Dioxide (SO2) Hotspots: 2019-2020 11Concentrations analysis in 2020
Global emissions data for 2020 has not yet been made available by the NASA MEaSUREs
project. Therefore, observed SO2 column amounts are analysed as an indirect indicator of
SO2 emissions. The column amount data (expressed in Dobson units) were retrieved from
the NASA OMI sensor in a 50 km radius around each individual hotspot.
SO2 column amount data only provide an indirect indication of SO2 emissions because the
relationship between an observed column amount and the source emission amount is
affected by weather conditions and pollutant dispersion. Nevertheless, analysis of observed
SO2 column amounts from 2020 can help to identify the most recent trends (see section:
2020 trends).
In this CREA/Greenpeace analysis, anthropogenic SO2 is estimated from the column
amounts observed by the satellite, which includes both anthropogenic and volcanic SO2.
The raw observations are filtered using thresholds specified in the NASA MEaSUREs
methodology to estimate the anthropogenic SO225.
E
25
Fioletov, V. E. et al. A global catalogue of large SO2 sources and emissions derived from the Ozone Monitoring Instrument.
Atmos. Chem. Phys. 16, 11497–11519 (2016). https://doi.org/10.5194/acp-16-11497-2016
Ranking the World’s Sulfur Dioxide (SO2) Hotspots: 2019-2020 12Results and analysis
In 2019, more than two-thirds (68%) of total emissions detected by the MEaSUREs
programme were caused by human activity. Anthropogenic sources of SO2 are found in
locations that have high fossil fuel consumption (coal burning, oil refining and combustion)
or host smelter sites.
Figure 3. Global contributions of major industry sectors and natural sources (volcanoes) to total SO2 emissions
from 2005 to 2019 (in kilotonnes per year). Data source: NASA MEaSUREs.
Figure 4: Global contributions of major industry sectors and natural sources (volcanoes) to total SO2 emissions in
2019 (in kilotonnes per year). Data source: NASA MEaSUREs.
Locations dominated by coal combustion for power generation and industries accounted
for 36%, those dominated by oil and gas refining or combustion for 21% and those
dominated by smelters for 12% of the worldwide anthropogenic SO2 emissions (Fig. 3, Fig.
4, Table 1).
Ranking the World’s Sulfur Dioxide (SO2) Hotspots: 2019-2020 13Figure 5. The contributions of the six largest anthropogenic SO2 emissions sources from 2005 to 2019 (in
kilotonnes per year). Data source: NASA MEaSUREs.
The Norilsk (Норильск) smelter site in Russia continues to be the largest anthropogenic
SO2 emission hotspot in the world26, followed by the Rabigh (Saudi Arabia) and Zagroz
(Iran) oil and gas hotspots and the Kriel coal burning area in the Mpumalanga province in
South Africa (Fig. 5, Table 2). Other countries that have high coal consumption or oil and
gas refining and combustion, such as Cantarell (Mexico) and Singrauli27 (India), have high
SO2 emissions primarily because they have high fossil-fuel consumption and slow
implementation of stringent emission standards.
26
In many cases, the total emissions for a region cannot be attributed to an exact source because emissions from large sources
may obscure those of other smaller contributors in the nearby vicinity. Where multiple industries are present in the cluster, we
take the largest sources (coal; oil and gas or smelter) to represent all other sources.
27
Named ‘Vindhyachal’ in the original NASA catalogue.
Ranking the World’s Sulfur Dioxide (SO2) Hotspots: 2019-2020 14Table 1: Global contributions of major industry sectors and natural sources (volcanoes) to total SO2 emissions in
2018 and 2019 (in kilotonnes per year). Data source: NASA MEaSUREs.
SO2 Emissions in 2018 & 2019 (kt/year) from all sources.
Source 2018 2019
Coal 16,038 14,972
Oil & Gas 9,337 8,850
Smelter 5,229 4,883
Volcano 18,384 13,227
Total 48,987 41,932
Table 2: The top 50 anthropogenic SO2 emission hotspots. Data source: NASA MEaSUREs (partially renamed
and/or reclassified, as described above).
Emissions 2019 (kt)
Rank Hotspot Country / Region Source type (95%-confidence interval)
best estimate low estimate high estimate
1 Norilsk Russia Smelter 1,833 1,598 2,068
2 Rabigh Saudi Arabia Oil & Gas 652 569 735
3 Zagroz Iran Oil & Gas 558 484 632
4 Kriel South Africa Coal 504 443 564
5 Cantarell Mexico Oil & Gas 482 420 544
6 Singrauli India Coal 479 420 538
7 Reforma Mexico Oil & Gas 415 349 481
8 Ilo Peru Smelter 414 338 489
9 Matimba South Africa Coal 362 319 406
10 Al Doha Kuwait Oil & Gas 351 307 395
11 Kemerkoy Turkey Coal 328 280 376
12 Afsin Elbistan Turkey Coal 307 266 348
13 Shaiba Saudi Arabia Oil & Gas 301 260 342
14 Neyveli India Coal 299 260 338
15 Fereidoon Saudi Arabia Oil & Gas 291 243 339
16 Sarcheshmeh Iran Smelter 289 253 326
17 Korba India Coal 282 244 320
18 Das Island United Arab Oil & Gas 271 229 312
Ranking the World’s Sulfur Dioxide (SO2) Hotspots: 2019-2020 15Emirates
19 Mubarek Uzbekistan Oil & Gas 245 212 278
20 Jeddah Saudi Arabia Oil & Gas 233 197 268
21 Talcher India Coal 221 189 253
22 Mt Isa Australia Smelter 208 180 237
23 Tula Mexico Oil & Gas 200 170 230
24 Nikola Tesla Serbia Coal 197 158 236
25 Almalyk Uzbekistan Smelter 188 162 215
26 Kurakhovskaya Ukraine Coal 180 142 218
27 Visakhapatnam India Coal 172 141 203
Maritsa East
industrial
28 complex Bulgaria Coal 170 135 205
29 Mundra India Coal 164 135 193
30 Khangiran Iran Oil & Gas 162 139 185
31 Kutch India Coal 161 136 186
32 Koradi India Coal 158 134 182
33 Zhezkazgan Kazakhstan Coal 155 125 185
34 Jubail Saudi Arabia Oil & Gas 154 128 180
35 Majuba South Africa Coal 149 125 173
36 Chennai India Coal 142 119 166
37 Vuglegirska Ukraine Coal 138 100 177
38 Ekibastuz Kazakhstan Coal 137 96 179
39 Pavlodar Kazakhstan Coal 136 96 175
Chandrapur,
40 Maharashtra India Coal 135 115 156
41 Lethabo South Africa Coal 135 114 156
42 Baghdad Iraq Oil & Gas 134 113 155
Bosnia and
43 Tuzla Herzegovina Coal 132 99 165
44 Tuxpan Mexico Oil & Gas 130 103 158
45 Nuevitas Cuba Oil & Gas 130 104 156
Ranking the World’s Sulfur Dioxide (SO2) Hotspots: 2019-2020 1646 Suralaya Indonesia Coal 128 108 149
47 Singapore Singapore Oil & Gas 127 102 152
48 Wuan China Coal 125 100 151
49 Nicaro Cuba Smelter 125 100 150
50 Novocherkassk Russia Coal 121 77 165
Countries have different levels of SO2 emissions (Fig. 6; Table 2) depending on the
presence of emitting industries and the stringency and enforcement of emissions
regulations. The largest sources of SO2 pollution are discussed below; the full data set can
be explored in an interactive map at:
https://energyandcleanair.github.io/202008_hotspots/
Figure 6: The 25 countries that emitted the greatest amount of anthropogenic SO2 in 2019 (kilotonnes per year).
Data source: NASA MEaSUREs.
Ranking the World’s Sulfur Dioxide (SO2) Hotspots: 2019-2020 17Table 3: The 25 countries that emitted the greatest amount of anthropogenic SO2 (kt/yr) in 2018 and 2019,
estimated by NASA28. See Table A1 and Table A2 for uncertainty ranges and wording scheme. Data source: NASA
MEaSUREs.
Confidence
Relative Direction of
Rank Country / Region 2018 2019 in direction
change change
of change
virtually
- worldwide 30,604 28,704 -6% down certain
virtually
1 India 6,329 5,953 -6% down certain
2 Russia 3,635 3,362 -8% down likely
3 China 2,263 2,156 -5% down likely
4 Saudi Arabia 1,861 1,910 3% uncertain
5 Mexico 1,809 1,873 4% up likely
virtually
6 Iran 1,977 1,746 -12% down certain
virtually
7 South Africa 1,388 1,187 -15% down certain
8 Turkey 938 1,072 14% up very likely
9 United States 864 823 -5% uncertain
10 Kazakhstan 776 760 -2% uncertain
virtually
11 Ukraine 861 628 -27% down certain
12 Australia 627 610 -3% uncertain
13 Cuba 543 530 -2% uncertain
virtually
14 Uzbekistan 319 433 36% up certain
15 Peru 396 414 5% uncertain
16 Kuwait 394 396 1% uncertain
virtually
17 Turkmenistan 251 325 30% up certain
18 Serbia 349 309 -12% down likely
United Arab virtually
19 Emirates 419 271 -35% down certain
20 Brazil 205 262 28% up likely
21 Bulgaria 263 258 -2% uncertain
22 Canada 187 240 28% uncertain
virtually
23 Iraq 370 223 -40% down certain
24 Morocco 171 197 15% up likely
25 Pakistan 235 180 -23% down very likely
28
The figures for Brazil and Peru must be considered with caution; see discussion about the South Atlantic Anomaly in the
Methods section.
Ranking the World’s Sulfur Dioxide (SO2) Hotspots: 2019-2020 18Geographical regions
The following section provides an overview of the regions
that are responsible for some of the world’s highest global
SO2 emissions. Reasons for the high emissions together
with emissions trends and how those emissions may
change in the future are suggested.
India
Figure 7: Contributions of major industry sectors and natural sources (volcanoes) to total SO2 emissions from
2005 to 2019 in India (kilotonnes per year). Data source: NASA MEaSUREs (partially reclassified, as described
above).
India is the largest emitter of SO2 in the world, contributing more than 21% of global
anthropogenic SO2 emissions according to the NASA MEaSUREs catalogue. India’s SO2
emissions decreased by approximately 6% in 2019, the first decrease in four years. Despite
the decrease, India’s emissions remain very high. The primary reason for India’s high
emissions is the expansion of coal-based electricity generation over the past two decades
(Fig. 7). The majority of power stations in India lack flue-gas desulfurization technology to
reduce the emission of air pollutants. The biggest emission hotspots in the country are
thermal power stations (or clusters of power stations): Singrauli29, Neyveli, Sipat, Mundra,
Korba, Bonda, Tamnar, Talcher, Jharsuguda, Korba, Kutch, Chennai, Ramagundam,
Chandrapur and Koradi.
29
Named ‘Vindhyachal’ in the original NASA data set.
Ranking the World’s Sulfur Dioxide (SO2) Hotspots: 2019-2020 19In a first step to address rising air pollution levels, the Ministry of Environment, Forest and
Climate Change (MoEF&CC) introduced SO2 emission limits for coal-fired power stations for
the first time in December 2015. However, the deadline of December 2017 for the
installation of flue-gas desulfurization in power stations was shifted to 2022 after all units
failed to install the technology within the given time frame30. According to reports, most
power stations with phasing timelines (staggered timeline for different units) until June
2020 failed to install flue-gas desulfurization even with the extended timeline and are
currently operating without compliance to standards.31 Most other power stations are at
risk of being non-compliant because they have made very little progress to comply with
the phasing timeline before the December 2022 deadline32.
This year, the Indian government has advised to close down old thermal power stations
that do not meet the emission standards33 and also allocated 4,400 crores (about US$600
million) to address the air pollution crisis.34. On the positive side, India has begun its green
energy transition and has set itself one of the world’s most ambitious renewable energy
targets. The country has taken several steps to boost the renewable energy sector. The
renewable energy capacity has been increasing in India’s power sector, delivering more
than two-thirds of India’s new capacity additions during the fiscal 2019/2020 year35.
30
Patel, D. Toxic sulphur dioxide norms: 90% coal power plants not compliant. The Indian Express. Available at:
https://indianexpress.com/article/india/toxic-sulphur-dioxide-norms-90-coal-power-plants-are-not-compliant-4878396/
31
MoEF&CC. The Gazette of India: Extraordinary. Part II, Section 3, Sub-section (ii) S.O. 3305(S). New Delhi 2016. Available at:
http://moef.gov.in/wp-content/uploads/2017/08/Thermal_plant_gazette_scan.pdf
32
70% power plants won’t meet emission standards by 2022 deadline: CSE. The Hindu. Available at:
https://www.thehindu.com/sci-tech/energy-and-environment/70-power-plants-wont-meet-emission-standards-by-2022-deadline-
cse/article31642317.ece
33
MoEF&CC. The Gazette of India: Extraordinary. Part II, Section 3, Sub-section (ii) S.O. 3305(S). New Delhi 2016. Available at:
http://moef.gov.in/wp-content/uploads/2017/08/Thermal_plant_gazette_scan.pdf
34
Sinha, A. & Ashok, S. ‘Union Budget: Old, polluting coal power stations to be closed, says FM’ news report published on Feb. 2,
2020. The indian Express. Available at:
https://indianexpress.com/article/india/union-budget-old-polluting-coal-power-stations-to-be-closed-says-fm-6246629/ [accessed
Sept. 23, 2020].
35
Garg, V. ‘IEEFA India: Investment trends in renewable energy 2019/20’ news report published on June 9, 2020. Available at:
https://ieefa.org/ieefa-india-investment-trends-in-renewable-energy-2019-20/ [accessed Sept. 23, 2020].
Ranking the World’s Sulfur Dioxide (SO2) Hotspots: 2019-2020 20Russia
Figure 8: Contributions of major industry sectors and natural sources (volcanoes) to total SO2 emissions from
2005 to 2019 in Russia (kilotonnes per year). Data source: NASA MEaSUREs (partially reclassified, as described
above).
Russia emits approximately 12% of global anthropogenic SO2 emissions
and is the second
largest SO2 emitter, after India. Russia’s anthropogenic SO2 emissions have remained
relatively constant over the past 15 years, with drops in one year usually being cancelled out
by a rebound the following year. Data show a slight long-term downward trend in
emissions of about 10% per decade. In 2019, Russia decreased its anthropogenic SO2
emissions by about 8% compared to the previous year and reached its lowest value in the
15-year record. According to NASA estimates, coal hotspots are responsible for two thirds of
this decrease, and oil and gas the remaining third, while smelter emissions slightly
increased. This reduction of emissions could be partly explained by the decrease of
coal-fired power generation in 2019 (-4%) as well as the oil-refinery throughput (-0.6%)36.
Smelters are the biggest SO2 emitting industry sector in the country, with nearly 75% of
anthropogenic emissions, followed by oil and gas (15%), and coal (10%) (Fig. 8). The Arctic
smelter site Norilsk remains by far the largest SO2 emissions hotspot worldwide and is
responsible for more than 50% of Russia’s total anthropogenic SO2 emissions.
Novocherkassk, Nikel37 and Kirovgrad are also major SO2 hotspots in Russia, hosting
smelters, gas refineries and coal combustion facilities for power and industries.
Note that significant uncertainty in NASA estimates remains. Satellite retrievals of SO2 levels
are only available four months per year at certain hotspots, including Norislk and Nikel, due
to their high latitude. This uncertainty is compounded by the fact that official figures
indicate total anthropogenic SO2 emissions remained constant in 2019 (+0.3%)38.
36
BP, Statistical Review of World Energy 2019. Available at
https://www.bp.com/en/global/corporate/energy-economics/statistical-review-of-world-energy.html
37
Mis-spelled as Nickel in the NASA database.
38
This figure includes all sources of anthropogenic SO2, beyond the industrial clusters considered by NASA.Federal State Statistics
Service. Available at https://rosstat.gov.ru/folder/11194
Ranking the World’s Sulfur Dioxide (SO2) Hotspots: 2019-2020 21China
Figure 9: Contributions of major industry sectors to total SO2 emissions from 2005 to 2019 in China (kilotonnes per
year). Data source: NASA MEaSURES (partially reclassified, as described above).
China emitted approximately 8% of global anthropogenic SO2 in 2019 and is the world’s
third largest emitter of SO2. Until 2010, China was the world’s biggest SO2 emitter because it
had the largest coal-fired power generation capacity in the world. Since it began installing
flue-gas desulfurization systems across the electricity generation sector and implementing
so-called Ultra-Low Emission standards – an emissions rate that is close to gas generators –
China has made significant progress to reduce air pollution. By the end of 2018, 80% of
China’s coal power fleet had been retrofitted to meet Ultra-Low Emission standards39, a
figure that increased to 86% by the end of 201940. China’s SO2 emissions have plummeted
by 87% since their 2011 peak. In 2019, China’s anthropogenic SO2 emissions fell by 5%, the
slowest rate of decrease in the past decade (Fig. 9). There is potential for a further reduction
in emissions because China is expanding its Ultra-Low Emission standards from the coal
power sector to steel and cement. However, air quality in China still remains far from WHO
recommended levels41, indicating the fundamental need to accelerate the country’s
transition away from fossil fuels.
39
China Electricity Council, China Power Sector Development Annual Report 2019. Available at:
https://cec.org.cn/detail/index.html?3-163895 [accessed Sept. 23, 2020].
40
China Electricity Council, China Power Sector Development Annual Report 2020. Available at:
https://www.cec.org.cn/detail/index.html?3-284218 [accessed Sept. 23, 2020].
41
The Beijing News, Opinion on Air Quality data, published on June 6, 2019. Available at:
http://www.bjnews.com.cn/opinion/2019/06/06/587991.html
Ranking the World’s Sulfur Dioxide (SO2) Hotspots: 2019-2020 22Saudi Arabia
Figure 10: Contributions of major industry sectors to total SO2 emissions from 2005 to 2019 in Saudi Arabia
(kilotonnes per year). Data source: NASA MEaSUREs.
Saudi Arabia is the fourth largest emitter of SO2 in the world and the largest in the Middle
East and North Africa region. After strong decreases in 2017 and 2018, Saudi Arabia’s SO2
emissions remained almost constant with an indication of slight increase in 201942.
Emissions listed in the data set are entirely due to oil and gas combustion (Fig. 10). Makkah,
one of the most populated provinces in the country, has large clusters of SO2 emissions
sources including in Rabigh, Shaiba and Jeddah. Oil power stations and oil refineries in
these three locations emitted 62% of Saudi Arabia’s total SO2 emissions in 2019. Other
major sources of SO2 are power stations and refineries in Fereidoor Jubail, Yanbu, Al Hofuf,
Riyad, Al Hofuf, Uthmaniyah and Buraydah.
42
The observed increase is much smaller than the data precision. It is not possible to make a clear statement about the 2019
change.
Ranking the World’s Sulfur Dioxide (SO2) Hotspots: 2019-2020 23Mexico
Figure 11: Contributions of major industry sectors and natural sources (volcanoes) to total SO2 emissions from
2005 to 2019 in Mexico (kilotonnes per year). Data source: NASA MEaSURES (partially reclassified, as described
above).
Anthropogenic SO2 emissions in Mexico remained constant or increased slightly43 in 2019
after having fallen for three consecutive years. Oil and gas combustion, responsible for 90%
of Mexico’s anthropogenic SO2 emissions, saw a steep rise in 2019. The remaining
anthropogenic emissions are from coal combustion. Mexico has not followed the global
trend of decreasing SO2 emissions, and the country is now the fifth biggest global emitter
of SO2.
Oil fields in Mexico are among the biggest hotspots in the world; the two hotspots at
Cantarell and Reforma alone account for approximately 48% of the country’s
anthropogenic SO2 emissions. The other major SO2 emission hotspots in Mexico are the
national refining system and fuel oil power stations, including Tula and Tuxpan (Fig. 11). The
energy policy of the current administration aims to increase the refining capacity and the
electricity generation with fuel oil and coal. Therefore, SO2 emissions might increase in
future years, which would severely affect air quality in major urban areas, including Mexico
City, where air pollution regulations are weak.
Coal-fired power generation was gradually decreasing in the past decade because efforts
had been made to control high pollutant emissions and because the cost of coal had
increased (Fig. 11). But the energy sectoral programme over the next four years plans to
increase coal production and coal power generation, which will mean an increase in SO2
emissions.
43
With the given data precision, it is 76% likely that emissions increased (see Table A2).
Ranking the World’s Sulfur Dioxide (SO2) Hotspots: 2019-2020 24South Africa
Figure 12: Contributions of major industry sectors to total SO2 emissions from 2005 to 2019 in South Africa
(kilotonnes per year). Data source: NASA MEaSUREs (partially reclassified, as described above).
South Africa’s SO2 emissions are entirely anthropogenic. The country’s emissions dropped
by about 15% in 2019, reaching an all-time low on the 15-year record, but remain at a very
high level (Fig. 12). Preliminary analysis indicates that the decrease in SO2 emissions
coincide with “load shedding” episodes created by the loss of power generation capacity.
However, that could be one among several factors; further investigation is required to
better understand the reasons for that decrease.
Mpumalanga in South Africa is the largest SO2 emission hotspot in Africa. The cluster of
mega power stations in Nkangala, including Duvha, Kendal and Kriel coal-fired power
stations, is the biggest source of anthropogenic SO2 within Mpumalanga. There are 12
coal-fired power stations in the province, located just 100-200 km from South Africa’s
largest populated area, Gauteng City region, posing a significant health threat to local
residents. This year, the South African government relaxed SO2 emission regulations for
coal power stations, doubling the permitted emission rate. The change took effect on 1
April 2020 despite severe SO2 pollution across the region44. Weakening SO2 emission
standards is a direct concession to the country’s power utility companies {Eskom and Sasol
45
(synfuel company)} who called it “costly” to comply with the regulations around SO2 .
44
Vlavianos, C. ‘SA government gazettes approval for air pollution increases.’ Greenpeace Africa press release on March 30, 2020.
Available at: https://www.greenpeace.org/africa/en/press/9221/sa-government-gazettes-approval-for-air-pollution-increases/
[accessed Sept. 23, 2020].
45
Ms Creecy, B. D. Ministry of Forestry, Fisheries and the Environment. Republic of South Africa. Letter to Ms Kate Handley. July
20, 2020. Available at: https://drive.google.com/file/d/1nekGK0_CFh10EwjIdodUVCk-64oN-Q-y/view
Ranking the World’s Sulfur Dioxide (SO2) Hotspots: 2019-2020 25Turkey
Figure 13: Contributions of major industry sectors to total SO2 emissions from 2005 to 2019 in Turkey (kilotonnes
per year). Data source: NASA MEaSURES (partially reclassified, as described above).
In 2018, Turkey took its place among the top ten SO2 emitter countries, emitting more than
1,000 kt of anthropogenic SO2 into the atmosphere. Turkey is one of the few countries that
saw a substantial increase (14%) in emissions in 2019, marking the country’s fourth
consecutive year of rising SO2 emissions. Turkey’s SO2 emissions in 2019 were twice as high
as those in 2015. Turkey is now the eighth largest emitter of SO2, up from tenth place in
2018. Coal-based energy production remains the major source of SO2 emissions in Turkey
(Fig. 13)46.
The major SO2 hotspot cluster in Muğla is an aggregation of the Kemerköy, Yeniköy, and
Yatağan coal-fired power stations and is the biggest emissions hotspot in Turkey. It is also
the 11th largest anthropogenic emission source in the world, followed by the region around
Kangal coal-fired power station and Afşin Elbistan coal-fired power stations.
The prediction for Turkey is that the upwards trend in SO2 emissions will continue because
government ambitions are to increase national coal power capacity with new lignite coal
mines. Turkey is the nation with the second highest capacity in pre-construction
development with 31.7 GW after China47. Despite public opposition and an economic crisis,
the Turkish government continues to support service extensions to ageing coal power
stations through capacity mechanisms payments. Combined, these factors might push
Turkey higher in the SO2 ranking in coming years.
46
Chamber of Environmental Engineers (2020). Air Pollution Report in 2019, Ankara, (in Turkish). Available at:
http://www.cmo.org.tr/resimler/ekler/7666bf4c3e1e4bb_ek.pdf [accessed Sept. 23, 2020].
47
Shearer, C. et al. Boom and Bust 2020: Tracking the Global Coal Plant Pipeline. Global Energy Monitor, Greenpeace International,
CREA and Sierra Club (2020). Available at: https://endcoal.org/wp-content/uploads/2020/03/BoomAndBust_2020_English.pdf
[accessed Sept. 23, 2020].
Ranking the World’s Sulfur Dioxide (SO2) Hotspots: 2019-2020 26Europe
Figure 14: Contributions of major industry sectors to total SO2 emissions from 2005 to 2019 in Serbia (kilotonnes
per year). Data source: NASA MEaSUREs (partially reclassified, as described above).
Figure 15: Contributions of major industry sectors to total SO2 emissions from 2005 to 2019 in Ukraine (kilotonnes
per year). Data source: NASA MEaSUREs (partially reclassified, as described above).
Ranking the World’s Sulfur Dioxide (SO2) Hotspots: 2019-2020 27Figure 16: Contributions of major industry sectors to total SO2 emissions from 2005 to 2019 in Bulgaria (kilotonnes
per year). Data source: NASA MEaSURES (reclassified, as described above).
Ukraine, Serbia and Bulgaria are the biggest SO2 emitters in Europe and rank among the
world’s top 25 SO2 emitters. Bulgaria is the only European Union country in the global top
25 SO2 polluters. Coal combustion is the primary source of SO2 emissions in all three
countries. Emissions from coal decreased in Serbia (Fig. 14) and Ukraine (Fig. 15) in 2019,
but remained constant in Bulgaria (Fig. 16). In Serbia, the decrease was partially offset by an
increase in emissions from smelters.
In 2017 the European Union adopted strict SO2 emission limits for coal-fired power stations,
but the Bulgarian administration opposes the new rules and continues to permit power
stations to emit more than is allowed under European Union law. The country also seeks
exemptions from the rules instead of taking steps to phase-out coal. One of the biggest
coal-fired power stations on the Balkan Peninsula – the state-owned Maritsa East 2 – has
been permitted to emit more than four times the specified European Union limit for SO2
set by the Industrial Emissions Directive48,49.
48
Greenpeace Bulgaria. For the Earth - access to justice appeals the derogation of TPP Maritsa East 2 and insists that the company
prove that it has a plan for a cleaner future
Greenpeace Bulgaria press release on Jan. 24, 2019. Available at: https://www.greenpeace.org/bulgaria/press/1377 (in Bulgarian)
[accessed Sept. 14, 2020]
49
Doyle, D. & Stoilova, R. The Balkans’ biggest power station – why thinking beyond Maritsa East 2 matters.’ Energypost.eu news
report on Sept. 3, 2019. Available at:
https://energypost.eu/the-balkans-biggest-power-station-why-thinking-beyond-maritsa-east-2-matters/ (in English) [accessed
Sept. 14, 2020].
Ranking the World’s Sulfur Dioxide (SO2) Hotspots: 2019-2020 28Australia
Figure 17: Contributions of major industry sectors to total SO2 emissions from 2005 to 2019 in Australia (kilotonnes
per year). Data source: NASA MEaSUREs (partially reclassified, as described above).
Australia’s SO2 emissions are entirely anthropogenic. In 2019, Australia was the 12th biggest
emitter of SO2 in the world – the same as in 2018 – because no significant emissions
reductions were made. The largest SO2 emission hotspots in Australia are Mount Isa in
Queensland (a complex of mining operations with lead and copper smelters) followed by
Lake Macquarie and Hunter Valley in New South Wales and Latrobe Valley in Victoria. In all
four locations, coal-fired power stations contribute to high SO2 emissions (Fig. 17). Despite
the existence of major global SO2 emission hotspots, there are currently no coal-fired
power stations equipped with flue-gas desulfurization technology to control SO2 emissions
and SO2 pollution limits are weak or non-existent. Australia's system of SO2 pollution
regulation lags behind China, the United States and the European Union.
Ranking the World’s Sulfur Dioxide (SO2) Hotspots: 2019-2020 29Southeast Asia
Figure 18: SO2 emissions of the largest hotspots in Indonesia from 2005 to 2019 (kilotonnes per year). Data source:
NASA MEaSUREs (partially renamed and/or reclassified, as described above).
Figure 19: SO2 emissions of the largest hotspots in Singapore from 2005 to 2019 (kilotonnes per year). Data source:
NASA MEaSUREs.
In 2019, Indonesia (Fig. 18) and Singapore (Fig. 19) accounted for approximately 90% of
anthropogenic SO2 in Southeast Asia, with coal emissions from Thailand accounting for the
remaining share. Although the majority of Indonesia’s SO2 is from volcanic activity and 2019
emissions decreased overall, the Banten Suralaya power complex accounts for
three-fourths of the country’s anthropogenic SO2.. Suralaya is the largest hotspot in the
region but Singapore’s oil and gas refineries, which are responsible for all of its emissions,
are a close second. The remaining one-quarter of Indonesia’s emissions are from nickel
Ranking the World’s Sulfur Dioxide (SO2) Hotspots: 2019-2020 30smelters in Soroako, from which there has been a consistent decrease in emissions since
2015.
New emissions standards for stationary sources from the Indonesian Ministry of
Environment and Forestry (MoEF) were enacted in 2019. However, it remains to be seen
whether stricter regulations for SO2 have resulted in the installation of necessary control
technologies. Units 1 and 2 of the Banten Suralaya complex have been operating for nearly
35 years,50 and should be scheduled to enter retirement,51 yet they continue to operate and
emit high levels of SO2 in the area. Despite a government review of the Suralaya plants’
operations, the state electricity company (PLN) is calling for a ten-year delay in the
enforcement of the new emission standard regulation on existing coal power plants.52
Major polluting sectors
The following section provides an overview of the sectors
responsible for SO2 emissions.
Coal combustion
Figure 20: SO2 emissions of the largest six coal hotspots globally from 2005 to 2019 (kilotonnes per year). Data
source: NASA MEaSUREs (partially renamed and/or reclassified, as described above).
Hotspots that use coal combustion for power generation and industry account for more
than 52% of total global anthropogenic SO2 emissions. The 50 coal hotspots with the
highest SO2 emissions as identified in the NASA Measures data are listed in Table 4;
emissions trends for the six hotspots with the greatest emissions are named in Fig. 20.
50
Operationalized years available at: www.gem.wiki/Banten_Suralaya_power_station
51
Government Shuts Down Old PLTU Replaced with Renewable Energy Generators. News report. January 30, 2020.
www.merdeka.com/uang/pemerintah-tutup-pltu-tua-digantikan-dengan-pembangkit-energi-terbarukan.html
52
Feeling burdened, PLN asks for relaxation in the enforcement of power plant emission standards. News report. September 26,
2020. Available at:
www.dunia-energi.com/merasa-terbebani-pln-minta-relaksasi-pemberlakuan-baku-mutu-emisi-pembangkit-listrik/
Ranking the World’s Sulfur Dioxide (SO2) Hotspots: 2019-2020 31You can also read