Sustainable Energy & Fuels
←
→
Page content transcription
If your browser does not render page correctly, please read the page content below
Volume 5
                                                                                          Number 8
                                                                                          21 April 2021
                                                                                          Pages 2193–2384

Sustainable
Energy & Fuels
Interdisciplinary research for the development of sustainable energy technologies
rsc.li/sustainable-energy

                                 ISSN 2398-4902

                                 PAPER
                                 Ribhu Gautam et al.
                                 Bio-oil and biochar production from halophyte biomass:
                                 effects of pre-treatment and temperature on Salicornia
                                 bigelovii pyrolysis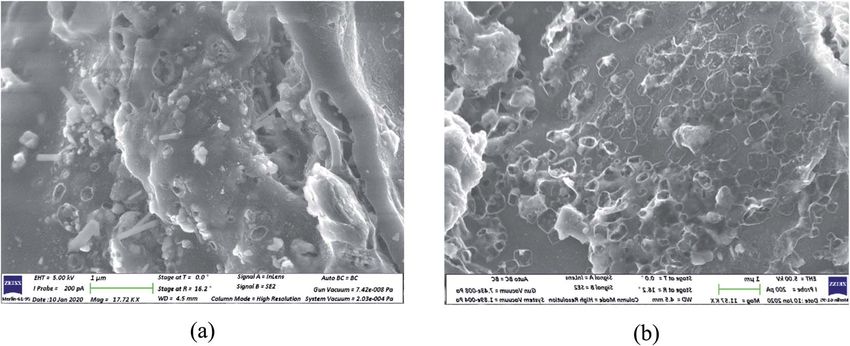
Sustainable
Energy & Fuels
This article is licensed under a Creative Commons Attribution-NonCommercial 3.0 Unported Licence.
View Article Online
PAPER View Journal | View Issue
Bio-oil and biochar production from halophyte
biomass: effects of pre-treatment and temperature
Open Access Article. Published on 26 February 2021. Downloaded on 8/7/2021 10:33:24 PM.
Cite this: Sustainable Energy Fuels,
2021, 5, 2234 on Salicornia bigelovii pyrolysis†
Alessia Iaccarino, Ribhu Gautam * and S. Mani Sarathy
Salicornia bigelovii (SB) is a strategically important plant in many regions owing to its ability to grow in arid
climates and saline water. This study evaluates the effects of halophyte biomass pre-treatment on the
production of bio-oil and biochar via pyrolysis of SB. The pyrolysis experiments were performed in
a quartz tube reactor at 600, 700, and 800 C to understand the effect of the temperature on the
products obtained from untreated SB (USB) and pre-treated SB (PSB). USB and PSB samples were
characterized to determine their thermal stability, elemental composition, mineral composition, and
functional group identification. Pre-treatment of SB reduced the ash and Na content by 71% and 45%,
respectively. Ash removal favored the pyrolysis-assisted extraction of carboxylic acids, and their
selectivity in the bio-oil increased from 20.7% (USB) to 33.4% (PSB) at 600 C. The selectivity to
phenolics was observed to be the highest at 800 C in the bio-oil from USB (10.4%) and PSB (13.4%). PSB
Received 8th November 2020
Accepted 26th February 2021
pyrolysis increased the specific surface area of biochar by four times, whereas carbon nanostructures
were observed in the biochar from USB. The formation pathways of the major compounds from the
DOI: 10.1039/d0se01664k
pyrolysis of various amino acids, cellulose, hemicellulose, fatty acids, and lignin present in SB were
rsc.li/sustainable-energy elucidated by proposing a plausible reaction scheme.
generation biomasses are modied and engineered versions
1. Introduction of the rst-, second- and third-generation biomasses. The
The increasing demand for fossil fuel-derived energy has raised present research to develop fourth-generation biomass is
the levels of atmospheric greenhouse gas emissions and resul- focused on modifying third-generation biomass, for example,
ted in widespread concerns about sustainability. Bioenergy can algae biomass for enhanced oil production.5 It is needless to say
play an essential role in meeting modern-day energy needs with that the cultivation of rst- and second-generation crops
renewable and low environmental impact energy sources.1 requires freshwater and arable land.
Biomass is recognized as an eco-friendly alternative source of Factors such as land and water availability are important
renewable energy and carbon.2 Based on the method of utili- from the viewpoint of biomass resource management. Fresh-
zation, biomass can be classied into four categories, viz., rst-, water availability for biomass cultivation is becoming increas-
second-, third- and fourth-generation. The rst generation ingly limited as a result of the rising water demand of the
biomasses are essentially edible crops, whereas second to growing world population. Owing to the high salinity levels,
fourth generation are mainly non-edible. every year 1.5 million hectares of land become unsuitable for
The use of edible, rst-generation biomass crops for the agricultural production.6 Therefore, there is a strong need to
exploitation of energy triggers the food versus fuel debate and investigate biomass species which grow in these geographical
also increases ination in food prices.3 A study published by locations in extreme environments. Halophytes are salt-tolerant
Rulli et al.4 stated that the amount of food crops utilized to meet plants that represent, at most, 1% of the world's ora. They can
bioethanol demand in the top 14 countries was sufficient to grow on marginal soils using saline irrigation water, both of
feed about 200 million people. Second-generation biomasses which are unsuitable for conventional crop production.7 Halo-
are mainly non-edible agricultural or industrial-byproducts.3 phytes are potential oilseeds, forage and biomass crops, and
Third-generation biomasses are algal species, whereas fourth- promising carbon sequestration plants.8 For these reasons,
halophytes can be seen as a promising biomass feedstock that
can overcome the typical land and water requirements of
Clean Combustion Research Center, Physical Sciences and Engineering Division, King conventional terrestrial rst- and second-generation biomasses.
Abdullah University of Science and Technology, Thuwal 23955-6900, Saudi Arabia.
Salicornia bigelovii is an annual, leaess, and fast-growing
E-mail: ribhu.gautam@kaust.edu.sa
† Electronic supplementary information (ESI) available. See DOI:
halophytic plant.9 It is considered as one of the most salt-
10.1039/d0se01664k tolerant species among the halophytes, and it can prosper in
2234 | Sustainable Energy Fuels, 2021, 5, 2234–2248 This journal is © The Royal Society of Chemistry 2021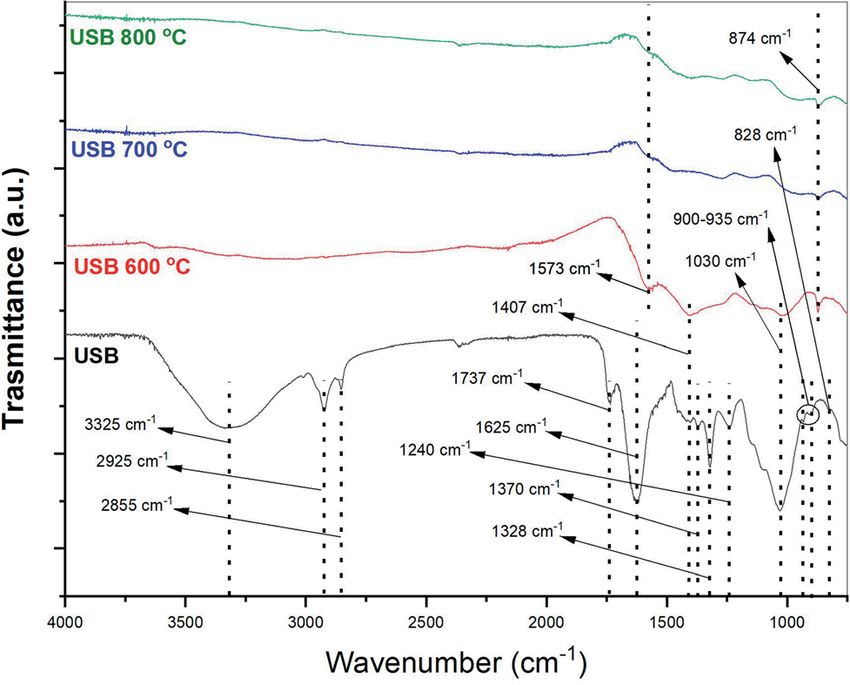
View Article Online
Paper Sustainable Energy & Fuels
environments with salt concentrations two times greater than dried in an oven at 110 C for 24 h to remove the moisture.
that of seawater salinity.10 Furthermore, unlike many halophytes, Then, the SB sample was ground using a mill grinder (PM200
its seeds germinate directly on seawater, for this reason, fresh Retsch). Following this, the sample was mixed with deionized
water is not required at any point in the plant's life cycle.11 The water (1 : 20 w/v) and stirred using a magnetic stirrer at
This article is licensed under a Creative Commons Attribution-NonCommercial 3.0 Unported Licence.
hot and arid climates favor the production of halophytes and a constant temperature of 25 and 50 C for a specic duration of
their cultivation potential can be understood by considering the 2, 4, 8 and 24 h. Aer thorough mixing, this solution was
world's 22 000 km hot and arid coastline.12 The prospect of Sal- vacuum ltered using a Whatman No. 1 lter paper (11 mm).
icornia as a feedstock for conversion has improved as appropriate The lter paper was placed on a perforated plate connected to
cultivation techniques can maximize the seed yield to as high as a vacuum pump to enable the liquid to pass through the
2 tons per hectare (t ha1).13 In 2018, scientists from the Inter- membrane. The collected SB biomass solids were then dried in
Open Access Article. Published on 26 February 2021. Downloaded on 8/7/2021 10:33:24 PM.
national Center for Biosaline Agriculture (ICBA) recorded an oven at 110 C for 24 h. Aer drying, the Na content of the
a signicantly high seed yield of 3 t ha1 using seawater in the samples was measured using inductively coupled plasma
United Arab Emirates (UAE).14 The oil yield of SB was found to be optical emission spectroscopy (ICP-OES, Agilent 5110).
higher than that of freshwater oil crops such as soybeans and
sunowers.15 Also, SB showed a high biodiesel yield (94%) via
enzymatic transesterication.16 The objective of the ICBA is to 2.2. Characterization of biomass
increase Salicornia yields in the UAE and subsequent expansion Both the untreated SB (USB) and pre-treated SB (PSB) were
to the coastal areas of the Arabian Peninsula.14 As the focus on characterized using a thermogravimetric analyzer (TGA),
the cultivation and production of SB is signicantly increasing, elemental analyzer, ICP-OES, bomb calorimeter to study the
investigating the potential of SB for energy applications becomes thermal stability, elemental composition (C, H, N, S, O), mineral
important. content of ash, and higher heating value (HHV), respectively.
Pyrolysis is a thermochemical decomposition process per- The thermal stability of PSB and USB were investigated using
formed at an elevated temperature (>400 C) in an inert atmo- a TGA 5500 (TA Instruments, USA). The TGA experiments were
sphere that transforms the biomass into three by-products, viz., performed with a sample mass of 8 0.5 mg placed in an
a carbon-rich solid (biochar), a liquid fraction (bio-oil) and a gas alumina crucible. The temperature of the sample was raised
mixture. Biomass can be converted to chemicals and fuels via from ambient temperature to 800 C at a heating rate of
pyrolysis in a single step. The pyrolysis of terrestrial biomass, as 15 C min1. An inert atmosphere was maintained using N2 at
well as aquatic biomass, has been studied in detail.17,18 a ow rate of 100 mL min1. The mass loss and derivative mass
However, studies reporting the pyrolysis of halophytes are loss data were recorded as a function of the time and temper-
scarce and focused on the kinetics, detailed information on the ature. Using the same instrument, proximate analyses of PSB
pyrolysis products is missing in the currently available litera- and USB were carried out according to the ASTM E 1131-08.23
ture.19–22 The growth conditions of these species result in a high The moisture content, and the amount of volatile matter, xed
mineral content. Therefore, studying the effect of minerals on carbon, and ash were determined. In a typical proximate anal-
the pyrolysis products is important for better utilization of these ysis experiment, 8 mg of the sample was pyrolyzed in an inert
species. A high mineral content in the biomass restricts the atmosphere with an N2 ow rate of 100 mL min1. From
scaling-up of the pyrolysis process. Hence, removal of minerals ambient temperature, the sample was heated (110 C) and then
without losing valuable matter from the biomass becomes the mass loss in this regime was recorded as the loss of mois-
critical for these types of species. In this study, the character- ture content. Aer this, the sample was heated to 900 C at
ization of bio-oil and biochar from the pyrolysis of SB is re- a heating rate of 80 C min1. At this temperature, the sample
ported in detail. The objectives of this study are threefold: rst, was held under isothermal conditions and the mass loss
to investigate the pyrolysis products from raw and pre-treated registered was recorded as volatile matter. The N2 in the system
SB; second, to study the effect of the temperature on the was switched to air at the same ow rate of 100 mL min1. The
composition of bio-oil obtained from the pyrolysis of raw and sample was maintained isothermally at 900 C for 45 min and
pre-treated SB; and third, to investigate the characteristics of the nal amount of the sample remaining was noted as ash
the biochar obtained. content. Finally, the xed carbon content was determined from
the difference, for example, xed carbon wt% ¼ 100
moisture wt% volatile matter wt% ash wt%.
2. Materials and methods The elemental composition (CHNS) of the samples was
The SB biomass was grown from seeds and harvested in the determined using a Thermo Flash 2000 (Thermo Fisher Scien-
KAUST greenhouse (22.308381, 39.107794). The biomass was tic, U.S.A.) organic elemental analyzer. A sample mass of 2.5–
deseeded and only the vegetative portion was utilized in this 3 mg was used in this type of experiment. The typical
study. construction of an elemental analyzer consists of a combustion
tube. This combustion tube was heated to around 1000 C in the
presence of air. The elements, viz., carbon, hydrogen, nitrogen,
2.1. Biomass pre-treatment and sulfur, present in the sample were converted to their
As a pre-treatment technique, SB was washed with deionized respective oxides. The vapors evolved from the combustion of
water to reduce the mineral content. First, the SB sample was the sample were passed through a gas chromatography/thermal
This journal is © The Royal Society of Chemistry 2021 Sustainable Energy Fuels, 2021, 5, 2234–2248 | 2235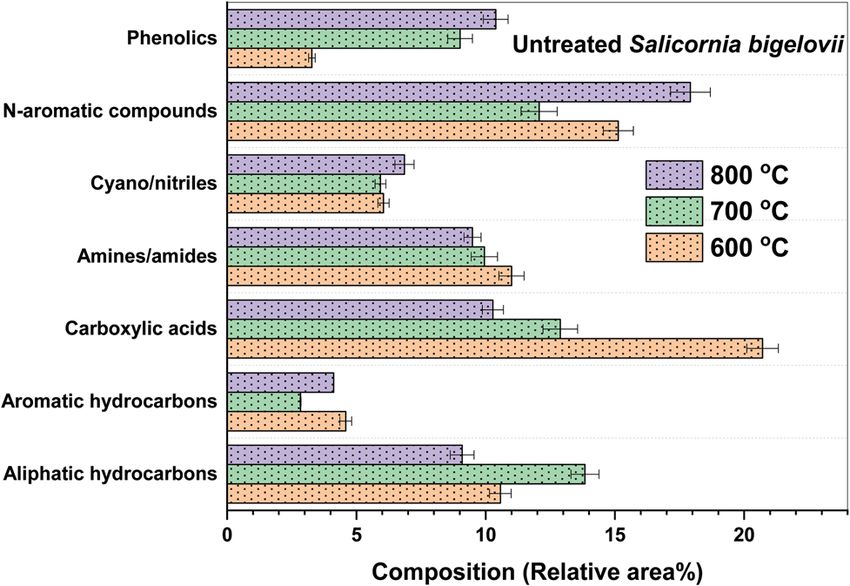
View Article Online
Sustainable Energy & Fuels Paper
conductivity detector (GC/TCD). The GC/TCD was pre-calibrated
for the determination of carbon, hydrogen, nitrogen, and sulfur
content. It is worth mentioning that the nitrogen oxides were
reduced to N2 using a Cu based catalyst before the vapors were
This article is licensed under a Creative Commons Attribution-NonCommercial 3.0 Unported Licence.
analyzed in the GC/TCD system. The oxygen content was
calculated using the difference (O% ¼ 100-ash% -C% -N%
-H%).
The mineral content (Al, Ca, Na, Mg, Si and Fe) of the
samples was determined using an Agilent ICP-OES 5110. Before
these experiments were performed, the samples were digested
Open Access Article. Published on 26 February 2021. Downloaded on 8/7/2021 10:33:24 PM.
in acid and then subjected to microwave treatment in an SRC
system (UltraWave™, Milestone, Sorisole, Italy).
The higher heating values of both the samples were deter-
mined in an isoperibolic (constant temperature surroundings)
calorimeter (Parr 6400). In a typical bomb calorimetry experi-
ment, 0.5 g of dried sample is placed in a stainless steel cup and
then placed in the calorimeter for combustion. For the esti- Fig. 2 Measured temperature profiles at different pyrolysis tempera-
mation of HHV, it is assumed that the condensation of water tures across the length of the quartz tube.
vapors produced takes place completely. The value given by the
instrument is taken directly as the HHV of the sample in MJ
kg1. All the experiments were repeated non-consecutively to reactor. The central area, approximately 100 mm in the reactor,
establish condence in the experimental data. was observed to maintain the set pyrolysis temperature. The
inlet and outlet areas had signicant temperature gradients
that had high temperatures so as to avoid the condensation of
2.3. Experimental setup: pyrolysis reactor
the vapors. Also, the furnace was jacketed to ensure the opera-
The pyrolysis experiments were performed in a customized tor's safety.
reactor. A schematic diagram of the reactor is shown in Fig. 1. The reactor was purged with N2 for 10 min to maintain the
The major components of this reactor were as follows: supply inert environment before each experiment. For a pyrolysis
line for inert gases, owmeter, thermocouple, reactor chamber, experiment, the dried biomass sample was placed in a steel tube
condenser, bio-oil trap, and discharge line for gaseous prod- closed at the outlet with a steel mesh to conne the biomass.
ucts. The reactor chamber consisted of a quartz tube (21 mm Initially, the steel tube containing the biomass sample was
i.d., 25 mm o.d, and 520 mm in length) with stainless steel placed in the quartz tube, so that it was outside the furnace (in
ttings for the gas inlet and exit, respectively. The reactor Zone A) as shown in Fig. 1. When the furnace reached the
chamber was placed in an electrically heated CY-O1200-50ICS desired pyrolysis temperature, the metal tube was pushed
tube furnace (CY Scientic Instrument, China). A thermo- inside the furnace. It was ensured that the position of the steel
couple (OMEGA HH802-U) was also inserted through an access tube with the sample was in the central area, the zone in which
provided in the tube furnace to record the temperature in the the temperature was the same as the set pyrolysis temperature.
furnace. The temperature of the furnace was regulated using At the reactor outlet, the gases passed through a condenser
a proportional integral derivative controller which allows an immersed in ice. In the downstream from the condenser, the
extensive range of heating rates and hold times with a possible condensable fraction was collected in a stainless steel tube
high treatment temperature (HTT) of over 1000 C. Fig. 2 blinded with a Swagelok blind nut. The ow of exhaust gases
represents the temperature proles observed across the length was passed through a plastic tube leading to the fume hood.
of the furnace. These proles were obtained by xing the The pyrolysis experiments were conducted at temperatures,
different pyrolysis temperatures, viz., 600, 700, and 800 C and viz., 600, 700, and 800 C with USB and PSB. A continuous ow
placing the thermocouple at different positions in the quartz rate of N2 was kept at 100 mL min1 to maintain the inert
atmosphere and to sweep away the pyrolysis vapors. The sample
mass of approximately 15 g was taken in the steel tube before
placing it in the quartz tube reactor. The temperature of the
tube furnace was ramped at 10 C min1 from ambient
temperature to the desired pyrolysis temperature. Before
pushing the steel tube into the Zone A, the setup was allowed to
settle for 30 min. The steel tube was then pushed inside and
placed in the Zone A. The residence time, which was 20 min for
the pyrolysis, was decided on the basis of completion of the
pyrolysis of the biomass. The furnace was switched off aer the
pyrolysis was complete and the steel tube was pushed out of the
Fig. 1 Schematic diagram of the pyrolysis reactor used in this study. furnace for cooling under the same nitrogen ow. This cooling
2236 | Sustainable Energy Fuels, 2021, 5, 2234–2248 This journal is © The Royal Society of Chemistry 2021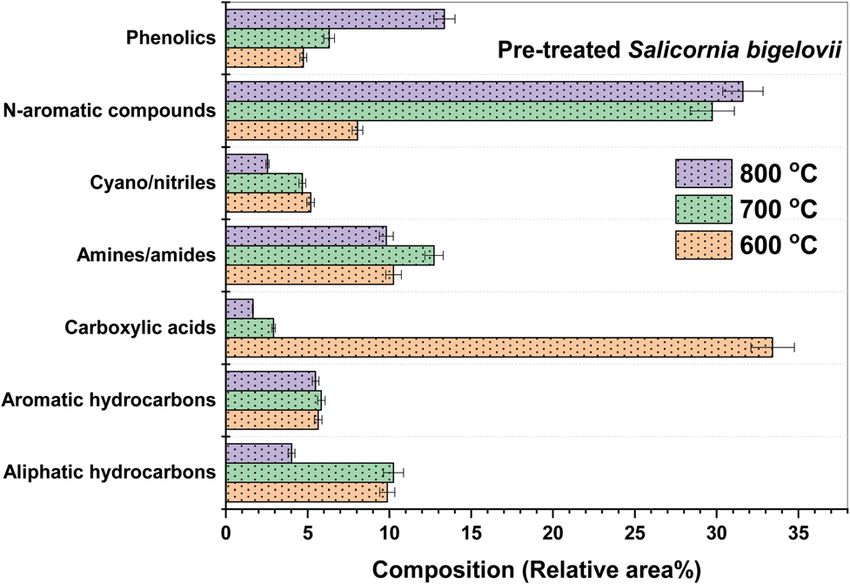
View Article Online
Paper Sustainable Energy & Fuels
made sure that no undesired combustion of char took place and 2.5. Characterization of biochar
also the absorption of moisture was avoided. For accurate
The biochar obtained from the pyrolysis of USB and PSB at
determination of the bio-oil yield, the condenser system used
different temperatures was characterized in detail via an
for the collection of bio-oil was weighed before and aer the
elemental analyzer, pH meter, conductivity meter, Fourier
This article is licensed under a Creative Commons Attribution-NonCommercial 3.0 Unported Licence.
experiment. Finally, the collected biochar and bio-oil were
transform infrared spectroscopy (FTIR), Brunauer–Emmett–
weighed via gravimetry.
Teller (BET) porosimetry and scanning electron microscopy
It is worth mentioning that the percentage mass yields of the
(SEM) coupled with energy-dispersive X-ray spectroscopy (EDX).
biochar and bio-oil were calculated on a dry basis. The ratio The elemental analysis of the biochar obtained was performed
between the mass of the produced biochar and bio-oil and the as per the procedures employed for the USB and PSB biomass
mass of the feedstock, viz., USB and PSB, were used to calculate
samples. The pH and electrical conductivity were measured by
Open Access Article. Published on 26 February 2021. Downloaded on 8/7/2021 10:33:24 PM.
the yields as given in eqn (1) and (2).
preparing the suspension of different biochar samples in Milli-
Mbiochar Q water with a concentration of 10% (w/v). The suspension was
Ybiochar ð%Þ ¼ 100 (1)
Mfeed prepared by mixing the biochar in the water for 2 h at 25 C. The
pH was measured in a Mettler Toledo pH meter and the elec-
Mbio-oil trical conductivity was measured using a Mettler Toledo Orion
Ybio-oil ð%Þ ¼ 100 (2)
Mfeed 5-Star Benchtop Multiparameter Meter.
The functional groups present in the biochar samples were
In eqn (1) and (2), Mbiochar, Mbio-oil and Mfeed represent the investigated using a Thermo Scientic Nicolet iS10 FTIR spec-
mass of the biochar, bio-oil, and USB and PSB feedstock, trometer (Thermo Fisher Scientic Inc., USA) operated in the
respectively. Ybiochar and Ybio-oil are the percentage yields of attenuated total reectance (ATR) mode. The biochar samples
biochar and bio-oil, respectively. were spread over the diamond crystal and it was ensured that
the crystal was completely covered with the sample. The FTIR
spectra of the biochar samples were collected in the wave-
2.4. Gas chromatography/mass spectrometry analysis of the number region 4000–750 cm1 at a resolution of 2 cm1. The
bio-oil surface area measurements of biochar samples were performed
in an ASAP 2420 (Accelerated Surface Area and Porosimetry)
The bio-oil samples obtained from USB and PSB at different system (Micrometrics Instrument Corp., USA). Before the
temperatures were collected. Typically, bio-oil is composed of porosimetry experiments, the biochar samples were degassed at
organics and water. The organic composition of the bio-oil 120 C for 3 h under vacuum. The degassing phase is intended
was analyzed using gas chromatography/mass spectrometry
to remove the gas, humidity or volatile compounds present
(GC/MS). Dichloromethane (HPLC grade) was used in the
inside the porous structure of the biochar, which may alter the
ratio of 4 : 1 (v/v) to dilute the bio-oil prior to injection into the adsorption tests. The surface area was measured using the BET
GC/MS. 1 mL of diluted bio-oil was injected into the GC/MS nitrogen gas physisorption method at 77 K over a relative
(Agilent 7890A GC-5975C MSD). The sample was injected at pressure range of P/P0 ¼ 0.01–0.99. To probe the surface
300 C and the bio-oil vapors were separated in an Agilent DB- morphology of various biochar samples, experiments were
5MS capillary column (60 m length 0.25 mm i.d. 0.10 mm performed using a Zeiss Merlin SEM coupled with the Oxford
in thickness). The bio-oil vapors were carried using ultrahigh Instrument EDX. These analyses investigated the nanoscale
pure helium (99.9995%) at a column ow rate of 2 mL min1
morphologies of biochar. During the analyses, the high electron
and a split ratio of 10 : 1. The GC oven was kept at 40 C
tension and probe current were set to be 5 keV (maximum) and
initially for 1 min and then the temperature was ramped at 2 pA, respectively, to prevent possible destruction to carbon
a heating rate of 10 C min1 to 300 C. Finally, the oven was black. An appropriate working distance and the beam focus
kept at this temperature for 26 min. The temperature of the were adjusted accordingly to obtain a high-resolution image.
GC/MS interface was maintained at 300 C. The EI (electron The ash content in the biochars was determined from the mass
ionization) potential of the ion source in the MS was 70 eV and of the residues obtained aer the samples were heated to
the detector temperature was maintained at 250 C. The a controlled temperature of 550 10 C according to standards
separated compounds present in the bio-oil vapors were
provided in EN 1SO 18122:2015. The mineral content of ash was
scanned in the m/z range of 35–700 Da. The separated
also determined using ICP-OES.
compounds were identied by comparison of the mass
spectra of the compounds with the existing NIST and Wiley
libraries. The compounds with match factors above 85% were 3. Results and discussions
considered in the analysis and the abundance of the
compounds was reported as the relative peak area percentage. 3.1. Biomass pre-treatment
The relative peak area percentage can also be proportional to The SB biomass was pre-treated by washing in water and the
the selectivity percentage. More than 300 different effects of the parameters such as the washing time and the
compounds were identied in the bio-oil, therefore quanti- temperature were investigated. This aided in establishing
cation based on the calibration of pure compounds was not optimal conditions for biomass pre-treatment. Water-washing
performed in this study. is seen as a simple and promising pre-treatment technique
This journal is © The Royal Society of Chemistry 2021 Sustainable Energy Fuels, 2021, 5, 2234–2248 | 2237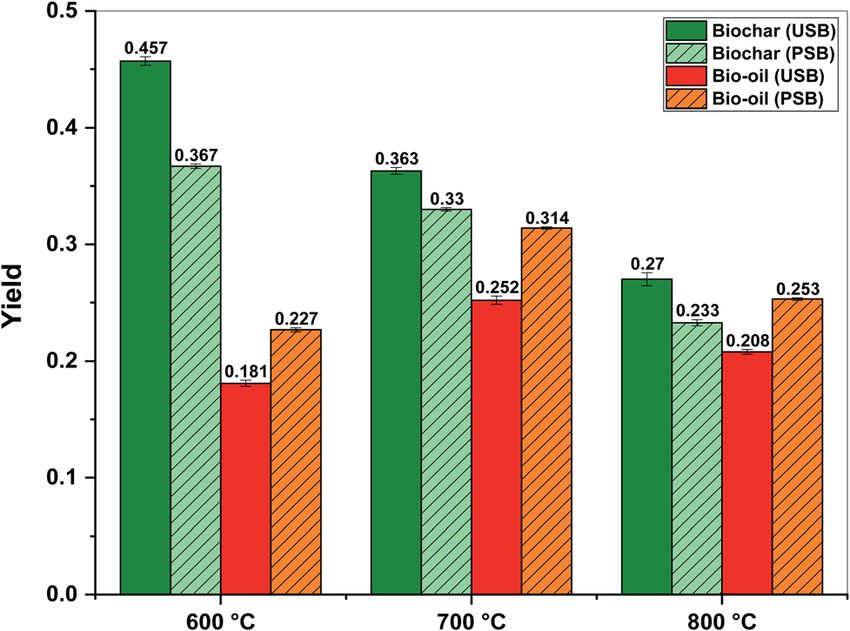
View Article Online
Sustainable Energy & Fuels Paper
for removal of the large amounts of minerals present and
improving the pyrolysis and combustion characteristics.24 Blasi
et al.25 also observed more than 50% ash removal using water-
washing of straw. Water-washing has shown promising results
This article is licensed under a Creative Commons Attribution-NonCommercial 3.0 Unported Licence.
in the removal of Na and K from the matrix of biomass. Cen
et al.26 observed metal removal efficiencies from rice straw in
the range of 75–80% for Na and K. It can be noted that the
water-washing did not result in signicant ash removal, which
is in contrast to the reduction in the ash content reported in this
study. In recent studies, washing of the rice straw with the
Open Access Article. Published on 26 February 2021. Downloaded on 8/7/2021 10:33:24 PM.
aqueous phase of bio-oil led to very high metal removal effi-
ciencies (99% for Na and K).26,27 Readers can refer to
comprehensive reviews published by Kumar et al.28 and Putro
et al.29 for various pre-treatment techniques to produce drop-in
fuels and valuable chemicals, respectively, from lignocellulosic
biomasses.
Water-washing primarily resulted in the demineralization of
the SB biomass. The Na content of the untreated biomass was
observed to be 10.28%. Fig. S1 (in the ESI†) depicts the effect of
the time and temperature on the Na content of SB. It can be
seen from Fig. S1† that the Na content reduced gradually with
the duration of the treatment at both temperatures, viz., 25 and
50 C. Deng et al.24 also studied the effect of the water temper-
ature on the removal of potassium and chlorine between 30–
90 C. It is important to note that increasing the pre-treatment
temperature from 25 to 50 C signicantly enhanced the Na
reduction in the range of 16–28% across all washing times. This
effect can be attributed to the enhanced solubility of the
minerals in the washing medium at higher temperatures. In
addition, there is a possibility of opening the biomass matrix in
the presence of hot water. This opening allows the deeper
penetration of the washing medium within the biomass parti-
cles and hence the increased removal of inorganic matter is
observed. Based on these results, the optimum washing
conditions were found to be 8 h of treatment at 50 C. The Na
content was 5.65% under optimized pre-treatment conditions. Fig. 3 Thermogravimetric (top) and differential thermogravimetric
Furthermore, the Ca content decreased from 2.40% (USB) to profiles of USB and PSB acquired at 15 C min1.
0.64% (PSB). Longer washing times did not offer signicantly
improved demineralization.
attributed to the similar constituents in the matrix of the
biomass, irrespective of the pre-treatment. As expected, the nal
3.2. Characterization of the biomass
residue observed for PSB was signicantly lower than for USB.
Fig. 3 depicts the thermogravimetric and differential thermog- This can be attributed to the removal of the minerals during the
ravimetric (DTG) proles of the USB and PSB. Tm, mentioned in pre-treatment of the SB. The mass loss observed up to 150 C
the DTG proles, denotes the temperature at which the was due to the moisture physically bound to the biomolecules of
maximum mass loss rate was recorded. Tm was also used to the SB. Therefore, Tm ¼ 92 C represents the release of the water
identify the decomposition regimes of the different biochemical from the biomass. The mass loss in the range of 150–200 C was
components present in the SB. Various Tm values are repre- due to the release of the low-molecular weight compounds. The
sented using color in the respective DTG proles of USB and peaks in the region 250–280 C were due to the decomposition
PSB to give a better understanding of the decomposition of the of the hemicellulose present in the SB.21,30 The onset of the
various components of SB. The multiple peaks observed in the decomposition of cellulose was around 250 C, this peak also
DTG prole clearly indicate the presence of more than one represented the portion of cellulose decomposing in this
component and the involvement of the multi-step thermal temperature range.31 As amino acids are present in the matrix of
decomposition during the pyrolysis of SB. the SB biomass, the decomposition regime between 300–350 C
From the TG curves, the major decomposition of both USB can be attributed to the decomposition of the cellulose, as well
and PSB occurred in the temperature range of 200–500 C. The as the proteins.31–33 SB biomass also contains carboxylic acids,
similarity in the decomposition of USB and PSB can be
2238 | Sustainable Energy Fuels, 2021, 5, 2234–2248 This journal is © The Royal Society of Chemistry 2021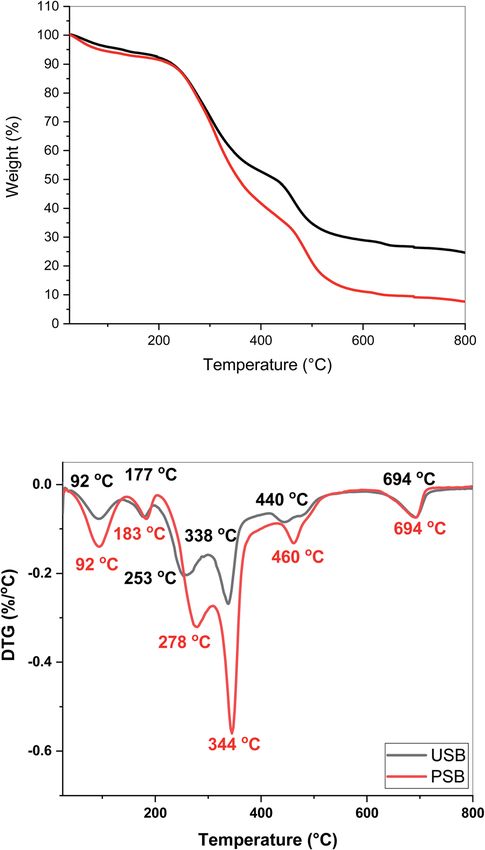
View Article Online
Paper Sustainable Energy & Fuels
such as palmitic and linoleic acids, present in the matrix.32 The Table 2 Mineral content (wt%) in USB and PSB used in this study (dry
peak around 450 C can be attributed to the decomposition of basis)
lipids, which have carboxylic acids as the backbone.33 The last
Al Ca Fe Mg Na Si
peak is observed at 694 C in both the USB and PSB. To ascertain
This article is licensed under a Creative Commons Attribution-NonCommercial 3.0 Unported Licence.
the presence of this peak, TGA experiments were performed USB 0.20% 2.40% 0.20% 0.72% 10.28% 0.16%
multiple times. A similar peak around 700 C was also observed PSB 0.07% 0.64% 0.05% 0.18% 5.65% 0.1%
in the DTG of Salicornia bigelovii and reported by Dzidzienyo
et al.21 This may be attributed to the decomposition of the lignin
fraction present in SB. This is in line with the results obtained
in previously reported literature, as lignin exhibits decomposi- because of contact with soil during harvest and/or trans-
Open Access Article. Published on 26 February 2021. Downloaded on 8/7/2021 10:33:24 PM.
tion at higher temperatures up to 900 C.31,34 portation, or within the material as biogenic characteristics. In
Table 1 shows the proximate analyses of USB and PSB and SB, Na+ is stored in the vacuoles.38 It can be seen from Table 2
the representative percentages by weight of moisture, volatile that Na is the primary inorganic in the plant mineral compo-
matter, ash and xed carbon. The ash content of PSB was found sition. The pre-treatment process signicantly removes the
to be signicantly lower (7.1 wt%) than USB (24.2 wt%). This metals and the quantities of all the identied metals decreased
observation was in line with the TGA proles obtained, in PSB. It should be noted that a signicant fraction of the alkali
considering the xed carbon content of the USB and PSB. The and alkaline earth metal (AAEM) species showed a reduction of
pre-treatment of SB with water reduced the ash content signif- about 50%. A signicant quantity of calcium was removed in
icantly. This clearly indicates that part of the mineral content comparison with the other elements. It is important to high-
that was lost constituted water-soluble components such as light that the main contribution to fouling, scaling deposits,
nitrates, carbonates, chlorides, and phosphates, as observed for slagging and corrosion comes from the inorganic part of the
terrestrial biomass.35 The role played by minerals in the pyrol- biomass.39 By employing this pre-treatment technique, the
ysis of the biomass component, cellulose, was previously re- discussed issues, which are bottlenecks for the scaling up of SB
ported by Brown and coworkers.36 They studied the effect of biomass pyrolysis, can be addressed. These metals, present in
inorganic salts such as NaCl, KCl, MgCl2, and CaCl2 on the the matrix of the biomass, assume an important role in
primary pyrolysis products. The volatile fraction of PSB (85%) deciding the composition of the pyrolysis bio-oil and biochar, as
was more than that of USB (69%). This increase can be attrib- discussed later.
uted to the removal of minerals from the matrix of the SB.
The elemental (C, H, N, S, O) composition of USB and PSB 3.3. Pyrolysis of SB
are presented in Table 1. The nitrogen content in both the 3.3.1. Effect of temperature and pre-treatment on product
samples can be attributed to the presence of various amino yields. Fig. 4 depicts the effect of temperature on the pyrolytic
acids. As the volatile composition of PSB was more than USB, yields from USB and PSB. The bio-oil and biochar fractions are
this translated to the enhanced carbon content of PSB only accounted for in the nal products. It should be noted that
(50.7 wt%) as compared to USB (35.5 wt%). This increase in the the focus of the present study is to understand the effect of
carbon content and signicant ash removal resulted in an minerals and temperature on the bio-oil composition and
increase in the HHV from 10.2 MJ kg1 (USB) to 17.6 MJ kg1 properties of biochar. The fractional bio-oil yield from the
(PSB). As compared to other fossil fuels, such as petroleum- pyrolysis of USB increased from 0.181 at 600 C to 0.252 at
based fuels and coal, the carbon and oxygen content were low 700 C before decreasing to 0.208 at 800 C. The bio-oil yield
and high, respectively.37 The source of oxygen in the SB is increased from 600 C as compared to 700 C owing to reactions
primarily the cellulose, hemicellulose, lignin, and carboxylic such as thermal cracking and dehydration, resulting in the
acid backbone present in the matrix. enhanced formation of volatiles. Beyond 700 C, the bio-oil yield
The Al, Ca, Fe, Mg, Na and Si content of USB and PSB were decreased owing to the cracking of the volatiles into non-
determined using ICP-OES and are tabulated in Table 2. For condensable gases such as CO2, CO, and CH4. These observa-
PSB, the case using the optimum parameters (50 C, 8 h) was tions, an increase and then a decrease in the bio-oil quantity,
selected for the determination of the minerals via ICP-OES. The were in line with the literature on biomass pyrolysis.40–42 The
mineral content of biomass is present on the particle surface fractional yields of biochar gradually decreased as a function of
Table 1 Characteristics of USB and PSB used in this study. The values are in wt% and the data are presented as the mean S.D., n ¼ 3a
Proximate analysis (air dried basis) Elemental analysis (dry basis)
Moisture Volatile matter
(%) (%) Fixed carbon (%) Ash (%) HHV (MJ kg1) C (%) H (%) N (%) S (%) O (%) H/C O/C
USB 4.4 0.9 68.9 0.2 2.5 0.0 24.2 0.9 10.18 0.6 35.53 1.4 5.53 0.6 2.80 0.2 1.08 0.1 31.95 0.4 1.85 0.63
PSB 6 0.6 84.8 2.0 2.1 1 7.1 0.8 17.57 0.7 50.74 1 7.4 0.1 4.65 1 1.1 0.12 22.65 0.3 1.73 0.42
a
% C + % H + % N + % O + % Ash ¼ 100.
This journal is © The Royal Society of Chemistry 2021 Sustainable Energy Fuels, 2021, 5, 2234–2248 | 2239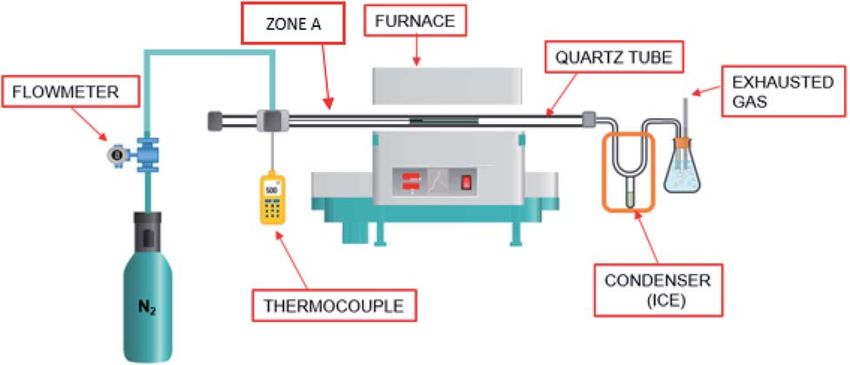
View Article Online
Sustainable Energy & Fuels Paper
800 C also signicantly increased by 25.4% and 21.6%,
respectively, as compared to untreated biomass. These
increased bio-oil yields from the pyrolysis of PSB can certainly
be attributed to the increased volatile fraction (69% to 85%)
This article is licensed under a Creative Commons Attribution-NonCommercial 3.0 Unported Licence.
and the reduced ash content (24% to 7%). Several studies have
demonstrated the positive effects of lower bulk ash content on
the liquid yields during thermochemical processes.42,44
3.3.2. Composition of the bio-oil from the pyrolysis of USB.
The bio-oil obtained from the pyrolysis of USB and PSB at
different temperatures signicantly varied in composition. In
Open Access Article. Published on 26 February 2021. Downloaded on 8/7/2021 10:33:24 PM.
this section, the effect of temperature on the composition of the
bio-oil was investigated. It is concluded from the previous
section that the removal of AAEM species affected the product
yields. The compounds present in the bio-oil were classied
broadly into the following categories, viz., aliphatic hydrocar-
Fig. 4 Effect of temperature on the yields of the pyrolysis products
bons, aromatic hydrocarbons, carboxylic acids, amines/amides,
from USB and PSB. cyano/nitriles, N-aromatic compounds and phenolics. The
different components present in SB can be related to different
compounds in the bio-oil. The vegetative portion of SB has the
the temperature and followed the trend: 0.457 (600 C) > 0.363 characteristics of typical lignocellulosic biomass. The cellulose,
(700 C) > 0.270 (800 C). This can also be attributed to the hemicellulose and lignin were in the range of 45–47 wt%, 14–
enhanced cracking of the organic matter. The bio-oil yield 15 wt% and 1.5–2 wt%, respectively in the SB.45 Proteins and
combined with the char yield at 800 C indicated the enhanced fatty acids are also present in the biomass matrix.32 The major
gas fraction. amino acids present in SB are proline, asparagine, lysine, glu-
From Fig. 4, it can be observed that the pre-treatment of SB tamic acid, phenylalanine and leucine.32 Palmitic acid and
resulted in a signicant increment in the bio-oil yields across all linoleic acid are the major fatty acids present.32 The presence of
the pyrolysis temperatures. The fractional bio-oil yields from fatty acids in our bio-oil conrms the presence of fatty acid
the pyrolysis of PSB increased from 0.227 at 600 C to 0.314 at esters in SB.
700 C before decreasing to 0.253 at 800 C. The biochar yields Fig. 5 shows the composition of the major types of
from the pyrolysis of PSB followed the trend: 0.367 (600 C) > compounds in bio-oil obtained from the pyrolysis of USB at
0.33 (700 C) > 0.233 (800 C). The pre-treatment of SB increased different temperatures. Carboxylic acids were signicantly
the conversion with respect to biochar in the range of 9.1–19.7% present in the bio-oil (10–21 area%) obtained from the pyrolysis
across the three pyrolysis temperatures. The reduced char yields of USB at different temperatures. The trend, followed by the
can be attributed to the cracking of heavy hydrocarbons in the selectivity to carboxylic acids in the bio-oil, was as follows:
biomass, as cracking increased with the increase in tempera- 20.70% (600 C) > 12.90% (700 C) > 10.28% (800 C). This can
ture. Also, the formation of primary char was successively less be attributed to the decarboxylation and cracking of carboxylic
favored as compared to the volatiles formed. Consequently, acids as the pyrolysis temperature increases. The selectivity to n-
there is an enhancement in the production of liquid and hexadecanoic acid was 13.85% at 600 C, which decreased to
gaseous products. The role of the AAEM species in the pyrolysis
process cannot be neglected and it is important to mention that
the removal of these species reduced the biochar yields. In the
case of biomass pyrolysis, the AAEM species promote the
charring reaction, which leads to the formation of secondary
char.43 The presence of the AAEM species is also capable of
inhibiting the vapor cracking reactions, resulting in the
formation of gas and water from pyrolysis.44 This effect trans-
lated into enhanced gas formation from the pyrolysis of PSB.
This can be assumed from the values of the bio-oil and biochar
as actual gas yields were not recorded.
For USB as well as PSB, the optimum pyrolysis temperature
concerning the bio-oil yield was 700 C. Overall, the low bio-oil
and biochar yields at a higher temperature are attributed to the
secondary decomposition of the char and pyrolysis vapors. The
pre-treatment of SB increased the bio-oil yield by 24.6% as
compared to the bio-oil yield from USB at 700 C. The bio-oil
yields from the pyrolysis of pre-treated biomass at 600 and Fig. 5 Effect of temperature on the composition of bio-oil from the
pyrolysis of USB.
2240 | Sustainable Energy Fuels, 2021, 5, 2234–2248 This journal is © The Royal Society of Chemistry 2021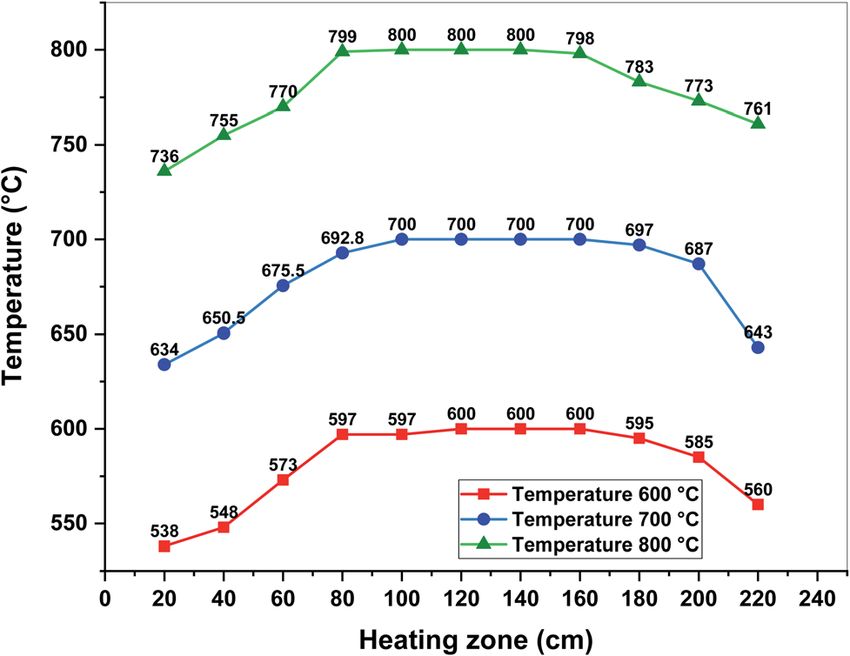
View Article Online
Paper Sustainable Energy & Fuels
6.43% at 700 C and nally reduced to 5.74% at 800 C. The proteins played a role in the formation of various nitrogen-
selectivity to linoleic acid followed the trend: 6.3% (600 C) > containing compounds. For example, glutamic acid is an
4.83% (700 C)–4.22% (800 C). As these fatty acids were present amino acid with two C]O linkages, asparagine is an amino
in the matrix of SB, it can be noted that these are not pyrolysis acid with two –NH2 and two C]O linkages, phenylalanine
This article is licensed under a Creative Commons Attribution-NonCommercial 3.0 Unported Licence.
products. The high temperatures employed in pyrolysis aided in consists of a benzene ring and proline has a ve-membered ring
their extraction into the bio-oil. Similar extraction of fatty acids with nitrogen lodged in the ring. These amino acids resulted in
from the lipids present in different algae species was also the formation of N-aromatic compounds, which were major
observed during pyrolysis.41,46 This clearly suggests the nitrogen-containing heterocyclic compounds, cyano/nitriles,
pyrolysis-assisted extraction of fatty acids from the matrix of the and amines/amides. The selectivity to the N-aromatic
biomass. Carboxylic acids such as methyl butanoic acid, octa- compounds was highest in the bio-oil obtained at 800 C
Open Access Article. Published on 26 February 2021. Downloaded on 8/7/2021 10:33:24 PM.
noic acid and decanoic acid were also present in traces in the (17.92%) followed by 15.13% at 600 C and 12.07% at 700 C.
bio-oil. These acids were a result of cracking of long chain fatty The high amounts of N-aromatic compounds at 800 C can be
acids. Aliphatic hydrocarbons were also present in considerable attributed to the enhanced cyclization and aromatization reac-
amounts and these were primarily produced from decarboxyl- tions at high pyrolysis temperatures. Many important nitrogen
ation of carboxylic acids along with the production of carbon containing platform chemicals were observed in the bio-oil
dioxide. The selectivity to the aliphatic hydrocarbons was 10.5% such as 1H-pyrrole, 2-methyl pyrazine, 1H-indole, 2,4-imidazo-
at 600 C which increased to 13.84% (700 C) and then lidinedione, 2-pyrrolidinone and 3-pyridinol. The amino acids
decreased to 9.1% at 800 C. This decrease in the amount of undergo decarboxylation and cyclization to produce
aliphatic hydrocarbons can be linked to cracking at high compounds such as 3,4-dimethyl benzene, N,N-dimethyl
temperatures resulting in the conversion of volatiles into non- methanamine and N,N,4-trimethyl benzenemethanamine.
condensable gases such as CO2 and lighter hydrocarbons. These compounds were observed in the bio-oil and undergo
Scheme 1 depicts the plausible reactions of the different successive hydrogen removal to produce benzenepropanitrile
components of SB under pyrolysis conditions, producing and benzylnitrile. These reactions are also evidenced in the
various compounds. literature concerning the pyrolysis of amino acids.47 The amino
The nitrogen content in USB is higher (2.8 wt%) than that in acids underwent other reactions such as dehydration reactions
other terrestrial lignocellulosic biomass.42–44 The nature of the to produce important compounds such as aminopyrimidine, 2-
Scheme 1 Plausible reactions occurring during pyrolysis of Salicornia bigelovii.
This journal is © The Royal Society of Chemistry 2021 Sustainable Energy Fuels, 2021, 5, 2234–2248 | 2241View Article Online
Sustainable Energy & Fuels Paper
methyl pyrazine and 1H-indole. Pyrolysis of the polypeptides phenylpropanoid monomers through C–O and C–C link-
present in amino acids led to the production of 2,5-pyrrolidi- ages.48,49 The selectivity to phenolics increased signicantly with
nedione derivatives, whereas pyrolysis of dipeptides resulted in temperature as follows: 3.28% (600 C) < 9% (700 C) < 10.4%
the formation of 2,4-imidazolidinedione derivatives.47 A (800 C). The major phenols were p-cresol and 2-methoxy
This article is licensed under a Creative Commons Attribution-NonCommercial 3.0 Unported Licence.
discussion on the production of these compounds is important phenol. Lignin deconstruction takes place via reactions such as
as these are abundantly present in the bio-oil obtained from the Ca–O–C4 and Cb–O–C4 cleavage, aromatic ring condensation,
pyrolysis of SB. demethylation, demethoxylation, decarboxylation, decarbon-
The different biochemical compounds present in the matrix ylation and dehydration.49 The formation of phenols also took
of SB relate to the different categories of compounds. Therefore, place from the pyrolysis of amino acids such as phenylalanine.47
interactions between the compounds from different biochem- Phenolics were also responsible for the production of aromatic
Open Access Article. Published on 26 February 2021. Downloaded on 8/7/2021 10:33:24 PM.
ical components are also possible. Amino acids during pyrolysis hydrocarbons via deoxygenation, as shown in Scheme 1.
undergo deamination which results in the evolution of Aromatic hydrocarbons were present in the bio-oil and their
ammonia. This ammonia interacts with carboxylic acids to form selectivity was in the range of 2.8–4.6% at all the three pyrolysis
carboxylic acid amides or fatty amides. The selectivity of the temperatures. Toluene and xylene were noticeable aromatic
fatty amides marginally decreased from 10.1% (600 C) to 9.2% hydrocarbons present in the bio-oil. Apart from the deoxygen-
(700 C) and nally to 8.81% at 800 C. Major fatty amides ation of phenols, a minor amount of aromatic hydrocarbons
present in the bio-oil obtained at different temperatures were can be formed from cellulose. The presence of the cyclo-
hexadecanamide, 9-octadecenamide, N,N-dimethyl 9-octadece- pentadiene fraction in the bio-oil composition ascertains the
namide, N-methylhexadecanamide and N,N-dimethylpalmita- formation of the cyclopentadienyl radical. Traces of polycyclic
mide. These amides dehydrate during pyrolysis to produce aromatic compounds, such as naphthalene and its derivatives,
nitriles. Pentadecanenitrile, heptadecanenitrile and oleanitrile were also present in the bio-oil. Cyclopentadiene pyrolysis also
were the major nitriles obtained from the dehydration of fatty produces compounds such as benzene, naphthalene and
amides. At 800 C, signicant cracking of nitriles can be justi- indene via C–C bond b-scission and C–H bond b-scission.50
ed by the presence of acetonitrile, propanenitrile and 4-methyl Cellulose pyrolysis results in the formation of cyclopentadienyl
pentanenitrile. The overall selectivity to the nitriles/cyano radicals and their combination via C–C bond b-scission to form
compounds in the bio-oil was found to be 6–7% for all the benzene. Benzene reacts with cyclopentadienyl radicals via C–H
pyrolysis temperatures. Amides and nitriles are important from bond b-scission to form naphthalene. The major polycyclic
the point of view of applications in pharmaceutical ingredients. aromatic compounds present were 2-methyl naphthalene, 1,4,5-
The presence of low-molecular weight carbonyl compounds trimethyl naphthalene and 1,2-dihydro-6-methyl naphthalene.
(aldehydes and ketones) and furan derivatives were a result of The wide spectrum of products obtained from the pyrolysis of
the presence of cellulose and hemicellulose in the SB biomass. USB imparts a reasonable idea about the complex structure of
Levoglucosan is a primary product obtained from the pyrolysis the SB biomass. Therefore, the conversions and interconver-
of cellulose.36 The pyrolysis temperatures and residence time of sions necessary to understand the formation of important
the vapors in this study facilitated the secondary reactions and compounds become important. A detailed list of the
conversion of levoglucosan into other low-molecular weight compounds identied in the bio-oil from the pyrolysis of USB
oxygenates and non-condensable gases. The dehydration of and PSB at different temperatures is provided in Table S1 (in the
cellulose results in the formation of furan derivatives, such as 3- ESI†).
dodecyl 2,5-furandione, 1-(2-furanyl)-ethanone, 2-fur- 3.3.3. Composition of the bio-oil from the pyrolysis of PSB.
anmethanol, 1-(2-furanyl)-2-hydroxy-ethanone and 5-ethyl-2- Fig. 6 shows the variation in the different compounds present in
furaldehyde. The decomposition of hemicellulose resulted in the bio-oil obtained from the pyrolysis of PSB at different
the formation of polycyclic compounds, and benzofuran deriv- temperatures. The classication of the compounds was the
atives, such as 2,3-dihydro-benzofuran. The selectivities to same as that used for the bio-oil from USB. The amount of
furan derivatives in the bio-oil were 1.66%, 1.52% and 1.55% at aliphatic hydrocarbons reduced as compared to bio-oil from
600, 700 and 800 C, respectively. The selectivity to carbonyl USB. This reduction was due to the pre-treatment, as the pres-
compounds increased with the increase in temperature as ence of AAEM species inhibited the cracking reactions. The
follows: 2.16% (600 C) < 4.77% (700 C) < 5.63% (800 C). The selectivity to aliphatic hydrocarbons in the bio-oil was as
major ketones observed in the bio-oil contained a 2- follows: 4.98% (800 C) < 10.50% (600 C) < 11.22% (700 C). The
cyclopenten-1-one backbone which are typical pyrolysis prod- lowest selectivity to aliphatic hydrocarbons was observed at
ucts from cellulose, as well as hemicellulose.36,48 The content of 800 C owing to the signicant conversion of pyrolysis vapors
ketones was found to increase with the temperature, which is in into non-condensable gases as a result of high temperature
line with results previously reported in the literature.48 The cracking reactions. The selectivity to alkanes was found to be
pyrolysis products from cellulose and hemicellulose in the bio- 2.70% and 2.45% at 600 and 700 C, respectively from PSB, as
oil were similar to those found from pyrolyzing pure cellulose compared to 4.52% and 5.16% at 600 and 700 C, respectively
and hemicellulose in a tube reactor.48 from USB. The reduction in the selectivity to alkanes can be
Phenolic compounds in the bio-oil were present in notice- attributed to the reduced mineral content as minerals may
able amounts. These compounds were a result of primarily assist in the formation of alkanes. The presence of alkali metals
lignin pyrolysis, as it is a biopolymer consisting of facilitated the formation of alkanes in the microalga species,
2242 | Sustainable Energy Fuels, 2021, 5, 2234–2248 This journal is © The Royal Society of Chemistry 2021View Article Online
Paper Sustainable Energy & Fuels
The bio-oil from the pyrolysis of PSB was found to be rich in
nitrogen-containing compounds such as amines/amides,
cyano/nitriles and nitrogen-containing heteroatomic aromatic
compounds. This is a result of the high nitrogen content in PSB
This article is licensed under a Creative Commons Attribution-NonCommercial 3.0 Unported Licence.
(4.65%) as compared to USB (2.8%) (Table 1). The selectivity to
amides/amines increased from 10.25% at 600 C to 13% at
700 C and then reduced to 9.80% at 800 C. This increment in
amides from 600 to 700 C can also be corroborated with the
reduction in the selectivity to carboxylic acids as they react with
ammonia evolved from the pyrolysis of amino acids. It can be
Open Access Article. Published on 26 February 2021. Downloaded on 8/7/2021 10:33:24 PM.
inferred from this observation that the presence of AAEM
species inhibited the reaction of carboxylic acids with
ammonia, as the selectivity to amides from the pyrolysis of USB
increased from 9.95% to 13% (PSB) at 700 C. The major amide
Fig. 6 Effect of temperature on the composition of bio-oil from the in the bio-oil was hexadecanamide, followed by 9-octadecena-
pyrolysis of PSB. mide and octadecanamide. The dehydration of amides resulted
in the formation of cyano/nitriles and their selectivity decreased
as the temperature increased as follows: 5.19% (600 C) > 4.68%
Nannochloropsis oculata.41 The pre-treatment or ash removal did (700 C) > 2.55% (800 C). Owing to the presence of minerals,
not alter the selectivities to alkenes and alkynes signicantly. It the selectivity to nitriles from the pyrolysis of USB at 800 C was
is to be noted that the selectivity to long-chain hydrocarbons higher (6.86%), compared to that from PSB (2.55%). This sug-
($C17) decreased signicantly as compared to USB and the gested the AAEM species present in SB facilitated the formation
reduction was as follows: 23.6% (600 C) < 57.1% (700 C) < of cyano/nitriles compounds via dehydration reactions.
90.1% (800 C). From these observations, it can be inferred that The bio-oil from the pyrolysis of PSB contained N-containing
the presence of AAEM species facilitated repolymerization aromatics in signicant amounts. The selectivity to these
reactions which increased with an increase in the temperature. compounds followed the trend: 8.05% (600 C) < 29.73% (700
Fig. S2a (in the ESI†) depicts the effect of temperature on the C) < 31.6% (800 C). This can be attributed to the increased
selectivity to hydrocarbons in the bio-oil from the pyrolysis of cyclization and aromatization reactions at a high pyrolysis
USB and PSB. temperature. Gautam and Vinu41 also observed an increase in
At 600 C, the selectivity to carboxylic acids increased from heteroatomic nitrogen containing aromatic compounds from
20.71% (USB) to 33.42% (PSB) in the bio-oil. At 600 C, n-hex- the pyrolysis of protein-rich alga in response to the temperature.
adecanoic acid (24.4%) was the major carboxylic acid along with At 600 C, 2-pyrrolidinone, 1H-indole, and b-carboline were
linoleic acid (4.93%) and stearic acid (2.76%). The selectivity to found to be the most abundant compounds in the bio-oil. 5-(2-
carboxylic acids decreased signicantly with the temperature as Methyl propyl)-2,4-imidazolidine, 5-ethyl-5-methyl-2,4-
follows: 33.42% (600 C) > 2.92% (700 C) > 1.66% (800 C). This imidazolidine, 2-methylpyrazine, pyridine and 1,4,5-trimethyl
can be attributed to the enhanced decarboxylation and cracking imidazole were observed to be the major compounds at 700 C.
reactions. The presence of metals in the USB inhibited the
At 800 C, 1H-indole, 3-pyridinol, 3-methyl-2,5-
extraction of carboxylic acids at 600 C resulting in lower pyrrolidinedione, 2-aminopyridine and picolinamide were
selectivity as compared to PSB. The removal of ash facilitated observed. The plausible conversion pathways for the formation
the extent of these reactions such as cracking and decarboxyl- of these compounds are depicted in Scheme 1.
ation. Fig. S2b (in the ESI†) shows the effect of the temperature Toluene (0.98–2.95%) was the major aromatic hydrocarbon
on the selectivity to the various oxygenated compounds in the identied in the bio-oil from the pyrolysis of PSB. The selectivity
bio-oil from the pyrolysis of USB and PSB. The major oxygenated to polycyclic hydrocarbons, such as naphthalene derivatives,
compounds were classied as carbonyl compounds, esters and increased from 0.75% (600 C) to 2.13% (700 C). The formation
furan derivatives. As observed in the bio-oil from USB, the of polycyclic compounds increases with an increase in the
selectivity to the furan derivatives was as low as that observed in pyrolysis temperature. In the bio-oil from PSB, the selectivity to
the bio-oil from PSB. These compounds did not have a signi- aromatic compounds was observed in the range 5.5–5.8% and
cant variation in the bio-oil with either an increase in the no signicant variations were observed. However, these selec-
temperature or pre-treatment of SB. The selectivity to furan tivities were higher than those observed in the bio-oil from the
derivatives was in the range of 1.6–1.9%. The selectivity to the pyrolysis of USB (2.8–4.6%). In addition to the aromatic
esters in the bio-oil was signicantly reduced by 30%, 60% and compounds, the selectivity to phenolics increased in the bio-oil.
70% at 600, 700 and 800 C, respectively aer the pre-treatment. The phenolics increased with the temperature as follows: 4.74%
The high selectivity to esters was a result of metals present in (600 C) < 7.52% (700 C) < 13.36% (800 C). At all of the
the ash in the USB. As the temperature increased, the selectivity pyrolysis temperatures, phenol, p-cresol and another lignin
to esters decreased from 5.17% at 600 C to 1.87% and 1.58% at derivative, guaiacol (2-methoxyphenol), were observed in the
700 and 800 C, respectively. This reduction at higher temper- bio-oil from PSB.
atures can be attributed to the cracking of esters.
This journal is © The Royal Society of Chemistry 2021 Sustainable Energy Fuels, 2021, 5, 2234–2248 | 2243View Article Online
Sustainable Energy & Fuels Paper
The pre-treatment of the biomass did not signicantly effect reduction in the hydrogen and oxygen content in the pyrolysis
the conversion pathways, as observed from the compounds in biochar can be attributed to the enhanced deoxygenation and
the pyrolysis bio-oil (Table S1, in the ESI†). However, signicant dehydration reactions at high pyrolysis temperatures. The low
ash removal from the biomass enhanced the bio-oil yield, and, oxygen content in the biochar from USB can be attributed to the
This article is licensed under a Creative Commons Attribution-NonCommercial 3.0 Unported Licence.
in addition, promoted the decarboxylation, cracking, aromati- high ash content. The nitrogen content in the char decreased
zation and cyclization reactions. This resulted in the conversion with an increase in the temperature as the high temperature
of amino acids to heterocyclic nitrogen-containing aromatic facilitates the release of nitrogen in the gas phase.
compounds. The presence of AAEM species in signicant A Van Krevelen diagram (Fig. S3 in the ESI†) captures the
amounts inhibited the extraction of the fatty acids in the bio-oil transition from SB biomass to biochars obtained from the
from the pyrolysis of USB. It is worth highlighting that the pyrolysis at different temperatures. The H/C ratios decrease
Open Access Article. Published on 26 February 2021. Downloaded on 8/7/2021 10:33:24 PM.
nitrogen-containing compounds, phenolics and aromatic signicantly as compared to the feedstock. The H/C and O/C
hydrocarbons have several uses, for example, in pharmaceutical ratios decreased from 1.85 to 0.37, whereas the O/C ratio
products, food preservatives, fuel additives and platform decreased from 0.63 to 0.06 in the case of the USB 800 biochar.
chemicals. The potential of the Salicornia biomass can be tap- For PSB, the H/C and O/C values were 1.73 and 0.42, respec-
ped efficiently by using catalysts to selectively produce these tively, which decreased to 0.37 and 0.33, respectively, for the
valuable platform chemicals. It is important to mention that the PSB800 biochar. This decreasing trend slowed as the samples
analysis of evolved gases during the pyrolysis of SB can certainly were pyrolyzed at higher temperatures. The reduction in these
provide further insights into the decomposition mechanism. ratios with an increase in the pyrolysis temperature occurs due
Therefore, this will be investigated as future work to gain to the dehydration and decarboxylation reactions. The ratio of
a better understanding of the pyrolysis of the Salicornia H/C is an indicator of the degree of carbonization: low values of
biomass. this ratio indicate a high degree of unsaturation (number of
bonds C]C) and aromaticity. It can be observed that at the
same pyrolysis temperature, the demineralization treatment
3.4. Characterization of biochar
decreased the aromaticity and increased the polarity of the
3.4.1. Elemental analysis. Table 3 presents the properties biochars, as indicated by the increasing atomic ratios of H/C
of the biochar obtained from the pyrolysis of SB. USB 600, USB and O/C in Table 3. It is important to mention that the
700 and USB 800 represent the char obtained from the pyrolysis biomass material typically consists of recalcitrant oxygen and
of untreated biomass at 600, 700, and 800 C, respectively. A a labile oxygen fraction.51 During the initial heating this fraction
similar representation was used for the biochar obtained from is quickly lost, whereas the recalcitrant oxygen is le in the nal
the pyrolysis of PSB. The elemental analysis (C, H, N, S, O) and product.
ash content of the different biochars are presented in Table 3. However, the O/C ratios offer information about the biochar
The carbon content of the biochar from the pyrolysis of USB and stability and the degree of aromatization. If the O/C ratios of the
PSB was in the range of 47.9 to 50.6% and 47.1 to 48.8%, biochar decrease, the stability increases. In fact, the aromatics
respectively. The carbon content in the different biochar are more stable when they show a minor oxygen percentage.
samples was in a similar range. The hydrogen content in the Biochar is extensively recognized as a relatively stable form of C,
biochar decreased as the pyrolysis temperature increased and owing to its prominent aromatic structure. At higher tempera-
the trends were as follows: 2.37% (USB600) > 1.47% (USB700) tures, the biochar from the untreated biomass has the lowest O/
and 2.52% (PSB600) > 1.47% (PSB700). The oxygen content in C, which indicates that the USB 800 biochar is more stable. This
the biochar from the pyrolysis of USB and PSB decreased with stability can be attributed to the presence of a large amount of
an increase in the temperature. The oxygen content decreased aromatic organic matter.52 At high temperatures, biochar has
from 10.50% (600 C) to 4.8% (700 C) and then further a low O/C ratio which is a result of the formation of an aromatic
decreased to 3.6% (800 C) in the biochar from the pyrolysis of ring structure representing a stable crystal. These stable crystals
USB. The oxygen content was high in the biochar obtained from resemble graphite-like structures. Biochar that has an O/C ratio
the pyrolysis of PSB and the following trend was observed: of more than 0.6 has a half-life of less than 100 years, while an
31.20% (600 C) > 28.66% (700 C) > 20.6% (800 C). This
Table 3 Properties of the biochar obtained from the pyrolysis of USB and PSB at different temperatures. Elemental analysis is reported in wt%
(dry basis) and the data are reported as mean (S.D.), n ¼ 3
Specic surface Pore volume
C (%) H (%) N (%) O (%) Ash (%) H/C O/C pH EC (mS cm1) area (m2 g1) (cm3 g1)
USB600 49.23 (1.4) 2.37 (0.3) 6.60 (0.1) 10.50 (1.8) 31.3 0.57 0.16 10.06 (0.02) 23.80 (0.12) 2.23 0.007
PSB600 48.75 (1.3) 2.52 (0.2) 5.23 (0.2) 31.20 (1.7) 12.3 0.62 0.48 9.98 (0.1) 12.84 (0.75) 6.68 0.026
USB700 50.6 (0.8) 1.47 (0.3) 6.05 (0.1) 4.8 (1.2) 37.8 0.35 0.07 11.86 (0.07) 24.75 (0.21) 2.35 0.011
PSB700 47.27 (1.4) 1.47 (0.1) 5.6 (0.1) 28.66 (1.6) 17 0.37 0.45 11.27 (0.13) 16.13 (0.08) 7.94 0.026
USB800 47.90 (0.8) 1.50 (0.2) 5.22 (0.1) 3.6 (1.1) 41.8 0.37 0.06 11.44 (0.12) 30.4 (0.5) 1.30 0.001
PSB800 47.07 (0.7) 1.47 (0.2) 4.36 (0.1) 20.6 (0.8) 26.5 0.37 0.33 11.43 (0.06) 17.02 (0.1) 5.30 0.022
2244 | Sustainable Energy Fuels, 2021, 5, 2234–2248 This journal is © The Royal Society of Chemistry 2021You can also read