The Validity of Ultrasound Technology in Providing an Indirect Estimate of Muscle Glycogen Concentrations Is Equivocal
←
→
Page content transcription
If your browser does not render page correctly, please read the page content below
nutrients
Review
The Validity of Ultrasound Technology in Providing an Indirect
Estimate of Muscle Glycogen Concentrations Is Equivocal
Julia L. Bone 1,2, *, Megan L. Ross 1 , Kristyen A. Tomcik 3 , Nikki A. Jeacocke 4 , Alannah K. A. McKay 1
and Louise M. Burke 1

                                          1   Exercise and Nutrition Research Group, Mary McKillop Institute for Health Research,
                                              Australian Catholic University, Melbourne, VIC 3000, Australia; meg.ross@acu.edu.au (M.L.R.);
                                              alannah.mckay@acu.edu.au (A.K.A.M.); louise.burke@acu.edu.au (L.M.B.)
                                          2   Performance Science, Sport Northern Ireland Sports Institute, Belfast BT37 0QB, UK
                                          3   Department of Nutrition, Case Western Reserve University, Cleveland, OH 44106, USA;
                                              kristyen.tomcik@case.edu
                                          4   Australian Institute of Sport, Canberra, ACT 2617, Australia; nikki.jeacocke@ausport.gov.au
                                          *   Correspondence: juliabone@sini.co.uk

                                          Abstract: Researchers and practitioners in sports nutrition would greatly benefit from a rapid,
                                          portable, and non-invasive technique to measure muscle glycogen, both in the laboratory and field.
                                          This explains the interest in MuscleSound® , the first commercial system to use high-frequency
                                          ultrasound technology and image analysis from patented cloud-based software to estimate muscle
                                          glycogen content from the echogenicity of the ultrasound image. This technique is based largely
                                          on muscle water content, which is presumed to act as a proxy for glycogen. Despite the promise
                                of early validation studies, newer studies from independent groups reported discrepant results,

                                          with MuscleSound® scores failing to correlate with the glycogen content of biopsy-derived mixed
Citation: Bone, J.L.; Ross, M.L.;
                                          muscle samples or to show the expected changes in muscle glycogen associated with various diet
Tomcik, K.A.; Jeacocke, N.A.; McKay,
                                          and exercise strategies. The explanation of issues related to the site of assessment do not account for
A.K.A.; Burke, L.M. The Validity of
                                          these discrepancies, and there are substantial problems with the premise that the ratio of glycogen to
Ultrasound Technology in Providing
                                          water in the muscle is constant. Although further studies investigating this technique are warranted,
an Indirect Estimate of Muscle
Glycogen Concentrations Is
                                          current evidence that MuscleSound® technology can provide valid and actionable information
Equivocal. Nutrients 2021, 13, 2371.      around muscle glycogen stores is at best equivocal.
https://doi.org/10.3390/nu13072371
                                          Keywords: carbohydrate loading; creatine loading; vastus lateralis; glycogen depletion
Academic Editor: Kazushige Goto

Received: 12 May 2021
Accepted: 7 July 2021                     1. Introduction
Published: 11 July 2021
                                                The determination of muscle glycogen content is of key interest in sports nutrition due
                                          to its roles as a fuel source in athletic performance and a regulator of muscle metabolism
Publisher’s Note: MDPI stays neutral
                                          and adaptation [1–3]. A technique that could achieve reliable and valid measurements,
with regard to jurisdictional claims in
                                          while being inexpensive, portable, and non-invasive, would have an enormous potential
published maps and institutional affil-
                                          for increasing knowledge and enhancing practice, particularly in work involving elite
iations.
                                          athletes and field conditions. Therefore, there is understandable excitement around the
                                          commercialisation of ultrasound technology aimed at measuring muscle glycogen in both
                                          laboratory and field situations [4,5]. MuscleSound® (Glendale, CO) uses high-frequency
                                          ultrasound technology and image analysis from patented cloud-based software to estimate
Copyright: © 2021 by the authors.
                                          muscle glycogen content from the echogenicity of the image; this feature is based largely
Licensee MDPI, Basel, Switzerland.
                                          on muscle water content, which is presumed to act as a proxy for glycogen [4–6]. It was
This article is an open access article
                                          used in research activities to describe changes in muscle glycogen in response to diet
distributed under the terms and
                                          and exercise, as well as being a commercially available tool to guide the preparation and
conditions of the Creative Commons
                                          recovery of athletes. Extended applications of MuscleSound® were more recently proposed,
Attribution (CC BY) license (https://
                                          including the monitoring of the glycogen status of critically ill patients in hospital intensive
creativecommons.org/licenses/by/
4.0/).
                                          care units as a measure of metabolic health [7]. Furthermore, ultrasound techniques are

Nutrients 2021, 13, 2371. https://doi.org/10.3390/nu13072371                                               https://www.mdpi.com/journal/nutrients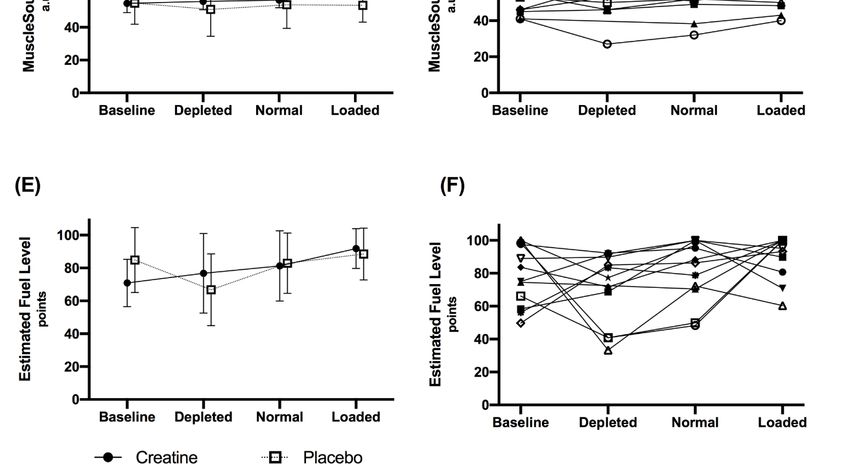
Nutrients 2021, 13, 2371                                                                                          2 of 20

                           being developed as reliable and valid protocols to monitor subcutaneous fat in athletic
                           populations [8]. Nevertheless, this review will focus on the use of MuscleSound® to assess
                           muscle glycogen within sporting populations and scenarios.
                                 Although validation studies have been published [4,5], incongruous experiences with
                           the use of this tool [9] led us to express concerns about a report on glycogen utilisation
                           during a high-level football match using MuscleSound® technology [10]. We questioned
                           the interpretation of these findings, including acknowledgement of data from our own
                           groups, which refute the validity of the MuscleSound® technique [11]. Rebuttal from the
                           study authors [12], which include co-founders of the technique and commercial company,
                           dismissed our concerns based on assertions that the dissenting studies failed to understand
                           the basis of the use of their tool. Furthermore, they noted that only one contradictory
                           dataset is available in the peer-reviewed literature, while the other study remained an
                           unpublished conference presentation [12].
                                 Given the many uses of muscle glycogen measurements in sports nutrition research
                           (e.g., investigations of strategies to enhance glycogen storage and enhanced understanding
                           of strategies to enhance post-exercise adaptation) and practice (e.g., guiding individual
                           athletes to optimally fuel for competition or achieve different levels of carbohydrate ((CHO)
                           availability for training goals), it is important to discern whether the MuscleSound® tech-
                           nique provides valuable and actionable information or whether it might contribute to
                           misleading research outputs and unsupported training and dietary practices. The aim of
                           this review is to examine the available literature on the use of this ultrasound technology
                           to measure muscle glycogen concentrations in athletic populations. To allow a complete
                           account, we will include the results of the unpublished project, while providing full trans-
                           parency over these data and the cause of their absence from the literature. Such data are
                           valuable given the small number of studies of muscle glycogen involving MuscleSound®
                           in general, and the independent nature of our investigation. We note, in particular, that
                           our study provides the only comparison between biopsy-derived glycogen measurements
                           and the newer estimated fuel level score provided by the MuscleSound® technology. The
                           estimated fuel level is described in a company “position stand” as the metric by which
                           athletes can be given actionable feedback about the suitability of their diet and exercise
                           practices [13]. Although the original technique, producing an estimate of muscle glycogen
                           content in arbitrary units, was described in two validation studies [4,5], we are unaware
                           of any published work that confirms the reliability and validity of the updated technique
                           which, as described in company literature, is the information provided for real-life uses.

                           2. Brief Overview of Methods to Assess Muscle Glycogen
                                 Muscle glycogen is an important fuel store for exercise, as well as a key regulator of
                           metabolism within the muscle cell [2]. Indeed, the development of methods to measure
                           its presence and location within the muscle cell provided the first major advances in the
                           science and practice of sports nutrition [14]. The first measurements of muscle glycogen
                           were made possible by the introduction of the percutaneous biopsy technique to sports
                           science in the late 1960s [15–17]. Subsequent modification of the technique included the
                           addition of suction to increase the size of the sample collected [18] and movement of
                           the location of the muscle site by 2 cm for subsequent biopsies to avoid the artefact of
                           damage from the first [19]. This protocol is still used today, and is considered the “gold
                           standard” for assessment of muscle glycogen stores, while acknowledging the invasiveness
                           of the procedure and its downstream limitations on the subjects and environments in
                           which it might be safely and logistically performed. A muscle sample collected by biopsy
                           (typically 20–200 mg according to the size and type of needle) can be treated with several
                           enzymic, histochemical, or electron microscopy procedures to determine the average
                           glycogen content of mixed muscle, the specific glycogen content of fibre types, or the
                           sub cellular location of glycogen, respectively [20–22]. In particular, validation studies
                           showed that glycogen measurements from a homogenated muscle sample, freeze-dried
                           to remove variables such as the presence of connective tissue and fluctuating cell water
Nutrients 2021, 13, 2371                                                                                            3 of 20

                           content, provides a reliable measure of the glycogen content of the whole muscle under
                           study [23].
                                 Notwithstanding the utility of the biopsy technique in allowing an in-depth analysis
                           of glycogen location within and between different muscle fibres, as well as enabling mea-
                           surement of a vast host of other muscle metabolites, signalling molecules, and other “omic”
                           interests, there is recognition that other techniques are needed to address the practical and
                           ethical concerns associated with its use. The addition of magnetic resonance spectroscopy
                           (MRS) to magnetic resonance imaging, and the increase in the power of the magnetic fields
                           generated by such equipment, has allowed MRS to become an additional tool to indirectly
                           assess muscle metabolites and fuel stores. This technique uses magnetic fields and radio
                           waves to measure tissue glycogen by monitoring either 13 C natural abundance levels, or
                           13 C atoms incorporated into glycogen following the administration of a 13 C substrate [20].

                           MRS techniques were shown to provide a reliable assessment of muscle glycogen in healthy
                           and clinical populations [24] and have been applied to assessments of glycogen utilisation
                           or storage in athletic populations [25,26]. Although MRS offers the advantages of providing
                           rapid, non-invasive, and potentially repeated measurements of glycogen in various tissues,
                           its disadvantages include the expense and the need to access specialised facilities and
                           expert technicians.

                           3. MuscleSound® Measurements of Muscle Glycogen
                                 MuscleSound® is a commercially available tool which uses high-frequency ultrasound
                           and patented software to derive an assessment of muscle glycogen. This technique, util-
                           ising a point of care device and cloud-based software, offers features that address the
                           disadvantages of both biopsy and MRS-derived assessments of muscle glycogen; namely, it
                           is a protocol that is non-invasive, relatively cheap, rapid, and portable. The original devel-
                           opment of MuscleSound® was undertaken by researcher-practitioners who noted apparent
                           correlations between ultrasound images and muscle glycogen content. The image greyscale
                           produced on an ultrasound scan is based on the intensity of the ultrasound “echogenicity”,
                           or reflection of an ultrasound beam, with the beam being both produced and detected
                           by the transducer forming the ultrasound image [27]. Ultrasound beams are reflected
                           at the boundary between two materials with different acoustic impedances, with strong
                           reflections showing as white on the ultrasound image and weaker echoes being grey [27].
                           Proprietary information within the MuscleSound® software aligns a darker image with
                           greater glycogen stores using the principal that greater glycogen, and its associated water
                           content in the muscle fibre, should reflect the lower echo intensity between soft tissue and
                           water [5,27]. Conversely, in instances when glycogen is low and there is less fluid, the echo
                           intensity is greater due to the increased visibility of other tissue boundaries, thus resulting
                           in a brighter image [5,27].
                                 The MuscleSound® technique, validated in two studies against biopsy-derived mea-
                           sures of muscle glycogen [4,5], produces a glycogen score in arbitrary units (hereafter
                           identified as a.u.), where values are provided in bands of 5, between 0 and 100, with an
                           unknown typical error. However, the assumed relationship between muscle glycogen
                           and water was noted as a technical issue requiring further investigation in one of these
                           foundation studies [5]. Indeed, according to an undated company position stand on the
                           science and application of MuscleSound® located on the company website [13], further
                           developments of the technique recognised scenarios in which muscle glycogen and water
                           deviated from this relationship, and they provided recommendations for situations in
                           which the use of MuscleSound® is considered optimal and those that are considered to be
                           sub-optimal (see Section 6.1). According to this position stand, the current output from
                           the MuscleSound® proprietary software provides a muscle energy status, representing the
                           mean of an estimated fuel level and a muscle fuel rating. The company material describes
                           muscle fuel as predominantly glycogen, with contributions from carnitine, creatine, and
                           protein. The estimated fuel level is determined by “placing an image in context of the
                           maximum (100) and minimum (0) points of glycogen obtained from a bank of images
Nutrients 2021, 13, 2371 4 of 20
captured for a specific participant”, with the muscle fuel rating providing a separate rating
compared to a large databank of images from many athletes [13]. We are unaware of
any published validation studies of these new metrics, although the company literature
promotes these values for field use in providing athletes with feedback about changes in
muscle glycogen resulting from their diet and exercise strategies [13].
4. The Bone Study of MuscleSound®
In 2014, we became aware of the newly launched MuscleSound® tool and realised
both its potential to enhance our work as sports nutrition practitioners and applied re-
searchers, and the opportunity to test its reliability and validity as an additional arm within
a pre-existing project investigating interactions between manipulations of muscle glycogen
and creatine content [28]. Although the main aim of the study was to investigate the effect
of creatine and glycogen loading on cycling performance, we embedded a research arm to
investigate artefacts in the measurement of lean mass by dual energy X-ray absorptiometry
due to changes in muscle water content associated with changes in muscle creatine, glyco-
gen, and water content [29]. We invited the MuscleSound® group to use this opportunity
to further test their technology in scenarios that are very common in sports, but outside
the conditions under which their own validation studies were conducted [4,5]. They were
not involved in the study design, funding, or conduct; rather, we funded their visit to
Australia to train us in the use of their technique. Although we had intended to use our
own ultrasound equipment to capture images, IT security requirements at our workplace
prevented us from uploading images to a cloud-based server. Therefore, MuscleSound®
loaned us an ultrasound machine and provided complimentary results of muscle glycogen
estimates derived from their proprietary software, using the original algorithm, for the
duration of the study. A contract was signed to oversee return of the equipment and, on
completion of the study, the contribution of our data towards further development of the
proprietary algorithm. Following data collection, the equipment was returned, and a poster
presentation was prepared for the 2016 annual meeting of the American College of Sports
Medicine (ACSM).
In the days prior to the ACSM meeting, we received a directive from a legal firm
engaged by MuscleSound® to withdraw the poster from the conference. Although we
complied, an electronic version of the abstract was included in a review of methods to assess
muscle glycogen in sports nutrition activities without our involvement [20]. To find a path
to our ethical obligation to be transparent with all research outcomes via peer-reviewed
publication, we subsequently agreed to allow the company to re-analyse the scans from our
study using an updated algorithm and interpretation framework. However, recognising
the commercial sensitivity of the two datasets, we decided to delay publication until other
studies of the validity of the technique, undertaken by independent research groups, but
partially funded by MuscleSound® [9], were released. Although the main results of the
current study, that MuscleSound® failed to provide valid estimates of muscle glycogen,
are no longer original, the additional range of scenarios that we have studied (supervised
CHO loading, prolonged exercise depletion, and the addition of creatine loading) present
novel outcomes. Furthermore, they include the only direct comparison of biopsy-derived
glycogen assessments and the MuscleSound® estimated fuel level score, which is promoted
in company material [13] as a commercially available use of this tool to provide actionable
information to athletes about the suitability of their diet and exercise activities. Once
published, we will provide the original data to the MuscleSound® company.
4.1. Overview of Study Methods
Twelve competitive male cyclists participated in this study, which was approved by
the human research ethics committees of the Australian Institute of Sport (20140612) and the
Australian Catholic University (2014 254N). These subjects (32.6 ± 5.1 years; 79.2 ± 9.5 kg;
5.1 ± 0.6 L/min maximum oxygen consumption, and 639 ± 115 W maximum power
output) represented a sub-group of a larger cohort who undertook the main project under4.1. Overview of Study Methods
Twelve competitive male cyclists participated in this study, which was approved by
Nutrients 2021, 13, 2371 the human research ethics committees of the Australian Institute of Sport (20140612)5 of 20
and
the Australian Catholic University (2014 254N). These subjects (32.6 ± 5.1 y; 79.2 ± 9.5 kg;
5.1 ± 0.6 L/min maximum oxygen consumption, and 639 ± 115 W maximum power output)
represented
which this study a sub-group of a larger
was performed cohort
[28]. Thiswho undertook
study employed theamain
parallelproject
groupunder which
design to
this study was performed [28]. This study employed a parallel group
investigate the effect of creatine loading, followed by a within-group cross-over application design to investigate
the effect of creatine
of carbohydrate loading,
loading followed
on muscle by a within-group
substrate, water content, cross-over application(Figure
and performance of carbo-1).
hydrate
The participants came in for four separate biopsy and ultrasound measurements; The
loading on muscle substrate, water content, and performance (Figure 1). par-
baseline
ticipants
(day 0, 6 came in for four separate
g carbohydrate/kg bodybiopsy and ultrasound
mass (BM)/day for 48measurements;
h), glycogen depleted baseline (day
(day 1)
0,
6and
g carbohydrate/kg
either glycogen body loaded mass (BM)/daynormal
or glycogen for 48 h),
(6 glycogen
g carbohydrate depleted /kg(day1)
BM/dand foreither
48 h)
glycogen loaded or glycogen normal (6 g carbohydrate /kg BM/d
with or without creatine supplementation (days 7 and 14). Manipulations of creatine for 48 h) with or without
creatine supplementation
and glycogen (days 7 and
stores were achieved by 14). Manipulations
implementing “bestofpractice
creatineprotocols”
and glycogen stores
of creatine
were achieved by implementing “best practice protocols” of
loading (20 g/day for 5 days loading and 3 g/day for maintenance) [30] and glycogencreatine loading (20 g/day for
5loading
days loading and 3 g/day for maintenance) [30] and glycogen
(12 g CHO/kg BM/day for 48 h) [31] through a standardised pre-packaged diet. loading (12 g CHO/kg
BM/day for 48ah)
Furthermore, [31] through
supervised a standardised
cycling protocol of pre-packaged diet. Furthermore,
~3.5 h was undertaken to depleteamuscle
super-
vised cycling
glycogen protocol
stores. The of ~3.5 hprotocol
cycling was undertaken
involvedtoa deplete
120 km muscle glycogen
time trial, stores. The
with alternating
cycling
1 km and protocol
4 km involved a 120 10
sprints every kmkm,timefollowed
trial, withby alternating
a ride to 1exhaustion
km and 4 km at sprints every
8% gradient
10 km, followed by a ride to exhaustion at 8% gradient and
and 88% VO2 max; further details can be found in [28]. Participants consumed 60 g/h88% VO 2 max; further details
can
CHO beduring
found in the[28]. Participants
cycling protocol consumed 60 g/h CHOintake
with post-exercise duringofthe cycling
a low CHO protocol
diet (Nutrients 2021, 13, 2371 6 of 20
transducer head was manipulated to achieve a bright fascia, which defined the muscle
boundary for the region of interest. Images were then uploaded to the MuscleSound®
software (v.2015, MuscleSound® , LLC, Denver, CO, USA) and processed according to their
proprietary protocols. The MuscleSound® score (0–100) was subsequently provided in
arbitrary units (a.u.), noting that such scores were provided in bands of 5 a.u. [5]. A single
score used in the statistical analysis was obtained by averaging the score from each of the
five images at each site.
4.3. Estimated Fuel Level (2017)
The ultrasound images were re-analysed by MuscleSound® using an updated protocol
titled “estimated fuel level”. Details of this proprietary process were not published, but
are described as “placing an image in context of the maximum (100) and minimum (0)
points of glycogen obtained from a bank of images captured for a specific participant [13]”.
We have described these values as “points” to distinguish them from the original metrics
(described as a.u.).
4.4. Statistical Analysis
Agreements between biopsy and MuscleSound® estimated fuel level scores were as-
sessed by 95% intra-class correlation based on a one-way, consistency model [33]. Pearson’s
correlations were used to determine the association between site-specific measurements.
The muscle glycogen concentration across the different states was assessed using a general
linear mixed model (LMM) using the R package lme4 (R Foundation for Statistical Com-
puting, Vienna, Austria). All models included a random intercept for subject to adjust for
baseline levels and inter-individual homogeneity. Additionally, creatine dry weight was
included as a covariate in all models. Each model was estimated using restricted maximum
likelihood, with the tests for statistical significance of the fixed effects performed using
type II Wald tests with Kenward–Roger degrees of freedom. Where significant fixed effects
were evident, Tukey’s post hoc comparisons were performed to detect specfic condition
differences.
4.5. Results
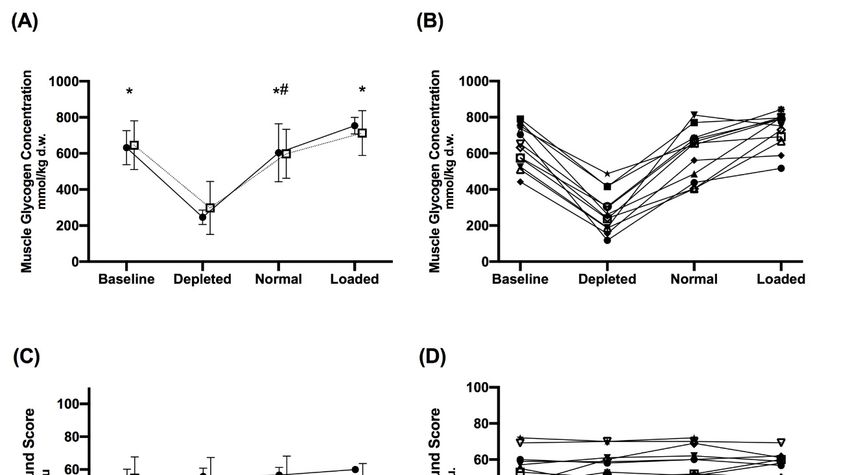
The effects of the different dietary treatments on biopsy-derived muscle glycogen
concentrations, MuscleSound® scores and estimated fuel level points, and the influence
of placebo and creatine supplementation are summarised in Figure 2. These data rep-
resent measurements taken on one leg using the established protocol to site sequential
muscle biopsies (B1 –B4 ), with the MuscleSound® score being taken on the contra-lateral
leg at the corresponding site (U1 –U4 ). There was a significant main effect for the differ-
ent dietary treatments on biopsy-derived muscle glycogen concentrations (F(3,29) = 61.2,
p < 0.001). Values of biopsy-derived glycogen concentrations for glycogen depletion were
lower than baseline, CHO loaded, and normal conditions (p < 0.001), while values for
carbohydrate loading were significantly greater than normal (p = 0.013). Since there were
no differences in muscle glycogen between the creatine and placebo groups (F(1,10) = 0.1;
p = 0.760), a combined mean value for the results for each treatment was derived. Never-
theless, creatine dry weight was a significant variable within the model, indicating that
higher creatine dry weight values were associated with increased muscle glycogen content
(F(1,33) = 8.6; p = 0.006).
There were no differences in MuscleSound® scores between dietary treatments
(F(3,27) = 1.1; p = 0.384) or between the placebo and creatine groups (F(1,10) = 0.3; p = 0.627).
Furthermore, no statistically significant differences between dietary treatments (F(3,28) = 1.1;
p = 0.352) or between the placebo and creatine groups (F(1,10) = 0.2; p = 0.701) were evident
for the estimated fuel level points. Finally, creatine dry weight was not associated with
either MuscleSound® (F(1,28) = 2.04; p = 0.165) or estimated fuel level points (F(1,37) = 3.07;
p = 0.088). An ICC of −0.75 (95% CI −0.85, −0.59) was apparent in the relationship be-
tween biopsy-derived muscle glycogen content and MuscleSound® scores, with a similarlyFurthermore, no statistically significant differences between dietary treatments (F(3,28) =
1.1; p = 0.352) or between the placebo and creatine groups (F(1,10) = 0.2; p = 0.701) were
evident for the estimated fuel level points. Finally, creatine dry weight was not associated
Nutrients 2021, 13, 2371 7 of 20
with either MuscleSound® (F(1,28) = 2.04; p = 0.165) or estimated fuel level points (F(1,37)
= 3.07; p = 0.088). An ICC of −0.75 (95% CI −0.85, −0.59) was apparent in the relationship
between biopsy-derived muscle glycogen content and MuscleSound® scores, with a simi-
larly unclear
unclear relationship
relationship betweenbetween
biopsy−biopsy−derived
derived musclemuscle
glycogenglycogen
contentcontent and esti-
and estimated
mated
fuel levelfuel level(ICC
points points
of (ICC
−0.72of(95%
−0.72CI
(95% CI −0.83,
−0.83, −0.55)).
−0.55)). TheThe estimated
estimated fuel
fuel level
level points
points
were
were quantitatively
quantitatively higher
higher than
than thethe MuscleSound
MuscleSound ® score,
® score, reflecting an amplification of the
reflecting an amplification of the
original
original values
values from
from anan absolute
absolute value
value toto a relative
a relative range.
range.
Figure 2. Biopsy-derived muscle glycogen concentrations (A,B)(A-B),
MuscleSound ® scores in arbitrary units (C,D) and estimated
Figure 2. Biopsy-derived muscle glycogen concentrations MuscleSound ® scores in arbitrary units (C-D) and esti-
fuel level fuel
mated points (E,F)
level for the
points creatine
(E-F) and
for the placebo
creatine conditions
and during eachduring
placebo conditions dietaryeach
treatment:
dietarybaseline, glycogen
treatment: depleted,
baseline, glycogen
normal and carbohydrate loaded. Values are mean ± SD in panels A, C and E with individual data shown in panels B, D
and F. * Indicates a significant difference to depleted. # Indicates a significant difference to loaded.
There were no differences between the MuscleSound® score values collected from the
site on the contra-lateral leg corresponding to the biopsy site (U1 –U4 ) and the measurements
taken on a static site of the leg (U1 ) for each treatment. Indeed, there was a significant
correlation (r = 0.87 (95% CI: 0.78–0.93); p < 0.001) between the values from the twodepleted, normal and carbohydrate loaded. Values are mean ± SD in panels A, C and E with individual data shown in
panels B, D and F. * Indicates a significant difference to depleted. # Indicates a significant difference to loaded.
There were no differences between the MuscleSound® score values collected from the
Nutrients 2021, 13, 2371 8 of 20
site on the contra-lateral leg corresponding to the biopsy site (U1–U4) and the measure-
ments taken on a static site of the leg (U1) for each treatment. Indeed, there was a signifi-
cant correlation (r = 0.87 (95% CI: 0.78–0.93); p < 0.001) between the values from the two
different sites(Figure
different sites (Figure3A).
3A).Likewise,
Likewise,there
therewere
werenono between-site
between-site differences
differences in the
in the values
values of
of estimated fuel level points for each treatment, but the correlation between
estimated fuel level points for each treatment, but the correlation between these values these values
was
was lower
lower (Figure
(Figure 3B; (r3B; (r = 0.63
= 0.63 (0.42–0.78);
(0.42–0.78); p < 0.001)).
p < 0.001)). A separate
A separate examination
examination of the
of the results
results of
of MuscleSound
MuscleSound ® scores taken at the same site (U1) showed a small but significant (p =
® scores taken at the same site (U1) showed a small but significant (p = 0.024)
0.024) difference
difference between between
depleteddepleted
(53 ± 13(53a.u.)
± 13and
a.u.)loaded
and loaded treatments
treatments (57 ±(5710 ±a.u.).
10 a.u.). How-
However,
ever, these did not differ from baseline (56 ± 3 a.u.) or normal (57 ±12 a.u.)
these did not differ from baseline (56 ± 3 a.u.) or normal (57 ±12 a.u.) values. Furthermore, values. Further-
more,
the the numerical
numerical difference
difference betweenbetween
the meanthe meanwas
values values wasthan
smaller smaller than the gradation
the gradation (bands of
5(bands of 5 a.u.)sequential
a.u.) between between sequential
results. The results. The estimated
estimated fuel level
fuel level points pointsthese
mirrored mirrored these
outcomes
outcomes
with with an spread
an increased increased in spread
both theinmeanboth the mean
values andvalues and SD. Differences
SD. Differences were
were detected
detected depleted
between between (59depleted
± 30) and(59 ±loaded
30) and(91loaded
± 14)(91 ± 14) treatments
treatments (p =but
(p = 0.026), 0.026), butof
neither neither
these
of these from
differed differed
thefrom
baseline (78 ± 19)(78
the baseline or ±normal
19) or (77 ± 22)(77
normal ± 22) values.
values.
Figure 3. Correlation between values for MuscleSound ® score (A) and the estimated fuel
Figure 3. Correlation between values for MuscleSound® score (A) and the estimated fuel level (B)
level (B) measured at the same site (U1 ) and at the shifting site (U11 –U4 ) corresponding to the
measured at the same site (U1) and at the shifting site (U11–U4) corresponding to the muscle biopsy.
muscle biopsy.
5. The
5. The Literature
Literature Involving
Involving MuscleSound
MuscleSound®® Assessment
Assessment of of Muscle
Muscle Glycogen
Glycogen
A summary of the available literature in which MuscleSound ® ® technology was used
A summary of the available literature in which MuscleSound technology was used to
to assess
assess changes
changes in muscle
in muscle glycogen
glycogen content
content resulting
resulting from dietary
from dietary and exercise
and exercise inter-
interventions
ventions is provided in Table 1. This includes the validation studies, which originally
is provided in Table 1. This includes the validation studies, which originally introduced in-
troduced
the use of the use of MuscleSound
MuscleSound ® as a proxyas
®
fora biopsy-derived
proxy for biopsy-derived
measures of measures of muscle[4,5],
muscle glycogen gly-
cogen
two [4,5],data
other twosets
otherindata
whichsetsmuscle
in which musclecontent
glycogen glycogenandcontent and itswere
its changes changes were
assessed
by ultrasound and chemical protocols [9], the Bone data presented here, and a recently
published study in which MuscleSound® alone was used to assess changes in muscle
glycogen content over an exercise session [10]. A final paper, involving the use of the newer
estimated fuel level metric, was not included in this table due to differences in its focus
and methodology, but it is included in the discussions.Nutrients 2021, 13, 2371 9 of 20
Table 1. Studies involving ultrasound (MuscleSound® ) measurements of muscle glycogen, including comparison to biopsy-derived chemical assessments of glycogen.
Hill & San-Millan 2014 Nieman et al., 2015 Routledge et al., 2019a Routledge et al., 2019b San-Millan et al., 2020 Bone et al., 2020
20 M cyclists (regular 12 M cyclists/triathletes
22 M cyclists (competitive: 16 M recreationally active 9 M soccer players:
competitors in road and TT: 14 M rugby league players (well-trained:
Study population professional and amateur: VO2max 49.9 ± (professional: U.S. major
VO2 max: (professional) VO2max
category 1–4) 7.5 mL/kg/min soccer league)
47.9 ± 7.8 mL/kg/min) 64.5 ± 7.6 mL/kg/min)
• Pre-exercise:
normalised CHO
• Pre-exercise:
maximally CHO
• Pre-exercise: CHO • Pre-exercise: • Pre-exercise: • Pre-exercise: • Pre-exercise: loaded
loaded normalised glycogen? normalised glycogen? normalised glycogen normalised glycogen? • Pre-exercise:
Scenarios of glycogen • Post exercise • Post exercise • Post-exercise • Post-exercise: • Post exercise
measurements normalised CHO +
depletion (endurance depletion (endurance depletion (field: team substantial depletion depletion (field: team creatine loaded
cycling) cycling) sport) • CHO loaded sport) • Pre-exercise: CHO
loaded and creatine
loaded
• Post-exercise:
substantial deletion
Glycogen preparation: Glycogen preparation: “24 h Glycogen preparation:
“optimized” via 3 days @ team nutrition protocols”; Normalised: 48 h @ 6 g/kg
Supervised exercise
8 g/kg Glycogen preparation: NA Glycogen preparation: NA pre-exercise meal: “team CHO loaded: 48 h @
Dietary protocols depletion followed by either
Pre-exercise meal: NA Pre-exercise meal: NA Pre-exercise: NA nutrition”; 12 g/kg
(CHO intake) 36 h of low CHO (2 g/kg)
During exercise: NA During exercise: water only During exercise: water only during exercise: 40 g at Pre-exercise meal: 2 g/kg
or high CHO (8 g/kg)
(self-managed with warm up and 65 g at half During exercise: 60 g/h
instructions) time Depletion: 18 h @ 1 g/kg
Glycogen depletion cycling
90 min cycling on lode
protocol: 90%/50% PPO 120 km TT (alternating 1
ergometer at 75 km (~168 min) TT on
Exercise and 80%/60% PPO until and 4 km sprints every 10
“moderate-high intensity own bike mounted on 80 min rugby league match 90 min soccer match.
protocol exhaustion km) + TTE on cycle at 8%
eliciting CHO oxidation ergometer
(* low CHO trial: extra 45 gradient and 88% VO2 max.
rates of 2–3 g/min.”
min at 60% PPO).
Post-exercise: NA Pre-exercise: 2 h prior to
Baseline: 10 min before
Baseline: Baseline: NA Baseline: 60 min pre-match. Depleted: 36 h after exercise exercise (e.g., before
Timing of glycogen warm-up.
immediately before exercise Post-exercise: within 20–30 Post-exercise: within 40 + low CHO pre-exercise meal)
measurements Post-exercise: within 5–10
Post-exercise: NA min min. CHO loaded: 36 h after Depleted ~18 h post
min
exercise + high CHO exercise + low CHONutrients 2021, 13, 2371 10 of 20
Table 1. Cont.
Hill & San-Millan 2014 Nieman et al., 2015 Routledge et al., 2019a Routledge et al., 2019b San-Millan et al., 2020 Bone et al., 2020
Rectus Femoris (U and Bx)
Vastus lateralis
Muscle assessed U on Vastus lateralis: (data Vastus lateralis Vastus lateralis Rectus femoris (U only) Vastus lateralis
Rectus Femoris
not provided)
Muscle state Contracted Not advised Relaxed Relaxed NA Relaxed
Baseline Bx on right leg. Bx on same leg. Mid-point
Post-exercise Bx on left leg. Baseline and post-exercise Bx for low and high CHO between ASIS and anterior
Baseline and post-exercise
Muscle biopsy location Mid-point between ASIS to Bx on same leg 2 cm apart dietary conditions on same Nil superior aspect of patella.
Bx on same leg 2 cm apart
superior patellar. Same Same location as ultrasound leg 1–2 cm apart Four sites 2 cm apart (see
location as ultra-sound Figure 1)
U on contralateral leg (1) at
Same leg as Bx. Same leg as Bx. 50% of Same leg and same site as
NA—same leg used for pre- corresponding location to
Ultrasound location Baseline U on right leg. Same leg as Bx length and width of VL Bx. 50% of length and width
and post-U scans? muscle biopsy (at each of 4
Post-exercise U on left leg determined by U of VL determined by U
sites—Figure 1)
Ultrasound Scan protocol NA Mean of 3 scans NA NA Mean of 2 scans Mean of 5 scans
Bx: Glycogen (mmol/kg
dw) reduced from 639 ±
115 to 276 ± 115 with
Bx: Glycogen (mmol/kg Bx: Glycogen (mmol/kg
Bx: Glycogen (mmol/kg depletion and increased
Bx: Glycogen (mmol/kg dw) reduced from 443 ± 65 dw) with high dietary CHO:
dw) reduced from with CHO loading to: 730 ±
dw) showed mean change to 271 ± 94 (p < 0.0001) 531 ± 129 vs. low CHO Bx: No biopsy conducted.
416 ± 146 to 267 ± 98 by 98 (p < 0.05)
of 306 ± 99 * due to exercise by exercise. dietary intake: 252 ± 64 U: MuscleSound® score
exercise (p < 0.001). U: MuscleSound® score
Glycogen data * (~407 to 101) (p < 0.001). U: no change in (p < 0.001). (“points”) decreased from
U: MuscleSound® score (a.u.): 55 ± 10 (baseline); 52
U: baseline and MuscleSound® score from U: MuscleSound® score 80 ± 8.6 to 63.9 ± 10.2.
(a.u.) reduced from 59.8 ± ± 13 (depletion) and 56 ± 8
post-exercise glycogen score baseline (47 ± 6 a.u.) to (a.u.) with high dietary (p = 0.005)
15.9 to 39.8 ± 13.9 (CHO loaded), NS.
data not provided post-exercise (49 ± 8 a.u.; CHO: 56 ± 7 vs. low dietary
post-exercise (p < 0.0001) U: EFL (points): 79 ± 18
p = 0.4) CHO intake: 54 ± 6 (p = 0.3)
(baseline); 70 ± 22
(depletion) and 90 ± 14
points (CHO loading), NS.
M, male; a.u., arbitrary units; Bx, biopsy; U, Ultrasound scan; ASIS, anterior superior iliac spine; @, at; CHO, carbohydrates; VO2 max, maximal oxygen capacity; NA, not available; PPO, peak power output; NS,
not significant; and EFL, estimated fuel level; * All biopsy-derived glycogen values presented as mmol/kg dry weight (dw), with conversion from mmol/L wet weight (ww) involving multiplication by 4.28 [34].Nutrients 2021, 13, 2371 11 of 20
Although laboratory-based cycling protocols represent the most frequently investi-
gated mode of exercise, several studies have included real-world competition involving
field-based team sports (see Table 1). Dietary manipulations include low, moderate, and
high CHO intakes, as well as creatine loading. Muscle and body water content, although
not directly measured in any of these studies, is likely to be altered by the acute effects
of exercise as well as exercise-associated dehydration. Although vastus lateralis was the
muscle investigated in the majority of studies, differences in study protocols around the
MuscleSound® assessment included muscle tension (relaxed vs. contracted), whether the
same or contra-lateral leg was used between or within glycogen-assessment protocols,
whether the scan was meant to represent the same or a related muscle site, and how many
scans were used to derive the MuscleSound® outcome.
The first two publications involving MuscleSound® were designed to directly validate
its use for indirect assessment of muscle glycogen concentrations, measuring glycogen
content before and after a 90 min steady-state [4] or ~158 min time-trial cycling protocol [5]
at the same or a similar site in the chosen muscle. In both studies, the ultrasound scan and
subsequent biopsy were undertaken at the same site, with the ultrasound being conducted
first, followed by the collection of the biopsy, guided by the ultra-sound. In the first
study [4], one leg was used for the pre-exercise assessment, while the contra-lateral leg
was used in the same manner for the post-exercise assessment to avoid the effect of the
muscle biopsy on subsequent glycogen storage at that muscle site [19]. In the second
study, the same leg was used for both assessments, but the second biopsy was taken at
a site 2 cm from the first; this is sufficient to avoid the effects of such muscle damage on
glycogen content, at least by the biopsy technique [19]. With the longer cycling protocol,
Nieman et al. reported significant correlations between the two measurement techniques
for pre- (0.92, p < 0.001), post- (0.90, p < 0.001), and exercise-associated changes (0.92,
p < 0.001) in glycogen concentrations in the vastus lateralis muscle [5]. Here, the chemical
method showed a reduction in muscle glycogen content by 77 ± 17%, representing an
absolute change of ~71 mmol/kg ww (~306 mmol/kg dw) glycogen; the absolute scores
on the MuscleSound® 0–100 a.u. rating were not provided [5]. These data represent a
more practical and representative examination of glycogen utilisation during a prolonged
endurance sport than the earlier study of Hill and San Millan [4], which employed a
90 min cycling protocol and biopsy collection from the infrequently studied rectus femoris
muscle. Indeed, in the earlier study, absolute glycogen values achieved by the dietary
preparation protocol and their subsequent utilisation during exercise were lower, with
muscle glycogen being reduced by 36% according to chemical analysis and a MuscleSound®
change score of ~60 to ~40 a.u. (33% decrease). Nevertheless, correlations between the
chemical and ultrasound-mediated assessments of muscle glycogen concentration had pre-
(0.92, p < 0.001), post- (0.90, p < 0.001), and exercise-associated changes (0.92, p < 0.001) [4].
In contrast to these earlier reports, an investigation of two separate exercise scenarios
by another research group failed to find consistency between the MuscleSound® scores and
biopsy-derived assessments of muscle glycogen changes due to exercise and diet [9]. In
these studies, which involved cycling and a rugby league match, measurements were made
on the same leg, with the biopsy sites 2 cm apart [9]. Although the muscle biopsy protocol
identified a ~40% reduction in glycogen content as a result of match play in a real-world
rugby league competition (pre-game: 443 ± 65 and post-game: 271 ± 94 mmol/kg dry
weight (dw), p < 0.001), there were no changes in the MuscleSound ® scores (47 ± 6 vs.
49 ± 7, p = 0.4).
A separate study, involving a cycling protocol, was undertaken to remove any poten-
tial confounding effects associated with the characteristics of rugby play (i.e., intermittent
nature and the magnitude of the muscle contractile forces) that might interfere with the
ultrasound image and explain the discrepant results. This second investigation involved
an exercise-depletion protocol after which either a low carbohydrate diet or a carbohy-
drate loading regimen was implemented for 36 h [9]. Although biopsy-derived muscle
glycogen concentrations after the carbohydrate loading diet were more than doubled inNutrients 2021, 13, 2371 12 of 20
comparison to 36 h of low carbohydrate recovery (~531 vs. 252 mmol/kg dw, Table 1),
there were no differences (p = 0.9) in corresponding MuscleSound® scores (56 ± 7 vs.
54 ± 6 a.u.). In summary, two separate studies of different types of exercise failed to find
significant correlations between changes in muscle glycogen concentration and changes in
MuscleSound® scores, and, in both protocols, the ultrasound results failed to detect what
could be considered predicable changes in glycogen stores.
The results of the Bone study, presented in this paper, are in agreement with the latter
two datasets in finding that the MuscleSound® technique failed to provide meaningful
information about muscle glycogen concentrations in athletes. The mean values for muscle
glycogen derived from chemical analysis of mixed muscle samples showed larger ranges
than reported in the comparative literature, with pre-exercise values after a glycogen
loading technique of ~730 mmol/kg wet weight (ww) and a post-exercise reduction of
~364 mmol/kg ww. These values reflect the more aggressive CHO loading regimen and
the demanding nature of the exercise protocol. Despite a greater opportunity to detect
differences in muscle glycogen, we found that the original MuscleSound® technique gen-
erally failed to track the results achieved by chemical analysis of mixed muscle biopsy
samples across a range of diet and exercise manipulations, and failed to show the expected
significant changes in glycogen concentrations. Individual data showed a range of re-
sponses, both in magnitude and direction, in response to each treatment (Figure 2). The
only MuscleSound® comparison that yielded a statistically significant difference involved
measurements taken from the same site between the depleted and loaded treatments.
However, in the case of the original scoring system, the difference was numerically small
(53 ± 13 vs. 57 ± 10 a.u.) and was less than the band (5 a.u.) by which results were
provided, rendering it of minimal clinical value. Furthermore, this analysis failed to detect
differences between the normal glycogen stores and treatments that either increased or
decreased these. The estimated fuel level, an updated MuscleSound® metric representing
results relative to the lowest and highest scores for the individual athlete, mirrored these
results. Although this metric amplified the numerical value of the original score results,
and created a greater difference between the mean values, it also increased the range of
the results. Therefore, it failed to change the ability of the protocol to detect differences
between most treatments.
Two additional publications, which involved the use of MuscleSound® to investigate
changes in muscle glycogen in scenarios of real-life sports without alternative confirmation
of glycogen stores, are available. One study [10] involved an investigation of changes
in muscle glycogen during a football (soccer) match in a professional American league
(Table 1). Players followed their typical nutrition practices before and during the match,
while the MuscleSound® technique was used to assess glycogen stores pre- and post-
game. From the methodology described in the paper, we assumed this protocol involved
the traditional MuscleSound® score technique, albeit with results presented as “points”,
rather than the new metrics described in the company’s position stand [13]. There was no
confirmation of these results with an independent chemical measurement of glycogen, nor
was the hydration status of the players measured before or after the match. Nevertheless,
the study reported a mean decline in MuscleSound® glycogen scores of 20% over the
course of the match, with inter-individual ranges of 6% to 44%, and some variability in the
size of the pre-game stores. As predicted, but not verified by information on individual
workload characteristics of the specific game, the decline in muscle glycogen points was
numerically greater in midfield and forward players than defence players, and was lowest
in the goal keeper. Although these results appear unremarkable, the authors suggested
that the protocol identified players who had not adequately fuelled prior to the game, as
well as players who might undertake more aggressive fuelling strategies during the game.
Here, we note that if within-game fuelling provides an additional exogenous fuel source as
glycogen stores become depleted, rather than substantially changing patterns of glycogen
depletion during the match, the pre- and post-measurement of glycogen by any technique
may provide confusing results.Nutrients 2021, 13, 2371 13 of 20
The final publication involved the use of MuscleSound® to monitor resting levels
of glycogen in U.S. Division 1 collegiate female volleyball players on each morning of
a 9 day pre-season training camp [35]. The MuscleSound® information was provided
in the form of muscle fuel rating, which, as previously noted, remains unvalidated in a
peer-reviewed published format. This investigation focused on bilateral asymmetries in
the glycogen stores in the rectus femoris in these athletes prior to each morning’s training
session. The study reported an increase in muscle fuel ratings from the first to second
day, with a sustained elevation over the rest of the camp and a 58% difference (higher
level) between ratings for the dominant versus non-dominant leg. Although the temporal
changes did not track with the training load over the camp (higher in the first days), the
authors noted that no dietary control or assessment was implemented. The difference in
fuel ratings between legs was attributed to faster rates of glycogen storage in “the more
conditioned” dominant leg. Although endurance-trained muscle is known to have higher
resting glycogen stores than non-trained muscle (e.g., 500 vs. 350 mmol/kg dw [36]),
it is difficult to imagine that the magnitude of difference between legs within the same
well-trained athlete would be as large as reported, albeit with a different assessment metric
(muscle fuel rating of 52 vs. 33 points). The authors suggested that bilateral asymmetries
in glycogen content in volleyball athletes might be used to assess for injury risk, noting
that large asymmetries and bilateral deficits in muscle strength are sometimes linked
to injuries in athletes [35]. Although this would be a potentially valuable application,
there is presently no validation of either the muscle fuel rating score as a measure of
muscle glycogen, whether glycogen utilisation patterns are sufficiently different between
limbs across a range of symmetrical and asymmetrical exercise activities detected by any
technique, nor whether this is associated with injury risk or patterns.
In summary, evidence supporting the use of ultrasound technology, and particularly
the MuscleSound® proprietary technique, as a valid measure of muscle glycogen stores is
equivocal. In terms of its use as a research tool, two data sets involving laboratory-based
cycling protocols validated a correlation with measurements of the glycogen content of
a biopsy-derived mixed muscle sample, providing a measure of muscle glycogen from
0–100 in arbitrary units under controlled conditions. Furthermore, the changes in muscle
glycogen stores were in line with the expected outcomes of various diet and exercise
protocols. Another data set collected in a field setting provided glycogen score results
that were logical, but not independently verified. Three other data sets involving lab
and field-based uses, however, conflict with these findings. Two collected in cycling
models in controlled laboratory conditions, and another undertaken in a real-life team
sport competition, failed to find correlations between the two sources of information on
glycogen stores. Most importantly, none of these data sets were able to consistently detect
differences in MuscleSound® scores despite supervised manipulations of diet and exercise
that are known to achieved substantial changes. In one of these studies, a new technique
to present MuscleSound® results, described in a company-issued position stand, and
presumed to represent its current commercial application, also failed to detect outcomes
that would be predicted by the study interventions. This occurred even when undertaken
with standardised protocols (e.g., use a single trained tester, laboratory conditions, and the
averaging of five separate scans) that might not be possible under the real-life conditions
for which it is promoted. Two major issues around the validity and reliability of the
MuscleSound® technique have been identified for discussion.
6. Validity of the MuscleSound® Technique: The Glycogen: Water Ratio
6.1. General Principles
The MuscleSound® technique is based on the principle that the echogenicity or bright-
ness of an ultrasound image reflects the speed of the sound waves reflected by scanned
tissues, and in turn, their water content [10,12]. Water, which provides little resistance,
produces a dark (hypoechoic) image that can be quantified via the pixel intensity of the
image on the scan image [10,12]. In turn, muscle glycogen is quantified by the assumptionNutrients 2021, 13, 2371 14 of 20
of a constant relationship with bound water of 1:3 [10,12]. Such calculations are achieved
when an image captured by a high-frequency ultrasound is examined by the cloud-based
proprietary software of the MuscleSound® company.
Although it is well accepted that fluid is stored when glycogen is formed, the persis-
tence of a fixed relationship over a range of glycogen concentrations has been challenged
both in the general literature and in relation to the MuscleSound® protocol [9–12,37,38].
The first validation study of MuscleSound® [4] did not identify the water to muscle glyco-
gen ratio as an underpinning principle of the ultrasound technique; this explanation was
provided in the subsequent validation study. Here, although a tight correlation between
ultrasound and biopsy-derived measures of muscle glycogen was reported, the authors
noted that “additional research is needed to determine how exercise-induced changes
in muscle water content influence this relationship”. Indeed, knowledge of factors that
change the muscle glycogen to water ratio, or muscle water content, formed the basis of our
recent letter expressing concerns around the MuscleSound® technology [11], wherein we
noted that these can change in variable directions as a result of diet-exercise manipulations.
The literature on this issue will now be summarised.
Studies on the relationship between tissue water and glycogen content were under-
taken in both the liver and muscle in humans and rodents. In the latter case, direct chemical
analysis of whole tissues was used to calculate a glycogen:water ratio of 1:2.7 in rat livers
under conditions where non-glycogen solids remained constant [6]. However, Sherman
et al. [37] failed to find a consistent ratio of glycogen and water in rat skeletal muscle
when manipulations to both increase and decrease glycogen content were undertaken.
Meanwhile, studies on human subjects are limited to protocols using indirect or sampling
measurements. An early investigation of carbohydrate loading [38] measured muscle
glycogen concentrations in arm and leg biopsy samples, while using changes in body mass,
body water derived from a tritium dilution, and muscle mass derived from potassium
measurements to estimate a glycogen to water ratio ranging from 1:3 to 1:5. Caveats noted
by the authors included the uncertainties of the measurements and the inability to measure
the site of the water storage [38]. An updated version of this study, using bio-electric
impedance (BIS) to measure body water and MRS to measure muscle glycogen, calculated
an increase in intra-cellular water that aligned with a 1:4 ratio [39]. Despite modern tech-
niques, issues related to the precision of measurement and the nature of the increase in
body water remain. Furthermore, these studies have involved conditions in which fluid
availability was optimised while muscle glycogen stores were manipulated.
Various scenarios can occur in which tissue water changes independently of changes
in glycogen stores. Indeed, ultrasound technology was proposed as a technique to monitor
tissue hydration in athletes [40], particularly as a marker of dehydration in athletes in
weight-making sports [41]. Early understandings of muscle glycogen synthesis theorised
that the associated water storage might play a regulatory role in this process. However,
a study of post-exercise muscle restoration over a 15 h period found that cyclists who
were dehydrated by ~5% BM or 8% body water had similar glycogen synthesis, but lower
muscle water content than the trial in which they were euhydrated during recovery [42].
Meanwhile, Fernandez-Elias et al. investigated changes in the glycogen and water content
of muscle samples collected over 4 h of recovery from strenuous exercise, reporting a ratio
of 1:3 when the subjects were dehydrated (replacing only 400 mL fluid) and 1:17 when a
volume equal to the total fluid deficit (~3170 mL) was consumed [43]. It was noted that
these calculations included all water in the muscle rather than that bound to the glycogen.
Other muscle solutes, including elements that can be acutely changed, contribute to its
osmotic environment. It is well documented that rapid creatine supplementation protocols
are associated with an increase (~1 kg) in body mass that is largely attributed to a gain in
body water [44–46]. Results from the larger study from which the Bone MuscleSound® data
were collected included a 6% increase in muscle creatine concentrations and a 22% increase
in muscle glycogen when their respective loading protocols were undertaken according to
best practice principles [29]. The corresponding changes in total body water and intracel-You can also read