Groundwater chemistry affected by trace elements (As, Mo, Ni, U and V) from a burning alum shale waste deposit, Kvarntorp, Sweden
←
→
Page content transcription
If your browser does not render page correctly, please read the page content below
Environmental Science and Pollution Research
https://doi.org/10.1007/s11356-021-12784-2

    RESEARCH ARTICLE

Groundwater chemistry affected by trace elements (As, Mo, Ni, U
and V) from a burning alum shale waste deposit, Kvarntorp, Sweden
Kristina Åhlgren 1       &   Viktor Sjöberg 1 & Bert Allard 1 & Mattias Bäckström 1

Received: 1 September 2020 / Accepted: 29 January 2021
# The Author(s) 2021

Abstract
Worldwide, black shales and shale waste are known to be a potential source of metals to the environment. This project
demonstrates ongoing weathering and evaluates leaching processes at a 100-m-high shale waste deposit closed in the 1960s.
Some deep parts of the deposit are still burning with temperatures exceeding 500 °C. To demonstrate ongoing weathering and
leaching, analyses of groundwater and solid samples of shale and shale waste have been undertaken. Largest impact on ground-
water quality was observed downstream the deposit, where elevated temperatures also indicate a direct impact from the burning
waste deposit. Groundwater quality is largely controlled by pH and redox conditions (e.g., for arsenic, nickel, molybdenum,
uranium and vanadium), and the mixture of different waste materials, including pyrite (acidic leachates) and carbonates (neu-
tralizing and buffering pH). Analyses of shale waste from the deposit confirm the expected pyrite weathering with high concen-
trations of iron, nickel and uranium in the leachates. No general time trends could be distinguished for the groundwater quality
from the monitoring in 2004–2019. This study has shown that black shale waste deposits can have a complex long-term impact
on the surrounding environment.

Keywords Black shale . Groundwater chemistry . Trace elements

Introduction                                                          USA and China (e.g., Loukola-Ruskeeniemi et al. 1998;
                                                                      Puura 1998; Puura et al. 1999; Woo et al. 2002; Peng et al.
Black shale is the denomination of a heterogeneous group of           2004; Burkhardt et al. 2009; Grawunder et al. 2009; Jüriado
dark-coloured sedimentary rocks containing organic matter             et al. 2012; Paikaray 2012; Peng et al. 2014; Schovsbo et al.
(Vine and Tourtelot 1969) which to various extents are                2014; Phan et al. 2015; Liu et al. 2017; Lerat et al. 2018;
enriched in sulfides and metals. Ketris and Yudovich (2009)           Parviainen and Loukola-Ruskeeniemi 2019; Stuckman et al.
have made estimates of median concentrations based on re-             2020; Waersted et al. 2020).
ported data in black shales globally, e.g., 30 mg/kg for arsenic,        The black shales in Sweden (denoted alum shales) are
20 mg/kg for molybdenum, 70 mg/kg for nickel, 8.5 mg/kg               mainly composed of muscovite-illite, quartz and feldspar with
for uranium and 205 mg/kg for vanadium. Weathering and                up to 15% pyrite and up to 20% organic material (kerogen).
leaching of shale residues on mining sites and from shale             The shales are enriched in trace elements such as molybde-
waste dumps lead to release of elements resulting in local            num, nickel, uranium and vanadium (Armands 1972;
and regional environmental impacts. This is reported from             Andersson et al. 1985). Mining of alum shale from the 18th
numerous sites worldwide, e.g., in Denmark, Norway,                   to the 20th centuries has led to dispersion of elements from
Finland, Estonia and Germany in Europe and also from the              weathering of shale residues, still in progress, notably at
                                                                      Degerhamn, Ranstad and Kvarntorp (e.g., Allard et al. 1991,
Responsible Editor: Xianliang Yi                                      2011; Falk et al. 2006; Kalinowski et al. 2006; Lavergren
                                                                      2008; Lavergren et al. 2009; Åhlgren et al. 2020).
* Kristina Åhlgren                                                       In Kvarntorp, 200 km south-west of Stockholm, Sweden,
  kristina.ahlgren@oru.se                                             alum shale was mined in open pits and processed for oil pro-
                                                                      duction during 1942–1966. Most of the shale residues from
1
     Man Technology Environment Research Centre, Örebro University,   the mining period (unprocessed fine-grained shale denoted
     SE-701 82 Örebro, Sweden                                         fines, semi-combusted shale denoted semi-coke and fully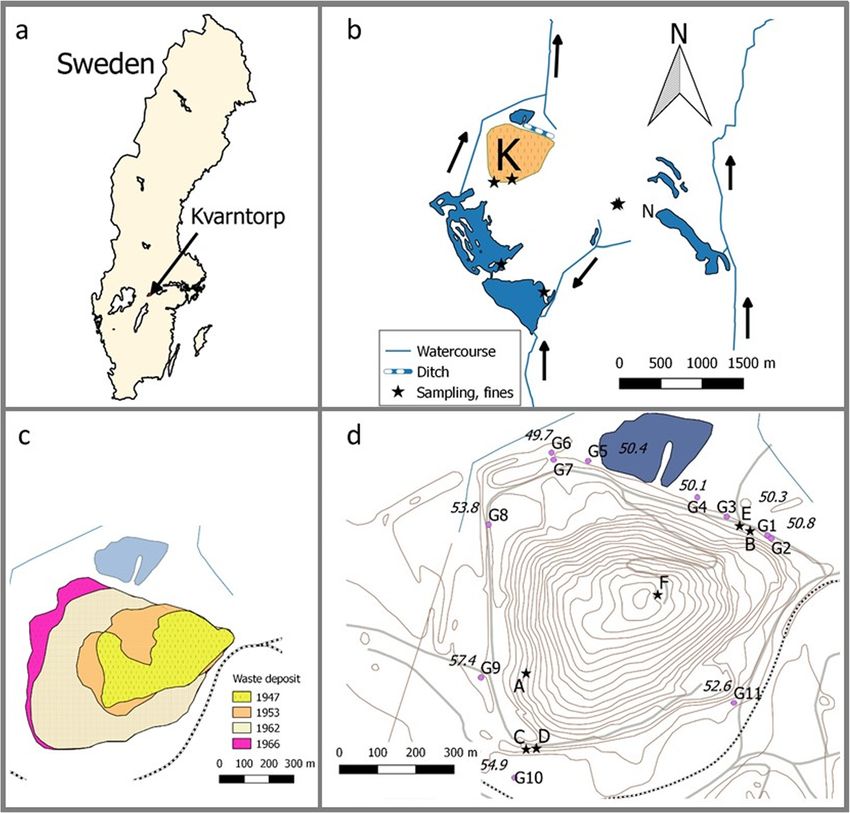
Environ Sci Pollut Res

burned shale denoted shale ash, as well as minor amounts of          deposit (Kvarntorpshögen), pit lakes and watercourses leading
limestone) were deposited on site, either backfilling of open        in to and out from the area (Fig. 1b).
pits, or on a single deposit, denoted Kvarntorpshögen (the               The crystalline basement in the area is superimposed by
Kvarntorp waste deposit). The deposit is presently 100 m high        lower Cambrian Mickwitzia sandstone followed by Lingulid
and covers an area of 450,000 m2. It is estimated that the           sandstone beneath layers of phosphorite and glauconite sand-
deposit contains 3 Mtonnes of fines, 2 Mtonnes of semi-              stone. Higher up in the strata, green shale (mudstone) is
coke and 23 Mtonnes of shale ash, as well as limestone in            followed by late Cambrian alum shale and Ordovician lime-
some parts (Bäckström 2010). The deposit was closed in               stone covered by till on top (Bengtson 1971; Nielsen and
1966, but temperatures are still elevated, caused by pyrite          Schovsbo 2007, 2015). The uppermost and youngest layers
oxidation in the fines (temperatures up to 100 °C), as well as       have been eroded and are not represented all the way to the
kerogen oxidation (temperatures above 500 °C).                       northern limit of the sedimentary outlier since the bedrock is
   It is of general interest to monitor the release of leachates     tilted towards the south (Hessland and Armands 1978).
from shale residues, particularly from well-defined deposits,            A marshy meadow in a small valley in the northern part of
for several reasons: (1) assessment of present and future envi-      the area contains no alum shale. The top layer of the bedrock is
ronmental impact and health risks associated with spreading          a 5- to 6-m-thick layer of the green shale above the sandstone
of elements from the deposit and (2) enhanced understanding          layers, covered by 4–5 m of till. This area became the location
of relevant processes—weathering and leaching in situ, ele-          for the shale waste deposit (Kvarntorpshögen) in 1942. The
ment mobilization and transport, element accumulation in soil        green shale constitutes an almost impermeable layer under the
and sediments.                                                       deposit that largely prevents water exchange between the de-
   The Kvarntorp site is of interest for extended studies of metal   posit and the sandstone aquifer (Holm et al. 2005). Fig. 1c
releases from alum shale in situ for several reasons: (1) the alum   shows the evolution of the deposit during 1947–1966. The
shale in Kvarntorp generally contains higher trace element con-      exact locations in the deposit and the quantities of the various
centrations than the global median levels except for arsenic         shale residues (fines, semi-coke and shale ash) are not known
which is quite similar and nickel with large variations in con-      since the records about the waste are sparse or non-existing.
centration (cf. Allard et al. 2011). (2) There is a continuously         The locations of groundwater wells G1–G11 around the
progressing weathering of shale in the deposit. Oxidation of         deposit are given in Fig. 1d. These wells were installed in
pyrite and other metal sulfides leads to releases of metals by       1997 (G11), 2003 (G4 and G5) and 2004 (G1–G3 and G6–
run-off and into the local groundwater aquifers. This has been       G10).
going on for more than 50 years. (3) The deposit is still burning
which means that large parts of the deposit are dry. Increased
leaching of metals from the area is expected after cooling of the    Material and methods
deposit and water exposure to parts that presently are dry. (4) It
may be possible to assess the reactivity and leachability in situ    Shale sampling
of different shale fractions—fines, semi-coke and shale ash. (5)
No remediation activities have been undertaken to control and        Solid samples, two shale ashes (A and B) and fines (C), were
reduce metal releases from the deposit since the end of mining       collected from the waste deposit (Åhlgren et al. 2018) (see
54 years ago. Element immobilization due to sorption and sec-        Fig. 1d for locations) and from an outcrop at an open pit
ondary mineral formations are important factors that can be          (five samples of alum shale and two samples of limestone;
demonstrated, and internal drainage mixing processes can be          location N in Fig. 1b). An additional six samples of fines from
assessed (cf. Vriens et al. 2019).                                   the deposit were also analysed (see Fig. 1d for location) as
   The objective of the present project is to demonstrate the        well as three alum shale samples from old exploration drill
ongoing weathering and leaching processes in the Kvarntorp           cores kept by the Swedish Geological Survey.
alum shale waste deposit and the resulting impact on the local
and regional groundwater quality. Present and long-term im-          Groundwater sampling
pacts on groundwater chemistry are assessed largely based on
groundwater quality monitoring in the vicinity of the deposit        Two aquifers make up the groundwater in the area—a shallow
starting in 2004.                                                    aquifer in the till underneath and around the deposit with a
                                                                     dominant flow direction from south to north, as indicated by
                                                                     the water levels (Fig. 1d), and a lower aquifer in the sandstone
Description of the area                                              layer (Bengtson 1971). Most of the groundwater wells (G1,
                                                                     G3–G6 and G8–G11) are shallow and installed in the upper
The location of Kvarntorp in Sweden is shown in Fig. 1a, as          aquifer, in the till layer and in the shale waste, while two wells
well as a map showing the mining area with the shale waste           (G2 and G7) are installed in the lower sandstone aquifer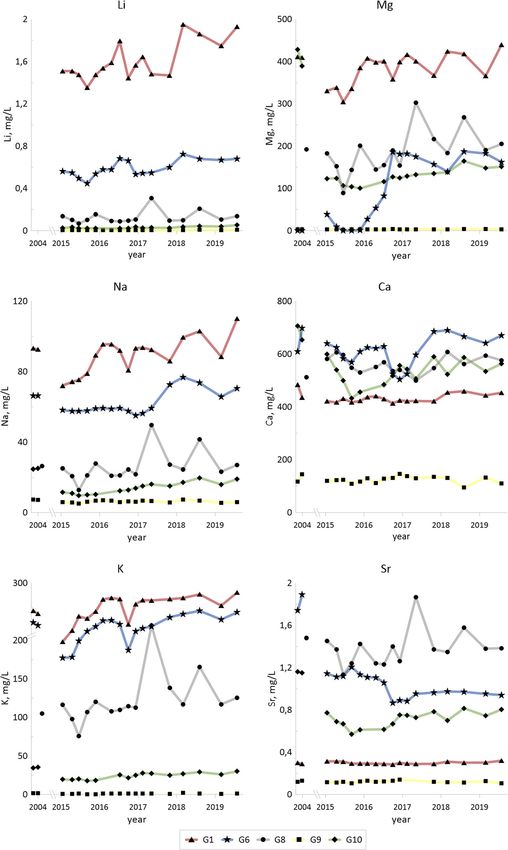
Environ Sci Pollut Res

Fig. 1 a Map showing the
location of Kvarntorp. b Map
showing the Kvarntorp area with
the waste deposit
Kvarntorpshögen (K) and the pit
lake Norrtorpssjön (N), location
for sampling of shale and lime-
stone. c Extent of the waste de-
posit from 1947 to 1966, when
operations ended. Final size: 100
m high, covers an area of 450,000
m2, contains some 3 Mtonnes of
fines, 2 Mtonnes of semi-coke
and 23 Mtonnes of shale ash. d
Location of groundwater wells
G1–G11 around the deposit and
locations for sampling of solid
samples (A, B = shale ash; C, D =
fines (D used in humidity cells,
Sartz et al. in prep), E = shale ash
(red ash used in humidity cells)
and F = shale ash (black ash used
in humidity cells)). Average
levels for groundwater depths in
the wells (metres above sea level)
are given. (Maps are processed
with the software QGIS Desktop
2.14.13, with data from
Lantmäteriet (Swedish Land
Survey) as a basis)

(Holm et al. 2005). G2 and G7 were installed using rotational     process water outlets in the area but is also receiving surface
drilling, and the contact between the alum shale aquifer and      run-off from the deposit. Water quality in the surface waters
the sandstone aquifer was sealed with cement. Description of      close to the deposit and in the pit lakes (Fig. 1b) is monitored
the wells is given in Table 1. Filter sections were generally 1   regularly, as described in Åhlgren et al. (2020) and in Åhlgren
m long, and washed sand (grain size 0.6–1 mm) was added           and Bäckström (in preparation). The present field program
around the sections. Bentonite was added around the top sec-      reported here was, however, largely focusing on assessing
tion in order to prevent infiltration of surface water.           the direct impact of leachates from the deposit on the local
   Bailer samplers were used for sampling of water, regularly     groundwater aquifers, and the impact on surface water quality
since December 2015 in all of the wells, G1–G11 (six times        is outside the present scope.
annually from 2015 until October 2017 and then three times
annually until 2019), totally 176 groundwater samples.            Analysis of solid samples
Groundwater levels were measured, and the wells were emptied
the day prior to sampling. Sterile polypropylene tubes were       All solid samples were sent to MS Analytical (Vancouver) for
used for storing the samples at 5–6 °C until analysis.            total element quantification. Samples were fused with borate
Groundwater temperature was measured in 2017.                     flux in a muffle furnace before the resulting beads were dis-
Additionally, temperature data for G1–G10 from previous stud-     solved in dilute mineral acid. Inductively Coupled Plasma
ies in 2004 and 2005 were also available (Holm et al. 2005).      Optical Emission Spectrometry (ICP-OES) was then used
   Two surface watercourses pass through the area, of which       for the analysis of major elements (Al, Ca, Fe, K, Mg, Mn
the westerly one is close to the groundwater wells north and      and Na; for detection limits see Table 2). Samples were also
north-east of the deposit and may receive run-off water from      digested in aqua regia or in a four-acid mixture and analysed
the deposit (Fig. 1b). A serpentine pond system north of the      for trace elements (As, Cd, Co, Cu, Mo, Ni, Pb, U and V) by
deposit was constructed in the 1940s, mainly in order to re-      ICP-MS. Total sulfur and carbon were quantified by a Leco
move organic compounds such as phenols from the industrial        carbon and sulfur analyser (for detection limits see Table 2).
Environ Sci Pollut Res

Table 1 Description of installed
groundwater wells around the        Well         Depth of well (m)      Pipe          Soil around the filter section   Soil layer above      Aquifer
waste deposit (Blomquist and                                                                                           the filter section
Ekholm 1997; Holm et al. 2005)
                                    G1           6                      HDPE          Clay, sand                       Shale waste           Upper
                                    G2           31                     Steel         Sandstone                        Sandstone             Lower
                                    G3           3                      HDPE          Shale waste                      Shale waste           Upper
                                    G4           3–4.5a                 HDPEb         Shale waste                      Shale waste           Upper
                                    G5           3–4.5a                 HDPEb         Sand                             Mud, peat             Upper
                                    G6           4.5                    HDPE          Till                             Shale waste           Upper
                                    G7           31                     Steel         Sandstone                        Sandstone             Lower
                                    G8           5                      HDPE          Oil sludge                       Siltc                 Upper
                                    G9           4.6                    Steel         Till                             Till                  Upper
                                    G10          5                      Steel         Till                             Till                  Upper
                                    G11          6                      Plasticb      Shale waste                      Shale waste           Upper

                                    Upper refers to the upper aquifer in either natural till or shale waste; lower refers to the lower aquifer in the
                                    sandstone layers.
                                    a
                                        Estimated depth
                                    b
                                        With steel casing
                                    c
                                        Strong smell of oil

   Quantitative phase analysis by X-ray diffractometry (XRD)                   diffraction data were collected over a range 3–80°2θ with
was made on the shale samples A, B and C from the waste                        CoKα radiation on a Bruker D8 Advance Bragg–Brentano
deposit (Åhlgren et al. 2018). Grinding under ethanol in a                     diffractometer equipped with an Fe monochromator foil,
vibratory McCrone Micronizing Mill during 10 minutes re-                       0.6-mm (0.3°) divergence slit, incident- and diffracted-beam
duced the sample size to < 10 μm. Step-scan X-ray powder-                      Soller slits and a LynxEye-XE detector. The long fine-focus
                                                                               Co X-ray tube was operated at 35 kV and 40 mA, with a take-
                                                                               off angle of 6°. The X-ray diffractograms were analysed using
Table 2 Quantification limits for analysis of solid samples by Leca            the International Centre for Diffraction Database PDF-4 and
carbon and sulfur analyser (SPM) and by ICP-MS and ICP-OES (WRA
and IMS)                                                                       Search-Match software by Bruker. The diffraction data were
                                                                               refined with Rietveld program Topas 4.2 (Bruker AXS).
Method             Element         Quantification limit         Unit

SPM-511            C               100                          mg/kg          Analysis of water samples
WRA-310            Na2O            70                           mg/kg
WRA-310            MgO             60                           mg/kg          Electrical conductivity (Radiometer CDC836T-6, with tem-
SPM-522            S               100                          mg/kg          perature compensation), pH (Metrohm 6.0257.000 with tem-
WRA-310            Al2O3           50                           mg/kg          perature compensation), redox potential (during a few sam-
WRA-310            K2O             80                           mg/kg          pling occasions in 2017; Thermo Scientific REDOX/ORP
WRA-310            CaO             70                           mg/kg          9678BNWP) and alkalinity were measured in the lab within
IMS-300            V               10                           mg/kg          12 hours after sampling. Elements were quantified after filtra-
WRA-310            MnO             80                           mg/kg          tion (0.20-μm polypropylene) and acidification (1 % nitric
WRA-310            Fe2O3           70                           mg/kg          acid), by Inductively Coupled Plasma Mass Spectrometry
IMS-130            Co              0.1                          mg/kg          (ICP-MS, Agilent 7500cx. Elements and detection limits are
IMS-130            Ni              0.2                          mg/kg          given in Table 3. Inorganic anions (chloride and sulfate) were
IMS-130            Cu              0.2                          mg/kg          quantified by capillary electrophoresis (2015–2017) using so-
IMS-130            Zn              1                            mg/kg          dium chromate buffer (50 mM) containing TTAB (5 mM) and
IMS-130            As              0.1                          mg/kg          a 40 cm ∗ 50 μm silica capillary (from 2015 to 2017) or by ion
IMS-300            Sr              0.1                          mg/kg          chromatography, SS-EN ISO 10304-1:2009 (2018, 2019).
IMS-130            Mo              0.05                         mg/kg             Ferrous iron (Fe(II)) was analysed in 2017 using photom-
IMS-300            Ba              0.5                          mg/kg          etry and the blue complex of Fe(II) and TPTZ (2,4,6-tri(2′-
IMS-300            U               0.05                         mg/kg          pyridyl)-1,3,5-triazin). A Hewlett Packard 8453 was used, and
                                                                               the absorbance at 595 nm was recorded. To 4 mL of sample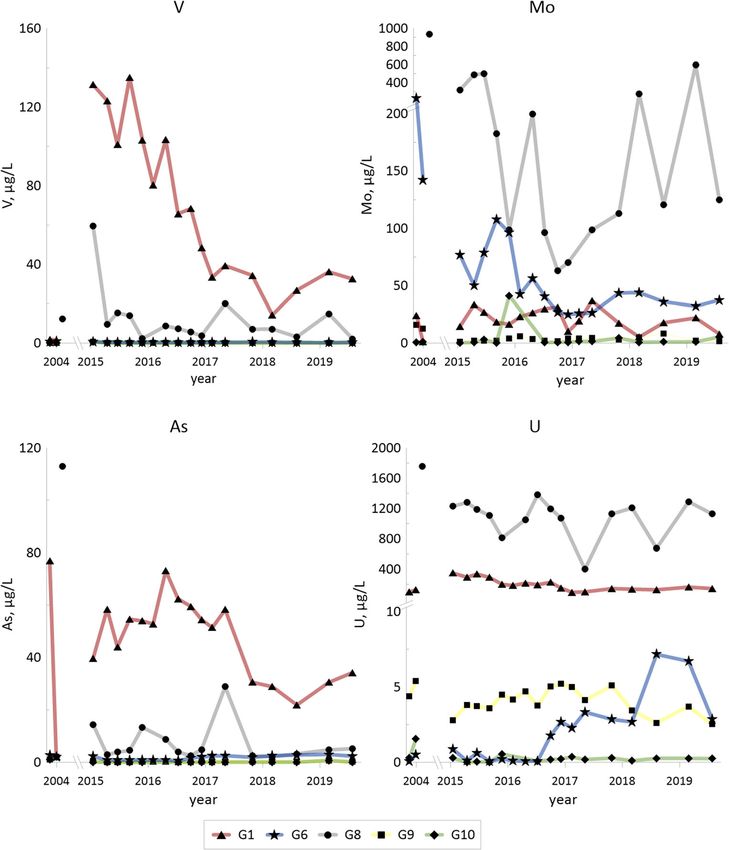
Environ Sci Pollut Res

Table 3 Detection limits and used isotopes during ICP-MS analysis of    Results
the water samples

Isotope                  Element               Detection limit (μg/L)   Composition of the shale
7                        Li                    0.013                    The mineralogic composition of the shale ash samples A and
23                       Na                    0.792                    B and of the fine sample C, representing unprocessed shale, is
24                       Mg                    0.004                    given in Table 4 (crystalline phases, neglecting the organic
27                       Al                    0.043                    fraction). Major mineral components in the fines are the sili-
39                       K                     1.734                    cates (quartz, feldspars and clay minerals), totally some 73%
43                       Ca                    0.428                    of the inorganic mass. The transformation of iron in the pyrite
51                       V                     0.001                    and marcasite in the fines into goethite, hematite and jarosite
55                       Mn                    0.005                    in the shale ash as a result of the pyrolysis is evident.
56                       Fe                    0.530                        Element concentrations in fines and shale ashes from the
59                       Co                    0.001                    deposit and in shale and limestone from the exposed outcrop
60                       Ni                    0.010                    (N, Fig. 1b) and from the exploration drill core are given in
63                       Cu                    0.001                    Table 5. The differences between the two shale ashes are
66                       Zn                    0.051                    significant (S, Fe and Ca among the major components) as
75                       As                    0.012                    well as the differences between the four shale samples (two
88                       Sr                    0.001                    fines and two alum shales; the same elements). However,
95                       Mo                    0.001                    concentrations in the shale vary in general between different
238                      U                     0.001                    layers (Andersson et al. 1985). Also, weathering and leaching
                                                                        of shale that is exposed in outcrops would lead to redistribu-
                                                                        tion of elements and changes in composition (Chi Fru et al.
                                                                        2016). Thus, the observed variations between the shale sam-
was added 0.25-mL HCl (6 M), followed by the addition of                ples may reflect different locations, as well as differences in
0.5-mL NH4F (2 M), 0.5-mL TPTZ (2.4 mM) and finally                     weathering state.
1-mL buffer solution (NH4Ac (2 M)/HAc (2 M)). The sample                    It is clear from the total concentrations in drill cores and
was shaken vigorously between each addition. The mix was                shale ashes that processing of the shale varied and was incom-
left for 10 minutes prior to measurement. Calibration was               plete in some cases. Concentrations of sulfur are for instance
performed by analysis of standards containing Fe(II)(NH4)2-             still quite high in shale ash A compared to shale ash B
sulfate, prepared to cover a ferrous iron concentration range of        (Table 5). Sulfur is expected to be lost as SO2 during the
0.1–11 mg/L.                                                            pyrolysis process. Some trace elements could also be expected
   Chemical speciation calculations were performed on the
measured concentrations in all groundwaters, using the
geochemical code PHREEQC Interactive (version
                                                                        Table 4 Mineral composition of shale ash and fines representing the
3.4.0.12927; Parkhurst and Appelo 1999) with the                        relative concentrations of crystallized phases normalized to 100%
MINTEQ.v4 database. Saturation indices (SI is the loga-                 (including data from Åhlgren et al. 2018)
rithm of the ratio between the ion activity product and the
                                                                        Mineral                 Shale ash          Shale ash         Fines
solubility constant) were also obtained from the geochemical                                    A                  B                 C
calculations.
   Principal component analysis (PCA) was performed on all              Goethite                5.9                8.9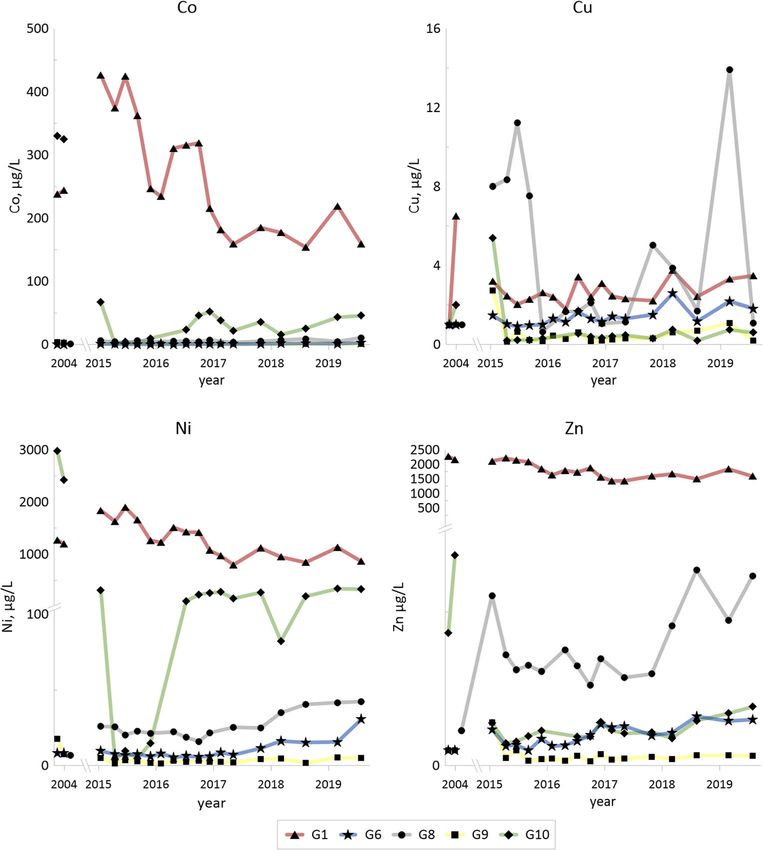
Environ Sci Pollut Res

Table 5 Chemical composition
of the solid samples from the     Conc. (mg/kg)        Shale ash     Shale ash       Fines     Fines     Alum shale    Alum shale       Limestone
waste deposit                                          A             B               C         (n = 7)   (n = 5)       Drill cores      (n = 2)
                                                                                                                       (n = 3)

                                  S                    32,300        5400            78,900    42,500    27,500        56,500           13,300
                                  Al                   71,500        83,100          61,900    57,200    49,000        56,700           16,900
                                  Mn                   232           465             232       155       103           207              736
                                  Fe                   83,200        101,000         55,900    35,700    31,000        48,100           15,300
                                  Li                                                                     16.4a
                                  Na                   816           1410            2670      1780      2570          1100             1300
                                  K                    33,600        37,800          25,900    30,900    32,100        29,800           6470
                                  Mg                   3260          4040            4460      3900      3800          5200             3920
                                  Ca                   29,200        6720            23,500    16,700    4100          9200             323,000
                                  Sr                   127           144             85.9      80        84            73.6             184
                                  Cd                   0.59          0.70            6.4       1.3       0.36          1.14             0.04
                                  Co                   7.30          6.70            26.1      7.5       2.9           23.3             6.35
                                  Ni                   51.1          41.6            178       49        26.6          121              8.05
                                  Cu                   100           70.2            262       74        40.4          137              11.8
                                  Zn                   30.0          33.0            250       78        29.6          63               12
                                  V                    661           753             423       499       478           562              20
                                  As                   113           155             79.9      54        38.3          65.7             10.6
                                  Mo                   213           160             133       136       170           163              1.6
                                  U                    200           162             240       84        82            145              0.71

                                  Fines, shale ash (marked C, A and B on the map in Fig. 1d), shale and limestone from the outcrop at the pit lake
                                  Norrtorpssjön (location marked N on the map in Fig. 1b) and alum shale exploration drill cores from Norrtorp.
                                  a
                                      Average of 3, from Allard et al. 2011

to be lost during the process, for instance, zinc that has a low              and G 10) in Fig. 2, which illustrates the variation of concen-
boiling point (907 °C) and therefore could be volatilized dur-                trations with time during the period 2004–2019.
ing pyrolysis (Saqib and Bäckström 2014). Concentrations of                       All measurements during the period for all 11 wells G1–
zinc are lower in the ashes compared both to fines and drill                  G11 are summarized in Table 6: median and min–max values
core shale but on the same level as in the weathered shale from               for the sampling period 2015–2019, as well as median values
the pit site (Table 5).                                                       from 2004 (Holm et al. 2005).
                                                                                  Variations in water chemistry between the groundwater
Groundwater chemistry                                                         wells are substantial, e.g., with pH ranging from 3.7 to 12 (from
                                                                              3.2 to 12.2 in 2004), total carbonate from 0 to 900 mg/L and
Shale residues have been deposited on the same site since the                 sulfate from 36 to 4400 mg/L during the sampling period. G1
early 1940s (see Fig. 1c). Surface waters, as well as local shal-             has the lowest pH and is evidently highly affected by shale
low groundwaters, must have been contaminated by shale                        leachates with high concentrations of sulfate and iron, as well
leachates already since that time. There was, however, no reg-                as trace elements (see below) throughout the entire time period.
ular monitoring of surface water or groundwater quality in the                    Redox conditions for the groundwaters indicate two groups:
area until 1993, when monitoring started in the small stream                  G2, G6 and G8 (average ferrous iron concentration 0.2 mg/L
north of the deposit, and not until 2003–2004 in groundwaters                 and average redox potential 320 mV) and G1, G3, G4, G5, G7,
in the vicinity of the deposit (from wells G1–G10).                           G9, G10 and G11 (average ferrous iron concentration 8.6 mg/L
                                                                              and average redox potential 190 mV). The larger group is
Major components                                                              somewhat more reducing as indicated by both the redox poten-
                                                                              tial and the dissolved ferrous iron concentrations.
Concentrations of major components (cations: Na, K, Mg, Ca,                       From Table 6, and considering the depth and positions of
Al, Mn and Fe; also Li and Sr; anions: HCO3− and SO42−; pH)                   the wells and the various layers around and below the wells
from 2004 (Holm et al. 2005) and from 2015–2019, are given                    (Table 1), it can be assumed that G2 and G7 may represent
for selected groundwaters of different types (G1, G6, G8, G9                  deep groundwater from the sandstone layer while G9 and G10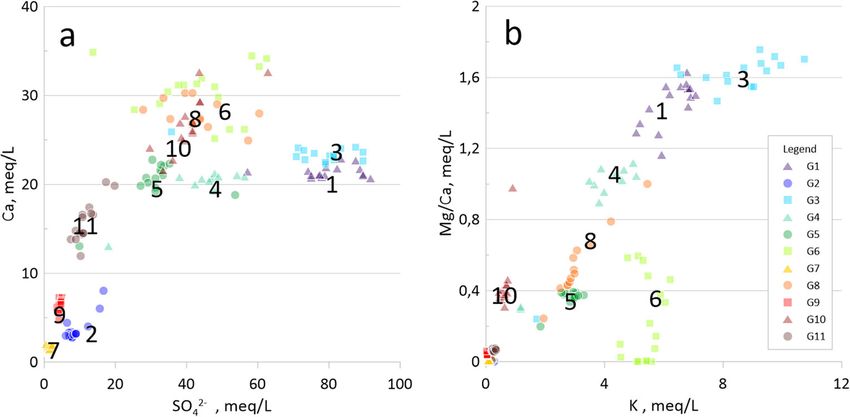
Environ Sci Pollut Res

Fig. 2 Temporal changes for pH, concentrations of hydrolysable elements (Al, Mn and Fe) and major anions (HCO3 and SO4) in selected groundwater
samples for 2004 (according to Holm et al. 2005) and for 2015–2019. Alkali metals (Li, Na and K) and alkaline earth metals (Mg, Ca and Sr)

may represent shallow groundwater from the till surrounding              covered by undisturbed quaternary deposits (till). It is there-
the deposit. No alum shale waste was deposited nearby the G9             fore assumed that G9 may represent local background condi-
site, and the ground does not seem to be reworked since it is            tions. Water from G10, however, also from the till horizon,
Environ Sci Pollut Res

Fig. 2 (continued)
Table 6 Concentrations of major components (mg/L) and pH in G1–G11 water: for each element, the first row represents median value 2015–2019, second row represents min and max values 2015–2019
and third row represents median values 2004
                                                                                                                                                                                                  Environ Sci Pollut Res

          G1              G2              G3            G4               G5                 G6               G7                G8               G9               G10             G11
          (n = 17)        (n = 17)        (n = 17)      (n = 11)         (n = 16)           (n = 17)         (n = 17)          (n = 15)         (n = 17)         (n = 15)        (n = 17)
           (2015–
          2019)

Na        91.9            131             110           71.2             71.9               59.0             11.4              24.5             6.19             13.9            13.2
          72.1; 110       116; 211        86.9; 133     60.6; 80.3       65.9; 77.8         55.2; 76.8       10.7; 18.0        12.7; 49.7       4.98; 7.43       9.64; 19.8      11.4; 20.4
          92.9            133             32.9          32.1             45.3               66.4             17.7              26.4             7.32             24.8            –
K         265             7.08            340           172              118                211              3.65              116              1.07             25.0            10.3
          198; 281        5.05; 7.88      252; 420      136; 198         99; 129            177; 243         2.27; 5.01        75.7; 213        0.09; 2.02       17.7; 30.0      8.49; 12.9
          240             10.7            62.3          45.9             72.4               216              8.87              105              1.61             35.0            –
Mg        398             0.28            456           260              96.2               139              0.14              183              3.13             127             12.7
          305; 440        0.20; 6.9       337; 506      222; 280         83.7;107           0.11; 187        0.095; 0.25       88.6; 303        2.50; 3.57       100; 164        10.1; 18.2
          410             0.09            61.4          48.3             33.2               0.09             0.52              192              3.02             409             –
Ca        425             64.1            465           414              416                624              31.5              561              128              534             321
          414; 459        55.7; 161       447; 484      376; 425         373; 456           503; 690         22.2; 38.7        499; 607         94.4; 146        433; 599        239; 406
          460             88.9            537           262              287                654              39.6              511              131              680             –
Al        29.7            0.0083          2.28          0.0112           0.0129             0.0027           0.00198           0.00412          0.0017           0.0018          0.008
          16.9; 69.1      0.0025;0.071    0.50; 5.45    0.00386; 3.096   0.00698; 0.0256    0.00113; 0.039   0.0013; 0.0585    0.00145; 0.134   0.0012; 0.181    0.001; 0.0410   0.00185; 0.203
          18.7            0.17            1.87          0.017            0.00268            0.0058           0.138             0.0138           0.002            0.0142          –
Mn        20.4            0.0067          13.9          9.3              4.2                0.064            0.198             1.21             0.709            3.67            1.91
          18.6; 22.1      0.0003; 0.45    10.3; 16.1    7.28; 9.93       3.32; 4.49         0.00017;0.38     0.13; 0.365       0.199; 1.78      0.43; 1.04       2.83; 5.96      0.984; 3.77
          24.2            0.0004          5.18          3.75             1.87               0.0028           0.0012            0.71             0.765            4.87            –
Fe        326             0.0267          107           95               13.3               0.047            1.36              0.239            1.275            141             3.31
          252; 379        0.0024; 3.3     63; 167       19.8; 157        2.5; 17.3          0.0021; 0.468    0.0026; 3.49      0.018; 1.37      0.0074; 19.1     87.9; 202       0.192; 13.7
          384             0.0272          13.7          0.58             0.11               0.04             0.049             0.0066           0.118            219             –
Cl−       38              42.6            54.0          42               12                 19               12.9              11               6.4              7.65            22
          29; 93          32.0; 49.1      24.6; 90.2    39; 60           11; 29             16; 63           9.50; 15.0        10; 60           5.8; 10.6        7.5; 9.0        17; 26
          –               –               –             –                –                  –                –                 –                –                –               –
SO42−     3785            382             3822          2280             1500               2300             68.0              2000             200              1900            518
          2746; 4400      287; 800        3400; 4300    1829; 2700       1300; 2577         1215; 3000       35.7; 110         1336; 2900       171; 240         1427; 2100      358; 950
                          308                                                               656
          4260                            1720          869              476                                 23.0              –                196              3020            –
HCO3−     0               31              127           180              472                133              31.3              518              185              275             394
          0               13.2; 78.1      0; 195        108; 318         416; 600           67.9; 897        9.5; 45.7         178; 681         147; 462         7.32; 506       221; 548
          0               170             0             74               695                1400             210               –                225              465             –
pH        3.97            8.77            6.1           6.63             6.06               9.13             6.81              7.01             7.07             6.67            6.65
          3.66; 4.44      6.89; 10.0      5.82; 6.42    6.49; 6.81       5.90; 6.26         8.31; 12.0       6.47; 7.88        6.72;7.27        6.74; 7.38       5.24; 6.90      6.21; 6.88
          3.48            10.70           3.82          6.55             6.50               10.3             10.40             –                7.39             6.45            –
Environ Sci Pollut Res
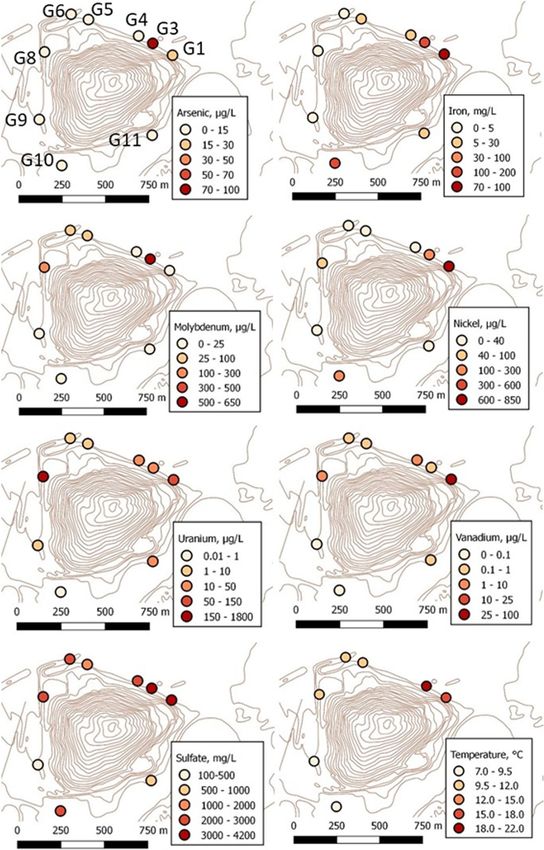
appears to be affected by shale leachates as indicated by illustrated in Fig. 4, with concentration levels from October
higher levels of major components (sulfate, potassium and 2018. Highest levels (median values, 2015–2019) in groundwa-
magnesium in particular) and trace metals (Sr, Li, Co and ters G1–G11 are obtained in G1 (with the lowest pH in the series)
Ni) and with slightly lower pH. for Cd, Co, Ni, Zn and V, and the highest levels for Cu, Li, As
and Mo are obtained in G3. Levels from the measurements in
Trace elements 2018 largely confirm this general trend (Fig. 3). The highest
uranium levels are obtained in G8, in 2004, 2015–2019 and
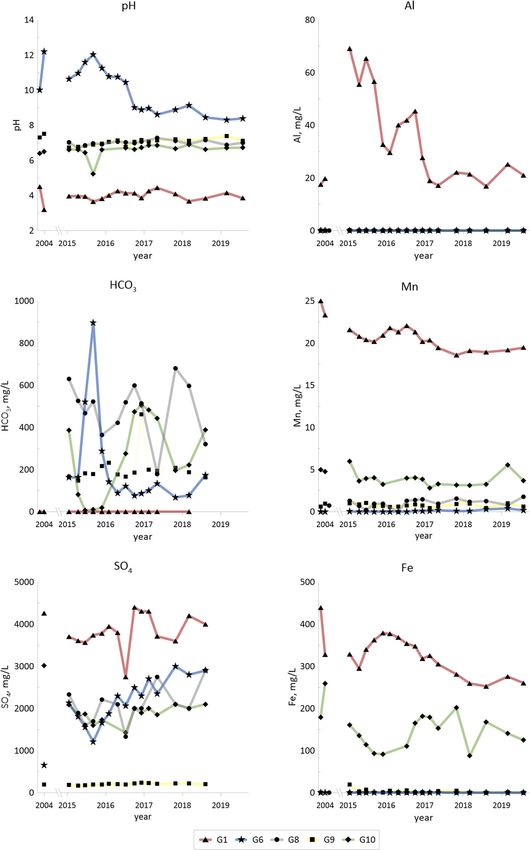
Concentrations of some of the trace elements (Co, Ni, Cu, Zn, 2018. The differences in temperatures indicate that the deposit
V, As, Mo and U; also Li and Sr in Fig. 2) from 2004 and from is hot, primarily in the north-eastern part (G1 and G3) and to
2015–2019 are given for the selected groundwaters (G1, G6, some extent also in the north-western part (G5, G6 and G8).
G8, G9 and G10) in Fig. 3.
Concentrations of the trace elements are summarized in Groundwater classification
Table 7 (as in Table 6): median and min–max values for the
sampling period 2015–2019, as well as median values from Chemistry profiles
2004.
The large variation of concentrations between wells G1 and Analysis of the chemistry of groundwaters G1–G11 (pH,
G11 for some of the trace elements and sulfate is further major components and trace elements, Figs. 2 and 3 and
Fig. 3 Temporal changes for hydrolysable trace metals (Co, Cu, Ni and Zn) in selected groundwater samples for 2004 (according to Holm et al. 2005)
and for 2015–2019. Redox sensitive trace elements (V, As, Mo and U)Environ Sci Pollut Res Fig. 3 (continued) Tables 6 and 7) and combining with data on the location and leachates from the deposit. The concentrations show a good positions of the wells (Fig. 1d and Table 1), as well as data on correspondence with national values for unaffected ground- the composition of the shale waste categories (Table 5) may water where the span for the 5th to 95th percentile for, e.g., be the basis for classification of the groundwaters (cf. discus- arsenic is 0.03–0.92, cobalt 0.01–1.2 and nickel 0.07–4.0 sion under Results). μg/L. Sulfate (median 200 mg/L in G9 compared to 45 mg/ Groundwaters G2 and G7 come from the lower aquifer, in L) and iron (median 1.28 mg/L in G9 compared to 1.1 mg/L) the sandstone layer. G7 seems to be unaffected by shale leach- surpass the 95th percentile for unaffected groundwater (SGU ates from the deposit. G2 has higher levels of sulfate, lithium 2013). Median pH for G9 is 7.09. There is a possibility of and strontium as well as higher pH, up to 10 or above in 2018 natural presence of shale and pyrite in the till, which could and in 2004, giving lower levels of manganese and iron. explain the elevated sulfate concentrations that reflect the gen- Alkaline pH may, however, indicate contact with cement used eral background conditions at the Kvarntorp site. to seal the contact between the two aquifers, not observed in Groundwaters G1 and G3 from the upper aquifer are clear- G7. ly distinguished from the other groundwaters. Both have high Groundwaters G6, G9 and G10 come from the upper aqui- sulfate, nickel and lithium concentrations and low pH indicat- fer, in the till layer. G9 seems to be largely unaffected by ing a progressing weathering of the shale waste. G1 has the
Environ Sci Pollut Res

Table 7 Concentrations of trace elements (μg/L) in G1–G11 water: for each element, the first row represents median value 2015–2019, second row
represents min and max values 2015–2019 and third row represents median values 2004

     G1           G2            G3           G4            G5           G6           G7            G8            G9           G10           G11
     (n = 17)     (n = 17)      (n = 17)     (n = 11)      (n = 16)     (n = 17)     (n = 17)      (n = 15)      (n = 17)     (n = 15)      (n = 17)

Cd   6.06         0.005         0.85         0.03          0.03         0.043        0.004         0.76          0.01         0.02          0.08
     4; 15        0.002; 0.1    0.27; 4.2    0.025; 1.45   0.02; 0.12   0.02; 0.15   0.001; 0.1    0.097; 1.49   0.002; 0.1   0.002; 0.05   0.003; 0.65
     6            0.05          1.35         0.08          –            0.30         0.05          0.31          0.05         0.08          –
Co   234          0.1           35.9         0.53          0.65         0.66         0.09          5.12          1.2          25.3          0.87
     154; 427     0.04; 0.49    12.7; 87.1   0.32; 9.3     0.47; 1.65   0.46; 2.73   0.02; 0.16    1.7; 10.9     0.56; 2.0    1.1; 66.7     0.30; 6.94
     241          0.05          43.7         0.77          0.25         0.09         0.05          0.78          2.90         328           –
Ni   1224         0.93          253          20.3          4.8          7.6          0.57          24.9          2.92         191           6.69
     798; 1897    0.48; 5.10    107; 541     16.6; 54.7    3.15; 15.8   5.5; 30.6    0.097; 1.83   16.0; 42.3    1.30; 5.3    3.85; 339     2.3; 51.2
     1230         0.50          227          47.6          1.53         8.18         0.50          6.95          12.6         2700          –
Cu   2.44         2.82          5.47         1.80          1.59         1.32         0.34          2.12          0.31         0.39          0.41
     1.79; 3.75   1.35; 6.09    2.2; 20.4    1.09; 60.9    0.82; 3.89   0.98; 2.58   0.21; 1.04    0.65; 13.9    0.14; 2.73   0.19; 5.4     0.27: 5.31
     3.75         1.0           10.4         1.33          1.00         1.0          1.22          1.0           1.0          1.5           –
Zn   1727         2.82          675          3.92          7.28         1.98         0.51          6.97          0.50         2.18          2.55
     1430; 2211   0.18; 12      247; 4740    2.13; 110     5.30; 11.6   0.98; 3.20   0.16; 1.67    5.23; 12.8    0.28; 2.80   1.46; 3.83    0.58; 26.2
                  1.0
     2200                       282          4.71          5.43         1.0          1.0           2.26          1.0          11.2          –
Sr   293          1670          364          382           1241         975          287           1374          119          728           384
     284; 320     1532; 2788    352; 401     330; 408      1096; 1381   865; 1205    240; 366      1135; 1867    104; 141     572; 815      242; 464
     294          2250          221          247           682          1815         1070          1480          125          1155          –
Li   1536         58.8          2136         1052          609          578          12.3          102           5.2          26            14.1
     1352; 1949   41.0; 161     1871; 2559   807; 1181     506; 697     445; 724     9.3; 19.6     69; 306       4.2; 7.8     21; 52        10.4; 27.6
   –              –             –            –             –            –            –             –             –            –             –
V  65.8           0.01          0.45         8.98          0.66         0.34         0.006         7.34          0.01         0.04          0.62
   14.3; 135      0.004; 0.16   0.15; 16.6   2.31; 105.8   0.35; 1.83   0.24; 0.70   0.003; 0.36   2.13; 59.4    0.003; 0.6   0.01; 0.64    0.21; 2.56
   1.67           1.8           0.97         8.53          0.17         0.70         2.01          12.3          0.05         0.08          –
As 52.8           0.52          86.8         1.49          0.91         1.91         0.06          4.5           0.13         0.05          4.95
   21.9; 73.1     0.18; 2.86    37.0;172     0.16; 65.9    0.52; 1.78   0.55; 3.02   0.02; 1.04    2.20; 28.9    0.08; 0.7    0.03; 0.7     1.14; 28.1
   39.5           4.0           13.2         4.50          1.07         2.39         4.0           113           1.5          1.5           –
Mo 19.3           1.90          405          46.9          37.3         42.3         1.41          125           2.94         0.93          32.1
   5.21; 36.7     0.74; 3.01    172; 633     24.9; 413.8   30.5; 59.7   24.9; 108    0.50; 4.58    63; 595       1.15; 8.22   0.19; 41.3    2.5; 78.4
   12.6           7.50          4.33         30.7          50.7         186          2.04          935           14.1         0.75          –
U 183             0.06          40.0         89.5          2.48         1.77         0.025         1126          3.82         0.23          26.4
   93.8; 349      0.008; 1.20   9.0; 72.2    41.9; 154     1.89; 10.2   0.07; 7.16   0.001; 0.21   400; 1380     2.52; 5.22   0.013; 0.55   3.1; 65.0
   113            0.01          16.3         8.47          16           0.30         0.01          1760          4.90         0.93          –

water with the highest concentrations of iron (median 326 mg/               sulfate and iron concentrations contradict this. Also, potassi-
L) and sulfate (median 3785 mg/L) and with the lowest pH                    um and magnesium concentrations are higher in 2015–2019
during 2015–2019 (below 4). In 2004, also G3 was acidic (pH                 compared to 2004. The pH increase may possibly be due to
3.6–4.3), but during 2015–2019, pH was higher, in the range                 illite buffering, as has been reported elsewhere (Puura 1998)
5.82 to 6.42. Pyrite containing shale and fines are expected to             or carbonate buffering.
generate acidic leachates and subsequent metal releases, as                     All other groundwaters, G4, G5, G8 and G11, can be con-
documented in numerous laboratory tests and measurements                    sidered till water (G9) from the upper aquifer contaminated with
in the field at shale mining sites (e.g., Bäckström 2010; Allard            leachates from the shale wastes as indicated by the levels of trace
et al. 2011; Karlsson et al. 2012; Wilke et al. 2015; Chi Fru               elements from the shale. However, pH is generally above 6.5.
et al. 2016; Åhlgren et al. 2020; Sartz et al. in preparation).             This indicates and confirms that weathering of shale ashes, and
The data from G3 might indicate that the pyrite weathering                  possibly semi-coke, generates leachates that are not acidic.
has decreased, but increased electrical conductivity and higher             Weathering is progressing even in the absence of acid
Environ Sci Pollut Res Fig. 4 Spatial distribution of concentrations for As, Fe, Mo, Ni, U, V and SO42− in groundwaters (except deep groundwater) around the waste deposit (cf. Fig. 1d). Concentration levels from October 2018 and water tempera- tures at 1-m depth from November 2017 (no temperature data available for G4 and G11) generating sulfides, in agreement with observations in laborato- pH above 7–8 (Allard et al. 2011; Karlsson et al. 2013; Åhlgren ry leaching tests in progress (Sartz et al. in preparation). et al. 2020). Progressing shale weathering has previously been observed in Groundwater G6 belongs to the sequence G4, G5 and G8 buffered aquatic systems in the field at the Kvarntorp site, with but with the difference that median pH is 9.13 during 2015–
Environ Sci Pollut Res
2019 (maximum 12.0) and maximum 12.2 in 2004. There is surface run-off from parts of the deposit with fines.
no cement seal around the well that could be the source of Groundwaters G4 (average PC1 score 1.32), G5 (average
alkalinity. Estonian oil shale ash is rich in free lime and anhy- PC1 score 0.27) and G8 (average PC1 score 1.65) are more
drite and produces alkaline leachates with pH 12–13 (Velts closely located towards the deposit and are very tightly
et al. 2011) which is generally not the case for the Kvarntorp grouped together in the PCA. Groundwaters G1 (average
shale ash which generally produces a circumneutral or slightly PC1 score 5.35) and G3 (average PC1 score 3.89) are located
acidic leachate (Karlsson et al. 2012), and G6 is the only towards the right (high PC1 scores) in the PCA plot and close
shallow groundwater well in Kvarntorp where alkaline condi- to fines and black ash from the humidity cell experiments (D
tions have been found. For the Estonian oil shale, it is the high and F). This indicates a significant impact from the waste
content of limestone in the shale (calcite 44%) which when materials on these groundwaters. Groundwater G1 is closest
heated (800 or 1400 °C depending on method) generates cal- to fines while G3 is found closer to shale ashes (black and red)
cium oxide and pH above 12 in contact with water (Pihu et al. in the deposit. Groundwater G1 is thus the most affected
2019). The shale used for oil production in Kvarntorp is not as groundwater positioned straight north of the fines located
rich in carbonates as the Estonian oil shale. Calcite is not a along the eastern side of the waste deposit (Fig. 1d). This
major mineral component in the shale, but limestone waste confirms the fact that G1 is affected mainly by leachates from
was disposed at the Kvarntorp deposit together with the shale fines, even if it is not possible, solely from these data, to
residues. The high pH found in G6 may reflect the presence of determine the exact proportion between fines leachates and
calcium hydroxide from the decomposition of calcium oxide black/red shale ash leachates. Score values from PC1 are thus
originating from the degradation of calcium carbonate in the tentatively interpreted as describing the input of contaminated
deposit, still burning with temperatures exceeding 500 °C. leachates from the shale waste in the deposit. This is con-
The pH variation in G2 from the lower aquifer (sandstone; firmed by the loading plot (Fig. 5b) having high values for
between 6.89 and 10.0), however, could be caused by cement nickel and uranium in PC1. PC2 is probably governed by
leaching from the sealing material (Table 1). Also G7 might redox reactions as dissolved iron and manganese are found
have been influenced by cement resulting in much higher with strongly negative loading values in PC2. This is also
alkalinity and pH in 2004 compared to the period 2015–2019. strengthened by the fact that groundwaters G2, G6 and G8
Groundwater G8 has the highest uranium levels, median with more oxidizing conditions have positive scores in PC2
values above 1 mg/L during 2015–2019. The uranium comes (Fig. 5a). There is a clear relationship between the average
from sludges of possibly processed shale residues that are score values for PC1 and logarithmic nickel concentrations
deposited close to the filter section of the pipe in the well. (r2 0.77) and logarithmic uranium concentrations (r2 0.64)
indicating that PC1 is a good proxy for the level of contami-
PCA nation in the groundwaters. This clearly shows that the com-
bination of PCA and humidity cell experiments can provide
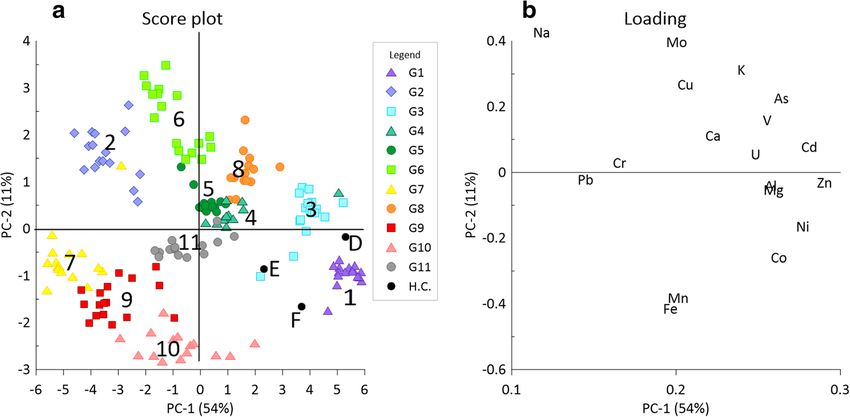
A PCA based on data for all groundwater samples, as well as information about what materials affect the different ground-
data from humidity cell leaching tests (Sartz et al., work in waters. PCA has been used with success in other groundwater
progress) is given in Fig. 5 (score plot) together with the load- systems to identify contamination sources (Sappa et al. 2014;
ing plot showing element relationships. Rao 2014; Bäckström and Sartz 2016). In total, the PCA con-
The PCA score plot confirms the assessments based on the firms the groundwater classifications assessed solely from the
measured concentrations in the groundwaters combined with monitoring data (water chemistry) combined with data on the
information on the location and depths of the wells (Fig. 1d wells (location, depths etc.).
and Table 1). Almost all the groundwaters are unique, as il-
lustrated by the score plot, although the G4, G5 and G8
groundwaters are fairly similar in composition. Principal com- Discussion
ponent 1 (PC1, 54%) explains significantly more of the data
variation compared to the second principal component (11%). Element distribution and speciation
Groundwaters G2 (average PC1 score − 3.43) and G7 (aver-
age PC1 score − 4.75) are located in the sandstone aquifer and Figs. 2 and 3 (concentrations of major elements and trace
G9 (average PC1 score − 3.12) is located in the till upstream elements in selected groundwaters, 2015–2019), Tables 6
the waste deposit. These unaffected groundwaters (compared and 7 (concentrations of all of the elements in all of G1–
to the other groundwaters in the area) have highly negative G11, median and max–min values, 2015–2019) and Table 5
PC1 score values. Groundwaters G6 (average PC1 score − (composition of the solid materials, shale ash and fines from
0.93) and G11 (average PC1 score − 0.55) are slightly affected the deposit, shale from the pit lake area) illustrate and define
by contaminants and found at some distance from the deposit. the overall distribution and exchange of elements between
Groundwater G10 (average PC1 score − 0.76) is affected by solid materials and groundwater in the shale waste/Environ Sci Pollut Res
Fig. 5 a Principal component analysis (score plot) showing all shale ash. The first two principal components explain 65% of all the
groundwater samples and data from day 7 from the humidity cells variation in the data set. b Loading plot showing the relationship
(Sartz et al. in prep), where D = fines, E = red shale ash and F = black between the different elements
groundwater system that constitutes the Kvarntorp deposit. The high pH in G6, most likely from calcium hydroxide orig-
Most important chemical parameter in this system that largely inating from degraded calcium carbonate at high temperature (see
governs the leaching/weathering of the solid materials and discussion under Chemistry profiles), is decreasing with time
concentrations and element speciation in the groundwater is from 12 in 2015 to 8 in 2019, indicating a depletion of calcium
pH (Table 6 and Figs. 2 and 3). hydroxide but possibly equilibrium with calcium carbonate.
The groundwater G9 from the upper aquifer in the till is G1 and G3 differ from the other groundwaters when calci-
dominated by Ca–HCO3–SO4 with pH around 7.07 and total um concentrations are plotted against sulfate (Fig. 6a).
concentrations of dissolved solids around 530 mg/L (median Calcium concentrations are roughly only half of what would
values, Table 6). The groundwater G7 from the lower aquifer be expected compared to the trend for the other groundwaters.
in the sandstone is also dominated by Ca–HCO3–SO4 with pH This pattern might indicate that there are no carbonates
around 6.81 and concentrations of dissolved solids around enough in the vicinity of G1 and G3 to buffer the acid being
160 mg/L (median values, Table 7). The location of the G9 generated, which is consistent with leaching tests from
well is upstream the deposit. There is no significant change in Degerhamn where calcium was less present in acidic samples
chemistry in the water during the period 2004–2019 and no than in non-acidic lime-burned shale ash with dissolution of
evident impact of contamination from shale leachates. Thus, gypsum (Lavergren 2008). Calcium removal from the samples
G9 may serve as a background and reference for the assess- is likely due to precipitation of gypsum (saturation index −
ment of the impact of leachates on the other groundwaters 0.14 and − 0.04 for G1 and G3, respectively) at high sulfate
except G7 and G2. There is no apparent contamination of concentrations.
elements from the shale in the G7 water. This indicates that Mg/Ca ratios plotted against potassium concentrations
the green shale layer between the deposit and the sandstone (Fig. 6b) provide information about ongoing redox activities
horizon 31 m below the surface prevents exchange of water in the deposit. A low Mg/Ca ratio suggests (1) that no mag-
between the upper aquifer in the till/shale waste and the lower nesium bearing lime reacts, (2) that magnesium has been
aquifer in the sandstone. washed out or (3) that the calcium concentrations are limited
by gypsum equilibrium. There are two possible reasons for
Major components—Na, K, Mg, Ca, HCO3−, SO42−, (Cl) and pH lime not to react. Either there is no formation of sulfuric acid
or all lime is consumed (Puura 1998). G1, G3 and G4 (located
All shallow groundwaters, with the exception of G9, exhibit immediately downstream the waste deposit) display Mg/Ca
significant contributions of shale leachates, affecting to vari- ratios close to 1 or greater which is an indication of redox
ous extent all of the measured parameters. The highest contri- activities. These groundwaters are slightly reducing, though,
butions of leachates and largest effects on the concentrations with ferrous iron concentrations between 6 and 10 mg/L indi-
of major elements and sulfate, as well as on pH, are observed cating that oxidizing reactions take place in the deposit up-
in G1 (lowest pH), followed by G3 (Fig. 2 and Table 6). stream the groundwater wells. More reducing conditions closeEnviron Sci Pollut Res
Fig. 6 a Calcium concentrations
(meq/L) versus sulfate
concentrations (meq/L) in
groundwaters G1–G11. b
Magnesium/calcium ratios versus
potassium concentrations (meq/
L) in groundwaters G1–G11
to the wells will, however, reduce the possibility for secondary negative SI (< 0.5) indicates undersaturation and SI in the
immobilization when iron oxyhydroxides are being dissolved. range − 0.5 to 0.5 is considered to be in equilibrium with the
Weathering of illite generates potassium in a slow process. It considered solid phase. Solid phases likely found at equilibri-
has been suggested that monitoring of potassium concentra- um with the groundwaters are calcite, celestite, dolomite,
tions in combination with magnesium and calcium could pro- gibbsite, gypsum, jarosite and siderite. The presence of
vide information about the development in the deposit (Holm jarosite and gypsum has been confirmed to exist in the differ-
et al. 2005). A decreasing Mg/Ca ratio combined with an ent waste materials within the waste deposit (Table 4).
increasing potassium concentration would indicate a decrease
in lime buffering and ongoing sulfuric acid production being Other high concentration elements—Al, Fe, Mn, Li and Sr
buffered by illite instead. No such trends can be distinguished
in the time span 2004–2019. There is a correlation (r2 0.72) Highest concentrations of iron are found in the acidic G1
between the Mg/Ca ratio and the potassium concentration (reaching 379 mg/L in 2015–2019), and G3 (167 mg/L) and
when all 11 locations are included and an even stronger cor- G10 (202 mg/L) have high concentrations (Table 6) indicating
relation (r2 0.94) when G6 and G10 are excluded. For G6, the the presence of ferrous iron. In the case of G10, the pipe is
Mg/Ca ratio is lower than for other wells with similar potas- made of steel, but presumably, the high concentrations are
sium concentrations. For G6, this could be due to equilibrium explained to a large part by water affected by alum shale.
with brucite (saturation index − 0.02) since G6 is the only The ditch north of the waste deposit shows spots with both
groundwater in equilibrium with brucite (see below). G10 elevated temperatures and electrical conductivity, which indi-
displays the opposite relationship between Mg/Ca and potas- cates that leachates from warm parts of the deposit are
sium compared to G6, but since 2004, G10 has approached reaching the ditch through the groundwater. Iron concentra-
the linearity between Mg/Ca and potassium shown by the tions in the ditch are much lower though, than in the ground-
other groundwaters. This is an indication of decreased water, supposedly due to precipitation of iron oxyhydroxides
weathering at this site upstream the deposit, since also the when reaching neutral and oxidizing surface water (cf.
electrical conductivity has decreased. For G3 and G4, both Armstrong et al. 2019).
the Mg/Ca ratio and the potassium concentrations have in- A comparison between all sampling occasions in all
creased since 2004 suggesting that weathering have increased groundwaters indicates a negative correlation with pH for
in these waters. This is further strengthened by an increase in manganese (r2 0.78, logged data) and a weaker negative cor-
electrical conductivity in 2015–2019 compared to 2004. From relation (r2 0.53) for iron (logged data). Other elements show
Mg/Ca ratios, no general conclusion can be drawn for the even weaker correlations with pH. Perkins and Mason (2015)
entire area about changing weathering. Instead, a suggestion found that manganese is highly mobile in weathering shale
is that weathering rates are decreasing at some parts and in- and suggested that manganese loss from carbonate poor black
creasing at other. shales can be an indicator of weathering even if no other signs
of weathering are clearly noted. In Kvarntorp, G2, G7 (the
Solubility control deep wells) and G6 (highest pH) have manganese concentra-
tions in the range 0.0002–0.4 mg/L; G9 (local background
SI from the geochemical calculations for the groundwaters are reference) generally has below 1 mg/L and G8 normally
given in Table 8. Positive SI (> 0.5) indicates oversaturation, around 1 mg/L. Groundwaters G5, G10 and G11 haveEnviron Sci Pollut Res
Table 8 Selected saturation indices (SI) for possible solid phases (hydroxides, sulfates and carbonates) in groundwaters from G1–G11
G1 G2 G3 G4 G5 G6 G7 G8 G9 G10 G11
AlOHSO4 0.61 − 5.5 0.37 − 3.1 − 1.8 − 14 − 4.2 − 3.8 − 4.1 − 3.4 − 2.8
Alunite KAl3(SO4)2(OH)6 4.8 − 4.6 11 2.5 2.4 − 19 − 3.8 − 1.0 − 4.0 − 1.3 0.04
Anhydrite CaSO4 − 0.43 − 1.6 − 0.30 − 0.46 − 0.51 − 0.26 − 2.3 − 0.44 − 1.4 − 0.46 − 1.0
Gypsum CaSO4:2H2O − 0.14 − 1.3 − 0.04 − 0.22 − 0.19 0.07 − 1.9 − 0.11 − 1.1 − 0.13 − 0.68
Brucite Mg(OH)2 − 12 − 7.6 − 6.9 − 5.8 − 8.6 − 0.02 − 10 − 6.6 − 8.6 − 7.3 − 8.6
Calcite CaCO3 * − 1.0 − 0.99 − 0.34 − 0.71 2.1 − 2.0 0.43 − 0.67 − 0.22 − 0.30
CaMoO4 − 1.8 − 3.2 − 0.38 − 1.3 − 1.3 − 1.2 − 3.1 − 0.75 − 2.6 − 3.2 − 2.3
FeMoO4 − 0.11 − 5.1 0.91 − 0.07 − 1.00 − 15 − 2.7 − 3.1 − 2.2 − 2.0 − 2.9
Celestite SrSO4 − 1.6 − 1.1 − 1.5 − 1.6 − 0.99 − 0.99 − 2.3 − 1.1 − 2.4 − 1.3 − 1.9
Diaspore Al(OH)3 0.45 1.5 4.6 2.6 1.7 − 1.4 1.2 1.5 1.3 1.3 1.9
Fe(VO3)2 − 11 − 8.7 − 2.4 1.0 − 5.5 − 22 − 7.4 − 3.0 * − 5.0 − 3.4
Gibbsite Al(OH)3 − 0.93 0.15 3.2 1.2 0.32 − 2.8 − 0.11 0.15 − 0.07 − 0.08 0.57
H-Jarosite (H3O)Fe3(SO4)2(OH)6 − 9.3 − 6.2 1.2 3.8 − 5.1 − 25 − 6.7 − 8.4 − 3.9 0.46 − 7.2
K-Jarosite KFe3(SO4)2(OH)6 − 4.2 0.77 8.3 11 1.9 − 14 − 0.42 − 0.34 2.0 7.6 − 0.62
Siderite FeCO3 * − 3.2 − 0.08 0.47 − 0.74 − 12 − 1.9 − 2.3 − 0.61 0.57 − 1.3
Uraninite UO2 − 0.95 − 8.6 − 4.7 − 5.6 − 5.7 − 15 − 6.6 − 5.7 − 5.7 − 8.2 − 6.3
SI in the range − 0.5 to + 0.5 are given in bold italics
*
Ligand levels below limit of detection
concentrations between 1 and 6 mg/L while G1 and G3 have concentrations between 0.2 and 0.7 mg/L, while G5, G6 and
concentrations between 10 and 22 mg/L. Groundwaters with G8 exceed 1 mg/L. Highest concentrations are found in the
elevated manganese concentrations in Kvarntorp could be due deep groundwater G2 (1.5–2.2 mg/L). Even though the stron-
to weathering and/or reducing conditions in the groundwater. tium concentrations are higher in the deep groundwater, the
Lithium concentrations of about 5 μg/L (median) in the levels are not high when comparing with Danish drinking
reference background well G9 are below the levels in the water works (median 1.45 mg/L, range 0.02 to 30 mg/L)
sandstone aquifer (10–60 μg/L in G2 and G7). and Danish groundwater wells (median 1.52 mg/L) (Frei
Groundwaters G5, G6, G8, G10 and G11 have concentrations et al. 2020).
between 10 and 600 μg/L, while G1, G3 and G4, that are
believed to be highly affected by the shale leachate, have Hydrolyzable divalent trace elements—Co, Ni, Cu and Zn
concentrations between 1000 and 2000 μg/L. Lithium con-
centrations in alum shale has previously been reported to be Concentrations of nickel (as well as manganese, iron, vanadi-
in the range 4- to 24-mg/kg dw (Allard et al. 2011), which um, molybdenum and uranium) as a function of pH are given
means that alum shale is not enriched in lithium compared to in Fig. 7. A pH influence is evident for nickel, as expected,
other black shales (world median 31-mg/kg dw; Ketris and with high concentrations at low pH (G1) decreasing with in-
Yudovich 2009). Leaching tests have shown that lithium is creasing pH (G3, G4 and G10). The higher levels in G10 in
quite easily leached from alum shale, but not from shale ash comparison with G3 and G4 may indicate reducing
(Åhlgren et al. in preparation), which strengthens the sugges- conditions.
tion of contact with partly pyrolysed shale or fines for G1 and Total concentrations of the hydrolysable elements cobalt,
G3 but possibly also for G4. Lithium has been reported to be nickel, copper and zinc are high in fines and shale ash
found in high concentrations in flowback water after fracking (Table 5). Concentrations of cobalt, nickel and zinc in the
in the Marcellus shale (USA) with median concentrations of shale waters from G1 to G3, with low pH, are higher than in
95 mg/L after 14 days (Haluszczak et al. 2013) and is consid- the other groundwaters (Table 7), even though for nickel, the
ered for recovery (Lee and Chung 2020). These concentra- correlation with pH is negative but fairly weak (r2 0.32) when
tions largely surpass the groundwater in Kvarntorp. all groundwater wells are included. High levels of cobalt and
Regional strontium background level in surface water up- nickel are observed in G10. High concentration of particularly
stream the Kvarntorp area is below 0.1 mg/L (Åhlgren et al. nickel, but also cobalt and zinc, in the groundwaters are evi-
2020). Only the upstream well G9 has concentrations that low. dently indications of shale weathering and contribution of
Groundwaters G1, G3, G4, G7, G10 and G11 have contaminated leachates. Soils underlain by black shalesEnviron Sci Pollut Res Fig. 7 Diagrams showing concentrations vs. pH for hydrolysable major elements and trace elements (Mn, Fe and Ni) as well as redox sensitive trace elements (V, Mo and U) in groundwaters G1–G11 elsewhere have shown to be enriched in easily mobilized lower (6 μg/L for G1) and copper much lower (median 2.4 metals with cadmium and copper being of particular μg/L for G1 and 5.5 μg/L for G3). Part of the explanation concern (Yu et al. 2012), and cadmium has been found in could be in concentration differences in the shale material, elevated concentrations in rice in black shale areas (Duan since both elements display higher concentrations in the et al. 2020). Both cadmium (median level 12 μg/L) and cop- Degerhamn shale bedrock (3-mg/kg dw cadmium and 170- per (median level 460 μg/L) have been found at high concen- mg/kg dw copper; Lavergren 2008) compared to Kvarntorp trations in Degerhamn in acidic groundwater (Lavergren (median 1.14-mg/kg dw cadmium and 137-mg/kg dw copper 2008), whereas in Kvarntorp, the median for cadmium is in drill cores).
Environ Sci Pollut Res

    Leaching tests (Åhlgren et al. 2018) with fines and shale      mg/kg dw in fines and ashes (Table 5) shows restricted solu-
ash (the same material as given in Table 5) showed that nickel     bility at low pH and has increased from below 5 to 170–630
was not released from the shale ash to any greater extent,         μg/L in G3 since the pH increased from 3.6–4.3 in 2004 to
whereas there was a significant release of nickel from the fines   5.8–6.4 in 2015–2019. Molybdenum concentrations are be-
at low pH.                                                         low 36 μg/L, despite the presumed high weathering rate in
                                                                   the well, which could be due to the low pH. G6, with median
Redox and pH sensitive trace elements—V, As, Mo and U              pH above 9, has fairly high concentration of molybdenum
                                                                   (maximum level above 100 μg/L), which would be due to
Kvarntorp alum shale is enriched in the redox sensitive ele-       the high pH, while G8 shows even higher concentrations
ments vanadium, arsenic, molybdenum and uranium                    (maximum level almost 600 μg/L for the period 2015–2019).
(Table 5). Elevated concentrations of these elements in the            Molybdenum concentrations in G6 show enhanced
groundwaters (Table 7) are indicators of shale weathering          leaching at high pH, whereas in G3 and G8, redox processes
and further mobilization into the groundwater (see Fig. 4 for      are the likely reason for elevated concentrations. Uranium
the spatial distribution).                                         displays leaching due to low pH in G1 and governed by high
    Vanadium and arsenic can be incorporated in pyrite which       carbonate levels in G8 where it covaries with molybdenum
is the probable origin of these elements in alum shale. In         but not iron. Also vanadium is leached due to low pH in G1.
addition, vanadium is also trapped in clays (Lerat et al.              It is interesting to note that molybdate might be solubility
2018). Shale residues from the waste deposit show a range          controlled by for instance CaMoO4 and FeMoO4. (Table 8).
of 420- to 750-mg/kg dw vanadium and 80- to 150-mg/kg              There is no apparent solubility control of strontium by celes-
dw arsenic, and these elements have a correlation of 0.49          tite (SrSO4), nickel by NiMoO4, vanadium by Fe(VO3)2 or
(r2, logged data) in the groundwaters. It is, however, not the     uranium by uraninite (UO2).
same groundwater well that has the highest concentrations of           Uranium occurs in four manners in alum shale according to
both vanadium and arsenic. Neither of these two elements           Armands (1972): (1) in authigenic K-feldspar, (2) in detrital
seems to be leached to any greater extent, except for vanadium     zircon and titanite, (3) with sulfur and pyrite and (4) organi-
in G1 with up to 130 μg/L and arsenic in G3 with up to 170         cally bound to carbon, whereas Lecomte et al. (2017) propose
μg/L. This is in line with results from studies of alum shale,     that uranium was accumulated in organic matter and biogenic
shale residues and groundwater in Degerhamn, Öland, which          phosphate nodules. Uranium concentrations in shale ash and
also showed low leachability of arsenic and vanadium               fines are in the range 160- to 240-mg/kg dw. Elevated con-
(Lavergren 2008). Leaching tests at pH 12, however, have           centrations of uranium are found in G8 (up to 1760 μg/L)
shown more important leaching of vanadium from shale ash           which has a circumneutral pH but the highest carbonate con-
where 28% of the vanadium was leached (Karlsson et al.             centrations of all waters, indicating formation of soluble ura-
2013) confirming that vanadium is most mobile under oxi-           nium carbonate complexes (Bernhard et al. 1996). High ura-
dized and alkaline conditions (Wright and Belitz 2010).            nium concentrations have previously been observed in one of
Arsenic mobility in fractured rock with pyritic black shales       the pit lakes in the Kvarntorp area, with circumneutral pH and
has earlier shown to be determined by concentrations of sul-       high carbonate level (Allard et al. 2011; Åhlgren et al. 2020).
fide and available oxidant where microbial sulfide production          Leaching tests (Åhlgren et al. 2018) with fines and shale
is suggested to enhance arsenic mobilization (Zhu et al. 2008).    ash (the same material as given in Table 5) showed that ura-
    Yu et al. (2014) suggest that arsenic released from oxida-     nium leached from both fines and ashes at low pH.
tion of arsenian pyrite is adsorbed onto the surface of, or
coprecipitated with, secondary iron minerals. A possible ex-       Temperatures
planation for the differences in arsenic concentrations in G1
and G3 could be precipitation of schwertmannite in G1              Temperatures were elevated in groundwaters at the north-
favoured by the lower pH. Arsenic is effectively adsorbed to       eastern part of the deposit, both in 2005 and in 2017. Fig. 4,
schwertmannite (Acero et al. 2006), and arsenic is thus re-        bottom right, shows the temperatures at a depth of 1 m below
moved from the groundwater through either coprecipitation          the water surface in November 2017. Measurements in the
or sorption to schwertmannite in G1. In 2004, arsenic concen-      ditch just north of the deposit show higher temperatures (18
trations and pH were lower in G3, indicating possible precip-      °C in June 2019) close to well G3 than further to the west (12
itation of schwertmannite and removal of arsenic also in G3 at     °C), indicating that warm water from the deposit is reaching
that time.                                                         the ditch at this site. Temperatures in the groundwater have
    Molybdenum has reduced mobility in sulfidic environ-           not changed notably since 2005. Either the heat generating
ments due to the formation of MoS2 simultaneously with             reactions in the waste deposit have not decreased, or the heat
FeS and FeS2 (Smedley et al. 2014). Molybdenum, acting as          storage capacity in the waste deposit is so significant that the
the molybdate anion with concentrations of 130- to 210-            cooling process is very slow. Modelling of the temperature
You can also read