GREENHOUSE GAS INVENTORY - FY2020 - Santam
←
→
Page content transcription
If your browser does not render page correctly, please read the page content below
GREENHOUSE
                                                    GAS
                                                 INVENTORY

                   FY2020

                                                           SANLAM GROUP FY2020
                                                       CARBON FOOTPRINT REPORT
                                                                  12 March 2021

                                                                   Final Version 1.0

E-mail: info@carboncalculated.co.za | www.carboncalculated.co.za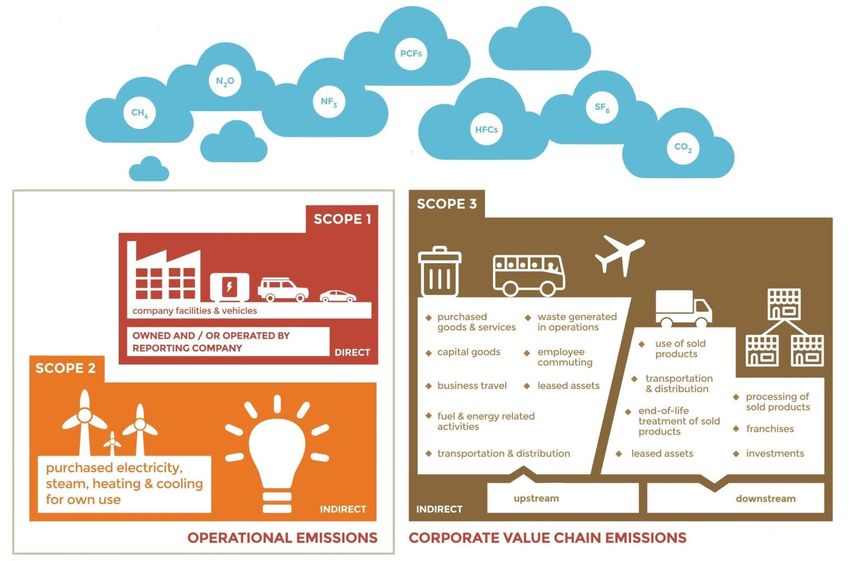
2                                                                                  2

TABLE OF CONTENTS

ABBREVIATIONS AND GLOSSARY OF TERMS                                           3
ACKNOWLEDGEMENTS                                                              5
REVISION HISTORY                                                              5
1.    REPORT OVERVIEW – EXECUTIVE SUMMARY                                     6
2.    INTRODUCTION                                                            7
3.    COMPANY DESCRIPTION                                                     9
4.    NOTABLE YEAR-ON-YEAR CHANGES                                            13
5.    REQUIRED INFORMATION                                                    14
6.    METHODOLOGY, EXCLUSIONS AND ASSUMPTIONS                                 17
7.    INFORMATION ON SANLAM GROUP’S EMISSIONS                                 19
8.    ADDITIONAL INFORMATION UNDER THE GHG PROTOCOL                           23
9.    ILLUSTRATED SUMMARY                                                     28
10.   COMPARISON OF EMISSIONS AND INTENSITY                                   31
11.   SANLAM GROUP INTEGRATED INFORMATION                                     33
12.   CURRENT AND FUTURE TRENDS IN THE CARBON SECTOR                          39
CONTACT INFORMATION                                                           45
REFERENCE LIST                                                                46
APPENDIX A: GHG PROTOCOL’S SCOPE 3 CATEGORIES                                 48
APPENDIX B: OVERVIEW OF SANLAM’S FY2020 GHG EMISSIONS – AT PERCENT SHARE      50
APPENDIX C: SANTAM FY2020 CARBON FOOTPRINT                                    56
APPENDIX D: COMMUTING                                                         61
APPENDIX E: INDEPENDENT VERIFICATION STATEMENT                                62

Sanlam Group FY2020 Carbon Footprint Report | 12 March 2021 | Final version
3                                                                                                                          3

ABBREVIATIONS AND GLOSSARY OF TERMS
    Base year              A past year used as a baseline to compare year-on-year emissions

                           A non-profit organisation that supports companies and cities in the disclosure of their
    CDP
                           environmental impact to the international investor community (see www.cdp.net)

    CO2                    Carbon dioxide

                           Carbon dioxide equivalent – conversion of all greenhouse gases to reflect their global
    CO2e
                           warming potential relative to CO2

    Defra                  United Kingdom Department for Environment, Food and Rural Affairs

                           Greenhouse gas emissions from facilities/sources – e.g., generators, fugitive emissions,
    Direct emissions
                           vehicle fleets, etc. – owned or controlled by a reporting company

                           Greenhouse gas emissions related to manufactured and/or sold goods and services, e.g.,
    Downstream emissions   end-of-life treatment of sold products, transportation and distribution of sold products and
                           franchises

                           Specific value used to convert activity data into greenhouse gas emission values, presented
    Emission factors
                           in specific units, e.g., kgCO2e/km travelled

    FTE                    Full-time equivalent employee

                           Emissions from gases or vapours from pressurised equipment due to leaks and other
    Fugitive emissions     unintended or irregular releases of gases e.g., air-conditioning gas leaks, refrigeration and
                           fire-suppressant gas refills, or methane emissions from coal mining

    FY                     Financial year

    GHG                    Greenhouse gas

                           International methodology used to calculate the carbon footprint of an organisation –
    GHG Protocol           developed by the World Business Council for Sustainable Development (WBCSD) and the
                           World Resources Institute (WRI)

                           Global Warming Potential – an indication of the global warming effect of a GHG in
    GWP
                           comparison to the same weight of CO2

                           GHG emissions from facilities/sources that are not owned or controlled by the reporting
    Indirect emissions     company, but for which the activities of the reporting company are responsible, e.g.,
                           purchasing of electricity, business travel, etc.

                           A metric to compare CO2e emissions, expressed in terms of another metric of activity, e.g.,
    Intensity
                           CO2e per FTE, area, income or tonnes of product

Sanlam Group FY2020 Carbon Footprint Report | 12 March 2021 | Final version
4                                                                                                                                 4

                               The Kyoto Protocol is an international agreement linked to the United Nations Framework
                               Convention on Climate Change, which commits its Parties by setting internationally-binding
    Kyoto Protocol
                               emission reduction targets. The Kyoto Protocol was adopted in Kyoto, Japan, on 11
                               December 1997 and entered into force on 16 February 2005

                               The emissions from electricity-generating sources that companies have purposefully chosen
    Market-based electricity   – for example, energy from a specific wind farm – which may be different from the
                               electricity that is generated for the local grid, thus using a supplier-specific emission factor

                               All fuel emissions from vehicles used onsite, e.g., forklifts, tractors, but not used on public
    Off-road mobile fuel
                               roads

                               All fuel emissions from vehicles used off-site, on public roads, e.g., passenger vehicles,
    On-road mobile fuel
                               delivery vehicles

                               Emissions accounted for by the direct CO2 impact of burning biomass and biofuels because
    Outside of Scopes          the Scope 1 impact of these fuels has been determined to be a net zero. This also includes
                               fugitive emissions outside of the GHG Protocol

                               Emissions resulting from equipment owned or controlled by a reporting company (direct
    Scope 1 emissions
                               emissions)

                               Emissions resulting from consumption of electricity, steam or heat purchased by a reporting
    Scope 2 emissions
                               company (indirect emissions)

                               Emissions resulting from indirect activities, excluding Scope 2, of a reporting company, e.g.,
    Scope 3 emissions
                               commuting travel, business travel, paper consumption (indirect emissions)

                               Indirect GHG emissions that occur in the development of a material/product, up to the point
                               of sale by the producer, sometimes referred to as cradle-to-gate emissions, e.g.,
    Upstream emissions
                               manufacture and delivery of supplied goods or raw materials, business travel, employee
                               commuting and waste generated in operations

                               The act of reviewing, inspecting or testing by an independent third-party, in order to
    Verification               establish and document that a product, service or system meets regulatory or technical
                               standards

Sanlam Group FY2020 Carbon Footprint Report | 12 March 2021 | Final version
5                                                                                                           5

ACKNOWLEDGEMENTS

Carbon Calculated would like to thank Nonkululeka Shabalala, Samantha Young and Luandri Van Bergen
for fielding all questions and coordinating the Sanlam Group (Sanlam) team in the compilation of this
Carbon Footprint Report (CFR).

REVISION HISTORY

    Date         Version         Amendments to Previous Version      Approved By              Prepared By
    19.02.2019   Draft - 0.1     First draft – tables only           Kerry Evans (verifier)   Nici Palmer
    23.02.2021   Draft – 0.1.1   First draft – full report           Kerry Evans (verifier)   Nici Palmer
    25.02.2021   Draft – 0.1.2   Verification statement added        Kerry Evans (verifier)   Nici Palmer
                                 Energy and water efficiencies
    02.03.2021   Draft – 0.1.3                                       Sam Young                Nici Palmer
                                 added
    12.03.2021   Final           None                                Sam Young                Nici Palmer

Sanlam Group FY2020 Carbon Footprint Report | 12 March 2021 | Final version
6 6
SECTION A
1. REPORT OVERVIEW – EXECUTIVE SUMMARY
Figure 1 is a summary of the emissions and company metrics reported by Sanlam Group in FY2020
adjusted down where data was centralised so as to correspond with the reporting boundary.
SCOPE 1 SCOPE 3
Stationary Fuels Fugitive
Emissions Purchased Goods T&D Losses
Waste
- Paper Fuel & Energy
179 tCO2e 23 tCO2e
328 tCO2e 3 282 tCO2e 232 tCO2e
On-site Renewable
Mobile Fuels Energy Employee Upstream Transport Car rental, Shuttle,
commuting & Distribution bus, travel claims
1 438 tCO2e 0.00
8 384 tCO2e 198 tCO2e 497 tCO2e
Total Scope 1 1 640.09 tCO2e
SCOPE 2
Purchased Electricity
Total Scope 2 Air Travel Accommodation Downstream
leased assets
33 150 tCO2e 2 295 tCO2e 650 tCO2e 733 tCO2e
Total Scope Total Scope 3 16 599 tCO2e
34 790 tCO2e
1&2
Outside of Scope
Non-Kyoto
Not reported
FTE 11 454 m2 172 488
FTE 3.037 m2 0.202
Figure 1: Summary of Sanlam Group’s FY2020 emissions and company metrics
Sanlam Group FY2020 Carbon Footprint Report | 12 March 2021 | Final version7 7
2. INTRODUCTION
This FY2020 CFR constitutes the thirteenth carbon footprint report commissioned by Sanlam Group and
should be compared against previous carbon footprint calculations to review changes in annual
consumption, boundaries and areas of improvement. All reports have been prepared using the GHG
Protocol Corporate Accounting and Reporting Standard methodology.
Within the GHG Protocol, accounting and reporting are guided by five principles – relevance,
completeness, consistency, transparency and accuracy – to ensure that reported information represents
a true and fair account of emissions. These principles are intended to underpin all aspects of GHG
accounting and reporting according to the GHG Protocol, and to which Carbon Calculated subscribes in
the delivery of all its reports.
In accordance with the GHG Protocol, clear organisational and operational boundaries have been
defined and agreed to by Sanlam Group, and the relevant activity data has been supplied. This CFR
covers emissions from the business activities of Sanlam Group.
The GHG Protocol
The GHG Protocol is the most widely used standard for mandatory and voluntary corporate GHG reports and is compatible
with other international GHG reporting standards such as ISO 14064. It is derived from a multiple-stakeholder partnership
of businesses, NGOs and governments led by the WRI and the WBCSD.
The CFR covers 11 454 FTEs, 172 488 square metres (m2) of office area. It is important to highlight that
under the GHG Protocol, the reporting of both Scope 1 direct emissions and Scope 2 indirect emissions
is compulsory. All Scope 3 emissions, (i.e. those from supply chain activities), are reported at the
discretion of the reporting company.
Sanlam Group FY2020 Carbon Footprint Report | 12 March 2021 | Final version8 8
As a result, the GHG-emitting activities covered by the CFR include:
Direct emissions (referred to as Scope 1), resulting from fuel used by Sanlam Group-owned or
Sanlam Group-controlled equipment (stationary fuels); fleet vehicles (mobile fuels); air-conditioning,
refrigeration, and fire-suppressing gas refills (fugitive emissions).
Indirect emissions (referred to as Scope 2) from purchased electricity.
Selected indirect emissions in the supply chain (referred to as Scope 3), resulting from Sanlam
Group’s business travel activities, its employee commuting, upstream and downstream distribution,
the consumption of office paper, electricity transmission and distribution (T&D) losses and waste.
In this regard, see Tables 1 and 2. Figure 2 below shows the detailed breakdown of Scopes and emission
categories.
Figure 2: Illustration of Scopes and emission categories
Sanlam Group FY2020 Carbon Footprint Report | 12 March 2021 | Final version9 9 Carbon Calculated has gone to all reasonable lengths to ensure that the primary information provided by Sanlam Group is correct. Carbon Calculated is not liable for any inaccuracies that this information might contain. This CFR, in its entirety, is both material and complete and is intended for Sanlam Group internal use only. Information may, however, be extracted for reporting purposes, such as for submission into international and national GHG registries and for purposes of sustainability reporting. It may also be presented for third-party verification purposes. 3. COMPANY DESCRIPTION In 1918, the Sanlam Group was established as a traditional life insurance company. Over the years, the group has evolved into a diversified one-stop financial services business, fit to serve all financial market segments. Sanlam’s core operations lie in the life and long-term insurance sector, as well as asset management. Through their subsidiary1, Santam, Sanlam also holds an interest in the short-term insurance sector. Sanlam commands both a local and global presence, with business interests located throughout South Africa, Africa, India, Malaysia, Australia, Philippines, the UK/Ireland, the USA and Switzerland, amongst others. The Group’s Head Office is in Bellville, Cape Town, South Africa. The Sanlam Group is listed on both the Johannesburg Stock Exchange and the Namibian Stock Exchange. In 2007, Sanlam was listed on the Socially Responsible Investment (SRI) Index of the Johannesburg Securities Exchange. Sanlam and Santam participate in the CDP. 1 With the exception of Santam, this Carbon Footprint Report does not include Sanlam Group subsidiaries. Sanlam Group FY2020 Carbon Footprint Report | 12 March 2021 | Final version
10                                                                                                                                  10

Table 1: OVERVIEW OF SANLAM GROUP’S FY2020 GHG EMISSIONS
      REPORTING PERIOD: Sanlam Group’s financial year (01 January 2020 – 31 December 2020)
      CARBON FOOTPRINT CALCULATION CONDUCTED ON: Sanlam Group Sanlam Head Office, Sanlam Sky (Houghton),
       Sanlam Investments, Sanlynn (Pretoria), Sanlam Glacier, Sanlam Alice Lane, Santam Head Office, Santam Auckland
       Park, Santam Garsfontein, Santam Alice Lane and Santam Glacier
      METHODOLOGY: GHG Protocol – Corporate Accounting and Reporting Standard

      GHG CONSOLIDATION APPROACH: Operational Control Approach

       Company Metrics
       Total Sanlam Group employees                                                                     14 950
       Total full-time Sanlam Group employees (FTE) covered by CFR                                      11 454
       Total square metreage of area reported                                                          172 488

                                                                                                         100%            Adjusted
       Scope 1 Direct Emissions                                                                              Metric tonnes of CO2e
       Stationary fuel emissions                                                                        183.24              179.33
       Fugitive emissions                                                                                22.76               22.76
       Mobile fuel emissions                                                                          1 438.05            1 438.00
       On-site renewable energy emissions                                                                 0.00                0.00

      TOTAL SCOPE 1 EMISSIONS                                                                         1 644.05              1 640.09

       Scope 2 Indirect Emissions
       Purchased electricity – location-based                                                       33 150.38              33 150.38
       Purchased electricity – market-based                                                         33 150.38             33 150.382

       TOTAL SCOPE 2 EMISSIONS                                                                      33 150.38             33 150.383

       TOTAL SCOPE 1 & 2 EMISSIONS                                                                  34 794.43              34 790.48

       Intensity Metrics
       Scope 1 & 2 emissions per full-time employee (tCO2e/FTE)                                          3.038                   3.038
       Scope 1 & 2 emissions per square metre of building (tCO2e/m2)                                     0.202                   0.202

2  Sanlam Group’s market-based electricity is identical to location-based electricity because no supplier-provided contractual
instruments were reported in 2020.
3 In dual reporting (market-based and location-based methodologies), the Scope 2 total is for each respective methodology and

not the combined totals of both methodologies.

Sanlam Group FY2020 Carbon Footprint Report | 12 March 2021 | Final version
11 11
Table 2: OVERVIEW OF SANLAM GROUP’S FY2020 GHG EMISSIONS –AT 100%
Metric tonnes of CO2e
TOTAL SCOPE 1 EMISSIONS: Direct emissions from owned/controlled operations 1 644.05
TOTAL SCOPE 2 EMISSIONS: Indirect emissions from the use of purchased electricity 33 150.38
TOTAL SCOPE 1 & 2 EMISSIONS 34 794.43
Scope 3 Indirect Emissions
1. Purchased goods and services Office paper 151.68
Policy paper 186.43
338.11
3. Fuel- and energy-related activities Electricity T&D losses 3 281.89
4. Upstream transportation and distribution Courier 212.54
5. Waste generated in operations Waste to landfill 231.19
Recycling and compost 2.80
Food waste 0.24
234.23
6. Business travel Car hire 81.39
Air travel 2 458.37
Accommodation 691.48
Shuttle and chauffeur 14.44
Bus 3.44
Travel claims 424.47
3 673.59
7. Employee commuting 8 384.34
13. Downstream leased assets Tenant electricity 732.89
TOTAL SCOPE 3 EMISSIONS 16 857.59
Outside of Scopes:
Non-Kyoto Protocol GHG emissions 0.00
TOTAL EMISSIONS 51 652.03
Intensity Metrics
Scope 1 & 2 emissions per full-time employee (tCO2e/FTE) 3.038
Scope 1 & 2 emissions per square metre of building (tCO 2e/m2) 0.202
Total emissions per full-time employee (tCO2e/FTE) 4.510
Total emissions per square metre of building (tCO 2e/m2) 0.299
Sanlam Group FY2020 Carbon Footprint Report | 12 March 2021 | Final version12 12
Table 3: OVERVIEW OF SANLAM GROUP’S FY2020 GHG EMISSIONS – ADJUSTED4
Metric tonnes of CO2e
TOTAL SCOPE 1 EMISSIONS: Direct emissions from owned/controlled operations 1 640.09
TOTAL SCOPE 2 EMISSIONS: Indirect emissions from the use of purchased electricity, steam,
33 150.38
heating, and/or cooling
TOTAL SCOPE 1 & 2 EMISSIONS 34 790.48
Scope 3 Indirect Emissions
1. Purchased goods and services Office paper 141.28
Policy paper 186.43
327.71
3. Fuel- and energy-related activities Electricity T&D losses 3 281.89
4. Upstream transportation and distribution Courier 197.95
5. Waste generated in operations Waste to landfill 228.88
Recycling and compost 2.76
Food waste 0.23
231.86
6. Business travel Car hire 76.04
Air travel 2 294.72
Accommodation 649.92
Shuttle and chauffeur 14.00
Bus 3.17
Travel claims 404.10
3 441.95
7. Employee commuting 8 384.34
13. Downstream leased assets Tenant electricity 732.89
TOTAL SCOPE 3 EMISSIONS 16 598.60
Outside of Scopes:
Non-Kyoto Protocol GHG emissions 0.00
TOTAL EMISSIONS 51 389.08
Intensity Metrics
Scope 1 & 2 emissions per full-time employee (tCO2e/FTE) 3.037
Scope 1 & 2 emissions per square metre of building (tCO2e/m2) 0.202
Total emissions per full-time employee (tCO2e/FTE) 4.4870
Total emissions per square metre of building (tCO 2e/m2) 0.298
4Sanlam Head Office consumption was adjusted to 98.66% of total consumption to exclude the few 3 rd party tenants that are
metered together with Sanlam. For data that was reported at group-level/centralised, these GHG emissions were further adjusted
down to reflect the % of total FTE employees based at the facilities included in the reporting boundary (92.03% for FY2020). It
should be noted that to align with historical reporting, a similar adjustment was not made for Santam.
Sanlam Group FY2020 Carbon Footprint Report | 12 March 2021 | Final version13 13
4. NOTABLE YEAR-ON-YEAR CHANGES
The following are notable changes between FY2019 and FY2020:
The most notable of changes was the reduction in consumption across the business due to the
drop in occupancy from the effects of lockdown because of COVID-19.
Loadshedding during the reporting year resulted in an increase in diesel consumed in generators.
Limited air-conditioning and refrigeration gas refills data was available. Only 10.90kg of R410a
was reported by Auckland Park.
A commuting survey was not completed in FY2020. FY2018 data was used as a proxy. To account
for the reduced occupancy during lockdown, the estimated headcount of employees entering the
office per month was used to appropriately adjust the emissions from commuting - Appendix D.
Food waste in FY2020 was split between composted waste and that which was repurposed as
animal feed to pig and fly farms. In FY2018, it was assumed all emissions were repurposed.
The Funeral Parlour business, including its fleet, was sold in August 2020, thereby reducing mobile
fuel emissions.
The emission factor for electricity decreased slightly by 2%, further decreasing relative emissions
compared to FY2019.
Sanlam Head Office electricity consumption was reported excluding tenant electricity in Scope 2.
In FY2019, this was included in Scope 2 and tenant electricity was also reported as Scope 3.
Garsfontein closed at the end of the F2020 reporting year, further reducing overall consumption.
Limited data was available for West End, one of the 8 previously omitted facilities. The data was
incomplete and therefore not included.
Employee and area metrics were externally verified during FY2020, resulting in a restatement of
FY2019 data and intensity ratios.
Total employees excluded 159 international employees as they were outside the reporting
boundary.
Sanlam HO has a few solar panels installed. These are used to charge batteries and other
equipment in the event of a power outage. None of this power is available to the building to use
as an alternative to grid power.
Reductions in food waste and LPG are linked to kitchens being closed during lockdown with
limited offerings after July 2020 due to minimal staff onsite.
Sanlam Group FY2020 Carbon Footprint Report | 12 March 2021 | Final version14 14
SECTION B
5. REQUIRED INFORMATION
5.1. GHG INVENTORY – ORGANISATIONAL BOUNDARY
Organisational Boundaries
Organisational boundaries determine which business units (core, subsidiaries, franchises, etc.), facilities, or physical places
of operation, owned or controlled by the reporting company, are included in the GHG inventory. The more complex the
company structure, the more important are the boundaries of an organisation for the clear definition and scope of the
report.
Organisational boundaries are established on either the control approach or the equity share approach.
Under the control approach – either financial or operational control – a company accounts for all
emissions by entities and activities that are under the direct control of the organisation. Under the equity
share approach, a company accounts for its GHG emissions from operations according to its share of
equity in the operation.
Sanlam Group reports on all emissions using the operational control approach adjusted downwards to
reflect only those facilities and FTE employees included in the reporting boundary.
The following facilities are included in the FY2020 Sanlam Group CFR:
Sanlam:
o Sanlam Head Office
o Sanlam Sky
o Sanlam Investments
o Sanlynn
o Sanlam Glacier
o Sanlam Alice Lane
Santam:
o Santam Head Office
o Santam Auckland Park
o Santam Garsfontein
o Santam Alice Lane
o Santam Glacier
Sanlam Group FY2020 Carbon Footprint Report | 12 March 2021 | Final version15 15
All Scope 3 emissions, except waste, policy paper, commuting, tenant electricity and T&D losses of
electricity, are reported at group level for all South African operations. In the Carbon Footprint Report
Overview, GHG emissions are reported in two ways: At 100% (p. 10 and 11) and, adjusted firstly to exclude
Sanlam Head Office tenant consumption (96.88% for this facility) and then for emissions sources that were
reported at Group-level, by a further 92.03% to correspond with the number of employees and buildings
included in Sanlam’s reporting boundary. For all Santam buildings, 100% of consumption was used for the
GHG calculations.
5.2. GHG INVENTORY – OPERATIONAL BOUNDARY
Operational Boundaries
Operational boundaries determine the actual operational activities of the reporting company that generate emissions;
which of these activities should be included in the calculation; and how these activities should be classified (i.e., direct or
indirect emissions).
Direct and Indirect Emissions
Under the GHG Protocol, emissions are categorised as ‘direct’ when they are generated from activities or sources within
the reporting company’s organisational boundary and which the company owns or controls. ‘Indirect’ sources are those
emissions related to the company’s activities that are emitted from sources owned or controlled by another company,
but for which the activities of the reporting company are responsible, e.g., purchased electricity, rental cars, commercial
airlines or paper.
GHG emissions for the following categories have been included and calculated as part of Sanlam Group’s
inventories in FY2020, as follows:
Table 3: Categories included in the Sanlam Group FY2020 CFR
Scope Category Type/Source
Generators
Stationary fuel
Cookers
Pool/maintenance vehicles
Mobile fuel – on -road Sanlam Funeral cars
Scope 1 Santam ABSA fleet
Air-conditioning
Fugitive gas
Refrigerants
Onsite renewable energy Photovoltaic
Scope 2 Purchased electricity Grid electricity
Scope 3 Purchased goods and services Office paper
Sanlam Group FY2020 Carbon Footprint Report | 12 March 2021 | Final version16 16
Policy paper
Fuel- and energy-related activities Electricity T&D losses5
Upstream and downstream transportation and
Courier services
distribution
Landfill
Waste Recycling
Food waste
Car hire
Air travel
Accommodation
Business travel
Travel claims
Third party transfers (shuttles,
bus)
Private commuting to/from
Employee commuting
work
Downstream leased assets Tenant electricity at Sanlam HO
Outside of Scopes Fugitive gases Air-conditioning (R22)
5.3. REPORTING PERIOD
The reporting period of this CFR is Sanlam Group’s 2020 financial year (01 January 2020 – 31 December
2020)
5.4. BASE YEAR
Base-year Calculations
A base year is the historical year against which a reporting company’s emissions are tracked and compared over time. It is typically the
earliest relevant point in time for which a company has reliable data.
Sanlam Group has set FY2014 as the base year for carbon footprint calculations because it best
represents the reporting boundaries with reliable and transparent data. The base year has not been
recalculated. It is recommended the base year is restated as there have been significant structural
changes to the organisation. For the past four years, the Group Carbon Footprint has included Santam
and this needs to be clearly stated when comparing data to the base year. For a historical record of
Sanlam Group’s emissions, see Tables 10, 11 and 12.
5 T&D emissions are the energy losses that occur in the transfer of electricity from the power plant to the end user. To account
for electricity emissions fully, organisations should report the T&D loss associated with their purchased power. This does not
apply for renewable energy generated onsite; thus, reporting T&D emissions helps represent the full impact of an organisation’s
activities and operations, and is regarded as best practice.
Sanlam Group FY2020 Carbon Footprint Report | 12 March 2021 | Final version17 17
6. METHODOLOGY, EXCLUSIONS AND ASSUMPTIONS
This CFR has been completed using Guidelines from the GHG Protocol. The following exclusions and/or
assumptions are noted in relation to the reporting boundary as well as the Scope 1, Scope 2 and Scope 3
emissions covered by the CFR:
6.1. ORGANISATIONAL BOUNDARY EXCLUSIONS
Emissions generated by the following facilities and/or entities are excluded from the reporting
boundary:
Only eleven facilities are included within the reporting boundary as indicated in Section 2.1. All
other facilities are excluded.
It is assumed that facilities leased by Sanlam to third parties are under Sanlam’s operational
control and omitted from the reporting boundary.
6.2. OPERATIONAL BOUNDARY EXCLUSIONS AND ASSUMPTIONS
Scope 1 – Direct Emissions
Limited air-conditioning and refrigeration gas refills data was available.
Scope 2 – Indirect Emissions
No known exclusions or assumptions
Scope 3 – Indirect Emissions
Refer to Table 4 for category or activity exclusions within the reporting year.
Sanlam Group FY2020 Carbon Footprint Report | 12 March 2021 | Final version18 18
Table 4: SPECIFIC SCOPE 3 EMISSION CATEGORIES AND EXCLUSIONS ACCORDING TO THE CORPORATE
VALUE CHAIN FOR SANLAM GROUP IN FY2020
Category Scope 3 category Evaluation status Reason for exclusions
Relevant, partially reported:
Information on other “goods and
1 Purchased goods and services Office paper
services” not provided
Policy paper
2 Capital goods Relevant, not reported Information not available
Fuel- and energy-related activities Relevant, reported:
3 Not applicable
(not included in Scope 1 or Scope 2) Electricity T&D losses.
Upstream transportation and Relevant, reported:
4 Not applicable
distribution Courier
Relevant, reported:
Waste to landfill
5 Waste generated in operations Not applicable
Recycling
Food waste
Relevant, reported:
Rental cars
Commercial flights Information on other “Business
6 Business travel
Accommodation Travel” not available.
Shuttle, chauffeur, bus
Travel claims
7 Employee commuting Relevant, reported Not applicable
8 Upstream leased assets Relevant, not reported Information not available
Downstream transportation and
9 Relevant, not reported Information not available
distribution
The Sanlam Group is a financial
Not relevant, explanation
10 Processing of sold products services company and their
provided
products do not produce GHGs
The Sanlam Group is a financial
Not relevant, explanation
11 Use of sold products services company and their
provided
products do not produce GHGs
The Sanlam Group is a financial
End-of-life treatment of sold Not relevant, explanation
12 services company and their
products provided
products do not produce GHGs
13 Downstream leased assets Relevant, provided Information provided
Not relevant, explanation
14 Franchises Sanlam do not have franchises
provided
15 Investments Relevant, not reported Not available
Sanlam Group FY2020 Carbon Footprint Report | 12 March 2021 | Final version19 19
SECTION C
7. INFORMATION ON SANLAM GROUP’S EMISSIONS
7.1. TOTAL SCOPE 1 & 2 EMISSIONS
The GHG Protocol requires carbon footprint calculations to include, as compulsory reporting, all direct
emissions under Scope 1 and indirect emissions under Scope 2.
All emissions are calculated using emission factors and reported as carbon dioxide equivalent (CO2e)
gases as required by the GHG Protocol. Unless otherwise stated, emission factors are sourced from
Defra6.
Emission Factors
Emission factors convert operational activity data (e.g., kilometres driven, kilowatt hours of purchased electricity) into a
value indicating the GHG emissions generated by that activity – reported as carbon dioxide equivalent (CO2e). Emission
factor values can be sourced from a variety of different providers.
Carbon Dioxide Equivalent (CO2e)
A standard unit for measuring emissions from various GHGs based on their GWP in relation to that of carbon dioxide.
The GHGs covered by this calculation are carbon dioxide (CO2), methane (CH4), nitrous oxide (N2O),
hydrofluorocarbons (HFCs), perfluorocarbons (PFCs), sulphur hexafluoride (SF6) and nitrogen trifluoride
(NF3). As described above, all these gases are amalgamated and reported in terms of their carbon
dioxide equivalency (CO2e).
7.2. COMPANY INTENSITY METRICS
Intensity metrics are indicators that provide a comparison of the amount of CO2e relevant to an
operational indicator. Typically, the indicator is a factor that is comparable across years and sectors.
Examples include: full-time equivalent employees (FTEs), area in square metres (m2), volumes of
production, and/or a monetary factor such as EBITDA, revenue or turnover.
6 UK Government’s Defra, Guideline to Defra’s GHG Conversion Factors for Company Reporting; Annexes Updated in August 2020.
Sanlam Group FY2020 Carbon Footprint Report | 12 March 2021 | Final version20 20
7.3. SCOPE 1 EMISSIONS
Scope 1 emissions are from sources owned or controlled by the reporting company, e.g., generators,
refrigeration, air-conditioning units.
Table 5 provides a breakdown of Sanlam Group’s direct Scope 1 consumption and carbon emissions for
FY2020. Please note that throughout the CFR, all consumption, and emissions in tonnes of CO2e are
rounded to two decimal places7 and intensity metrics are rounded to three decimal places.
Table 5: SANLAM GROUP’S DIRECT SCOPE 1 EMISSIONS IN FY2020
Metric tonnes of
Description Units Total consumption
CO2e8
Litres of diesel in equipment – Sanlam 57 005.00 153.22
Litres of petrol in equipment – Santam 8 828.42 23.73
Stationary fuel Kilograms of LPG – Sanlam 1 302.41 3.83
Kilograms of LPG – Santam 835.78 2.46
Total 183.24
Kilograms of 410a – Santam 10.90 22.76
Fugitive gas9
Total 10.90 22.76
Litres of diesel – Sanlam 935.10 2.51
Litres of petrol – Sanlam 1 426.95 3.30
Mobile fuel – mobile Litres of diesel – Santam 78 573.50 211.20
Litres of petrol – Santam 431 405.50 998.56
Total 1 215.57
Litres of diesel – Sanlam (SIM funeral) 4 523.98 12.16
Litres of petrol – Sanlam (SIM funeral) 88 849.56 205.66
Mobile fuel – fleet Litres of diesel – Santam (ABSA fleet) 994.80 2.67
Litres of petrol – Santam (ABSA fleet) 858.70 1.99
Total 222.48
Renewable energy
kWh – Solar energy at Sanlam HO Not available10 0.00
generated on-site
7 Should the figures in the breakdown tables of this CFR be summed manually, there may be variances of 0.01 (up or down)
from the totals stated herein due to rounding of data to two decimal places.
8 Unless otherwise stated, all emission factors are provided by the UK Government’s Defra conversion factors, Guideline to
Defra’s GHG Conversion Factors for Company Reporting; Annexes. Updated in August 2020.
9 The GWP for air-conditioning, fire suppressant and refrigeration gas refills are sourced from the IPCC fourth assessment report.
10 Sanlam Head office has small solar panels on the roof that are insignificant and therefore not measured. It is strictly for the
purpose of disaster recovery.
Sanlam Group FY2020 Carbon Footprint Report | 12 March 2021 | Final version21 21
7.4. SCOPE 2 EMISSIONS – MARKET-BASED AND LOCATION-BASED EMISSIONS
Scope 2 emissions are associated with the consumption of purchased electricity, heat or steam from a
source that is not owned or controlled by the reporting company, e.g., an electricity utility such as
Eskom. Scope 2 emissions are reported according to either the location-based or market-based
approach.
Location-based electricity
The location-based method reflects the average emissions intensity of electricity grids on which energy consumption
occurs, taking into account all electricity generation (renewable and non-renewable), thus using the grid average emission
factor. An example is the national annual electricity emission factor provided by Eskom to South African electricity
consumers.
Market-based electricity
The market-based method reflects the emissions from electricity-generating sources that companies have purposefully
chosen – for example, energy from a specific wind farm – which may be different from the electricity that is generated for
the local grid. Different electricity suppliers and contracts emit more or less GHGs depending on the energy source or
technology, resulting in a supplier-specific emission factor.
Where relevant, this means reporting the specific emissions associated with the procurement of energy
from a contracted supplier. Contracts with low-carbon electricity suppliers and renewable energy
certificates (RECs) are examples of instruments that provide companies with an opportunity to account
for emissions under the market-based approach. Regardless of whether supplier-specific emission
factors are employed or not, dual reporting of location and market-based electricity is required.
Table 6 provides a breakdown of Sanlam Group’s indirect Scope 2 consumption and carbon emissions
for FY2020.
Sanlam Group FY2020 Carbon Footprint Report | 12 March 2021 | Final version22 22
Table 6: SANLAM GROUP’S INDIRECT SCOPE 2 EMISSIONS FROM PURCHASED ELECTRICITY IN FY2020 at
100%
Total Metric tonnes
Description Location Units
consumption of CO2e11
Sanlam Head Office kWh location-based 22 326 189.6212 22 772.71
Houghton/Sky kWh location-based 771 716.00 787.15
Sanlam Investments kWh location-based 742 422.00 757.27
Purchased electricity –
South Africa – Sanlam Sanlam Alice Lane kWh location-based 1 741 297.47 1 776.12
Sanlam Glacier kWh location-based 514 053.83 524.33
Sanlynn kWh location-based 583 733.24 595.41
Total 26 679 412.16 27 213.00
Santam Head Office kWh location-based 1 689 768.99 1 723.56
Santam Auckland Park kWh location-based 2 431 543.66 2 480.17
Purchased electricity – Santam Garsfontein kWh location-based 607 177.99 619.32
South Africa – Santam Santam Alice Lane kWh location-based 876 407.69 893.94
Santam Glacier kWh location-based 216 066.46 220.39
Total 5 820 964.78 5 937.38
Total purchased electricity – location-based 32 500 376.95 33 150.38
Total purchased electricity – market-based13 32 500 376.95 33 150.38
11 South African emission factor sourced from the Eskom 2020 Integrated Report.
12 Sanlam Head Office electricity excludes 718 522.88 kWh (732.89 tCO2e) of tenant electricity. It includes the Data Centre but
excludes other tenant consumption and a small amount of renewable energy generated onsite.
13 In dual reporting (market-based and location-based methodologies), the Scope 2 total is for each respective methodology and
not the combined totals of both methodologies.
Sanlam Group FY2020 Carbon Footprint Report | 12 March 2021 | Final version23 23
SECTION D
8. ADDITIONAL INFORMATION UNDER THE GHG PROTOCOL
8.1. SCOPE 3 EMISSION CATEGORIES
Scope 3 emissions
Scope 3 emissions are indirect emissions (other than purchased electricity, heat or steam) that can be described as relevant
to the activities of the reporting company, e.g., business travel, and which are emitted by sources in the reporting
company’s supply chain. Scope 3 emissions are reported at the discretion of the reporting company.
It is widely accepted that reporting on a variety of Scope 3 categories (refer to Appendix A) allows
companies to gain more meaningful and comprehensive information that provides input into their wider
business strategy. Furthermore, reporting of Scope 3 categories is increasingly becoming a focus in
management of corporate carbon emissions. Certain reporting platforms, such as CDP and the SBT
Initiative (SBTi), are steadily requiring greater and more detailed understanding of the entire supply
chain of an organisation, making Scope 3 reporting increasingly important for companies.
If a company is reporting on Scope 3 emissions, then they will first need to identify which Scope
3 categories are relevant to their operations. Once relevancy is established, the selection of
Scope 3 activities is based on the availability, reliability and accuracy of the relevant data within
the organisation.
8.2. RELEVANT SCOPE 3 EMISSIONS
Table 7 outlines Scope 3 emissions generated during Sanlam Group’s reporting year from data
that was available and deemed accurate. The Table indicates the consumption together with the
calculated emissions. Please refer to relevant footnotes for further details.
Sanlam Group FY2020 Carbon Footprint Report | 12 March 2021 | Final version24 24
Table 7: SANLAM GROUP’S INDIRECT SCOPE 3 EMISSIONS FROM FY2020 at 100%
Metric tonnes
Description Units Total consumption
of CO2e14
Tonnes of Mondi Rotatrim – Sanlam 64.58 130.50
Third party production of
Tonnes of Mondi Rotatrim – Santam 10.48 21.18
office paper
Total 75.06 151.6815
Tonnes of Mondi Rotatrim – Sanlam 32.14 64.95
Tonnes of Sappi Typek – Sanlam 32.14 77.8416
Third party production of
Tonnes of Mondi Rotatrim – Santam 9.82 19.85
policy paper
Tonnes of Sappi Typek – Santam 9.82 23.79
Total 83.9217 186.43
Fuel- & energy-related Kilowatt hours – Sanlam 26 679 412.16 2 694.09
activities – T&D losses from Kilowatt hours – Santam 5 820 964.78 587.80
purchased electricity Total 32 500 376.95 3 281.89
Tonne.km – Sanlam (DSV) 227 883.03 183.12
Upstream distribution –
Tonne.km – Santam (DSV) 24 028.21 29.42
courier18
Total 251 911.24 212.5419
Tonnes to landfill – Sanlam 139.54 180.28
Tonnes of recycling – Sanlam 110.18 2.35
Tonnes of food composted – Sanlam 21.15 0.22
Tonnes of food fly/pig farm - Sanlam 3.96 0.00
Waste Tonnes to landfill – Santam20 39.4121 50.91
Tonnes of recycling – Santam 21.11 0.45
Tonnes of food composted– Santam 2.14 0.02
Tonnes of food fly/pig farm - Sanlam 8.77 0.00
Total 346.26 234.2322
Km – diesel < 1.7 6 655.00 0.91
Km – petrol < 1.4 litre 127 876.00 18.97
Business travel – rental cars Km – diesel 1.7–2.0 litre 6 119.00 1.02
– Sanlam Km – petrol 1.4–2.0 litre 177 780.00 33.17
Km – diesel > 2.0 litre 20 085.00 4.10
Km – petrol unknown size 22 612.00 3.94
14 Unless otherwise stated, all emission factors are provided by Defra, Guideline to Defra’s GHG Conversion Factors for Company
Reporting, Annexes. Updated in August 2020.
15 Emission factor for Mondi Rotatrim paper, October 2020 via private communication.
16 Emission factor for Sappi Typek paper, June 2020 via private communication.
17 It was assumed a 50:50 split between Mondi and Sappi Typek for policy paper as the paper manufacturer was unavailable.
18 The Courier supplier changed from DSV to CIT in December 2020.
19 Courier transport type was calculated as trucks for Economy and Next Day and by air for Overnight, Same day and International.
Previously, emission factors were calculated using distance travelled.
20 Santam head office and Glacier waste data is provided by WasteWant and the data is split 89% and 11% respectively.
21 Waste to landfill includes food waste that is sent to landfill.
22 Emission factor for waste to landfill is sourced from Friedrich, E. and Trois, C., 2013. Note that the specific factor used is for
“landfill sites without gas collection and including carbon storage.”
Sanlam Group FY2020 Carbon Footprint Report | 12 March 2021 | Final version25 25
Km – avg. vehicle, unknown fuel 29 449.00 5.05
Km – van up to 3.5 t, unknown fuel 118.00 0.03
Total 390 694.00 67.19
Km – diesel < 1.7 235.00 0.03
Km – petrol < 1.4 litre 31 106.00 4.61
Km – diesel 1.7–2.0 litre 1 196.00 0.20
Business travel – rental cars
Km – petrol 1.4–2.0 litre 41 881.00 7.81
– Santam
Km – diesel > 2.0 litre 7 027.00 1.43
Km – petrol unknown size 600.00 0.10
Total 82 045.00 14.20
Km – domestic 314 619.16 76.86
Km – short-haul economy class 6 533 344.32 999.47
Km – short-haul business class 874 519.23 200.68
Business travel – flights23
Km – long-haul economy class 844 550.93 123.43
– Sanlam
Km – long-haul prem economy class 38 591.44 9.02
Km – long-haul business class 1 520 245.85 644.36
Total 10 125 870.93 2 053.82
Km – domestic 32 096.84 7.84
Km – short-haul economy class 1 428 758.53 218.57
Business travel – flights Km – short-haul business class 685 071.10 157.20
– Santam Km – long-haul economy class 118 874.10 17.37
Km – long-haul business class 8 392.89 3.56
Total 2 273 193.46 404.55
Bed nights in SA & Africa – Sanlam 7 622.00 491.62
Business travel – Bed nights outside of Africa – Sanlam 755.00 29.90
accommodation24 Bed nights in SA & Africa – Santam 2 635.00 169.96
Total 11 012.00 691.48
Km for EZ Shuttle – Sanlam 23 246.00 3.98
Km for Kwathlano – Sanlam 5 603.50 0.96
Business travel –
Km for On-Time – Sanlam 2 957.00 0.51
transfer/shuttle/chauffeur
Km for EZ Shuttle – Santam 52 435.00 8.99
Total 84 241.50 14.4425
Business travel – bus Km – Sanlam 28 780.0026 3.44
Km unknown vehicle – Sanlam 1 492 110.00 255.75
Travel claims Km unknown vehicle – Santam 984 397.41 168.73
Total 2 476 507.41 424.47
Employee commuting TCO2e/survey – Sanlam 1.8255027 5 957.53
23 An 8% uplift factor is included to account for non-direct routes and delays/circling. The impact of radiative forcing is also included.
24 A country-specific emission factor is now used, which significantly increases emissions from accommodation.
25 Emissions are estimated based on zones travelled using an emission factor for unknown vehicle and fuel. Data from both the
central data base and the individually booked transfers were included.
26 Travel in buses was calculated using Google Maps between origin and destination points provided.
27 Emissions per employee for Sanlam commuting was extracted from the 2018 commuting survey.
Sanlam Group FY2020 Carbon Footprint Report | 12 March 2021 | Final version26 26
TCO2e/survey – Santam 2.0217928 2 426.82
Total 8 384.34
Downstream leased assets –
Kilowatt hours – Sanlam Head Office 718 522.8829 732.89
tenant electricity
8.3. OUTSIDE OF SCOPES: EMISSIONS FROM GHG EMISSIONS NOT COVERED BY THE KYOTO PROTOCOL
The GHG Protocol methodology was developed to report on all GHGs that were identified under the
Kyoto Protocol. Outside of Scopes emissions include, among others, GHGs that are not incorporated
under this agreement, as they are presumed to have been phased out under the Montreal Protocol. In
South Africa, certain GHGs which are not part of the Kyoto Protocol, such as HCFC22 (Freon a.k.a. R22),
and are therefore considered Outside of Scopes, continue to be used as gas refills in air-conditioning and
refrigeration equipment.
Sanlam Group reported little air-conditioning and refrigeration gas refills. Only 10.9 kg of R410a at
Auckland park was reported.
Sanlam Group did not report or record usage of zero kilograms of R22 Freon gas refills during the
reporting year.
8.4. WATER CONSUMPTION
The incorporation of water consumption is recommended as an awareness-raising tool. Total water
consumed by Sanlam Group in FY2020 was 112 721 kilolitres. Table 8 provides a breakdown of municipal
water consumption in FY2020.
28Emissions per employee for Santam commuting was extracted from the 2018 commuting survey.
29Tenant electricity was calculated using the balance of kilowatt hours from the Sanlam unoccupied portion of Sanlam Head
Office – 3.118 % of the total 23 044 712.50 kWh’s.
Sanlam Group FY2020 Carbon Footprint Report | 12 March 2021 | Final version27 27
Table 8: SANLAM GROUP’S WATER CONSUMPTION IN KILOLITRES, FY2016–FY2020 – ADJUSTED
FY2014
Location/Type FY2015 FY2016 FY2017 FY2018 FY2019 FY2020
Baseline
Sanlam Head Office 33 020 30 32 25131 117 25332 81 14233 73 43234 68 12435 51 37636
Sanlam Sky 12 378 9 408 6 612 7 744 18 263 21 86337 3 157
SANLAM
Sanlam Investments 5 580 5 174 11 619 7 585 5 448 4 405 3 200
Alice Lane 837 8 159 14 376 20 897 25 905 24 868 23 301
Glacier 9 985 5 411 5 824 3 058 3 931 4 028 2 146
Sanlynn 5 218 4 918 3 804 4 934 547 1 595 887
Hyde Park 10 303 Closed Closed Closed Closed Closed Closed
Total 77 320 65 322 159 488 125 360 127 527 124 881 84 068
Santam Head Office 10 290 33 449 13 478 6 125 4 642 7 980 3 884
Santam Auckland Park 19 575 18 876 33 662 33 663 18 257 25 388 9 190
Santam Garsfontein 1 835 1 370 1 587 1 404 2 408 2 158 1 256
SANTAM
Santam Alice Lane - 4 466 5 557 7 797 12 947 12 515 11 767
Santam Glacier - 2 429 2 239 2 072 1 653 1 689 902
Illovo 5 622 Closed Closed Closed Closed Closed Closed
Total 37 323 60 588 56 523 51 061 39 907 49 731 26 999
GRAND TOTAL 114 643 125 910 216 011 176 421 167 434 174 612 111 067
Carbon associated with water consumption can be calculated relative to the electricity consumed by a
water utility to pump water to the reporting organisation. The most reasonable South African-specific
emission factor is one supplied by eThekwini Municipality. It is not included in this footprint due to
historical reporting and the emission factor is specific and localised. However, should the carbon have
been calculated using this emission factor, Sanlam Group would have emitted an additional 106 tonnes
of CO2e at 100%, which is not material to the Carbon Footprint Report.
30 The water data for Sanlam Head Office for 2014 is incorrect as there was an error in billing. The consumption has only been included
to align the totals. Water represents only 94.14% of Sanlam Head Office, as ascribed to Sanlam occupancy of building.
31 The water data for Sanlam Head Office for 2015 is incorrect as there was an error in billing. The consumption has only been included
to align the totals. 94.14% of Sanlam Head Office, as ascribed to Sanlam occupancy of building.
32 The original water data for Sanlam Head Office for has been restated from 33 396 to 117 253 kl. Sanlam Head Office water is at
94.14% building occupancy. Water at 100% occupancy would have been 124 552 kl.
33 Sanlam Head Office water is at 97% building occupancy. Water at 100% occupancy was 83 652 kl, totalling 127 870 kl for Sanlam.
34 Sanlam Head Office water is at 96.79% building occupancy. Water at 100% occupancy was 75 865 kl, totalling 129 960 kl for Sanlam.
35 Sanlam Head Office water is at 9% building occupancy. Water at 100% occupancy was 70 231 kl, totalling 126 988 kl for Sanlam.
36 Sanlam Head Office water is at 96.88% building occupancy. Water at 100% occupancy was 53 030 kl, totalling 112 721 kl for Sanlam.
37 In 2018 a leak was detected underground, which was fixed. The number of students that visited the Training and Development
Building from all over the country also increased dramatically, leading to more water usage.
Sanlam Group FY2020 Carbon Footprint Report | 12 March 2021 | Final version28 28
9. ILLUSTRATED SUMMARY
9.1. ILLUSTRATED OVERVIEW OF RESULTS OF EMISSIONS BY SCOPE FOR SANLAM GROUP IN FY2020
Table 9: SUMMARY OF SANLAM GROUP’S EMISSIONS BY SCOPE IN FY2020
Metric tonnes of CO2e
Description Sanlam Sanlam Sanlam Group Sanlam Group
Santam
(100%) (% share) (100%) (% share)
Scope 1 380.68 376.73 1 263.36 1 644.05 1 640.09
Scope 2 27 213.00 27 213.00 5 937.38 33 150.38 33 150.38
Scope 3 12 930.93 12 671.94 3 926.66 16 857.59 16 598.60
Outside of Scopes N/R N/R N/R N/R N/R
Grand total 40 524.62 40 261.67 11 127.41 51 652.03 51 389.08
3%
64% Scope 1
33%
3% Scope 2
Scope 3
32%
65% Outside of Scopes
Figure 3: Sanlam Group’s emissions in tonnes of CO2e by Scope in FY2020
Note: The outside of the graph and the legend represents emissions at 100%. The inside of the graph is
emissions under operational control – percentage share - within the reporting boundary.
Sanlam Group FY2020 Carbon Footprint Report | 12 March 2021 | Final version29 29
3 000
2 480
2 500
2 000
1 724
1 500
1 000 893
619
500
220
-
Santam HO Auckland Park Garsfontein Alice Lane Glacier
Figure 4: Santam’s Scope 2 emissions by region in tonnes of CO2e in FY2020 at 100%
25 000
22 773
20 000
15 000
10 000
5 000
1 776
787 757 524 595
-
Sanlam HO Houghton Sky SIM Alice Lane Glacier Sanlynn
Figure 5: Sanlam’s Scope 2 emissions by region in tonnes of CO2e in FY2020 at 100%
Sanlam Group FY2020 Carbon Footprint Report | 12 March 2021 | Final version30 30
1% 1% Office paper
19% Policy Paper
T&D
Courier
1% 1%
Waste generated
20% 1%
1% Car Rentals
50% 1% 1%
51% 1% Air Travel
14% Accommodation
4%
4%2% Travel claims
15% Shuttle & bus
Tenant electricity
4% Commuting
4% 3%
Figure 6: Sanlam Group’s Scope 3 emissions in tonnes of CO2e in FY2020 at 100% (outside) and
percentage share (inside)
Sanlam Group FY2020 Carbon Footprint Report | 12 March 2021 | Final version31 31
10. COMPARISON OF EMISSIONS AND INTENSITY
Inclusive of this CFR, Carbon Calculated has worked with Sanlam Group for thirteen years. The aim has
been to collect the most detailed and accurate data possible and to further extend the operational and
organisational boundary. Table 10 provides a comparison of Sanlam Group’s carbon footprint over the
last seven years of reporting (FY2014–FY2020)38. As a result of the COVID-19 pandemic, FY2020GHG
emissions decreased notably. For further details on the impact of COVID-19, refer to Section E.
Table 10: COMPARISON OF SANLAM GROUP’S EMISSIONS OVER 7 YEARS (FY2014–FY2020) AT
PERCENTAGE SHARE
FY2014
Activity FY2015 FY2016 FY2017 FY2018 FY2019* FY2020
Baseline
Total Scope 1 138 164 488 259 163 2 391 1 640
Total Scope 2 –
46 117 43 826 44 240 42 113 38 023 41 352 33 150
purchased electricity
Total Scope 1 & 2 46 255 43 990 44 728 42 372 38 186 43 743 34 790
Total Scope 3 20 742 23 934 26 681 23 926 37 78439 41 086* 16 599
Total Scope 1, 2 & 3 67 079 67 924 71 408 66 298 75 969 84 829* 51 389
Outside of Scopes 82 35 138 82 127 N/R N/R
Grand Total 67 079 67 959 71 546 66 380 76 096 84 829* 51 389
N/R = Not reported * Restated due to change in metrics and therefore % share
10.1. EMISSIONS INTENSITY
It is useful to compare year-on-year emissions in terms of emission intensities, e.g., total emissions per
FTE, m2, production and EBITDA/revenue/turnover. For the purposes of benchmarking with other
companies in the relevant sector, intensity figures based on Scope 1 and Scope 2 emissions are generally
used. This is because these scopes are compulsory for reporting, while Scope 3 categories are reported
at the discretion of the reporting company. Table 11 provides metrics and intensity values for Sanlam
Group over seven years.
38 Carbon data for earlier years can be viewed in previous carbon footprint reports.
39 Accommodation and flights were restated in FY2019 for FY2018 decreasing emissions from 38 767 to 37 784 tCO2e.
Sanlam Group FY2020 Carbon Footprint Report | 12 March 2021 | Final version32 32
Table 11: COMPARISON OF SANLAM GROUP’S EMISSIONS AND INTENSITY OVER 7 YEARS (FY2014–
FY2020) AT PERCENTAGE SHARE
FY2014
Intensity indicators FY2015 FY2016 FY2017 FY2018 FY201940 FY2020
Baseline
Full-time employees 9 929 10 284 11 117 10 899 14 89641 15 256* 14 950
FTEs covered by report 7 823 8 102 8 368 7 967 8 543 10 797* 11 454
Square metreage (m2) 161 389 N/R 167 833 170 268 170 246 175 533* 172 488
Scope 1 & 2 46 255 43 990 44 728 42 372 38 186 43 743 34 790
Scope 1 & 2 CO2e/FTE 5.913 5.430 5.345 5.318 4.470 4.051 3.037
Scope 1 & 2 tCO2e/m2 0.287 N/R 0.267 0.249 0.224 0.249 0.202
Scope 1, 2 and 3 66 997 67 924 71 408 66 298 75 969 84 829* 51 389
Scope 1, 2 & 3 tCO2e/FTE 8.564 8.384 8.533 8.322 8.893 7.857* 4.487
Scope 1, 2 & 3 tCO2e/m2 0.415 N/R 0.425 0.389 0.446 0.483* 0.298
Total emissions incl. OOS 67 079 67 959 71 546 66 380 76 096 84 829* 51 389
Total tCO2e/FTE 8.575 8.388 8.550 8.332 8.907 7.857* 4.487
2
Total tCO2e/m 0.416 N/R 0.426 0.390 0.447 0.483* 0.298
kWh of purchased
44 773 463 43 391 724 44 239 507 42 971 916 40 023 670 39 762 404 32 500 377
electricity
kWh/FTE 5 723 5 356 5 287 5 394 4 685 3 683* 2 837
kWh/m2 277 N/R 264 252 235 227* 188
50000
45000
40000
FY2014
35000
FY2015
30000
FY2016
25000
FY2017
20000 FY2018
15000 FY2019
10000 FY2020
5000
0
Scope 1 Scope 2 Scope 3 Outside of Scopes
Figure 7: Sanlam Group’s comparative emissions between years (FY2014-FY2020) by Scope at
percentage share
40
FTEs in FY2019 have been restated from 9 010 to 10 797, total employees from 15 401 to 15 256 (excluding
international employees) and area from 167 427 to 175 533m2.
41
The information regarding the number of full-time employees is sourced from HR, which excludes international
employees and field workers.
Sanlam Group FY2020 Carbon Footprint Report | 12 March 2021 | Final version33 33
50 000 46 117
43 826 44 240
45 000 42 113 41 353
40 000 38 023 FY2014
35 000 33 150 FY2015
30 000 FY2016
25 000 FY2017
20 000
FY2018
15 000
FY2019
10 000
FY2020
5 000
0
Scope 2
Figure 8: Sanlam Group’s Scope 2 emissions by year (FY2014-FY2020) in tonnes of CO2e at percentage
share
11. SANLAM GROUP INTEGRATED INFORMATION
11.1. ENERGY AND WATER EFFICIENCY MEASURES INSTALLED OR PLANNED DURING THE REPORTING
YEAR
Due to COVID-19, few energy or water efficiency measures have been undertaken during the reporting
year apart from:
Installation Powerstar smart meters at a few more sites.
One Chiller in the Main Building was replaced with an energy efficient unit that no longer uses
R22. The Energy reduction reduced from 450kW to 150kW for the same output Cooling Capacity
and in winter a further saving of 500 kW is achieved due to the lack of resistive heating in the air
handling units.
Belville Data Centre is planning an entirely new HVAC system which will be more energy
efficient. This should yield a 200kW reduction in energy once fully operational.
11.2. INFORMATION ON OFFSETS AND RENEWABLE ENERGY
Sanlam Group has not offset GHG emissions through the purchasing of a carbon offsetting mechanism.
Sanlam Group FY2020 Carbon Footprint Report | 12 March 2021 | Final version34 34
Sanlam Head office has small solar panels on the roof that are insignificant and therefore not measured.
It is strictly for the purpose of disaster recovery.
11.3. VERIFICATION OF GHG INVENTORY
Sanlam has obtained limited assurance from Verify CO2 on the data and emissions for Scope 1, 2 and
Scope 3. Refer to Appendix E for the verification statement.
Emissions under the operational control of Sanlam Group is based on percentage GLA occupied in
Sanlam Head Office and Group data to represent only full-time employees that fall within the reporting
boundary. As these directly impact the total carbon reported, these metrics were also verified during
the reporting year. The international employees were excluded from the calculations as they were
outside the reporting boundary. Historically they were included in the calculations for total employees.
There were 159 international employees excluded during FY2020.
11.4. REPORTING IMPROVEMENTS
Sanlam Group has improved its reporting from FY2019 to FY2020 by implementing the following
measures:
Funeral car data included litres, which are more accurate than kilometres in terms of reporting.
All data was provided as a full year rather than a split by quarter. This reduced the risk of human
error when combining sheets with different formats.
Event Dynamics flights included cabin class travelled, resulting in more accurate reporting of
emissions for air travel.
Courier travel type (i.e., packages transported by air or truck) was included in the data to enable a
split by mode of transport rather than assumed by the distance travelled.
Area and employee data was verified externally, which resulted in restating of area for FY2019 and
improved accuracy of intensity metrics in FY2020.
Sanlam Group FY2020 Carbon Footprint Report | 12 March 2021 | Final versionYou can also read