Brain Size: A Global or Induced Cost of Learning?
←
→
Page content transcription
If your browser does not render page correctly, please read the page content below
Original Paper

                                                       Brain Behav Evol 2009;73:111–128                                Received: September 7, 2008
                                                                                                                       Returned for revision: October 6, 2008
                                                       DOI: 10.1159/000213647
                                                                                                                       Accepted after revision: January 19, 2009
                                                                                                                       Published online: April 22, 2009

Brain Size: A Global or Induced Cost of
Learning?
Emilie C. Snell-Rood a Daniel R. Papaj a Wulfila Gronenberg b
a
 Department of Ecology and Evolutionary Biology and b Arizona Research Laboratories, Division of Neurobiology,
University of Arizona, Tucson, Ariz., USA

Key Words                                                                    in learning and memory in other insects, was volume at
Mushroom body ⴢ Brain size ⴢ Antennal lobe ⴢ Learning ⴢ                      emergence related to learning or host-finding. Butterfly
Butterfly ⴢ Pieris rapae                                                     families that emerged with relatively larger mushroom bod-
                                                                             ies showed a greater tendency to improve their ability to
                                                                             find red hosts across the two days of host-search. The vol-
Abstract                                                                     ume of most brain regions increased with time in a manner
The role of brain size as a cost of learning remains enigmatic;              suggesting host experience itself was important: first, total
the nature and timing of such costs is particularly uncertain.               number of landings during host-search was positively relat-
On one hand, comparative studies suggest that congenitally                   ed to mushroom body calyx volume, and, second, experi-
large brains promote better learning and memory. In that                     ence with the red host was positively related to mushroom
case, brain size exacts a global cost that accrues even if learn-            body lobe volume. At the family level, the relative volume of
ing does not take place; on the other hand, some develop-                    the mushroom body calyx and antennal lobes following
mental studies suggest that brains grow with experience,                     learning was positively related to overall success in finding
indicating a cost that is induced when learning occurs. The                  red hosts. Overall, our results suggest that within species,
issue of how costs are incurred is an important one, because                 brain size might act as a small global cost of learning, but
global costs are expected to constrain the evolution of learn-               that environment-specific changes in brain size might re-
ing more than would induced costs. We tested whether                         duce the overall costs of neural tissue in the evolution of
brain size represented a global and/or an induced cost of                    learning.                         Copyright © 2009 S. Karger AG, Basel
learning in the cabbage white butterfly, Pieris rapae. We as-
sayed the ability of full sibling families to learn to locate ei-
ther green hosts, for which butterflies have an innate search
bias, or red hosts, which are more difficult to learn to locate.                 Introduction
Naïve butterflies were sacrificed at emergence and congen-
ital brain volume estimated as a measure of global costs; ex-                   Brain size has been hypothesized to be an important
perienced butterflies were sacrificed after learning and                     factor in the evolution of learning [reviewed in Johnston,
change in brain volume estimated as a measure of induced                     1982; Dukas, 1998]. Neural tissue is metabolically expen-
costs. Only for the mushroom body, a brain region involved                   sive [Laughlin et al., 1998]; if more neural tissue is re-

                          © 2009 S. Karger AG, Basel                         Emilie C. Snell-Rood
                                                                             Department of Biology, Indiana University
Fax +41 61 306 12 34                                                         915 E. Third St.; Myers Hall, Rm 150
E-Mail karger@karger.ch   Accessible online at:                              Bloomington, IN 47405 (USA)
www.karger.com            www.karger.com/bbe                                 Tel. +1 812 856 1783, Fax +1 812 855 6705, E-Mail emcsnell@indiana.edu
quired to learn and remember, then the cost of such tissue in Tramontin and Brenowitz, 2000; Sherry, 2006]. In-
might constrain the evolution of learning. There is some creases in neural investment are also associated with rear-
evidence that better learning requires a larger brain rela- ing in complex or activity-promoting environments [e.g.,
tive to an ancestor. For example, comparative studies Nilsson et al., 1999; Scotto-Lomassese et al., 2000; re-
across vertebrates suggest a consistent linkage between viewed in van Praag et al., 2000; Cotman and Berchtold,
learning ability and the relative size of brains or brain re- 2002] or with learning itself [Clayton and Krebs, 1994].
gions. Spatial learning capacity is linked to hippocampus We know of no study that has tried to assess the rela-
size in birds and mammals [e.g., reviewed in Sherry et al., tive importance of congenital brain size simultaneously
1992; Basil et al., 1996; Healy and Krebs, 1996], and song with induced brain size as costs in the evolution of learn-
learning ability in birds is linked to the volume of song ing. In this study, we sought to make this assessment with
control regions of the brain [e.g., DeVoogd et al., 1993; respect to host-learning in ovipositing butterflies. We ad-
Brenowitz et al., 1995; reviewed in DeVoogd, 2004]. Sev- opted a family-level approach in which full-sib families
eral comparative studies of insects also suggest that the of butterflies were reared, mated and provided egg-laying
size and complexity of brain regions such as the mush- experience with host plants in a semi-natural setting.
room bodies are linked with the evolution of feeding be- Such a family-level approach offered several advantages.
haviors that might involve learning [Sivinski, 1989; Farris First, a link found between learning and brain size with-
and Roberts, 2005]. in species can more reasonably be considered to reflect
Theory suggests that the costs of brain size might dif- cause and effect than with species comparisons. Infer-
ferentially affect the evolution of learning, depending on ence in phylogenetic studies is necessarily constrained by
how such costs are incurred. If increases in learning abil- the multitude of factors that could have changed between
ity require corresponding increases in congenital brain species in the time since their most recent common an-
size – investment even before learning takes place – the cestor. Any number of these factors could be driving a
associated costs of that increased neural investment will correlation between learning and brain size. Second, the
be high. Such global costs are paid in all environments family-level approach, as applied here, can give us an es-
and contexts, regardless of how much learning actually timate of the amount of genetic variation in extant popu-
takes place [Johnston, 1982; Dukas, 1998; e.g., Pitnick et lations in brain size and brain development. The struc-
al., 2006; Isler and van Schaik, 2006a, b]. This means that ture of variation can inform us regarding how learning
a cost of learning might sometimes be paid even when the ability and associated brain traits might evolve under se-
benefits of learning are not realized. In contrast, costs of lection. Finally, the family-level approach was used for an
learning might not be global, but rather induced in spe- important logistical reason. For insects as small as but-
cific environments. If relatively large brains or brain terflies, we presently lack a non-destructive technique by
components could be produced only in environments or which to assess brain size before learning. By splitting
contexts in which learning has benefits (a ‘pay as you go’ full-sib families into groups whose brain size at emer-
pattern of investment), the cost of brain size could be gence was estimated and groups whose learning ability
greatly reduced, and learning consequently more likely to was assayed, we were able to estimate a correlation be-
evolve and be maintained [Tollrain, 1995; DeWitt et al., tween learning ability and congenital brain size.
1998]. We addressed the question of learning and brain size
Studies of vertebrate and invertebrate species alike using host-learning in butterflies. Butterflies possess in-
suggest that neural tissue increases in volume over the nate biases to search for and use host and nectar resourc-
course of experience, suggesting that neural tissue itself es, but they also have the capacity to learn to recognize,
could also act as an induced cost. For instance, the mush- locate, and physically manipulate additional host plants
room bodies, regions of the insect brain involved in sen- and nectar sources [reviewed in Papaj and Prokopy, 1989;
sory integration and learning [reviewed in Strausfeld et Traynier, 1984, 1986; Lewis, 1993; Papaj and Lewis, 1993;
al., 1998; Zars, 2000], show increases in size and complex- Hern et al., 1996; Kandori and Ohsaki, 1996; Papaj, 2003].
ity that are in part coincident with, but also dependent on, Host cues such as color, shape, size, and odor are learned
learning and experience [Withers et al., 1993, 2007; through a trial-and-error process, in which individual
Gronenberg et al., 1996; Fahrbach et al., 1998; Farris et al., butterflies sample plants by landing on them and identi-
2001; Ismail et al., 2006]. Similarly, in vertebrates, regions fying them as hosts or non-hosts through contact chemo-
of the brain involved in spatial and song learning show reception [reviewed in Courtney, 1986; Renwick and
changes in size that coincide with seasonal use [reviewed Chew, 1994; Hern et al., 1996].
112 Brain Behav Evol 2009;73:111–128 Snell-Rood /Papaj /GronenbergWe specifically evaluated host-learning in adults of Materials and Methods
the cabbage white butterfly, Pieris rapae. The life history
Overview of Experimental Design
and diet of this species allowed us to raise enough indi- Female butterflies were collected from populations in six
viduals from a genetic unit (family of full siblings) to de- states across the United States. Offspring were collected and
termine whether learning is correlated either with brain reared on an artificial diet under controlled conditions using es-
size at emergence or brain size following learning. Pieris tablished methods [Troetschler et al., 1985; Webb and Shelton,
rapae and the closely related Pieris brassicae are innately 1988; Snell-Rood and Papaj, in press]. In our first experiment,
siblings were allocated upon emergence to independent treatment
biased to search for green hosts, but can learn to associate groups. One group was sacrificed at emergence, and the heads
other colors with the presence of glucosinolates, phyto- fixed and preserved at that time for later analysis. Four other
chemicals that are found in their hosts, members of the groups were transported to greenhouse cages for two days of ex-
plant family Brassicaceae [Kolb and Scherer, 1982; Hern perience with other butterflies, including mating, and with non-
et al., 1996]. host flowering plants, before being allowed to search for hosts.
Individual butterflies were then allowed to search for at least 2 h
Several regions of the butterfly brain are thought to be for hosts (either red or green hosts in either a simple or complex
important in learning to locate host plants. First, learning non-host environment) over two consecutive days, after which
itself is thought to involve the mushroom bodies, central they were sacrificed and their head preserved for later analysis.
multi-sensory brain components that have been shown to Butterflies were sacrificed 4–6 h following their final host experi-
play a critical role in the integration of different cues and ence; during this time they were held in a small flight cage with
access to honey water, and then transported from the greenhouse
in insect learning more specifically [Strausfeld et al., at roughly 4 ° C.
1998; Zars, 2000; Huerta et al., 2004]. The mushroom In a subsequent experiment that focused on color learning and
body calyces receive input from sensory areas, especially energy allocation [‘Experiment 2’; Snell-Rood and Papaj, in press],
olfactory regions [Strausfeld et al., 1998], but also some- we also collected brains from butterflies at emergence and just
times visual regions [Mobbs, 1982; Gronenberg, 2001]. prior to learning (the primary focus of the experiment precluded
collecting brains following learning). Using these brains, we ad-
The principal mushroom body neurons, the Kenyon cells, dressed two additional questions. First, we included both red and
project from the calyces to the mushroom body lobes, green non-hosts in the learning assay to determine whether cor-
where they subsequently synapse with output neurons relations between brain size at emergence and learning were due
connecting to other regions of the brain [although there to color learning per se. Color choice could be assayed as the pro-
are also some inputs into the lobes; Strausfeld et al., 1998; portion of non-host landings on green non-hosts (versus red non-
hosts). Second, we sacrificed butterflies both at emergence and
Farris and Sinakevitch, 2003]. Second, learning to locate just prior to learning (following two days of experience in the
host plants also relies on sensory and motor regions of the greenhouse without hosts) to try to assay the degree of develop-
brain. Olfactory and visual cues, both important in but- mental changes in brain size that were dependent on host-learn-
terfly host-search [Courtney, 1986; Renwick and Chew, ing.
1994; Hern et al., 1996], are processed in sensory input
Measurement of Learning Ability
regions, in particular the antennal lobe (olfaction) and Host-Search Behavior and Its Quantification. A butterfly’s
the optic lobes (the visual centers of the lamina, medulla learning sequence was constructed based on observations of tar-
and lobula; see figure 1a–d). In addition, motor coordina- sal drumming and oviposition on host and non-host plants. Host-
tion is important for locating specific plants during host- search is characterized by a stereotypical pattern of fluttering
search (e.g., through hovering, rapid turning). Hence, our flight interspersed by landings on foliage. Upon landing, a female
typically drums her foretarsi, a behavior thought to be associated
study also included the central body, a region of the insect with contact chemoreception using tarsal receptors. If the plant is
brain presumed to be important in motor control and a non-host, a female invariably takes flight and resumes search. If
coordination [Strauss and Heisenberg, 1993; Strausfeld, the plant is a host, females might or might not lay a single egg be-
1999], visual learning [Liu et al., 2006] and spatial orien- fore taking flight and resuming the search.
tation [Heinze and Homberg, 2007]. We predicted that Learning was measured as a function of host-finding efficien-
cy, the proportion of hosts chosen over all landings during a par-
within the butterfly species P. rapae, a family’s brain size ticular time interval. Host-finding efficiency was measured in re-
and mushroom body size at emergence would be corre- lation to bins of ten landings in order to define the time course of
lated with learning ability (global costs). We also predict- changes in host-finding efficiency. As an example, a butterfly that
ed that several brain regions important in learning to made 5 host landings would receive, for that bin of ten landings,
a host-finding efficiency score of 0.5 (5/10); the greater the pro-
locate hosts – sensory, motor, and integrative regions –
portion, the more successful a female was in discriminating hosts
would show specific responses to the host-learning expe- from non-hosts before landing. Learning was inferred as an im-
rience (induced costs). provement in host-finding efficiency over time. ‘Within-day’
change was measured as the difference in behavior between the
Brain Size: A Global or Induced Cost of Brain Behav Evol 2009;73:111–128 113
Learning?first and second set of ten landings on the first day of learning. tions with brain size) was due in part to color learning [Snell-
‘Between-day’ change was measured as the difference in behavior Rood and Papaj, in press]. We used red and green varieties of the
between the first ten landings over the two days of learning. We same host species (cabbage, Brassica oleracea var. capitata: Bras-
also measured total fitness as the number of total hosts located sicaceae); we used red and green varieties of non-hosts to assay the
while controlling for the number of total landings during host- colors to which females were attending during host-search. In this
search (over both days of learning). experiment, four families were first-generation full sibling groups
In the subsequent Experiment 2, learning was measured as a originating from field-collected females from two populations
function of color choice, defined as the proportion of green non- (NY, Southern CA); three lines originated from laboratory-reared
hosts chosen over red non-hosts during a particular time interval. third-generation offspring derived from several field-collected
As an example, a butterfly that made 3 landings on green non- females from two populations (AZ, northern CA). Butterflies
hosts and 2 landings on red non-hosts would receive a color choice searched for hosts (n = 8) within an array of non-hosts (n = 40).
score of 0.6 (= 3/5). Within- and between-day changes in color The simple non-host environment consisted of red and green va-
choice were measured as in Experiment 1, as the difference be- rieties of ligularia (Ligularia dentata: Asteraceae); the complex
tween the first and second bins of ten landings on day 1, and the treatment consisted of red and green varieties of ligularia, red and
difference between the first ten landings over the two days of green varieties of basil (Ocimum basilicum: Lamiaceae), red and
learning, respectively. Color learning was thus inferred as an in- green varieties of swiss chard (Beta vulgaris var. cicla: Amaran-
crease in the proportion of non-host landings that were made on thaceae), red and green species of oxalis (Oxalis stricta, O. rubra:
the same color as the host plant to which females were exposed Oxalidaceae), and red and green varieties of Ipomea vine (Ipomea
(positive values of changes in color choice = learning green; nega- batatas: Convolvulaceae). Color differences among hosts and
tive values of changes in color choice = learning red). non-hosts were verified using an Ocean Optics USB2000 spectro-
Because it is standard for proportional data, all measures of photometer with halogen light source and Spectralon reference
choice were arcsine-square root transformed prior to analysis. standard [Snell-Rood and Papaj, in press]. In this experiment,
Raw proportion values are presented in figures. brains from 19 individuals sacrificed at emergence were mea-
Learning Assays. Experiment 1 (June–September 2005), from sured. Additionally, six individuals were sacrificed following two
which the majority of the results come, was designed to assess days of experience (without hosts) in greenhouse cages, just prior
learning of two very different hosts. Butterflies were members of to when other butterflies started learning.
seven first-generation full-sibling families that originated from
females collected from five populations across the United States Measurement of Brain and Brain Region Size
(NV, MI, MA, northern and southern CA). Individuals from each Histology. Butterflies were decapitated, and heads prepared for
family were sacrificed at emergence or just after two successive fixation by removing antennae and mouthparts, and cutting a
days of host experience. After emergence, butterflies destined for hole in each eye to allow for the penetration of fixative. Heads
learning trials were kept for two days in a 1 m3 greenhouse cage were fixed in 4% formaldehyde in phosphate buffer (pH 6.9) for
with other butterflies and non-host nectar plants, and then al- 24 h and then transferred to cacodylate buffer and stored at 4 ° C
lowed to search for hosts for 2 h over each of two days in a 2 m tall until dissection.
! 4 m wide ! 4 m long greenhouse flight cage. Butterflies were Brains were dissected and stored in cacodylate buffer at 4 ° C
sacrificed (and fixed) 4–6 h following their final host experience; until staining. They were then impregnated in the dark with 1%
during this time they were held in a small flight cage with access aqueous osmium tetroxide solution for 2 h at 4 ° C and an addi-
to honey water, and then transported from the greenhouse at tional 30 min at room temperature, then rinsed with distilled wa-
roughly 4 ° C. ter (15 min) and dehydrated with 15 min rinses of 50% ethanol
We used a greenhouse array of live plants to assay host-learning and acidified 2,2-dimethoxypropane [Thorpe and Harvey, 1979],
as this design was both ecologically relevant, and encouraged a followed by two 15 min rinses of acetone. Brains were then em-
large enough number of butterflies to participate in learning tri-
als. A large sample size was crucial to obtaining information about
family-level effects. This experiment tested butterfly learning of
two hosts, one green in color (kale, Brassica oleracea var. viridis),
and one red (Barbarea vulgaris grown in the sun) that differed in
color, leaf shape and presumably chemical cues. Color differences
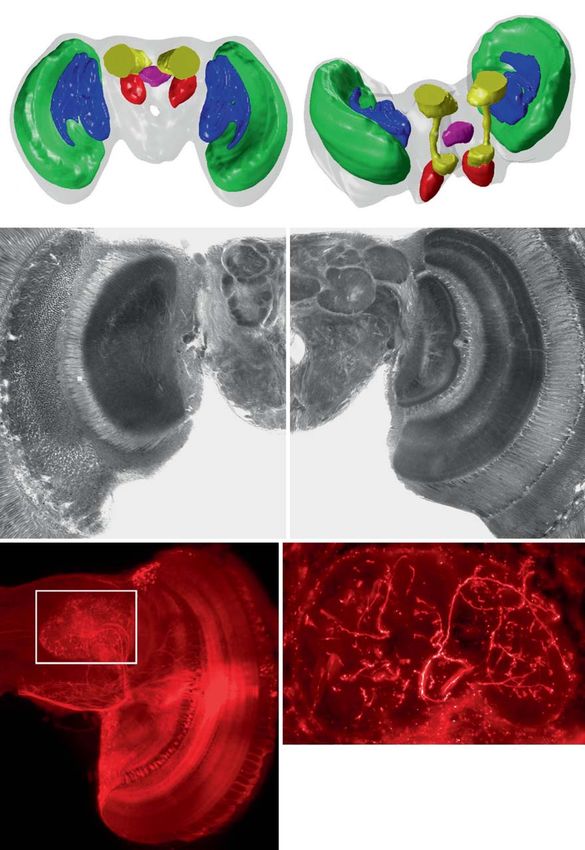
among hosts and non-hosts were verified using an Ocean Optics Fig. 1. Brain of Pieris rapae. a, b Three-dimensional graphical re-
USB2000 spectrophotometer with a halogen light source and construction (a dorsal view, b frontal view tilted sideways) incor-
Spectralon reference standard. In this experiment, butterflies had porating 41 drawings each representing 15 m; c, d Photomicro-
to learn to locate hosts in either a simple or complex non-host en- graphs (dorsal views) showing ventral (c) and dorsal aspects (d);
vironment. The simple environment contained eight hosts and each half image is a photomontage of 2–3 osmium-stained sec-
eight green non-hosts of one species (seep monkeyflower, Mimu- tions. e Photomicrograph showing neuronal processes labeled by
lus guttatus: Scrophulariaceae). The complex treatment contained tracer injection into the medulla/lobula transition zone. Inset
four hosts and 16 green non-hosts, four each of seep monkeyflow- (enlarged in f) reveals visual input fibers from the medulla termi-
er, creeping phlox (Phlox subulata: Polemoniaceae), window-box nating in the mushroom body calyx. al = Antennal lobe; ca =
wood sorrel (Oxalis rubra: Oxalidaceae), and white-veined Dutch- mushroom body calyx; cb = central body; es = esophagus; la =
man ’s pipe (Aristolochia fimbriata: Aristolochiaceae). lamina; lo = lobula complex; mbl = mushroom body lobes; me =
Experiment 2 (June–September 2006) was designed to test medulla; pe = mushroom body peduncle; pot = posterior optic
whether improvement in host-finding efficiency (and associa- tubercle; seg = subesophageal ganglion.
114 Brain Behav Evol 2009;73:111–128 Snell-Rood /Papaj /GronenbergColor version available online
ca
cb
me lo al ca
es
lo
me pe cb
seg
mbl
al
a b
Ia
mbl
pot
cb ca
al
Io
Ia me
me es
seg seg
250 μm
c d
ca
ca
me
f
Io
f 100 μm
250 μm
e
Brain Size: A Global or Induced Cost of Brain Behav Evol 2009;73:111–128 115
Learning?bedded in plastic (Spurr’s low viscosity medium, EMS, Hartfield, Body Size and Relative Brain (and Brain Region) Size
PA) by treating with 7:3 plastic:acetone for 12 h, followed by treat- The size of brain regions was measured relative to whole brain
ment with 100% plastic for 12 h. Blocks were polymerized at 65 ° C size by including whole brain volume as an independent variable
for 12 h, then serially sectioned at 10–15 m thickness on a slid- in every ANOVA that considered the size of a brain region (see
ing microtome. Sections were mounted and cover-slipped. tables 3–8). In analyses of whole brain volume, we included hind-
wing area as an independent variable to control for body size. We
Brain Regions and Measurements chose hindwing area as a proxy for body size after recording sev-
Brains were viewed with Nomarski interference contrast on a eral measures of body size for each individual. Wings were re-
Zeiss Axioplan microscope and images were photographed using moved and photographed with a macro lens (Canon EOS Digital;
a SPOT 2 digital camera (Diagnostic Instruments, Sterling 50 mm lens); the area of forewing and hindwing were measured
Heights, Mich., USA). A three-dimensional model of the brain using ImageJ. The legs of butterflies were photographed using a
(fig. 1a, b) was generated from traced brain outlines using a self- stereo microscope. The length of the tarsus on each leg was mea-
compiled MatLab routine (Mathworks, Natick, Mass., USA). sured and averaged across the fore-, mid-, and hind-tarsi. Finally,
We measured the brain and brain regions using ImageJ soft- the dry mass of the thorax was weighed to the nearest 0.1 mg. A
ware (NIH). All regions except the central body (which was mea- principal components analysis on a subset of the individuals (n =
sured in its entirety) were measured in one hemisphere only (thus 68) revealed that all measures of body size were highly correlated:
final volume estimates were multiplied by two). The mushroom the first principal component explained 57.9% of the variance
bodies, central body, and antennal lobe (see fig. 1) were traced among forewing area, hindwing area, tarsus length, and thorax
from every section when present. The medulla and whole brain mass (relative loadings: 0.62, 0.61, 0.25, 0.42, respectively). Be-
were traced from every other section as they were present in al- cause hindwing area was highly correlated with mass and tarsus
most all sections for each individual (on average 40 sections per length, and was least likely to be damaged on experienced butter-
individual; thus final volume estimates were multiplied by two). flies, it was adopted as the proxy for body size in our analysis.
The antennal lobes were measured as the sum of the volumes of
glomeruli only. For a given section, the volume of each region was Analyses
estimated as the area in the section times the section thickness. JMP 7 (SAS Institute) was used for all analyses. First, for Ex-
This protocol [Mares et al., 2005] generates volume data as accu- periment 1, we performed several analyses to test for changes in
rate as those of the ‘Cavalieri’ method, a standard morphometric behavior over time, as in Snell-Rood and Papaj [in press]. We used
technique in vertebrates [Gundersen and Jensen, 1987; Michel t tests to determine whether host-finding efficiency changed sig-
and Cruz-Orive, 1988]. nificantly over time (i.e., whether the difference in behavior be-
Much of our analysis focused on measurements of the mush- tween two time bins was significantly different from zero). We
room bodies which play a role in insect learning [Strausfeld et al., used ANOVA to test whether host color and non-host complexity
1998; Zars, 2000; Huerta et al., 2004]. The mushroom bodies of had effects on host-finding efficiency for each time bin consid-
Pieris consist of the calyx, consisting of two fused saucer-like ered. We restricted this latter analysis to only those individuals
structures located posterior and dorsal in the butterfly brain, and that had participated for at least 20 landings on day 1 and 10 land-
the anteriorly-located lobes [Nordlander and Edwards, 1968; ings on day 2 of host-search; such participation criteria minimize
Pearson, 1971; Ali, 1974]. These two parts are connected by a thin the confounding effects of population-level (instead of individu-
stalk, which can be seen in figure 1b, but which was not included al-level) changes in behavior over time.
in our measurements because of its small size. Our measurements Second, we performed family-level analyses of brains and be-
focused on the calyces and the lobes, which were the most easily havior. A family’s brain size was estimated as the least-square
delineated parts of the mushroom body. Mushroom body lobes mean from ANOVA models that controlled for body size (in the
have several parts in the Lepidoptera [e.g., alpha, beta, gamma; case of whole brain size) or whole brain size (in the case of brain
Pearson, 1971; Ali, 1974], but are not easy to discriminate, thus we region size). We estimated a family’s learning and behavior from
measured the lobes together. ANOVA models, as described in Snell-Rood and Papaj [in press].
The calyx receives prominent olfactory input in most insects Briefly, mixed model ANOVAs were constructed, where ‘host col-
[Strausfeld et al., 1998]. To test whether the Pieris calyx also re- or’ and ‘non-host complexity’ were treated as fixed effects, and
ceives visual input, as in other species in which visual learning is ‘family’ and ‘host color by family’ were treated as random effects
important [for example, members of Order Hymenoptera; Mobbs, [Fry, 1992]. We used least-square means of the ‘host color by fam-
1982; Gronenberg, 2001], we labeled visual neurons in the me- ily’ interaction to estimate host-finding efficiency and color
dulla using fluorescent tracer (fluoro-ruby; Invitrogen, Carlsbad, choice specific to each environment (in Experiment 1 and 2, re-
Calif., USA). The head capsule was opened above the medulla, spectively). Because these analyses were performed at the family
and tracer then applied to the exposed tissue using a glass micro- level, power in statistical tests was greatly reduced, despite mea-
electrode covered with a few tiny tracer crystals. The tracer was surement of over 85 individual brains; thus, we consequently at-
then allowed to diffuse into the tissues of the live butterfly for tach weight to p values as high as 0.10.
4–8 h, after which the animal was killed and the brain removed, Finally, we used ANOVA to determine the effects of experi-
fixed, plastic-embedded and sectioned as described above. Visual ence on brain size. In these analyses, we compared brains from
input neurons (fig. 1e, f) were photographed (Spot 2 camera) us- individuals sacrificed at different time points, or the effects of
ing conventional fluorescence microscopy and dichroic excita- experience (e.g., host color, number of landings) on brain size fol-
tion/emission filters appropriate for fluoro-ruby. To reveal neu- lowing host experience.
rons in their entirety, individual images were merged using Pho-
toshop 5 software (Adobe, San Jose, Calif., USA).
116 Brain Behav Evol 2009;73:111–128 Snell-Rood /Papaj /GronenbergTable 1. Changes in host-finding performance over time
Green host Red host Green host Red host
0.8
simple complex simple complex 0.7 * * *
0.6
Within day 1 t32 = 7.10*** t29 = 3.06** t36 = 4.69*** t40 = 6.33***
Between days t27 = 3.78** t28 = 2.22* t34 = 4.67*** t29 = 4.03** 0.5
0.4
* p < 0.05; ** p < 0.01; *** p < 0.0001.
0.3
0.2
0.1
Proportion of landings on hosts
0
Results 1–10 11–20 1–10 11–20
Day 1 Day 2
The Brain of Pieris rapae
The antennal lobes (glomeruli only) of the Pieris rapae
brain were rather small in size (0.007 mm3 on average,
1.5% of the total brain volume; Appendix 1), despite the Simple Complex
0.9
importance of olfactory cues in host plant and nectar
plant use. In contrast, the size of the visual system (the
0.8 * * * *
0.7
lamina, medulla and lobula complex; fig. 1c, d; only the
0.6
latter two are rendered in fig. 1a, b) greatly surpasses that
0.5
of other sensory neuropiles or even the entire central
brain for P. rapae; the size of the medulla alone averaged 0.4
0.19 mm3 (almost half of the size of the average whole 0.3
brain, 0.47 mm3; Appendix 1). The central body was the 0.2
smallest brain component examined (at 0.002 mm3, 0.1
fig. 1a, b, d; Appendix 1). 0
1–10 11–20 1–10 11–20
The mushroom bodies were of moderate size in P. ra- Day 1 Day 2
pae: the calyces and vertical lobes averaged 0.007 mm3
and 0.004 mm3, respectively; together, the mushroom
bodies took up about 2.4% of the total brain volume. We
Fig. 2. Host-finding efficiency among bins of ten landings. Host-
found that, besides massive olfactory input [Strausfeld et finding efficiency was measured as the proportion of landings (in
al., 1998], the P. rapae calyx also receives visual input, as bins of ten total landings) that were on host plants. Host-finding
revealed by the tracer injections (fig. 1e, f). This particu- efficiency was measured over two days for each individual but-
lar example (fig. 1e, f) shows one or two visual neurons terfly, on either a red or green host, in either simple or complex
originating from the medulla and supplying the mush- non-host environment. Shown are least-square means from an
analysis of variance that included host color, non-host complex-
room body calyx, revealing the extensive branching pat- ity, and their interaction (Experiment 1). Asterisks indicate sig-
tern of these individual neurons. Tracer injections into nificant differences in host-finding efficiency between the red
larger or different areas of the medulla showed that the and green host environment or the simple and complex non-host
calyx receives a multitude of visual input neurons (prob- environment.
ably also including visual input from the lobula, which
was not examined in the current study).
Effect of Host Experience on Host-Search finding efficiency was significantly higher in the green
Butterflies showed significant increases in host-find- host environment, at least early in the learning process
ing efficiency over time. In time-binned data, the propor- (table 2; fig. 2); host-finding efficiency was always signif-
tion of landings on host plants increased significantly icantly lower in the complex environment, which con-
over time, both within the first day of host-search and tained a greater density and diversity of non-host plants
between the two days of host-search (table 1; fig. 2). Host- (table 2; fig. 2). As measured in Experiment 2, changes in
Brain Size: A Global or Induced Cost of Brain Behav Evol 2009;73:111–128 117
Learning?Green host Red host
0.5 0.50
Change in host-finding between days
0.45
0.4 0.40
0.35
0.3
0.30
0.2 0.25
0.20
0.1 0.15
0.10
0
0.05
–0.1 0
0.0045 0.005 0.0055 0.006 0.0065 0.007 0.0045 0.005 0.0055 0.006 0.0065 0.007
Relative volume of mushroom body calyx at emergence
Fig. 3. A family’s mushroom body size at emergence is related to their change in host-finding between days.
Shown is the volume of each mushroom body calyx at emergence, relative to whole brain size, for each of 6 full-
sibling families (Experiment 1). The y-axis represents each family’s difference in host-finding efficiency be-
tween the two days of learning for either the red host or green host environment (0 = no change in host-finding
efficiency; negative values indicate decline in efficiency).
Table 2. Effect of host color and non-host complexity on host- Table 3. Effect of family and brain size or body size on brain re-
finding1 gion volume at emergence1
Landings Host color NH complexity Color ! comp. Family Brain or body size
(F1,82) (F1,82) (F1,82) (F5,13) (F1,13)2
1–10, day 1 31.7*** 6.14** 0.09 Calyx 3.77** 0.46
11–20, day 1 50.1*** 14.9** 7.97** Lobes 4.12*** 1.93
1–10, day 2 49.8*** 25.3*** 0.16 Antennal lobes 5.21*** 16.9***
11–20, day 2 2.69 14.9** 0.04 Central body 2.21 6.68*
Medulla 0.99 24.6***
** p < 0.01; *** p < 0.0001. Whole brain 2.79* 3.16*
1 N = 86 individuals that participated for at least 20 landings
on the first day of learning and 10 landings on the second day; * p < 0.10; ** p < 0.05; *** p < 0.01.
Each ANOVA includes host color, non-host complexity, and color 1 N = 20 brains from 6 families.
! complexity as independent variables. 2 Models with whole brain size included body size not brain
size. Each ANOVA reported includes both family and size as in-
dependent variables.
host-finding efficiency were paralleled by changes in col- non-host complexity, and, for measures of total hosts, to-
or choice [Snell-Rood and Papaj, in press]: butterflies in tal landings).
the red host environment chose a lower proportion of
green non-hosts (versus red non-hosts) over time. In the Brain Size at Emergence
following analyses, we measured within-day and be- At emergence, full-sibling families varied in the size of
tween-day changes in host-finding efficiency and total their whole brain, relative to body size, and the size of
hosts found as the average for each family (the least- most brain regions, relative to whole brain size (table 3).
square means from models controlling for host color, There were several trends between a family’s mean brain
118 Brain Behav Evol 2009;73:111–128 Snell-Rood /Papaj /GronenbergGreen host Red host
0.15 0.2
0.10
green non-hosts chosen
Between-day change in
0
0.05
–0.2
0
–0.05 –0.4
–0.10
–0.6
–0.15
–0.20 –0.8
–0.25 –1
0.38 0.40 0.42 0.44 0.46 0.38 0.40 0.42 0.44 0.46
Relative brain size at emergence
Fig. 4. A family’s brain size at emergence is related to change in color choice between days. Shown are results
from brains of families in an experiment (Experiment 2) designed to measure color learning as changes in the
colors of non-hosts chosen between the two days of learning. Negative values indicate shifts to search for more
red (as opposed to green) colors.
Table 4. Family-level relationships between host-finding ability Table 5. Effect of family, experience, and brain or body size on
and relative brain or brain region volume at emergence1 brain region volume1
Calyx Lobes Whole brain Family Experience Fam ! exp. Brain size
(F1,4) (F1,4) (F1,4) (F5,47) (F1,47) (F5,47) (F1,47)2
Change within, red 1.14 0.28 4.26 (+)* Calyx 1.42 35.6*** 2.08* 22.8***
Change within, green 4.31 (+)* 0.45 0.76 Lobes 2.44* 16.4*** 0.51 6.41**
Change between, red 9.62 (+)** 1.37 0.23 Antennal lobes 2.96** 14.8*** 0.53 6.34**
Change between, green 3.72 (+) 2.79 (+) 0.51 Central body 2.36** 31.9*** 2.61** 44.0***
Total hosts, red 1.00 0.77 1.69 Medulla 1.24 34.1*** 0.51 368.8***
Total hosts, green 10.7 (–)** 0.03 0.49 Whole brain 3.58*** 6.53*** 1.98* 0.79
* p < 0.10; ** p < 0.05. * p < 0.10; ** p < 0.05; *** p < 0.01.
1 1 N = 60 individuals from 6 families.
N = 6 families (individual ANOVAs reported).
(+) positive trend for F ratio >2; (–) negative trend for F ra- 2 Models with whole brain size included body size not brain
tio >2. size. Each ANOVA includes family, experience, family ! experi-
ence, and size as independent variables.
size at emergence and its host-finding ability (n = 6 fam- body, or antennal lobe (relative to brain size) at emer-
ilies). Families that emerged with large mushroom body gence.
calyces, relative to whole brain size, were more likely to In a subsequent experiment [Experiment 2; Snell-
increase their ability to locate red hosts over the two days Rood and Papaj, in press], we tested whether the observed
of learning (fig. 3; table 4). There was also a tendency for relationship between neural investment and learning was
families with large mushroom body lobes, relative to due to color learning per se. In this experiment, we found
whole brain size, to increase their ability to locate green that a family’s mean whole brain volume at emergence
hosts over the two days of learning; however, this differ- (relative to body size) was significantly positively corre-
ence was not statistically significant (table 4). There were lated with their ability to increase their search for red
no significant (or marginally significant) relationships colors across days of host-search in the red host environ-
between behavioral measures and the volume of the ment (fig. 4; F5 = 9.67, p = 0.03) although not in the green
whole brain (relative to body size) or the medulla, central host environment (fig. 4; F5 = 0.24, p = 0.65). Calyx vol-
Brain Size: A Global or Induced Cost of Brain Behav Evol 2009;73:111–128 119
Learning?Calyx
0.0085 Lobes
0.0050
0.0080 0.0045 *
0.0075 0.0040
0.0035
0.0070
0.0030
Relative volume of mushroom body component
0.0065 0.0025
0.0020
0.0060
Relative volume of brain region
0.0015
0.0055 0.0010
0.0050 0.0005
0
0.0045
Lobes Medulla
0.218
0.0050 0.216 * **
0.214
0.0045 0.212
0.210
0.0040 0.208
0.206
0.0035 0.204
0.202
0.0030
0.200
0.198
0.0025 Green Red Simple Complex
host host non- non-
0.0020 host host
Emergence Post-learning
Fig. 5. Mushroom body volume increases with age and experience Fig. 6. Brain region volume is responsive to experience. Shown are
in a family-dependent manner. Shown are reaction norms for least-square means from ANOVAs that controlled for experience
changes in the volume of mushroom body components relative to (total landings), family, and whole brain size in testing for effects
whole brain size. Each line represents a family of full sibling but- of host color and non-host complexity on the volume of mush-
terflies sacrificed at emergence or four days later following host room body lobes (top) and medulla (bottom) relative to whole
experience (Experiment 1). brain size, in individual butterflies sacrificed after host experi-
ence (Experiment 1). One asterisk indicates marginal significance
(p ! 0.10), and two indicate significance (p ! 0.05).
ume at emergence was not related to changes in color mushroom body lobes were larger in butterflies that
choice across days. learned red hosts, whereas the medulla was larger in in-
dividuals that learned green hosts (p = 0.06; table 6; fig. 6).
Changes in Brains with Age and Experience There was a significant effect of non-host complexity on
The whole brain and each brain region were signifi- the volume of the medulla, while controlling for whole
cantly larger in volume after host experience than at brain size: individuals that experienced hosts within a
emergence (table 5; fig. 5; Appendix 1). Furthermore, complex non-host environment had a relatively larger
families varied in the degree to which calyces, central medulla than those that experienced a simple non-host
body, and whole brain size increased with age and experi- environment (p = 0.04; table 6; fig. 6). For subsequent
ence (age by family interaction; table 5; fig. 5). analyses, we used an ANOVA (table 6) to estimate a fam-
Specific host experience was associated with changes ily’s brain size following host experience (as the least-
in the relative size of some brain regions (table 6; fig. 6, square mean for the ‘family’ effect when controlling for
7). The relative volume of the calyx after host experience total landings, host color, non-host complexity, and brain
was correlated significantly with the number of landings size or body size).
on foliage (table 6; fig. 7). Some brain regions showed At the family-level, the relative volume of some brain
marginally significant trends to vary with host color: the regions following host experience was significantly re-
120 Brain Behav Evol 2009;73:111–128 Snell-Rood /Papaj /Gronenberg0.012 Calyx
20
0.011
Relative volume of calyx
19
0.010
0.009 18
0.008 17
0.007
16
0.006
15
Total red hosts located
0.005
0.004 14
0 20 40 60 80 100 0.0065 0.0070 0.0075 0.0080 0.0085
Total landings
20 Antennal lobe
Fig. 7. Calyx volume is related to total number of landings. Shown 19
is a leverage plot from an ANOVA controlling for family, host
color, non-host complexity and total brain size. The x-axis shows 18
‘total landings,’ the total number of host and non-host landings 17
of an individual over the two days of host experience (Experi-
ment 1). 16
15
14
0.004 0.005 0.006 0.007 0.008 0.009
lated to total hosts located, particularly in the red host Relative volume of brain region following host experience
environment. Families with larger calyces and antennal
lobes, relative to whole brain volume, located a greater
number of red hosts over their total search period (con- Fig. 8. The relative volume of brain regions after host experience
trolling for total number of landings; table 7; fig. 8). Fur- relates to a family’s ability to locate red hosts. Shown is the volume
thermore, families with larger whole brain size (relative of mushroom body calyx (top) and antennal lobe (bottom) rela-
tive to whole brain size, following experience (controlling for the
to body size) following experience showed greater with- type and degree of experience) and its relation to total red hosts
in-day increases in host-finding in the red host environ- located (controlling for total landings). Each data point represents
ments (table 7). In a few cases, brain region size following one full-sibling family (Experiment 1).
host experience was negatively related to measures of
learning (table 7).
Given that behavior is a function of brain size at emer-
gence and subsequent growth, we wanted to ensure that Table 6. Effect of host color, non-host complexity, brain or body
family-level correlations (e.g., tables 4, 7) were not con- size and total landings on brain region or brain volume1
founded by measurements at different developmental time
points. At the family-level, for the calyces, lobes, antennal Host color Complexity Brain size2 Landings Family
(F1, 36) (F1, 36) (F1, 36) (F1, 36) (F6, 36)
lobes, and central body, the relative volume of a brain re-
gion before emergence was not correlated with its volume Calyx 0.13 0.21 30.1*** 7.13** 0.96
after host experience (p = 0.56, 0.23, 0.96, and 0.93, respec- Lobes 3.50* 0.21 9.64*** 0.66 1.03
tively); in contrast, for medulla and whole brains the vol- Antennal lbs 0.27 0.71 6.29** 0.21 2.19*
ume of a brain region after learning was positively corre- Central body 1.82 0.37 57.9*** 1.52 4.64***
Medulla 3.43* 3.91** 383.3*** 0.95 3.02***
lated with its volume at emergence (medulla: F5 = 6.36, Whole brain 0.07 0.05 1.89 0.99 2.75**
p = 0.06, b = 0.83; whole brain: F5 = 10.3, p = 0.03, b = 1.85).
Thus, the relative volume of most brain regions at emer- * p < 0.10; ** p < 0.05; *** p < 0.01.
1 N = 47 individuals from 7 families.
gence appeared independent of their size following learn-
2 Models with whole brain size included body size not brain
ing. However, we repeated significant family-level analy-
size. Each ANOVA includes host color, non-host complexity, total
ses from tables 4 and 7 in a model that included both a landings, family, and size as independent variables.
family’s brain size at emergence and its brain size after
Brain Size: A Global or Induced Cost of Brain Behav Evol 2009;73:111–128 121
Learning?Table 7. Family-level relationships between host-finding ability and relative brain or brain region volume after
learning1
Calyx Antennal Medulla CB Whole brain
(F1,5) lobes (F1,5) (F1,5) (F1,5) (F1,5)
Change within, red 0.46 0.49 1.02 1.52 12.9 (+)**
Change within, green 2.77 (–) 1.60 2.86 (+) 4.71* (–) 0.06
Change between, red 0.02 5.18* (–) 0.001 0.93 0.01
Change between, green 0.16 1.81 0.16 1.92 0.06
Total hosts, red 6.70 (+)** 5.97* (+) 0.12 4.43* (+) 2.08 (+)
Total hosts, green 0.39 0.09 0.56 0.001 1.81
* p < 0.10; ** p < 0.05.
1
N = 7 families (individual ANOVAs reported).
(+) positive trend for F ratio >2; (–) negative trend for F ratio >2.
Table 8. Effect of age, experience and size on brain region vol- changes between emergence and the period of host-
ume search. To further address this question, in a subsequent
experiment [Experiment 2; Snell-Rood and Papaj, in
Experiment 21 Experiment 1 vs. 22 press], we were able to sacrifice butterflies both at emer-
age brain size3 exp./age brain size3 gence, and just prior to when siblings began host-search
(F1,22) (F1,22) (F1,56) (F1,56) (after two days of being held in greenhouse cages without
Calyx 3.49 2.30
host plants); unfortunately, we were not able to collect
5.23* 38.5***
Lobes 0.39 2.33 9.67** 15.2*** enough butterflies for analyses of brain size following
Antennal lobes 0.35 3.35 1.74 15.7*** learning. Most brain regions showed trends to increase
Central body 1.23 22.6*** 9.37** 89.2*** between emergence and the time just before host-search,
Medulla 1.68 60.5*** 8.97** 335.8*** but none of these differences were significant (table 8;
Whole brain 3.53 2.86 0.27 0.25 Appendix 1). When brain region size was compared
* p < 0.05; ** p < 0.01; *** p < 0.001. across experiments, most brain regions (mushroom body
1
Comparison of brains from butterflies sacrificed at emer- lobes and calyces, medulla, and central body) were sig-
gence to those without host experience sacrificed two days later nificantly larger in individuals sacrificed just following
(just prior to when others began learning). host experience than in those sacrificed just prior to ex-
2 Comparison of brain regions of butterflies sacrificed just pri-
perience (table 8; Appendix 1). However, cross-experi-
or to learning (Experiment 2) to those sacrificed just following
learning (Experiment 1). We were unable to collect brains of but- ment comparisons can be confounded by any number of
terflies following learning in Experiment 2. factors and must be interpreted cautiously.
3 Models with whole brain size included body size not brain
size. Each ANOVA includes age or experience and brain size or
body size as independent variables. Discussion
Host-Learning in Butterflies
As in other studies [e.g., Traynier, 1984, 1986], we
experience. Power was significantly reduced, but signifi- found evidence that learning plays a role in host-finding
cant effects remained significant, or marginally so (mar- in Pieris butterflies. In our first experiment, individual
ginally significant effects lost significance; Appendix 2). butterflies showed significant improvements in their
We were interested in whether the volume differences ability to distinguish hosts from non-hosts within and
between butterflies sacrificed at emergence and those across the two days of host experience (fig. 2). Results of
sacrificed after learning (four days later) were primarily our second experiment [Snell-Rood and Papaj, in press]
due to specific experiences during the period of host- suggest that at least part of this improvement is due to
search, or instead primarily due to normal age-related color learning: as host-finding efficiency in the red envi-
122 Brain Behav Evol 2009;73:111–128 Snell-Rood /Papaj /Gronenbergronment increases, the choice of green non-hosts de- two days of learning might be more reflective of long-
creases (and choice of red non-hosts increases). In these term memory, which could be costlier than other forms
experiments, hosts differed not only in color, but pre- of memory [Mery and Kawecki, 2005]. Although consis-
sumably odor and other visual characteristics. Thus, tent with our observations, this interpretation is in need
butterflies are likely learning multiple cues (color, shape, of further experimental support.
odor) as they increase their host-finding efficiency over Links between brain component size at emergence
time. and learning ability were not present for some brain re-
We estimated a family’s overall host-finding efficiency gions measured and some measurements of learning
and learning ability using the ‘family by host color’ inter- ability (table 4). For instance, there were no correlations
action term in models that included host color, non-host between learning (or total hosts located) and the relative
complexity, and (for measures of total hosts chosen) total volume at emergence of the central body, antennal lobe
landings during host-search. Other experiments have or medulla. These results suggest that brain size and be-
found host-finding efficiency and color choice to vary havior might not always be tightly linked within species.
significantly between groups of full sibling Pieris rapae Although we did detect some global costs of learning,
[Snell-Rood and Papaj, in press], so we assumed values these costs were specific to certain brain regions (e.g., rel-
from these models (least-square means) were good esti- ative calyx size) and measures of learning (e.g., between-
mates of family-level behavior. day changes in host-finding).
Brain Size as a Global Cost of Learning Brain Size as an Induced Cost of Learning
We found that the volume of the mushroom bodies at This study found that the volume of all brain regions
emergence (relative to whole brain size) was related to a surveyed, when adjusted for whole brain volume, changed
family’s learning ability, albeit to a modest degree. Spe- with age and experience, and further, that these chang-
cifically, the relative size of the mushroom body calyx es were linked to host-finding behavior. All brain re-
was related to a family’s improvement in their ability to gions considered were relatively larger in individuals
locate red hosts across two days of host-search (table 4; sacrificed after host experience (at age 4 days) relative to
fig. 3). Furthermore, brains collected in a later experi- siblings sacrificed at emergence (table 5; fig. 5). Several
ment (Experiment 2), suggested that brain size at emer- results suggest that much of this change occurred dur-
gence (relative to body size) was related to a family’s abil- ing the time when females searched for hosts. Most im-
ity to increase their search for red colors across two days portantly, in Experiment 1, some of the changes in brain
of host-search (fig. 4). These results suggest that brain size over time were correlated with specific aspects of
and mushroom body size at emergence could act as a host experience, suggesting that brain size might re-
global cost of learning: individuals with the ability to spond selectively to certain learning conditions, and
improve host-search over time emerge with greater neu- that the changes we observed were not simply a general-
ral investment, which might exact energetic costs rela- ized change in brain size with age (table 5, 6; fig. 6, 7).
tive to individuals with less pronounced learning abil- For instance, mushroom body calyx size was positively
ity. correlated with the total number of landings during
Interestingly, we found that brain size at emergence host-search (table 5; fig. 7), reminiscent of other studies
was linked to changes in host-finding ability between which have found positive effects of activity on brain
days, but not within days (table 4). Measures of perfor- development [reviewed in Cotman and Berchtold, 2002].
mance on the first day of learning likely reflect both ini- The mushroom body lobes showed a marginally signif-
tial biases and short-term memory processes, but not icant tendency to be larger after experience in the red
long-term memory formation as trials were less than an host environment relative to experience in the green
hour in length. Long-term and short-term memory rep- host environment (table 6; fig. 6). Many studies have
resent distinct physiological processes [reviewed in De- highlighted age- and experience-dependent changes in
Zazzo and Tully, 1995; Menzel, 2001; Margulies et al., mushroom body size that are correlatively and causally
2005]; long-term memory, in contrast to short-term linked to learning [Balling et al., 1987; Durst et al., 1994;
memory, requires protein synthesis and structural chang- Withers et al., 1995, 2007; Gronenberg et al., 1996; Farris
es in neural networks [reviewed in Silva et al., 1998; et al., 2001]. Thus, our observed changes in the mush-
Tischmeyer and Grimm, 1999; Lamprecht and LeDoux, room body, which receive both olfactory and visual in-
2004]. Thus, measures of changes in behavior across the puts (fig. 1) [Strausfeld et al., 1998], might reflect the im-
Brain Size: A Global or Induced Cost of Brain Behav Evol 2009;73:111–128 123
Learning?portance of learning or sensory integration (both color, between experiments. For example, the butterflies were
shape and smell) during host experience. We also found from different populations, but it is worth noting that,
that the medulla tended to be larger following green despite population origin, brain region sizes at emer-
host experience and in complex non-host environments gence were comparable between experiments (Appendix
(table 6; fig. 6). The adult development of optic lobes in 1). Our results thus suggest that brain size increases dur-
insects is remarkably experience-dependent within cer- ing the time when we measured host-learning, but con-
tain critical periods [Heisenberg et al., 1995; Barth et al., firmation of this interpretation would require experi-
1997], suggesting that our observed differences in me- ments that included control groups that did not receive
dulla size might have functional consequences. Given host experience, and were sacrificed at the same time as
that the non-hosts used in Experiment 1 were uniform- siblings that did have such experience [as in Farris et al.,
ly green, discriminating green hosts from among green 2001; Ismail et al., 2006; Withers et al., 2007].
non-hosts might have been a very visually-demanding Our results, in combination with those from dozens
task that promoted the development of larger visual pro- of other studies, suggest that neural investment might
cessing regions. Similarly, the complex non-host envi- often act as an induced cost of learning in insects. Re-
ronment – with a greater density and diversity of non- gions of the insect brain, including the mushroom bod-
hosts – was more visually demanding than the simple ies, antennal lobes and medulla, display remarkable plas-
environment. ticity in size and structure [e.g., Durst et al., 1994; Heisen-
At the family level, the relative volume of the brain and berg et al., 1995; Withers et al., 1995, 2007; Gronenberg
brain regions following host experience was significantly et al., 1996; Heisenberg, 1998; Scotto-Lomassese et al.,
related to host-finding ability. For instance, families with 2000, 2002; Farris et al., 2001; Meinertzhagen, 2001; Seid
larger calyces and antennal lobes following host experi- et al., 2005; Ismail et al., 2006; Kühn-Bühlmann and
ence were more likely to locate a greater number of red Wehner, 2006]. In many cases, developmental increases
hosts (table 7; fig. 8). Age- and experience-dependent in brain region volume are experience-independent [Bre-
changes in the size of the antennal lobes is common in nowitz et al., 1995; Withers et al., 1995; Fahrbach et al.,
insects, and often coincides with periods of learning 1998], which suggests such variation in brain size might
[Withers et al., 1993; Sigg et al., 1997; Brown et al., 2004; act as global costs (that is, they are not specific to certain
Huetteroth and Schachtner, 2005]. Thus, this latter fam- learning experiences). In many instances, however,
ily-level result suggests that olfactory learning might con- changes in brain region volume are thought to have
tribute to locating the red host, and provides further sup- some experience-dependent components [often togeth-
port for the idea that the growth of brain regions after er with experience-independent components; e.g., With-
emergence is experience-dependent. ers et al., 1993, 1995; Durst et al., 1994; Barth et al., 1997;
The fact that neural volume following learning was Brown et al., 2004]; any experience- or learning-depen-
specific to the learning experience itself suggests that dent changes would represent induced costs of learning.
brain size was dependent on experience, as has been seen Indeed, genetic mutants suggest that these experience-
in other insects [e.g., Farris et al., 2001; Seid et al., 2005; dependent changes are causally linked to learning [Ball-
Ismail et al., 2006; Withers et al., 2007]. We also sacrificed ing et al., 1987; Devaud et al., 2003]. This research adds
butterflies in a subsequent experiment to try to quantify to this body of literature in several ways. First, we ob-
the degree to which brain size following learning was a served that developmental increases in brain size, which
function of experience versus earlier age-related changes. were likely experience-dependent, were linked to spe-
Although our inference is limited, comparisons between cific aspects of host-learning (tables 5–7). That said, it
Experiments 1 and 2 support the idea of learning-depen- remains unclear whether increases in brain size led to
dent changes in brain region size. In Experiment 2, the increases in host-finding efficiency, or whether high de-
brains of individuals sacrificed just prior to when their grees of host-finding induced changes in brain size. Sec-
siblings began host-learning were not significantly larger ond, we observed genetic variation in the degree to
than the brains of siblings sacrificed at emergence (ta- which age and experience result in increases in the size
ble 8). Furthermore, most brain regions were significant- of certain brain regions (a family by age interaction
ly larger in butterflies sacrificed after the period of host- term; table 5; fig. 5). These results suggest that develop-
search (those from Experiment 1), relative to those sacri- mental changes in brain size, which might represent in-
ficed just before (those from Experiment 2; table 8). There duced costs of learning, can readily evolve within but-
are potential confounding factors that limit comparisons terfly populations.
124 Brain Behav Evol 2009;73:111–128 Snell-Rood /Papaj /GronenbergYou can also read