Ionic aluminium concentrations exceed thresholds for aquatic health in Nova Scotian rivers, even during conditions of high dissolved organic ...
←
→
Page content transcription
If your browser does not render page correctly, please read the page content below
Hydrol. Earth Syst. Sci., 24, 4763–4775, 2020
https://doi.org/10.5194/hess-24-4763-2020
© Author(s) 2020. This work is distributed under
the Creative Commons Attribution 4.0 License.

Ionic aluminium concentrations exceed thresholds for aquatic health
in Nova Scotian rivers, even during conditions of high dissolved
organic carbon and low flow
Shannon M. Sterling1 , Sarah MacLeod2 , Lobke Rotteveel1 , Kristin Hart1 , Thomas A. Clair1 , Edmund A. Halfyard3 ,
and Nicole L. O’Brien4
1 SterlingHydrology Research Group, Department of Earth and Environmental Sciences, Dalhousie University,
Halifax, Nova Scotia, Canada
2 Coastal Action, Lunenburg, Nova Scotia, Canada
3 Nova Scotia Salmon Association, Chester, Nova Scotia, Canada
4 Department of Earth and Environmental Sciences, Dalhousie University, Halifax, Nova Scotia, Canada

Correspondence: Shannon M. Sterling (shannon.sterling@dal.ca)

Received: 22 August 2019 – Discussion started: 28 October 2019
Revised: 8 April 2020 – Accepted: 18 May 2020 – Published: 5 October 2020

Abstract. Acid deposition released large amounts of alu-          tive properties in streams. Lastly, we find that, contrary to the
minium into streams and lakes during the last century in          common conceptualization that high Ali levels are associated
northern Europe and eastern North America. Elevated alu-          with storm flow, high Ali concentrations are found during
minium concentrations caused major environmental concern          base flow. Our results demonstrate that elevated Ali concen-
due to aluminium’s toxicity to terrestrial and aquatic organ-     trations in Nova Scotia continue to pose a threat to aquatic
isms and led to the extirpation of wild Atlantic salmon pop-      organisms, such as the biologically, economically, and cul-
ulations. Air pollution reduction legislation that began in the   turally significant Atlantic salmon (Salmo salar).
1990s in North America and Europe successfully reduced
acid deposition, and the aluminium problem was widely con-
sidered solved. However, accumulating evidence indicates
that freshwater systems still show delays in recovery from        1   Introduction
acidification, with poorly understood implications for alu-
minium concentrations. Here, we investigate spatial and tem-      Increased rates of acid deposition, predominantly deriving
poral patterns of labile cationic forms of aluminium (Ali )       from upwind fossil fuel burning, resulted in the acidifica-
from 2015 to 2018 in 10 catchments in Nova Scotia, Canada;        tion of soils, rivers, and lakes during the last century (e.g.,
this region was one of the hardest hit by acid deposition, al-    Kerekes et al., 1986), depleting base cations and increasing
though it was not considered to have an aluminium prob-           toxic aluminium concentrations in soils and drainage water.
lem due to its high dissolved organic carbon (DOC) con-           Increased aluminium concentrations caused the extirpation
centrations that were expected to reduce Ali concentrations.      of native Atlantic salmon (Salmo salar) populations in many
Surprisingly, our results show the widespread and frequent        rivers (Rosseland et al., 1990), for example in Scandinavia
occurrences of Ali concentrations that exceed toxic thresh-       (Henriksen et al., 1984; Hesthagen and Hansen, 1991), the
olds in all sampled rivers despite high DOC concentrations.       eastern USA (Monette and McCormick, 2008; Parrish et al.,
Generalized linear mixed model results reveal that DOC, in-       1998), and Nova Scotia, Canada (Watt, 1987). The acidifi-
stead of being inversely related to Ali , is the strongest pre-   cation problem was widely considered solved following re-
dictor (positive) of Ali concentrations, suggesting that the      ductions in anthropogenic sulfur emissions in North Amer-
recruitment properties of DOC in soils outweigh its protec-       ica and Europe since the 1990s. Many rivers showed steady
                                                                  improvements in annual average stream chemistry (Evans

Published by Copernicus Publications on behalf of the European Geosciences Union.
4764                                                 S. M. Sterling et al.: Ionic aluminium concentrations exceed thresholds

et al., 2001; Monteith et al., 2014; Skjelkvåle et al., 2005;      increase with three drivers: (1) low soil pH, (2) low soil base
Stoddard et al., 1999; Warby et al., 2005), including reduced      saturation, and (3) high soil DOC concentrations. Lowered
concentrations of aluminium (Al) in the USA (Baldigo and           pH increases the solubility of secondary minerals containing
Lawrence, 2000; Buchanan et al., 2017; Burns et al., 2006)         Al; Ali concentrations in stream water are generally nega-
and Europe (Beneš et al., 2017; Davies et al., 2005; Monteith      tively correlated with pH (Campbell et al., 1992; Kopáček
et al., 2014). However, recent evidence highlights delayed re-     et al., 2006; Seip et al., 1989). Low levels of base satura-
covery from acidification in other regions (Houle et al., 2006;    tion can cause charge imbalances resulting in the release of
Warby et al., 2009; Watmough et al., 2016), including Nova         Al into soil water and later into drainage water (Fernandez
Scotia (Clair et al., 2011), raising questions about the pos-      et al., 2003); thus, chronic acidification shifts available ex-
sibility of elevated aluminium concentrations in freshwater        changeable cations in the soil water from Ca and magnesium
systems.                                                           (Mg) towards Al (Schlesinger and Bernhardt, 2013; Walker
   Al in freshwater can exist as inorganic monomers, in-           et al., 1990). Higher concentrations of DOC in soil water in-
organic polymers, in amorphous and microcrystalline inor-          crease the release of Al via two mechanisms: (1) as an or-
ganic forms, and in fast reactive or unreactive organic forms      ganic acid, DOC decreases soil pH, thereby increasing Al
(Chew et al., 1988; Driscoll et al., 1980; LaZerte, 1984).         release (Lawrence et al., 2013); and (2) by forming organic
While a variety of Al species in circumneutral waters are          complexes with Ali , DOC maintains a negative Al concentra-
toxic to fish (Gensemer and Playle, 1999), including pre-          tion gradient from the cation exchange sites to the soil water,
cipitated forms (Gensemer et al., 2018), the cationic species      increasing the rates of Al release (Edzwald and Van Ben-
of Al (Ali ), such as Al3+ , Al(OH)1+                   2+
                                       2 , and Al(OH) , are        schoten, 1990; Jansen et al., 2003). Field studies confirm Al
considered to be the most labile and toxic to salmonids. Al        concentrations to be positively correlated with DOC (Camp-
species bind to the negatively charged fish gills and cause        bell et al., 1992; Kopáček et al., 2006).
morbidity and mortality through suffocation (Exley et al.,            The general consensus in the literature is that elevated
1991), reduce nutrient intake at gill sites, and alter blood       Ali concentrations occur during episodic storm events due to
plasma levels (Nilsen et al., 2010). The effects of sublethal      three possible mechanisms: (1) dilution of base cations dur-
exposure to freshwater Al elicit osmoregulatory impairment         ing storm events, where flow paths move through shallower,
(Monette and McCormick, 2008; Regish et al., 2018), which          more organic-rich soil layers; (2) added anions in snowmelt
reduces survival in the hypertonic marine environment (Mc-         or rainfall (e.g., Cl− , SO2−        −
                                                                                              4 , and F ) providing mobile anions
Cormick et al., 2009; Staurnes et al., 1996). Elevated concen-     that increase Ali export to streams; and (3) low pH associated
trations of Ali are also toxic to other freshwater and terres-     with storm events that redissolves Al accumulated in the soil
trial organisms (Boudot et al., 1994; Wauer and Teien, 2010),      (Hooper and Shoemaker, 1985) and/or from the streambed
such as frogs and aquatic birds (Lacoul et al., 2011).             (Norton et al., 1990). For example, from 1983 to 1984, Al
   Al speciation varies with pH (Helliweli et al., 1983; Ly-       concentrations for the River Severn in Wales increased ten-
dersen, 1990): positive Al species dominate over neutral and       fold during the storm flow peak compared with the base flow
negative species below pH 6.3 at 2 ◦ C and below pH 5.7            (Neal et al., 1986). The general consensus in the literature is
at 25 ◦ C (Lydersen, 1990), and the most toxic Al species,         also that Ali is seasonally elevated during spring snowmelt
Al(OH)+1  2 (Helliweli et al., 1983), dominates Al speciation      and autumn rainfall events, and it is seasonally depressed
between pH 5.0 and 6.0 at 25 ◦ C, and between 5.5 and 6.5 at       during summer months due to higher levels of DOC, such as
2 ◦ C (Lydersen, 1990). Thus, the toxicity of Al increases with    in Quebec (Campbell et al., 1992), Russia (Rodushkin et al.,
increasing pH up to approximately 6.0 at 25 ◦ C or 6.5 at 5 ◦ C,   1995), and along the Czech–German border (Kopáček et al.,
when aqueous aluminium precipitates, forming gibbsite (Ly-         2000; Kopáček et al., 2006). Timing of the Ali peaks is im-
dersen, 1990; Schofield and Trojnar, 1980); colder water will      portant. If peak Ali concentrations coincide with vulnerable
have a higher proportion of toxic species at higher pH values      life stages of Atlantic salmon, such as during the spring when
than warmer water (Driscoll and Schecher, 1990).                   salmon transition from parr to smolt (i.e., smoltification) in
   The bioavailability of Al is reduced by the presence of cal-    preparation for life in the ocean (Kroglund et al., 2007; Mon-
cium (Ca; Brown, 1983), which can occupy the negatively            ette and McCormick, 2008; Nilsen et al., 2013) or during
charged gill sites. Dissolved organic carbon (DOC) also re-        the emergence of salmon fry from eggs (e.g., Farmer, 2000),
duces the bioavailability of aluminium via the formation of        the potential for large biological impacts from elevated Ali is
organo-Al complexes (Alo ; Erlandsson et al., 2010; Neville,       particularly high.
1985). High levels of DOC in rivers have been believed to             Despite much progress in acidification research, the pro-
be sufficient to protect fish gills from adverse Al effects        cesses affecting Ali dynamics are not well understood (e.g.,
(Lacroix and Kan, 1986; Vogt and Muniz, 1997; Witters et           Mulder et al., 1990). Our understanding of Ali is limited by
al., 1990).                                                        the relative paucity of samples; Ali is not measured as part of
   Despite being the most common metal on Earth’s crust,           standard analyses. Thus, comprehension of Ali is also lim-
Al is usually immobilized in clays or hydroxide minerals in        ited by the difficulty involved in comparing the wide vari-
soils. Rates of Al release into soil water from soil minerals      ety of methods for estimating Ali ; different definitions, of-

Hydrol. Earth Syst. Sci., 24, 4763–4775, 2020                                       https://doi.org/10.5194/hess-24-4763-2020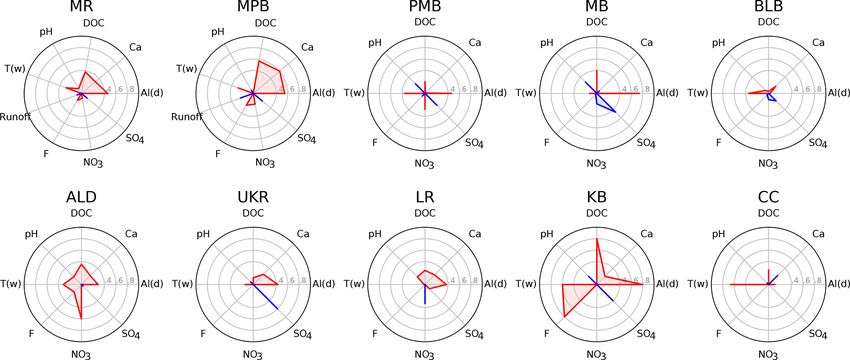
S. M. Sterling et al.: Ionic aluminium concentrations exceed thresholds 4765
ten operational, of toxic Al include inorganic Al, inorganic
Table 1. Study site characteristics. “n” refers to the number of sampling events. Numbers in parentheses after the mean concentration represent the standard deviation. One Ali outlier
monomeric Al, labile Al, Al3+ , and cationic Al (Supplement
Mean
pH
5.1
5.0
5.1
5.1
4.9
5.2
5.3
5.4
5.1
5.0
Table S1.1).
Acid-sensitive areas of Nova Scotia, Canada, here abbre-
viated as NSA (see Clair et al., 2007), with once-famous wild
Mean Ca
(µg L−1 )
699 (120)
826 (344)
969 (536)
1292 (286)
836 (272)
759 (126)
739 (230)
746 (166)
621 (275)
750 (568)
Atlantic salmon populations, were heavily impacted by sul-
fur deposition at the end of the last century, which originated
from coal burning in Central Canada and the Northeastern
USA (Hindar, 2001; Summers and Whelpdale, 1976). NSA
(µg L−1 )
195 (54.9)
249 (85.9)
149 (43.4)
319 (99.2)
350 (71.0)
243 (64.8)
224 (68.3)
109 (46.1)
281 (80.4)
411 (117)
Mean Ald
catchments are particularly sensitive to acid deposition due
to base-cation-poor and slowly weathering bedrock that gen-
erates thin soils with a low acid neutralizing capacity (ANC),
extensive wetlands, and episodic sea salt inputs (Clair et al.,
Mean DOC
(mg L−1 )
8.6 (2.7)
15.8 (6.1)
8.6 (3.3)
9.8 (4.4)
16.0 (8.3)
13.8 (3.7)
12.8 (3.0)
7.2 (1.9)
10.8 (3.6)
23.1 (5.1)
2011; Freedman and Clair, 1987; Watt et al., 2000; Whit-
field et al., 2006). Al was not considered to be a threat to
Atlantic salmon in Nova Scotia because of the high natural
levels of DOC in NSA rivers following preliminary research
by Lacroix and Townsend (1987) and Lacroix (1989). A 2006
(µg L−1 )
22.5 (11.7)
20.8 (12.2)
13.5 (12.0)
40.1 (23.2)
48.7 (27.6)
45.3 (26.7)
43.5 (23.5)
15.1 (11.7)
28.2 (11.5)
58.9 (41.7)
Mean Ali
fall survey, however, (Dennis and Clair, 2012) found that Ali
concentrations in NS exceeded the 15 µg L−1 toxic threshold
was removed for MR (a value of 2 µg L−1 from 30 April 2015). pH is calibrated using the method outlined in Sect. S4.4.
for aquatic health, as determined from an extensive review
of toxicological and geochemical literature by the European
Dominant bedrock
Inland Fisheries Advisory Council (EIFAC), in 7 of 42 rivers
Sandstone/slate
Sandstone/slate
Sandstone/slate
Sandstone/slate
Sandstone/slate
Sandstone/slate
surveyed (Howells et al., 1990). No assessment of Ali has
Granite/slate
been carried out in NSA since that time, and little is known
about the current extent and patterns of Ali in the region.
Granite
Granite
Slate
Here, we conduct a 4-year survey of Ali concentrations in type
10 streams in NSA in order to test the hypothesis that ele-
vated DOC concentrations are sufficient to protect life from
Natural forest
Natural forest
Natural forest
Natural forest
Natural forest
Natural forest
Natural forest
Natural forest
Natural forest
Natural forest
Ali and to identify the hydrologic conditions associated with
Land use
elevated Ali concentrations.
2 Materials and methods
n
47
39
15
12
22
22
18
13
5
8
2.1 Study area
Area
(km2 )
292.8
15.8
1.5
0.2
1.3
32.3
36.8
47.1
2.3
1.7
We surveyed Ali concentrations at 10 study catchments
in NSA , ranging from headwater to higher-order systems:
Long
−65.223
−65.048
−65.209
−64.414
−62.690
−62.800
−62.705
−62.611
−62.7153
−62.7127
Mersey River (MR), Moose Pit Brook (MPB), Pine Marten
Brook (PMB), Maria Brook (MB), Brandon Lake Brook
(BLB), above the West River lime doser (ALD), Upper Kil-
lag River (UKR), Little River (LR), Keef Brook (KB), and
Lat
44.437
44.462
44.436
44.779
45.021
45.054
45.064
44.952
45.0284
45.0279
Colwell Creek (CC) (Table 1, Fig. 1). Our study catchments
are predominantly forested with a mix of coniferous and
deciduous species, and they drain slow-weathering, base-
cation-poor bedrock, producing soils with a low ANC (Lan-
Upstream of West River Lime
Brandon Lake Brook (BLB)
gan and Wilson, 1992; Tipping, 1989). The catchments also
Upper Killag River (UKR)
Pine Marten Brook (PMB)
Moose Pit Brook (MPB)
have relatively high DOC concentrations (Ginn et al., 2007)
associated with the abundant wetlands in the region (Clair et
Colwell Creek (CC)
Mersey River (MR)
Maria Brook (MB)
Keef Brook (KB)
al., 2008; Gorham et al., 1986; Kerekes et al., 1986).
Little River (LR)
Doser (ALD)
2.2 Data collection and analysis
We measured Ali concentrations at 3 of the 10 catchments
Site
from April 2015 to September 2017 (MR, MPB, and PMB) at
https://doi.org/10.5194/hess-24-4763-2020 Hydrol. Earth Syst. Sci., 24, 4763–4775, 2020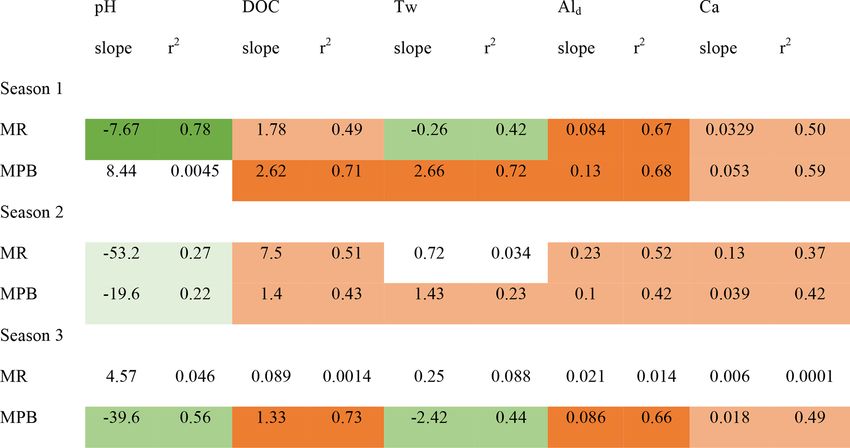
4766                                                  S. M. Sterling et al.: Ionic aluminium concentrations exceed thresholds

Figure 1. Study site locations showing (a) mean Ali concentrations and (b) the proportion of samples in which Ali concentrations exceeded
the 15 µg L−1 toxic threshold between spring 2015 and fall 2018. The shaded region corresponds to the catchments of monitoring sites. For
additional site details, refer to Table 1.

Hydrol. Earth Syst. Sci., 24, 4763–4775, 2020                                           https://doi.org/10.5194/hess-24-4763-2020
S. M. Sterling et al.: Ionic aluminium concentrations exceed thresholds                                                      4767

a weekly to monthly frequency during the snow-free season           fluoride (F− ), nitrate (NO−3 ), and runoff (where data were
(approximately April to November, Table S1.2). In the period        available). Correlations were analysed within and across
from 2016 to 2018, seven sites were added and were sampled          sites. For the purposes of this study, we use the toxic thresh-
biweekly to monthly during the snow-free season.                    old of Ali of 15 µg L−1 , as the majority of our pH ob-
   Ali sampling events comprise grab samples for laboratory         servations were greater than or equal to 5.0 (Table S1.2,
analysis and in situ measurements of pH and water temper-           Sect. S4.3).
ature (Tw ). We calculate Ali as the difference between dis-           We developed a generalized linear mixed model (GLMM)
solved Al (Ald ) and Alo following Dennis and Clair (2012)          to identify the main drivers of the Ali concentration at the
and Poléo (1995), as in Eq. 1, separating the species in the        study sites. We tested Ald , DOC, Ca, SO2−        −     −
                                                                                                                4 , F , NO3 , sea-
field to reduce errors caused by Al species change due to           son, and Tw as potential drivers. The GLMM analysis was
variations in temperature and pH during transport from the          implemented with R version 3.6.2. (R Core Team, 2019) us-
field to laboratory.                                                ing the lme4 package (Bates et al., 2015). Due to the non-
                                                                    normality of the Ali concentration data, the glmer function
Ali = Ald − Alo                                              (1)
                                                                    was employed for model fitting which uses the method of
Ald is measured as the Al concentration of a filtered               maximum likelihood for parameter estimation via Laplace
(0.45 µm) sample and Alo is measured as the eluate from             approximation (Raudenbush et al., 2000). The study sites
passing filtered water through a 3 cm negatively charged            in the analysis were included as the random effect with the
cation exchange column (Bond Elut Jr. strong cation ex-             fixed effects provided in Table S1.3; Ald was not included
change column). Samples were passed through the cation ex-          in the GLMM, as it results in an overfit model (singularity).
change column at a rate of approximately 30 to 60 drops per         The Wald t test statistic and the Akaike information crite-
minute. Using this method, Alo is operationally defined as          rion (AIC) were used as measures of goodness of fit (Akaike,
the non-labile, organically complexed metals and colloids;          1974; Bolker et al., 2009). Numerous iterations of fixed ef-
and Ali is defined as the positive ionic species of Al (e.g.,       fects and interactions were considered in the GLMM de-
Al3+ , Al(OH)2+ , and Al(OH)+   2 ).                                velopment (Table S1.3). Multiple fixed effects were initially
   Thus, the cation exchange method determines the concen-          considered; however, several of the effects were not signif-
trations of weak monomeric organic Al complexes (passed             icant, although the overall model fit provided a low AIC.
through the column), monomeric inorganic Al (retained in            GLMMs were applied to assess seasonal drivers of Ali con-
the column), and colloidal, polymeric, and strong organic           centrations; however, owing to the limited amount of sea-
complexes that are measured after acid digestion of the sam-        sonal data collected, an analysis of both the site and seasonal
ple (Gensemer and Playle, 1999). An assumption here is that         random effects could not be carried out due to model singu-
the Al species retained on the exchange column would also           larities.
be retained on the negatively charged fish gills and, therefore,
have a potentially toxic effect (see Gensemer and Playle,
1999). The eluate is generally considered to be nontoxic;           3     Results and discussion
however, there is some evidence that precipitated polymeric
Al and colloidal Al can be toxic to aquatic life (Parent and        3.1    Prevalence of Ali
Campbell, 1994; Gensemer and Playle, 1999; Gensemer et
al., 2018), although the nuances of this toxicity are unclear.      Ali concentrations exceed toxic levels (15 µg L−1 ) at all
To this end, the calculated Ali reported in this study rep-         sites during the study period (Table S1.2) despite relatively
resents a minimum concentration. Ultrafiltration (following         high DOC concentrations (mean values ranging from 7.2 to
Simpson et al., 2014) may improve the accuracy of the esti-         23.1 mg L−1 among the catchments; Table 1). Mean Ali con-
mations of recently precipitated colloidal Al concentrations.       centrations across all sites range from 13 to 60 µg L−1 (Ta-
   Stream chemistry samples (50 mL) were collected using            ble 1), with the highest mean concentrations also occurring in
sterilized polyethylene syringes into sterilized polyethylene       the eastern part of the study area (Fig. 1a) where one site had
bottles. Samples for sulfate (SO2−4 ) analysis were not filtered.   100 % of samples in exceedance (Fig. 1b). Ali concentrations
Trace metal samples were filtered (0.45 µm) and preserved           exceed 100 µg L−1 (approximately 7 times the threshold) at
with nitric acid (HNO3 ). Samples for DOC analysis were fil-        three sites (Table S1.2). Our Ali concentrations are consistent
tered (0.45 µm) and transported in amber glass bottles con-         with the 6.9–230 µg L−1 range of Ali concentrations mea-
taining sulfuric acid preservative (H2 SO4 ) to prevent denat-      sured across NSA by Dennis and Clair (2012) and are higher
uration. All samples were cooled to 7 ◦ C during transport to       than concentrations measured in Norway from 1987 to 2010
the laboratories. Samples were delivered to the laboratories        (5–30 µg L−1 ; Hesthagen et al., 2016).
within 48 h of collection, where they were further cooled to           The percentage of Al not complexed by DOC (% Ali /Ald )
≤ 4 ◦ C prior to analysis (Sect. S4).                               ranges from a minimum of 0.6 % to a maximum of 50 %,
   We examined correlations between Ali and the following           with a median value of 10.7 %, across all sites. These find-
water chemistry parameters: Ald , Ca, DOC, pH, SO2−     4 , Tw ,    ings are similar to those reported in NSA by Dennis and

https://doi.org/10.5194/hess-24-4763-2020                                         Hydrol. Earth Syst. Sci., 24, 4763–4775, 2020
4768 S. M. Sterling et al.: Ionic aluminium concentrations exceed thresholds
Clair (2012) with respect to the proportion of Ali in total alu- ble S1.5). Ca is significantly and positively correlated with
minium (Alt ; min. = 4 %, max. = 70.1 %, median = 12.4 %), Ali at two sites (MPB and MR; Fig. 2, Table S1.5). The
and less than those found by Lacroix (1989; over 90 % positive relationship between Ca and Ali is the opposite of
Alo /Ald ). These speciation results are also quite similar to what was expected (following Rotteveel and Sterling, 2019).
other diverse environments, such as acid sulfate soil envi- We hypothesize that this is due to the two study sites hav-
ronments in Australia (Simpson et al., 2014). However, even ing very low Ca concentrations (mean concentrations below
when the percentage of Ali /Ald is low, Ali concentrations 1 mg L−1 ), below which soil water Ca concentrations are too
remain well above the thresholds for toxicity (Supplement low to retard Al release.
Figs. S2.2–S2.11). Similarly to our findings, previous stud- Discharge is significantly and negatively correlated with
ies show that Ali /Ald is low during base flow (Bailey et al., Ali at one site MPB (Fig. 2, Table S1.5), which is in con-
1995; Murdoch and Stoddard, 1992; Schofield et al., 1985; trast with previous observations that Ali concentrations are
Figs. S2.2–S2.11 in this paper). positively correlated with discharge (Hooper and Shoemaker,
The highest concentrations of Ali (> 100 µg L−1 ) occurred 1985; Neal et al., 1986; Seip et al., 1989; Sullivan et al.,
in early summer (late June or early July in 2016–2018) when 1986). Runoff data are available for only two of the study
Ald , Ca, and DOC concentrations had not yet reached their sites (MR and MPB); more runoff data are needed to im-
annual peak (Table S1.2). The spring/summer extreme events prove our understanding of the relation between runoff and
occurred on the first exceptionally warm days (> 21 ◦ C) of Ali in NSA .
the year, in dry conditions, and when the proportion of We did not observe the negative association between pH
Alo /Ald was low (decreasing to approximately 60 %–70 % and Ali that has been observed in previous studies (Camp-
from higher levels of around 80 %–90 %; Figs. S2.2–S2.11). bell et al., 1992; Kopáček et al., 2006) – pH is negatively
pH was not abnormally low during these events (ranging correlated with Ali at 4 of the 10 sites, but none of these rela-
from 4.8 to 6.13), Ca concentrations were low (less than or tionships are statistically significant (Fig. 2, Table S1.5). The
equal to 800 µg L−1 ), and DOC concentrations ranged from lack of a significant correlation may be due in part to other
15 to 21 mg L−1 . mechanisms that could potentially cloud the strength of the
At the sites with the longest and most frequent data col- inverse relationship between pH and Al, such as increased
lection (MR and MPB), Ali concentrations exceed the toxic DOC solubility at higher pH levels that leads to increased Al
threshold in consecutive samples for months at a time, par- solubility in soils (Lydersen, 1990), pH buffering by Al in
ticularly in the late summer (Fig. S2.1). the lower pH range (Tomlinson, 1990), and the limited pH
range in the dataset. We did observe a statistically significant
3.2 Potential Ali drivers positive relationship between pH and Ali /Ald (Table S1.4);
thus, it seems that pH may play a more important role in de-
GLMM results reveal, via multiple fixed effect model com- termining the proportion of different Al species rather than
binations, that DOC and Tw are the most significant predic- the absolute value of Ali present in stream water in chroni-
tors of Ali concentrations (Table S1.3). When both DOC and cally acidified conditions such as those found Nova Scotia.
Tw were included in the GLMM model, the resulting AIC F− has also been found to be a complexing agent that af-
was markedly lower, indicating that the inclusion of both pa- fects the speciation of Al at low pH levels and relatively high
rameters provided better predictive potential than DOC or concentrations of F− (> 1 mg L−1 ; Berger et al., 2015). The
Tw alone. Furthermore, the interaction between DOC and concentrations of F− at the study sites are mostly below this
Tw was not significant in the model, provided a nominally threshold (mean across all sites of 0.045 mg L−1 ); however,
lower AIC, and the correlation between the effects was low there is still a significant positive effect of F− on Ali con-
(−0.378), indicating that distinct processes are responsible centrations at two sites (KB and MPB; Fig. 2, Table S1.5).
2−
for Ali concentrations. The strength of the Tw relationship is NO− 3 and SO4 are also potential complexing ligands of Al;
likely due to the role that increased temperature plays in acti- however, we did not observe any correlation between Ali and
vating biological drivers that mobilize Al (Hendershot et al., either of these parameters, except for a significant negative
1986). correlation between SO2− 4 and Ali at MB.
Thus, the GLMM results show that DOC is positively cor-
related with Ali in the study area, in contrast to the standard 3.2.1 Possible seasonal groupings of Ali in NSA
conceptualization that DOC is inversely correlated with Ali ;
this suggests that the increased recruitment of Al in soils by At the two sites with the most samples, MPB and MR, group-
DOC may outweigh the protective effects of DOC in fresh- ings of data are visible that are temporally contiguous, sug-
water, which is consistent with observations from other stud- gesting seasonally dependent Ali behaviour (Fig. 4). This is
ies (e.g., Campbell et al., 1992; Kopáček et al., 2006). supported by stronger linear correlations (r 2 ) among vari-
Linear regressions show that Ald is significantly (α = ables when grouped by “season” (Table 2); for example, for
0.05) and positively correlated with Ali at 7 of the 10 study the correlation between pH and Ali at MR, the r 2 value im-
sites (ALD, KB, LR, MB, MPB, MR, and PMB; Fig. 2, Ta- proves from 0.02 for year-round data (Fig. S2.12) to up to
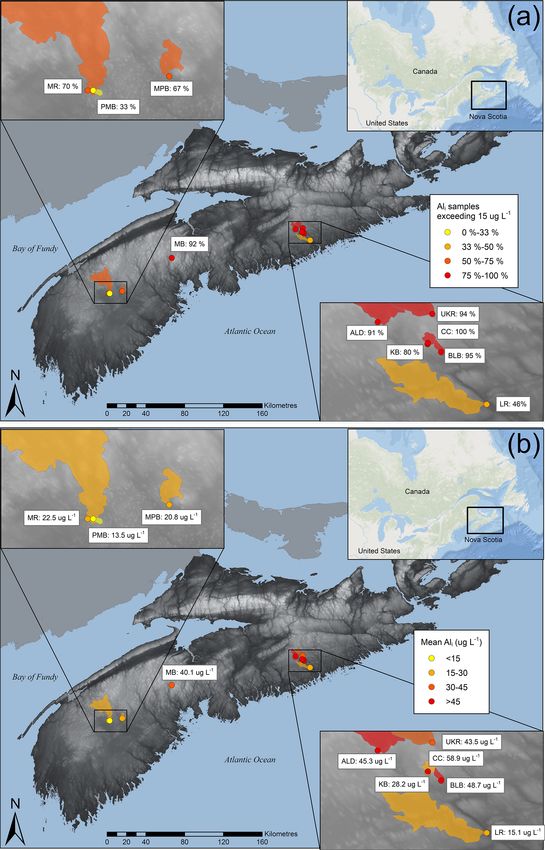
Hydrol. Earth Syst. Sci., 24, 4763–4775, 2020 https://doi.org/10.5194/hess-24-4763-2020S. M. Sterling et al.: Ionic aluminium concentrations exceed thresholds 4769 Figure 2. Correlation among water chemistry parameters and Ali concentration, where red polygons and lines indicate a positive correlation with Ali , and blue polygons and lines indicate a negative correlation with Ali . One Ali outlier was removed for MR (a value of 2 µg L−1 from 30 April 2015). Correlation data are listed in Table S1.5. Figure 3. Conceptual model of a new mechanism that can produce high concentrations of Ali in freshwater systems. Warm days increase biological activity that helps to mobilize Al from secondary minerals and enhances production of DOC; this, in turn, reduces pH and decreases Al saturation in soil solution by forming Al-organic complexes, thereby maintaining the Al concentration gradient away from secondary minerals. In rivers, the amount of DOC is insufficient to protect the fish from the amount of Ali mobilized in soils. 0.78 in season 1 (Fig. 4). The transition dates between the is strongly coupled with pH, DOC, Ald , and Ca in MR, but seasons are similar for the two catchments, but they are not less so in MPB. A possible explanation for this is that sea- the same (Table S1.2) and vary by year. Here, we propose an son 1 is dominated by snowmelt hydrology in which cation initial characterization of potential “seasons”; more research exchange between soil and discharge occurs less efficiently, is needed to test these hypotheses on seasonal divisions and which has been attributed to ice and frozen soil potentially their drivers using larger datasets to test for statistical signif- limiting water contact time with soil (Christophersen et al., icance among the potential seasonal groupings. 1990). It is important to note that we likely did not capture the Season 1 (approximately April/May) is coincident with first flush effect of increased Ali as has been noted in other snowmelt runoff and is characterized by relatively low con- studies (e.g., Hendershot et al., 1996). The onset of season 2 centrations of Ali (2–46 µg L−1 ), a low pH (4.5–5.3), and (approximately late June) is characterized by increasing Ali lower concentrations of most constituents, including DOC, concentrations, temperature, and DOC. Ali and pH values are as well as cold temperatures (< 4 ◦ C). During this season, Ali higher in this season, and Ali becomes strongly negatively https://doi.org/10.5194/hess-24-4763-2020 Hydrol. Earth Syst. Sci., 24, 4763–4775, 2020
4770                                                 S. M. Sterling et al.: Ionic aluminium concentrations exceed thresholds

Figure 4. Scatterplot relationships among water chemistry parameters for seasons 1, 2, and 3 at MR and MPB. R 2 values are listed in
Table S1.7. One runoff outlier was removed for MR (a value of 17 m3 s−1 from 22 April 2015). One runoff outlier was removed for MPB (a
value of 35 m3 s−1 from 22 April 2015).

correlated with pH as pH increases to the lower threshold for        however, more data are required to ascertain the effects of
gibbsite. In MR in season 2, Ali has a strong positive relation-     Tw on seasonal Ali concentrations.
ship with DOC. The highest observed Ali concentrations of               In contrast with the conceptualization that peak Ali con-
the year occur in season 2 (Fig. 3). Ali relations are weak in       centrations occur during storm flow (e.g., Campbell et al.,
MR in season 3 (approximately September through March),              1992; Kopáček et al., 2000; Neal et al., 1986; Rodushkin et
which is likely due to the lower frequency of measurements           al., 1995), our data show elevated Ali concentrations during
during the winter. Season 3 in MR has the highest concentra-         base flow conditions. These results suggest a new pathway
tions of dissolved constituents (Ald , Ca, and DOC), whereas         for the generation of elevated Ali concentrations that is as-
only Ca has the highest concentrations in MPB.                       sociated with base flow, warmer summer temperatures, and
   With the inclusion of season as the random effect in the          high DOC concentrations and is, thus, likely more chronic
GLMM analysis (Table S1.6), limited data remains to under-           in nature. Nilsson (1985) suggested that this flow path has
take a robust comparative analysis, but it is included nonethe-      important consequences for Al concentrations in Swedish
less to highlight the seasonal impacts that can be garnered          catchments. We hypothesize that this pathway is caused by
from the limited dataset. pH and Tw were omitted due to sin-         increased temperatures resulting in higher levels of biologi-
gularities. These results reinforce that DOC concentrations          cal activity that mobilize Al in soils (Fig. 3; following Nils-
are associated with Ali concentrations on a seasonal basis;          son and Bergkvist, 1983). Biological activity further gener-
                                                                     ates DOC that mobilizes Al to drainage water during summer

Hydrol. Earth Syst. Sci., 24, 4763–4775, 2020                                          https://doi.org/10.5194/hess-24-4763-2020
S. M. Sterling et al.: Ionic aluminium concentrations exceed thresholds 4771
Table 2. Ali relations with other stream chemistry parameters separated by possible seasons. Dark shading represents an r 2 value greater
than 0.6. Medium shading represents an r 2 value between 0.2 and 0.6. Light shading represents an r 2 value between 0.0 and 0.2. Green
indicates a negative relation. Orange indicates a positive relation.
base flow (Fig. 3). Other cases of increased Ali concentra- 4 Conclusions
tions occurring during low flow and warming temperatures
can be found in the literature in locations such as Ontario
and Quebec (Hendershot et al., 1986, 1996) and in Virginia, Our 4-year study of stream chemistry in NSA has two impor-
USA (Cozzarelli et al., 1987). tant findings. First, high DOC concentrations in rivers may
not protect aquatic life against Ali as previously thought; our
3.3 Ecological implications GLMM analysis suggests rather the opposite: higher DOC
concentrations drive higher levels of Ali , even possibly on a
While the summer peak in Ali that we observed in NSA does seasonal basis. Thus, our study reveals that despite high DOC
not coincide with the smoltification period, continued expo- levels, widespread and persistent toxic concentrations of Ali
sure throughout the year may still negatively affect salmon in NSA freshwater systems pose a risk to aquatic, and poten-
populations, as the accumulation of Ali on gills reduces ma- tially terrestrial, life. Second, our study highlights an over-
rine and freshwater salmon survival (Kroglund et al., 2007; looked hydrological pathway that is associated with high Ali
Kroglund and Staurnes, 1999; Staurnes et al., 1996; Gibson concentrations – base flow – suggesting a chronically acid-
et al., 2011). ified/aluminium dynamic, in addition to episodic Ali peaks
In addition, elevated Ali concentrations appearing during associated with storm flow. This base flow pathway demon-
low flow in the summer months suggest a more chronic de- strates that Ali concentrations are chronically elevated dur-
livery of elevated Ali to rivers, for which increases in the ing warmer summer months and that this Al pathway may,
length and severity of droughts and heat waves due to cli- thus, be exacerbated by atmospheric warming. Our results
mate change may further exacerbate effects on aquatic life. suggest that the recent 88 % to 99 % population decline of the
Because many peak Ali concentrations occur on the first ex- Southern Uplands Atlantic salmon population in NSA (Gib-
ceptionally warm day in late spring, springtime warming as- son et al., 2011) may be partially attributable to Ali , which
sociated with climate change may cause Ali peaks to occur is in contrast to earlier studies that downplayed the role of
earlier, thereby increasing the chance of the peak Ali concen- Ali in Atlantic salmon mortality (Lacroix and Townsend,
trations overlapping with the smoltification season and emer- 1987). These high Ali concentrations in NSA highlight the
gence of salmon fry, which are the most vulnerable life stages need to increase our understanding of the influence of Ali
of Atlantic salmon (e.g., Farmer, 2000), although the phenol- on both terrestrial and aquatic ecosystems as well as its im-
ogy of the smolt run is expected to similarly advance earlier plications for biodiversity. The catchments with the highest
in the year. Ali levels had particularly low Ca levels; this is cause for
concern, as Ca protects against Ali toxicity, and highlights
the coincident threats of Ca depletion and elevated Al. Re-
cent work has identified globally widespread low levels and
https://doi.org/10.5194/hess-24-4763-2020 Hydrol. Earth Syst. Sci., 24, 4763–4775, 20204772 S. M. Sterling et al.: Ionic aluminium concentrations exceed thresholds
declines in Ca (Weyhenmeyer et al., 2019), raising the ques- References
tion of what other regions may also have Ali levels exceed-
ing toxic thresholds. The serious potential consequences of Akaike, H.: A new look at statistical-model identification, IEEE
high Ali highlight the importance of actions to further re- Trans. Autom. Control, 19, 716–723, 1974.
Bailey, S. W., Driscoll, C. T., and Hornbeck, J. W.: Acid-base chem-
duce acid emissions and deposition, as critical loads are still
istry and aluminum transport in an acidic watershed and pond in
exceeded across the province (Keys, 2015), and to adapt for- New Hampshire, Biogeochemistry, 28, 69–91, 1995.
est management practices to avoid base cation removal and Baldigo, B. P. and Lawrence, G. B.: Composition of fish communi-
depletion. The addition of base cations through liming and ties in relation to stream acidification and habitat in the Neversink
enhanced weathering of soils and freshwater may accelerate River, New York, T. Am. Fish. Soc., 129, 60–76, 2000.
recovery from acidification. Bates, D., Maechler, M., Bolker, B., and Walker, S.: Fitting lin-
ear mixed-effects models using lme4, J. Stat. Soft., 67, 1–48,
https://doi.org/10.18637/jss.v067.i01, 2015.
Data availability. All of the data presented and discussed in this Beneš, F., Horecký, J., Senoo, T., Kamasová, L., Lamačová, A., Tá-
paper are provided in the Supplement. tosová, J., Hardekopf, D. W., and Stuchlík, E.: Evidence for re-
sponses in water chemistry and macroinvertebrates in a strongly
acidified mountain stream, Biologia, 72, 1049–1058, 2017.
Supplement. The supplement related to this article is available on- Berger, T., Mathurin, F. A., Gustafsson, J. P., Peltola, P., and
line at: https://doi.org/10.5194/hess-24-4763-2020-supplement. Åström, M. E.: The impact of fluoride on Al abundance and spe-
ciation in boreal streams, Chem. Geol., 409, 118–124, 2015.
Bolker, B. M., Brooks, M. E., Clark, C. J., Geange, S. W., Poulsen,
J. R., Stevens, M. H. H., and White, J.-S. S.: Generalized lin-
Author contributions. SMS conceived the idea and led the writing
ear mixed models: a practical guide for ecology and evolution,
of the paper. SM led the field data collection. SM and TAC de-
Trends Ecol. Evol., 24, 127–135, 2009.
signed the protocol for Ali sampling, assisted with data analysis,
Boudot, J. P., Becquer, T., Merlet, D., and Rouiller, J.: Aluminium
and helped with writing the article. LR performed spatial and statis-
toxicity in declining forests: a general overview with a seasonal
tical analysis, produced figures, and assisted with sample collection
assessment in a silver fir forest in the Vosges mountains (France),
and draft writing. KH assisted with data analysis, figure produc-
in: Annales des Sciences Forestières, 1994.
tion and editing, and contributed to drafting the paper. NLO led the
Brown, D.: Effect of calcium and aluminum concentrations on the
GLMM analyses and contributed to the paper. TAC provided infor-
survival of brown trout (Salmo trutta) at low pH, B. Environ.
mation on analytical and field sampling methods and helped with
Contam. Tox., 30, 582–587, 1983.
the selection of sampling sites. EAH contributed field samples, as-
Buchanan, C., Smith, Z., and Nagel, A.: Long-Term Water Quality
sisted with data analysis, and contributed to the article.
Trends in USEPA Region 3 (Mid-Atlantic), United States Envi-
ronmental Protection Agency, Rockville, MD, 2017.
Burns, D. A., McHale, M. R., Driscoll, C. T., and Roy, K. M.:
Competing interests. The authors declare that they have no conflict Response of surface water chemistry to reduced levels of acid
of interest. precipitation: comparison of trends in two regions of New York,
USA, Hydrol. Process., 20, 1611–1627, 2006.
Campbell, P. G., Hansen, H. J., Dubreuil, B., and Nelson, W.
Acknowledgements. The two anonymous referees contributed sug- O.: Geochemistry of Quebec north shore salmon rivers during
gestions that improved the paper. The Atlantic Salmon Conserva- snowmelt: organic acid pulse and aluminum mobilization, Can.
tion Foundation, the Atlantic Canada Opportunities Agency, the J. Fish. Aquat. Sci., 49, 1938–1952, 1992.
Nova Scotia Salmon Association, and Fisheries and Oceans Canada Chew, H., Johnston, L. M., Craig, D., and Inch, K.: Aluminum
provided financial support for the field data collection and the lab- contamination of groundwater: spring melt in Chalk River and
oratory analyses. Marley Geddes, Siobhan Takla, Franz Heubach, Turkey Lakes Watersheds–preliminary results, Can. J. Fish.
Lorena Heubach, Emily Bibeau, and Ryan Currie provided field as- Aquat. Sci., 45, s66–s71, 1988.
sistance. Christophersen, N., Vogt, R. D., Neal, C., Anderson, H. A., Ferrier,
R. C., Miller, J. D., and Seip, H. M.: Controlling mechanisms for
stream water chemistry at the Pristine Ingabekken Site in mid-
Financial support. Financial support was received from the Na- Norway: Some implications for acidification models, Water Re-
tional Science and Engineering Council of Canada (grant sour. Res., 26, 59–67, 1990.
no. RGPIN06958-19), the Nova Scotia Salmon Association, Fish- Clair, T. A., Dennis, I. F., Scruton, D. A., and Gilliss, M.: Freshwater
eries and Oceans Canada, the Atlantic Canada Opportunities acidification research in Atlantic Canada: a review of results and
Agency, and the Atlantic Salmon Conservation Foundation (re- predictions for the future, Environ. Rev., 15, 153–167, 2007.
search grant). Clair, T. A., Dennis, I. F., Vet, R., and Laudon, H.: Long-term trends
in catchment organic carbon and nitrogen exports from three
acidified catchments in Nova Scotia, Canada, Biogeochemistry,
Review statement. This paper was edited by Matthew Hipsey and 87, 83–97, 2008.
reviewed by two anonymous referees. Clair, T. A., Dennis, I. F., and Vet, R.: Water chemistry and dis-
solved organic carbon trends in lakes from Canada’s Atlantic
Hydrol. Earth Syst. Sci., 24, 4763–4775, 2020 https://doi.org/10.5194/hess-24-4763-2020S. M. Sterling et al.: Ionic aluminium concentrations exceed thresholds 4773 Provinces: no recovery from acidification measured after 25 Gorham, E., Underwood, J. K., Martini, F. B., and Ogden III, J. G.: years of lake monitoring, Can. J. Fish. Aquat. Sci., 68, 663–674, Natural and anthropogenic causes of lake acidification in Nova 2011. Scotia, Nature, 324, 451–453, 1986. Cozzarelli, I. M., Herman, J. S., and Parnell Jr, R. A.: The mobiliza- Helliweli, S., Batley, G. E., Florence, T. M., and Lumsden, B. C.: tion of aluminum in a natural soil system: effects of hydrologic Speciation and toxicity of aluminium in a model fresh water, En- pathways, Water Resour. Res., 23, 859–874, 1987. viron. Technol., 4, 141–144, 1983. Davies, J., Jenkins, A., Monteith, D. T., Evans, C. D., and Cooper, Hendershot, W. H., Dufresne, A., Lalande, H., and Courchesne, D. M.: Trends in surface water chemistry of acidified UK fresh- F.: Temporal variation in aluminum speciation and concentration waters, 1988–2002, Environ. Pollut., 137, 27–39, 2005. during snowmelt, in: Acidic Precipitation, Springer, 1285–1291, Dennis, I. F. and Clair, T. A.: The distribution of dissolved alu- 1986. minum in Atlantic salmon (Salmo salar) rivers of Atlantic Hendershot, W. H., Courchense, F., and Jeffries, D. S.: Aluminum Canada and its potential effect on aquatic populations, Can. J. geochemistry at the catchment scale in watersheds influenced by Fish. Aquat. Sci., 69, 1174–1183, 2012. acidic precipitation. In Sposito, G., The Environmental Chem- Driscoll, C. T. and Schecher, W. D.: The chemistry of aluminum in istry of Aluminum, Lewis Publishers, NY, 1996. the environment, Environ. Geochem. Health, 12, 28–49, 1990. Henriksen, A., Skogheim, O. K., and Rosseland, B. O.: Episodic Driscoll, C. T., Baker, J. P., Bisogni, J. J., and Schofield, C. L.: Ef- changes in pH and aluminium-speciation kill fish in a Norwegian fect of aluminium speciation on fish in dilute acidified waters, salmon river, Vatten, 40, 255–260, 1984. Nature, 284, 161–164, 1980. Hesthagen, T. and Hansen, L. P.: Estimates of the annual loss of Edzwald, J. K. and Van Benschoten, J. E.: Aluminum coagulation of Atlantic salmon, Salmo salar L., in Norway due to acidification, natural organic matter, in: Chemical water and wastewater treat- Aquacult. Res., 22, 85–92, 1991. ment, Springer, 341–359, 1990. Hesthagen, T., Fiske, P., and Saksgård, R.: Recovery of young Erlandsson, M., Cory, N., Köhler, S., and Bishop, K.: Direct and in- brown trout (Salmo trutta) in acidified streams: What are the crit- direct effects of increasing dissolved organic carbon levels on pH ical values for acid-neutralizing capacity?, Atmos. Environ., 146, in lakes recovering from acidification, J. Geophys. Res.-Biogeo., 236–244, 2016. 115, G03004, https://doi.org/10.1029/2009JG001082, 2010. Hindar, A.: Recommended liming strategies for salmon rivers in Evans, C. D., Cullen, J. M., Alewell, C., Kopácek, J., Marchetto, A., Nova Scotia, Canada, NIVA, 2001. Moldan, F., Prechtel, A., Rogora, M., Veselý, J., and Wright, R.: Hooper, R. P. and Shoemaker, C. A.: Aluminum mobilization in an Recovery from acidification in European surface waters, Hydrol. acidic headwater stream: temporal variation and mineral dissolu- Earth Syst. Sci., 5, 283–298, https://doi.org/10.5194/hess-5-283- tion disequilibria, Science, 229, 463–465, 1985. 2001, 2001. Houle, D., Ouimet, R., Couture, S., and Gagnon, C.: Base cation Exley, C., Chappell, J. S., and Birchall, J. D.: A mechanism for acute reservoirs in soil control the buffering capacity of lakes in aluminium toxicity in fish, J. Theor. Biol., 151, 417–428, 1991. forested catchments, Can. J. Fish. Aquat. Sci., 63, 471–474, Farmer, G. J.: Effects of low environmental pH on Atlantic salmon 2006. (Salmo salar L.) in Nova Scotia, Department of Fisheries and Howells, G., Dalziel, T., Reader, J. P., and Solbe, J. F.: EIFAC wa- Oceans Canada, Dartmouth, N.S., Canada, 2000. ter quality criteria for European freshwater fish: report on alu- Fernandez, I. J., Rustad, L. E., Norton, S. A., Kahl, J. S., and Cosby, minium, Chem. Ecol., 4, 117–173, 1990. B. J.: Experimental acidification causes soil base-cation deple- Jansen, B., Nierop, K. G., and Verstraten, J. M.: Mobility of Fe (II), tion at the Bear Brook Watershed in Maine, Soil Sci. Soc. Am. Fe (III) and Al in acidic forest soils mediated by dissolved or- J., 67, 1909–1919, 2003. ganic matter: influence of solution pH and metal/organic carbon Freedman, B. and Clair, T. A.: Ion mass balances and seasonal ratios, Geoderma, 113, 323–340, 2003. fluxes from four acidic brownwater streams in Nova Scotia, Can. Kerekes, J., Beauchamp, S., Tordon, R., Tremblay, C., and Pollock, J. Fish. Aquat. Sci., 44, 538–548, 1987. T.: Organic versus anthropogenic acidity in tributaries of the Ke- Gensemer, R. W. and Playle, R. C.: The bioavailability and jimkujik watersheds in western Nova Scotia, Water Air Soil Pol- toxicity of aluminum in aquatic environments, Critical Re- lut., 31, 165–1793, 1986. views in Environmental Science and Technology, 29, 315–450, Keys, K.: Acid Deposition and Base Cation Depletion in Northeast- https://doi.org/10.1080/10643389991259245, 1999. ern Forest Soils: a Review with Focus on Nova Scotia Condi- Gensemer, R. W., Gondek, J. C., Rodriquez, P. H., Arbildua, J. J., tions, Dalhousie University, Halifax, N.S., Canada, 2015. Stubblefield, W. A., Cardwell, A. S., Santore, R. C., Ryan, A. Kopáček, J., Hejzlar, J., and Porcal, P.: Seasonal patterns in chem- C., Adams, W. J., and Nordheim, E.: Evaluating the effects of istry of tributaries to Plesne and Čertovo lakes in the 1998 hydro- pH, hardness, and dissolved organic carbon on the toxicity of logical year, Silva Gabreta, 4, 105–116, 2000. aluminum to freshwater aquatic organisms under circumneutral Kopáček, J., Turek, J., Hejzlar, J., Kaňa, J., and Porcal, P.: Element conditions, Environ. Toxicol. Chem., 37, 49–60, 2018. fluxes in watershed-lake ecosystems recovering from acidifica- Gibson, A. J. F., Bowlby, H. D., Hardie, D. C., and O’Reilly, P. T.: tion: Čertovo Lake, the Bohemian Forest, 2001–2005, Biologia, Populations on the brink: low abundance of Southern Upland At- 61, S41–S426, 2006. lantic salmon in Nova Scotia, Canada, N. Am. J. Fish. Manage., Kroglund, F. and Staurnes, M.: Water quality requirements of smolt- 31, 733–741, 2011. ing Atlantic salmon (Salmo salar) in limed acid rivers, Can. J. Ginn, B. K., Cumming, B. F., and Smol, J. P.: Assessing pH changes Fish. Aquat. Sci., 56, 2078–2086, 1999. since pre-industrial times in 51 low-alkalinity lakes in Nova Sco- Kroglund, F., Finstad, B., Stefansson, S. O., Nilsen, T. O., Kris- tia, Canada, Can. J. Fish. Aquat. Sci., 64, 1043–1054, 2007. tensen, T., Rosseland, B. O., Teien, H. C., and Salbu, B.: Ex- https://doi.org/10.5194/hess-24-4763-2020 Hydrol. Earth Syst. Sci., 24, 4763–4775, 2020
4774                                                       S. M. Sterling et al.: Ionic aluminium concentrations exceed thresholds

  posure to moderate acid water and aluminum reduces Atlantic             Nilsen, T. O., Ebbesson, L. O., Handeland, S. O., Kroglund, F., Fin-
  salmon post-smolt survival, Aquaculture, 273, 360–373, 2007.              stad, B., Angotzi, A. R., and Stefansson, S. O.: Atlantic salmon
Lacoul, P., Freedman, B., and Clair, T.: Effects of acidification on        (Salmo salar L.) smolts require more than two weeks to recover
  aquatic biota in Atlantic Canada, Environ. Rev., 19, 429–460,             from acidic water and aluminium exposure, Aquat. Toxicol., 142,
  2011.                                                                     33–44, 2013.
Lacroix, G. L.: Ecological and physiological responses of Atlantic        Nilsen, T. O., Ebbesson, L. O., Kverneland, O. G., Kroglund, F.,
  salmon in acidic organic rivers of Nova Scotia, Canada, Water             Finstad, B., and Stefansson, S. O.: Effects of acidic water and
  Air Soil Pollut., 46, 375–386, 1989.                                      aluminum exposure on gill Na, K-ATPase α-subunit isoforms,
Lacroix, G. L. and Kan, K. T.: Speciation of Aluminum in Acidic             enzyme activity, physiology and return rates in Atlantic salmon
  Rivers of Nova Scotia Supporting Atlantic Salmon: A Method-               (Salmo salar L.), Aquat. Toxicol., 97, 250–259, 2010.
  ological Evaluation, Canadian Technical Report of Fisheries and         Nilsson, S. I.: Budgets of aluminium species, iron and manganese
  Aquatic Sciences, Department of Fisheries and Oceans Canada,              in the Lake Gårdsjön catchment in SW Sweden, Ecol. Bull., 37,
  St. Andrews, NB, 1986.                                                    120–132, 1985.
Lacroix, G. L. and Townsend, D. R.: Responses of juvenile Atlantic        Nilsson, S. I. and Bergkvist, B. O.: Aluminium chemistry and acidi-
  salmon (Salmo salar) to episodic increases in acidity of Nova             fication processes in a shallow podzol on the Swedish west coast,
  Scotia rivers, Can. J. Fish. Aquat. Sci., 44, 1475–1484, 1987.            Water Air Soil Pollut., 20, 311–329, 1983.
Langan, S. J. and Wilson, M. J.: Predicting the regional occurrence       Norton, S. A., Kahl, J. S., Henriksen, A., and Wright, R. F.: Buffer-
  of acid surface waters in Scotland using an approach based on             ing of pH Depressions by Sediments in Streams and Lakes,
  geology, soils and land use, J. Hydrol., 138, 515–528, 1992.              in: Acidic Precipitation, Advances in Environmental Science,
Lawrence, G. B., Dukett, J. E., Houck, N., Snyder, P., and Capone,          edited by: Norton, S. A., Lindberg, S. E., and Page, A. L., vol
  C.: Increases in dissolved organic carbon accelerate loss of toxic        4. Springer, New York, NY, https://doi.org/10.1007/978-1-4612-
  Al in Adirondack lakes recovering from acidification, Environ.            4456-1_5, 1990.
  Sci. Technol., 47, 7095–7100, 2013.                                     Parent, L. and Campbell, P. G. C.: Aluminum bioavailability to the
LaZerte, B. D.: Forms of aqueous aluminum in acidified catch-               green alga Chlorella pyrenoidosa in acidified synthetic soft wa-
  ments of central Ontario: a methodological analysis, Can. J. Fish.        ter, Environ. Toxicol. Chem., 13, 587–598, 1994.
  Aquat. Sci., 41, 766–776, 1984.                                         Parrish, D. L., Behnke, R. J., Gephard, S. R., McCormick, S. D., and
Lydersen, E.: The solubility and hydrolysis of aqueous aluminium            Reeves, G. H.: Why aren’t there more Atlantic salmon (Salmo
  hydroxides in dilute fresh waters at different temperatures, Hy-          salar)?, Can. J. Fish. Aquat. Sci., 55, 281–287, 1998.
  drol. Res., 21, 195–204, 1990.                                          Poléo, A. B.: Aluminium polymerization – a mechanism of acute
McCormick, S. D., Lerner, D. T., Monette, M. Y., Nieves-                    toxicity of aqueous aluminium to fish, Aquat. Toxicol., 31, 347–
  Puigdoller, K., Kelly, J. T., and Björnsson, B. T.: Taking it with        356, 1995.
  you when you go: how perturbations to the freshwater environ-           R Core Team.: R: A language and environment for statistical com-
  ment, including temperature, dams, and contaminants, affect ma-           puting. R Foundation for Statistical Computing, Vienna Aus-
  rine survival of salmon, in: American Fisheries Society Sympo-            tria, available at: https://www.r-project.org/ (last access: 7 Au-
  sium, 2009.                                                               gust 2020), 2019.
Monette, M. Y. and McCormick, S. D.: Impacts of short-term acid           Raudenbush, S. W., Yang, M.-L., and Yosef, M.: Maximum likeli-
  and aluminum exposure on Atlantic salmon (Salmo salar) phys-              hood for generalized linear models with nested random effects
  iology: a direct comparison of parr and smolts, Aquat. Toxicol.,          via high-order, multivariate Laplace approximation, J. Comput.
  86, 216–226, 2008.                                                        Graph. Stat., 9, 141–157, 2000.
Monteith, D. T., Evans, C. D., Henrys, P. A., Simpson, G. L., and         Regish, A. M., Kelly, J. T., O’Dea, M. F., and McCormick, S. D.:
  Malcolm, I. A.: Trends in the hydrochemistry of acid-sensitive            Sensitivity of Na /K -ATPase isoforms to acid and aluminum ex-
  surface waters in the UK 1988–2008, Ecol. Indic., 37, 287–303,            plains differential effects on Atlantic salmon osmoregulation in
  2014.                                                                     fresh water and seawater, Can. J. Fish. Aquat. Sci., 75, 1319–
Mulder, J., Christophersen, N., Hauhs, M., Vogt, R. D., Andersen,           1328, 2018.
  S., and Andersen, D. O.: Water flow paths and hydrochemical             Rodushkin, I., Moiseenko, T., and Kudravsjeva, L.: Aluminium in
  controls in the Birkenes catchment as inferred from a rainstorm           the surface waters of the Kola Peninsula, Russia, Sci. Total Env-
  high in seasalts, Water Resour. Res., 26, 611–622, 1990.                  iron., 163, 55–59, 1995.
Murdoch, P. S. and Stoddard, J. L.: The role of nitrate in the acidifi-   Rosseland, B. O., Eldhuset, T. D., and Staurnes, M.: Environmen-
  cation of streams in the Catskill Mountains of New York, Water            tal effects of aluminium, Environ. Geochem. Health, 12, 17–27,
  Resour. Res., 28, 2707–2720, 1992.                                        1990.
Neal, C., Smith, C. J., Walls, J., and Dunn, C. S.: Major, minor and      Rotteveel, L. and Sterling, S.: Five Aluminum Seasonality Regimes
  trace element mobility in the acidic upland forested catchment of         Identified in Chronically Acidified Rivers of Nova Scotia, Envi-
  the upper River Severn, Mid Wales, J. Geol. Soc., 143, 635–648,           ron. Sci. Technol., 54, 807–817, 2019.
  1986.                                                                   Schlesinger, W. H. and Bernhardt, E. S.: Biogeochemistry: an anal-
Neville, C. M.: Physiological response of juvenile rainbow trout,           ysis of global change, Academic Press, Amsterdam, the Nether-
  Salmo gairdneri, to acid and aluminum–prediction of field re-             lands, 2013.
  sponses from laboratory data, Can. J. Fish. Aquat. Sci., 42, 2004–      Schofield, C. L. and Trojnar, J. R.: Aluminum toxicity to brook
  2019, 1985.                                                               trout (Salvelinusfontinalis) in acidified waters, in: Polluted rain,
                                                                            Springer, 341–366, 1980.

Hydrol. Earth Syst. Sci., 24, 4763–4775, 2020                                               https://doi.org/10.5194/hess-24-4763-2020
S. M. Sterling et al.: Ionic aluminium concentrations exceed thresholds 4775 Schofield, C. L., Galloway, J. N., and Hendry, G. R.: Surface water Walker, W. J., Cronan, C. S., and Bloom, P. R.: Aluminum solubil- chemistry in the ILWAS basins, Water Air Soil Pollut., 26, 403– ity in organic soil horizons from northern and southern forested 423, 1985. watersheds, Soil Sci. Soc. Am. J., 54, 369–374, 1990. Seip, H. M., Andersen, D. O., Christophersen, N., Sullivan, T. J., Warby, R. A., Johnson, C. E., and Driscoll, C. T.: Chemical recov- and Vogt, R. D.: Variations in concentrations of aqueous alu- ery of surface waters across the northeastern United States from minium and other chemical species during hydrological episodes reduced inputs of acidic deposition: 1984–2001, Environ. Sci. at Birkenes, southernmost Norway, J. Hydrol., 108, 387–405, Technol., 39, 6548–6554, 2005. 1989. Warby, R. A., Johnson, C. E., and Driscoll, C. T.: Continuing acidifi- Simpson, S. L., Vardanega, C. R., Jarolimek, C., Jolley, D. F., An- cation of organic soils across the northeastern USA: 1984–2001, gel, B. M., and Mosley, L. M.: Metal speciation and potential Soil Sci. Soc. Am. J., 73, 274–284, 2009. bioavailability changes during discharge and neutralisation of Watmough, S. A., Eimers, C., and Baker, S.: Impediments to recov- acidic drainage water, Chemosphere, 103, 172–180, 2014. ery from acid deposition, Atmos. Environ., 146, 15–27, 2016. Skjelkvåle, B. L., Stoddard, J. L., Jeffries, D. S., Tørseth, K., Watt, W. D.: A summary of the impact of acid rain on Atlantic Høgåsen, T., Bowman, J., Mannio, J., Monteith, D. T., Mosello, salmon (Salmo salar) in Canada, Water Air Soil Pollut., 35, 27– R., and Rogora, M.: Regional scale evidence for improvements in 35, 1987. surface water chemistry 1990–2001, Environ. Pollut., 137, 165– Watt, W. D., Scott, C. D., Zamora, P. J., and White, W. J.: Acid 176, 2005. toxicity levels in Nova Scotian rivers have not declined in syn- Staurnes, M., Hansen, L. P., Fugelli, K., and Haraldstad, Ø: Short- chrony with the decline in sulfate levels, Water Air Soil Pollut., term exposure to acid water impairs osmoregulation, seawater 118, 203–229, 2000. tolerance, and subsequent marine survival of smolts of Altantic Wauer, G. and Teien, H.: Risk of acute toxicity for fish during alu- salmon (Salmo salar), Can. J. Fish. Aquat. Sci., 53, 1695–1704, minium application to hardwater lakes, Sci. Total Environ., 408, 1996. 4020–4025, 2010. Stoddard, J. L., Jeffries, D. S., Lükewille, A., Clair, T. A., Dillon, P. Weyhenmeyer, G. A., Hartmann, J., Hessen, D. O., Kopáček, J., J., Driscoll, C. T., Forsius, M., Johannessen, M., Kahl, J. S., and Hejzlar, J., Jacquet, S., Hamilton, S. K., Verburg, P., Leach, T. Kellogg, J. H.: Regional trends in aquatic recovery from acidifi- H., Schmid, M., and Flaim, G.: Widespread diminishing anthro- cation in North America and Europe, Nature, 401, 575, 1999. pogenic effects on calcium in freshwaters, Sci. Rep.-UK, 18, Summers, P. W. and Whelpdale, D. M.: Acid precipitation in 10450, https://doi.org/10.1038/s41598-019-46838-w, 2019. Canada, Water Air Soil Pollut., 6, 447–455, 1976. Whitfield, C. J., Aherne, J., Watmough, S. A., Dillon, P. J., and Sullivan, T. J., Christophersen, N., Muniz, I. P., Seip, H. M., Clair, T. A.: Recovery from acidification in Nova Scotia: tempo- and Sullivan, P. D.: Aqueous aluminium chemistry response to ral trends and critical loads for 20 headwater lakes, Can. J. Fish. episodic increases in discharge, Nature, 323, 324–327, 1986. Aquat. Sci., 63, 1504–1514, 2006. Tipping, E.: Acid-sensitive waters of the English Lake District: a Whitfield, C. J., Aherne, J., Dillon, P. J., and Watmough, S. A.: steady-state model of streamwater chemistry in the upper Dud- Modelling acidification, recovery and target loads for headwa- don catchment, Environ. Pollut., 60, 181–208, 1989. ter catchments in Nova Scotia, Canada, Hydrol. Earth Syst. Sci., Tomlinson, G. H., Tomlinson, F. L., Grennfelt, P., Httl, R., Htter- 11, 951–963, https://doi.org/10.5194/hess-11-951-2007, 2007. mann, A., Mehne, B. M., and von Tiedemann, S.: Effects of acid Witters, H. E., Van Puymbroeck, S., Vangenechten, J., and Vander- deposition on the forests of Europe and North America, CRC borght, O.: The effect of humic substances on the toxicity of Press Inc., 281 pp., 1990. aluminium to adult rainbow trout, Oncorhynchus mykiss (Wal- Vogt, R. D. and Muniz, I. P.: Soil and stream water chemistry in a baum), J. Fish Biol., 37, 43–53, 1990. pristine and boggy site in mid-Norway, Hydrobiologia, 348, 19– 38, 1997. https://doi.org/10.5194/hess-24-4763-2020 Hydrol. Earth Syst. Sci., 24, 4763–4775, 2020
You can also read