Denitrification by benthic foraminifera and their contribution to N-loss from a fjord environment - Biogeosciences
←
→
Page content transcription
If your browser does not render page correctly, please read the page content below
Biogeosciences, 18, 327–341, 2021
https://doi.org/10.5194/bg-18-327-2021
© Author(s) 2021. This work is distributed under
the Creative Commons Attribution 4.0 License.

Denitrification by benthic foraminifera and their contribution to
N-loss from a fjord environment
Constance Choquel1 , Emmanuelle Geslin1 , Edouard Metzger1 , Helena L. Filipsson2 , Nils Risgaard-Petersen3 ,
Patrick Launeau1 , Manuel Giraud1 , Thierry Jauffrais4,1 , Bruno Jesus5,6 , and Aurélia Mouret1
1 UMR   6112 LPG BIAF, Univ. Angers, Univ. Nantes, CNRS, Angers, France
2 Department  of Geology, Lund University, Lund, Sweden
3 Department of Biology, Aquatic Biology, Aarhus University, Aarhus, Denmark
4 Ifremer, IRD, Univ. Nouvelle-Calédonie, Univ. La Réunion, CNRS, UMR 9220 ENTROPIE, Noumea, New Caledonia
5 Université de Nantes, Mer Molécules Santé, EA 2160, Nantes, France
6 BioISI – Biosystems & Integrative Sciences Institute, Campo Grande, Faculty of Sciences,

University of Lisbon, Lisbon, Portugal

Correspondence: Constance Choquel (constance.choquel@gmail.com) and Emmanuelle Geslin
(emmanuelle.geslin@univ-angers.fr)

Received: 23 July 2020 – Discussion started: 5 August 2020
Revised: 13 November 2020 – Accepted: 1 December 2020 – Published: 15 January 2021

Abstract. Oxygen and nitrate availabilities impact the ma-       genetic models aiming to understand biogeochemical cycles
rine nitrogen cycle at a range of spatial and temporal scales.   coupled to nitrogen.
Here, we demonstrate the impact of denitrifying foraminifera
on the nitrogen cycle at two oxygen and nitrate contrast-
ing stations in a fjord environment (Gullmar Fjord, Swe-
den). Denitrification by benthic foraminifera was determined     1   Introduction
through the combination of specific density counting per
microhabitat and specific nitrate respiration rates obtained     Hypoxic water (i.e., [O2 ] < 63 µmol L−1 ; Diaz et al., 2008;
through incubation experiments using N2 O microsensors.          Breitburg et al., 2018) occurs frequently in bottom waters of
Benthic nitrate removal was calculated from submillimeter        shallow coastal seas, due to remineralization of organic mat-
chemical gradients extracted from 2D porewater images of         ter and water stratification. Hypoxia may have large ecologi-
the porewater nitrate concentration. These were acquired by      cal effects (Levin et al., 2009; Rabalais et al., 2010; Zhang
combining the DET technique (diffusive equilibrium in thin       et al., 2010), such as an increase in fauna mortality (Sta-
film) with chemical colorimetry and hyperspectral imagery.       chowitsch et al., 1984; Diaz et al., 2001). However, certain
Sediments with high nitrate concentrations in the porewa-        microorganisms, e.g., bacteria and foraminifera, can perform
ter and oxygenated overlying water were dominated by the         denitrification by respiring nitrate (Risgaard-Petersen et al.,
non-indigenous species (NIS) Nonionella sp. T1. Denitrifi-       2006) and thereby survive in depleted oxygen environments.
cation by this species could account for 50 %–100 % of the          The effects of decreasing dissolved oxygen availability at
nitrate loss estimated from the nitrate gradients. In contrast   spatial and temporal scales will impact biogeochemical cy-
sediments below hypoxic bottom waters had low inventories        cles such as the nitrogen cycle (Childs et al., 2002; Kemp
of porewater nitrate, and denitrifying foraminifera were rare.   et al., 2005; Conley et al., 2007; Diaz et al., 2008; Neubacher
Their contribution to benthic nitrate removal was negligible     et al., 2013; Breitburg et al., 2018). The nitrogen cycle in ma-
(< 5 %). Our study showed that benthic foraminifera can be       rine sediments is a perpetual balance between nitrogen inputs
a major contributor to nitrogen mitigation in oxic coastal       (e.g., terrestrial runoff, atmospheric precipitations) and out-
ecosystems and should be included in ecological and dia-         puts (e.g., denitrification from sediment and water column)
                                                                 (Galloway et al., 2004; Sigman et al., 2009). In most semi-

Published by Copernicus Publications on behalf of the European Geosciences Union.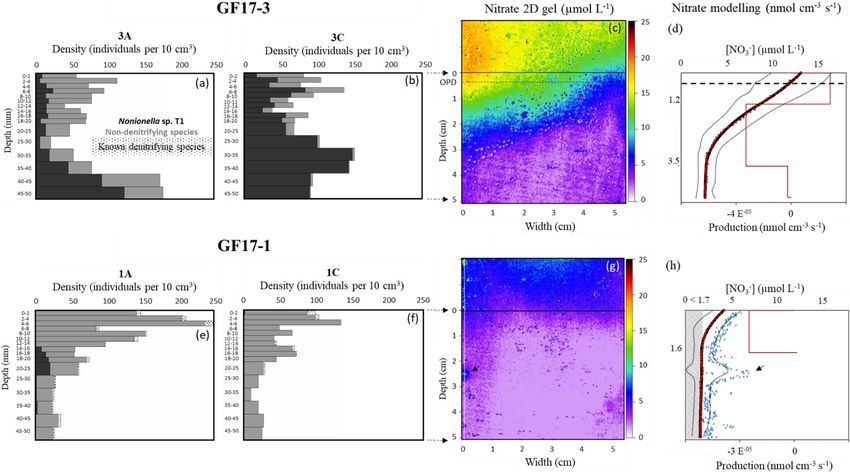
328                               C. Choquel et al.: Denitrification by benthic foraminifera and their contribution to N loss

Figure 1. Simplified nitrogen cycling in marine sediments when the bottom water is oxic (a) and hypoxic (b). Chemical formulae: PON
(particulate organic nitrogen), NH+                 −             −
                                  4 (ammonium), NO3 (nitrate), NO2 (nitrite), NO (nitrogen oxide), N2 O (nitrous oxide) and N2 (nitrogen).
The bold (dotted) arrows indicate reactions advantaged (reduced) by oxygen and nitrate presence (depletion). See text for more details.
Modified from Jantti and Hietanen (2012).

enclosed marine environments such as the Baltic Sea, the ni-           idation by Mn and Fe oxides (Luther et al., 1997; Mortimer
trogen loss through benthic denitrification exceeds the inputs         et al., 2004). In reduced sediment, dissimilatory nitrate re-
of nitrogen through nitrogen fixation. These nitrogen sink re-         duction to ammonium (DNRA) can also contribute to nitrate
gions of the ocean are mostly associated with anoxic regions           depletion leading to NO−                          +
                                                                                                 3 conversion into NH4 instead of
(Gruber and Sarmiento, 1997).                                          nitrogen (N2 ) (Christensen et al., 2000) and compete denitri-
   At oxic bottom-water conditions (Fig. 1a), ammo-                    fication.
nium (NH+   4 ) produced from remineralization of partic-                 Benthic foraminifera were the first marine eukaryotes
ulate organic nitrogen (PON) in sediments, diffuses to-                found to perform complete denitrification (Risgaard-Petersen
ward the oxic-sediment–superficial layer and through the               et al., 2006), but not all foraminifera species can deni-
sediment–water interface (SWI). Nitrification is an aer-               trify (Piña-Ochoa et al., 2010). Denitrifying foraminifera
obic process which converts NH+                          −
                                       4 to nitrate (NO3 ) in          species are defined in our study as species able to per-
the oxic sediment and in the oxic water column (Rys-                   form denitrification proved by denitrification rate measure-
gaard et al., 1994; Thamdrup and Dalsgaard, 2008). To-                 ments. The denitrifying species have a facultative anaero-
tal denitrification, the sum of “canonical denitrification”            bic metabolism and store nitrate in their cells, which can
(NO−           −
      3 → NO2 → NO → N2 O → N2 ) and anammox, is an                    be used for denitrification. Nonionella cf. stella (Charrieau
anaerobic process that converts NO−             −
                                        2 or NO3 to N gases,           et al., 2019, and references therein) and Globobulimina
e.g., N2 (Brandes et al., 2007, and references within), gen-           turgida were identified as the first denitrifying foraminifera
erating N removal from the environment. The process typ-               species (Risgaard-Petersen et al., 2006), but currently, 19
ically occurs in sediment layers where oxygen is scarce                denitrifying species within nine genera are known (Glock
(i.e., < 5 µmol L−1 ; Devol et al., 2008) and is the domi-             et al., 2019). Their cell-specific rate ranges from 7 ± 1 to
nant process of nitrate reduction in coastal marine sediments          2241 ± 1825 pmol N indiv.−1 d−1 (Glock et al., 2019), and
(Thamdrup and Dalsgaard, 2008; Herbert, 1999). Denitrifi-              the contribution of benthic foraminiferal communities to
cation depends on the nitrate transported from the water col-          benthic denitrification lies in the range from 1 % to 90 %
umn and adjacent sedimentary nitrification zones. Nitrifica-           (Kamp et al., 2015, Dale et al., 2016; Xu et al., 2017).
tion and denitrification are thereby strongly coupled (Kemp               Recently, a non-indigenous and suspected invasive Non-
et al., 1990; Cornwell et al., 1999). This dependency on nitri-        ionella stella morphotype: Nonionella sp. T1 was described
fication can imply a reduction in denitrification rates as bot-        in the North Sea region (Deldicq et al., 2019) and also re-
tom water turns hypoxic (Fig. 1b), since nitrification rates           ported from the Gullmar Fjord (Sweden) (< 5 %; Polovodova
are reduced as nitrification cannot proceed under low oxygen           Asteman and Schönfeld, 2015). The genus Nonionella is po-
concentrations (∼ 0 µmol L−1 ; Rysgaard et al., 1994; Mor-             tentially capable to denitrify as demonstrated for Nonionella
timer et al., 2004). The exception, however, is anoxic nitrifi-        cf. stella by Risgaard-Petersen et al. (2006). However, the
cation occurring through secondary reactions with NH+    4 ox-         non-indigenous species (NIS) Nonionella sp. T1 morpho-

Biogeosciences, 18, 327–341, 2021                                                           https://doi.org/10.5194/bg-18-327-2021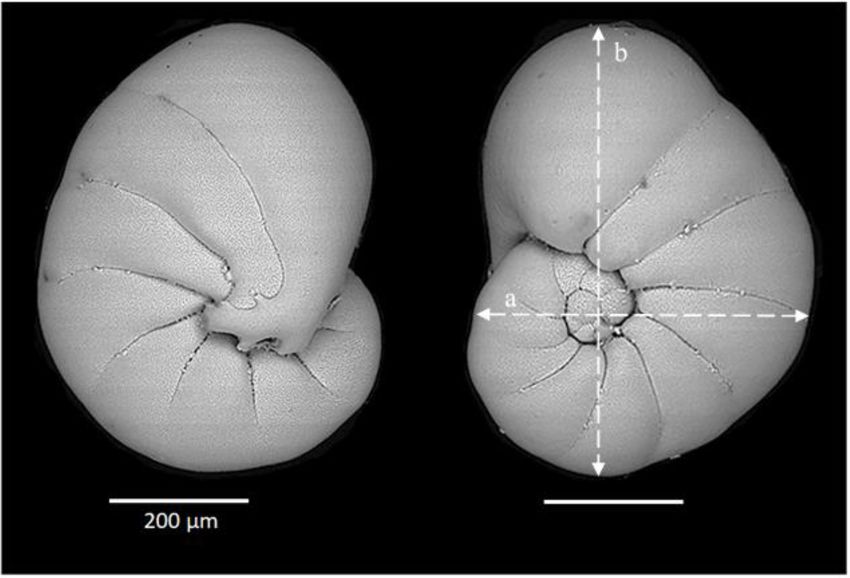
C. Choquel et al.: Denitrification by benthic foraminifera and their contribution to N loss                                    329

type differs both morphologically and genetically from Non-        tion and concentration of nitrate at a scale relevant for mod-
ionella stella specimens sampled previously at other local-        eling denitrification rates.
ities, such as the Santa Barbara Basin (California, USA)              The general objectives of the study are (1) to characterize
(Charrieau et al., 2018) and the Kattegat and Oslo Fjord           the density of the living, benthic foraminifera at two contrast-
(Norway) (Deldicq et al., 2019). As a consequence, the den-        ing stations in the Gullmar Fjord: one with oxic bottom water
itrification capacity of the NIS Nonionella sp. T1 is unclear.     and one with hypoxic bottom water. We will in particular fo-
   In the present study, we investigate if the suspected in-       cus on the relative abundance of the NIS Nonionella sp. T1
vasion of the NIS Nonionella sp. T1 has any implication            (2) to investigate if this NIS Nonionella sp. T1 can denitrify,
for the nitrogen cycle in sections of the Gullmar Fjord            and (3) we quantify its eventual contributions to benthic den-
(Sweden) that is subjected to hypoxic events. Several den-         itrification in the sediments. On the basis of the results, we
itrifying foraminifera species are present in the Gullmar          will discuss the probable future impact of the NIS Nonionella
Fjord sediments: Globobulimina turgida (Risgaard-Petersen          sp. T1 on the foraminifera fauna and the nitrogen cycle in the
et al., 2006), Globobulimina auriculata (Woehle et al.,            Gullmar Fjord.
2018), Stainforthia fusiformis and Bolivina pseudopunctata
(Gustafsson and Nordberg, 2001; Filipsson and Nordberg,
2004). The denitrification capacity of the last two species in     2     Material and methods
the Gullmar Fjord is indicative from direct measurement on
affiliated species sampled at the coast of Peru, Bay of Biscay     2.1    Site description and sampling conditions
(France) and Santa Barbara Basin (Glock et al., 2019; Piña-
Ochoa et al., 2010; Bernhard et al., 2012). However, sev-          The Gullmar Fjord is 28 km long, 1–2 km wide and lo-
eral species, which apparently lack the ability to denitrify but   cated on the Swedish west coast (Fig. 2). The fjord un-
are able to survive anoxia, are also present in the sediments      dergoes fluctuations between cold and temperate climates
of the fjord. These include Bulimina marginata, Cassidulina        (Svansson, 1975; Nordberg, 1991; Polovodova Asteman and
laevigata, Hyalinea balthica, Leptohalysis scotti, Liebusella      Nordberg, 2013; Polovodova Asteman et al., 2018). The
goesi, Nonionellina labradorica and Textularia earlandi. In        fjord is stratified (Fig. 2d) into four water masses (Svans-
the context of ecosystem function and service, it is there-        son, 1984; Arneborg, 2004). Hypoxia events in the fjord
fore of interest to understand whether the NIS Nonionella sp.      have been linked to the influence of the North Atlantic Os-
T1 can denitrify – and thereby if its invasion into the Gull-      cillation (NAO) (Nordberg et al., 2000; Björk and Nord-
mar Fjord maintains (or elevates) the denitrification capac-       berg, 2003; Filipsson and Nordberg, 2004). Several moni-
ity of the overall foraminifera community and thus the sedi-       toring stations are located in the fjord: Släggö (65 m wa-
ment – or, alternatively, if the organism shares a metabolism      ter depth), Björkholmen (70 m water depth) and Alsbäck
similar to the non-denitrifying specimens above. This would        (117 m water depth); the hydrographic and nutrient data
have the possible consequence that the suspected invasion          were obtained from the Swedish Meteorological and Hy-
of NIS Nonionella sp. T1 implies reduced contribution of           drological Institute’s (SMHI’s) publicly available database
foraminifera-based denitrification to the loss of N from the       SHARK (SMHI, 2020). Since 2010, the threshold of hy-
fjord.                                                             poxia ([O2 ] < 2 mg L−1 , i.e., 63 µmol L−1 ) in Alsbäck station
   Estimates of foraminiferal contribution to benthic denitri-     (red squares, Fig. 3) is reached typically in late autumn and
fication are limited by the high spatial and temporal variabil-    winter. Deep-water exchanges usually occur in late winter
ity of sediment geochemistry and distribution of denitrify-        to early spring. However, the duration of hypoxia varies be-
ing foraminifera. Marine sediments often include chemical          tween years, and hypoxia events occurred in the summers
micro-heterogeneities (Aller et al., 1998; Stockdale et al.,       of 2014 and 2015, due to a lack of deep-water exchange. The
2009), which can be averaged out within the volume of a sed-       frequency of hypoxic events has increased in the fjord (Nord-
iment slice. Moreover, sediment core slicing or centrifuga-        berg et al., 2000; Filipsson and Nordberg, 2004).
tion can induce cell lysis, which can lead to a bias in porewa-       Two sampling cruises were conducted in the Gullmar
ter nitrate concentrations (Risgaard-Petersen et al., 2006). To    Fjord with R/V Skagerak and R/V Oscar von Sydow. The
obtain better estimates of the chemical microenvironments at       2017 cruise (GF17) took place between 14 and 15 November
relevant submillimeter or millimeter scales, new approaches        2017, and two stations were sampled (GF17-3 and GF17-1,
have to be used. Recently, a 2D-DET (two-dimensional dif-          Fig. 2c and d) to define the living foraminiferal fauna and the
fusive equilibrium in thin film) technique combined with col-      sediment geochemistry at two contrasting stations. The 2018
orimetry and hyperspectral imagery was developed to obtain         cruise (GF18) took place on the 5 September 2018 with a
the distribution of nitrite and nitrate in sediment porewater      focus to collect living Nonionella sp. T1 for O2 respiration
at millimeter resolution in two dimensions (Metzger et al.,        and denitrification rate measurements. Only one station (at
2016). This method avoids mixing of intracellular nitrate and      the same position as GF17-3) was sampled.
the nitrate contained in the sediment porewater. We will ap-          GF17-3 (50 m water depth) is located closest to the mouth
ply this technique here to get information about the distribu-     of the fjord (58◦ 160 50.9400 N, 11◦ 300 30.9600 E) with bottom

https://doi.org/10.5194/bg-18-327-2021                                                       Biogeosciences, 18, 327–341, 2021
330                               C. Choquel et al.: Denitrification by benthic foraminifera and their contribution to N loss

Figure 2. (a–c) Location of studied stations in the Gullmar Fjord (Sweden); blue diamond: GF17-3 oxic station (50 m water depth); red
square: GF17-1 hypoxic station (117 m water depth); dark circles: monitoring stations Släggö (65 m water depth) and Björkholmen (70 m
water depth). (d) Transect from the sill with the four Gullmar Fjord water masses and the studied stations (modified from Arneborg et al.,
2004).

waters from the Skagerrak (blue diamond, Fig. 3), and GF17-            samples were incubated without light for 10–19 h in ambi-
1 (117 m water depth) is located close to the deepest part             ent seawater with CellTracker Green (CMFDA, 1 mM final
of the fjord (58◦ 190 41.4000 N, 11◦ 330 8.4000 E) near Alsbäck        concentration) at in situ temperature (Bernhard et al., 2006)
monitoring station in the middle of the stagnant basin (red            and then fixed with ethanol 96 %. Fixed samples were sieved
square, Fig. 3). In November 2017, CTD (conductivity, tem-             (> 355, 150, 125 and 100 µm), and the > 100 µm fraction, the
perature, depth) profiles indicated the water mass structures          most commonly used fraction for foraminiferal analyses in
at both stations (Fig. S1 in the Supplement). Bottom wa-               the Gullmar Fjord (see Charrieau et al., 2018, and references
ter at GF17-3 station was oxic with a dissolved oxygen                 therein), was examined using an epifluorescence microscope
content of 234 µmol L−1 . The dissolved oxygen content de-             equipped for fluorescein detection (i.e., 470 nm excitation;
creased strongly with depth at the GF17-1 station, reaching            Olympus SZX13). In the present study, the foraminiferal dis-
9 µmol L−1 at the seafloor, which is below the severe hypoxia          tribution will be described, highlighting the NIS Nonionella
threshold.                                                             sp. T1.

                                                                       2.3   Geochemical sampling and processing
2.2   Foraminifera sampling and processing
                                                                       One core from the shallow GF17-3 station was reserved for
During the 2017 cruise, two sediment cores per station (1A             O2 microelectrode profiling. Oxygen concentration was mea-
and 1C for station GF17-1 and 3A and 3C for station GF17-              sured in the dark with a Clark electrode (50 µm tip diame-
3) were immediately subsampled with a smaller cylindri-                ter, Unisense® , Denmark) within the first 5 mm depth at a
cal core (∅ 8.2 cm). They were sliced every 2 mm from the              100 µm vertical resolution. Due to technical problems, no
sediment surface to 2 cm depth and every 5 mm from 2 to                oxygen profiling was done at the GF17-1 station.
5 cm depth to study the living-foraminifera distribution. The

Biogeosciences, 18, 327–341, 2021                                                           https://doi.org/10.5194/bg-18-327-2021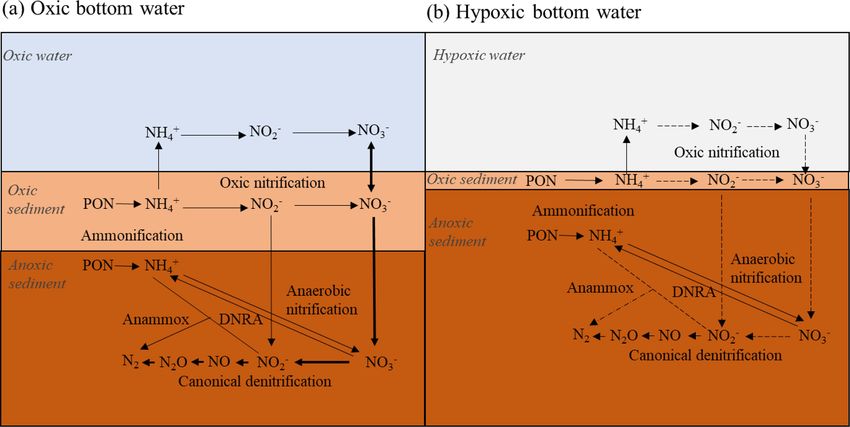
C. Choquel et al.: Denitrification by benthic foraminifera and their contribution to N loss 331
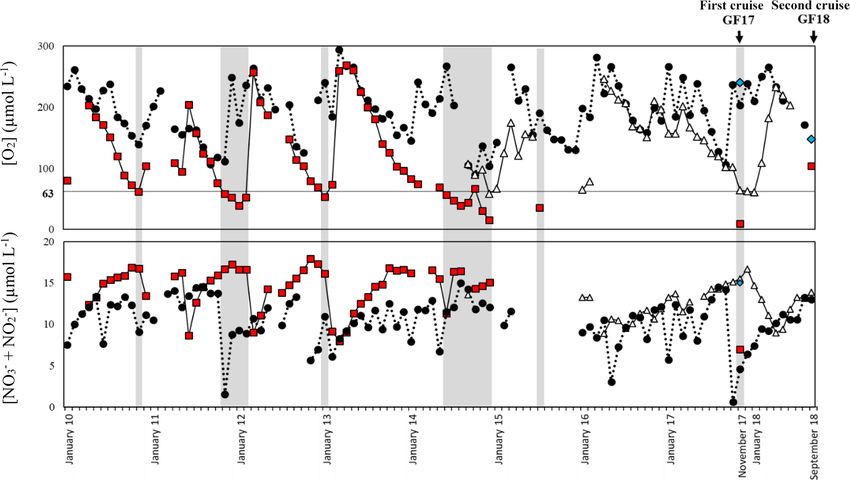
Figure 3. Record from January 2010 to September 2018 of bottom-water oxygen ([O2 ]) and nitrite + nitrate ([NO− −
3 + NO2 ]) measurements
from the monitoring stations Släggö (65 m water depth; black dot), Björkholmen (70 m water depth; white triangle) and the sampling stations
GF17-1 (Alsbäck, 117 m water depth; red square) and GF17-3 (50 m water depth; blue diamond). The arrows indicate the date of the two
sampling cruises: the 2017 cruise (14 and 15 November 2017) and the 2018 cruise (5 September 2018). The grey zones indicate hypoxic
periods with a threshold of [O2 ] < 63 µmol L−1 .
One core per station was dedicated for geochemical anal- the acquisition of another hyperspectral image and the con-
yses; they were carefully brought to Lund University (Swe- version into false colors through a calibrated scale of con-
den) and stored at in situ temperature (10 ◦ C) until further centrations, the final gel images were cropped to avoid bor-
analysis the next day. Overlaying water of the GF17-3 core der effects. Each pixel (190 µm × 190 µm) was decomposed
was gently air bubbled to maintain the oxygenated conditions as a linear combination of the logarithm of the different end-
recorded at this station. Hypoxia in the overlaying water of member spectra using ENVI software (unmixing function)
the GF17-1 core was maintained by bubbling with N2 gas (Cesbron et al., 2014; Metzger et al., 2016). Nitrite and ni-
passed through a solution of carbonate/bicarbonate to avoid trate detection limits are 1.7 µmol L−1 (Metzger et al., 2016).
pH rise due to degassing of CO2 .
Nitrite plus nitrate concentrations were analyzed using the 2.4 Oxygen and nitrate respiration rate measurements
2D-DET method from Metzger et al. (2016). In brief, for of the NIS Nonionella sp. T1
each core, a DET (diffusive equilibrium in thin films) gel
probe (16 cm × 6.5 cm and 0.1 cm thickness) was prepared The two cores sampled during the 2018 cruise (GF18) at
by hand. The gel probe was inserted into the sediment and the shallower GF17-3 station were carefully transported and
left for 5 h to allow for diffusive equilibration between the stored at in situ temperature (8 ◦ C) for 3 d at the Depart-
gel and porewaters. After equilibration, the gel was removed ment of Geosciences, Aarhus University (Denmark). Non-
from the core and laid on a NO− ionella sp. T1 specimens were picked at in situ tempera-
2 reagent gel first. After
15 min at ambient temperature, a pink coloration must appear ture and collected in a Petri dish, containing a thin layer of
where nitrite is detected. A reflectance image of the nitrite sediment (32 µm), to check their vitality. Only living, active
gels was taken with a hyperspectral camera (HySpex VNIR Nonionella sp. T1 specimens were picked using a brush and
1600). The next step was to convert existing nitrate into ni- cleaned several times with micro-filtered, nitrate-free artifi-
trite with the addition of a reagent gel of vanadium chloride cial seawater.
(VCl3 ). After 20 min at 50 ◦ C, additional pink coloration is Oxygen respiration rates were measured, following the
interpreted as porewater nitrate concentration. Followed by method developed by Høgslund et al. (2008) using a Clark-
type oxygen microsensors (50 µm tip diameter, Unisense® ,
https://doi.org/10.5194/bg-18-327-2021 Biogeosciences, 18, 327–341, 2021332 C. Choquel et al.: Denitrification by benthic foraminifera and their contribution to N loss
Denmark) (Revsbech, 1989). The O2 sensor was calibrated
at in situ temperature (8 ◦ C) in 0.7 M alkaline ascorbate so-
lution (zero O2 ) and air-saturated sea water. Then, a pool of
five living Nonionella sp. T1 was transferred into a glass mi-
crotube (inner diameter 0.5 mm, height 7.5 mm), that was
fixed inside a 20 mL test tube mounted in a glass-cooling
bath (8 ◦ C). A motorized micromanipulator was used to mea-
sure O2 concentration profiles along a distance gradient that
ranged from 200 µm of the foraminifera to 1200 µm using
100 µm steps. Seven O2 concentration profiles were gener-
ated with one incubation containing the pool of Nonionella
sp. T1. Negative controls were done by measuring O2 rates
from a microtube with empty foraminiferal shells and blanks
with an empty microtube. Oxygen respiration rates were cal-
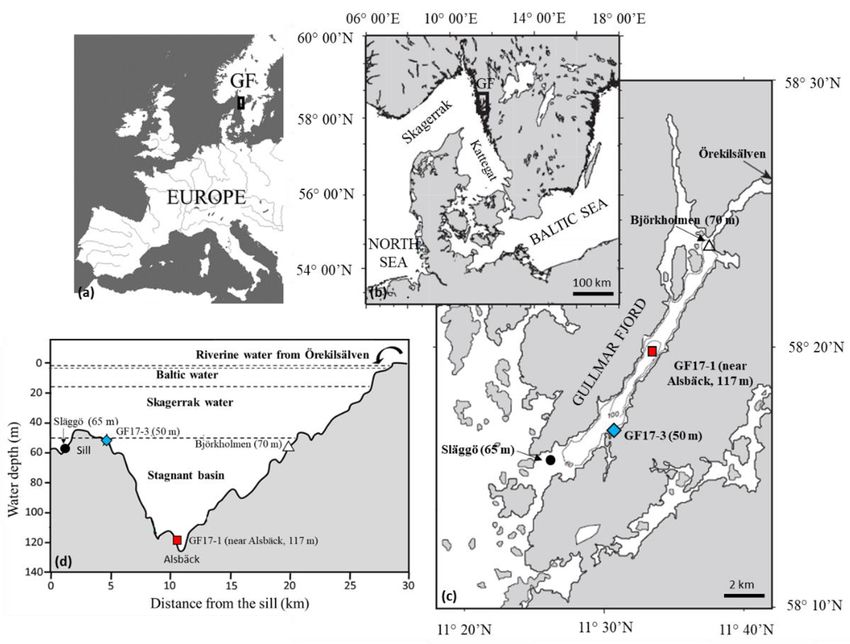
culated with Fick’s first law of diffusion: J = −D · dC/dx, Figure 4. Scanning electronic microscope images of a Nonionella
where J is the flux, dC/dx is the concentration gradient ob- sp. T1 from the GF17-3 oxic station in the Gullmar Fjord. White
tained by profiles and D is the free diffusion coefficient of lines (labeled a and b) correspond to measured distances serving for
oxygen at 8 ◦ C for a salinity of 34 (1.382 × 10⁻⁵ cm−2 s−1 , a spheroid prolate volume model.
Ramsing and Gundersen, 1994). The seven O2 respiration
rates were calculated as the product of the flux by the cross-
sectional area of the microtube (0.196 mm2 ). Then, the av- specimens sampled during the 2018 cruise (GF18, denitrifi-
erage O2 respiration rate was divided by the number (n = 5) cation rate measurements).
of Nonionella sp. T1 present in the microtubes to obtain the
respiration rate per individual. 2.5 Contributions of the NIS Nonionella sp. T1 to
The same pool of Nonionella sp. T1 specimens as for benthic denitrification
the O2 respiration measurements was used for denitrification
measurements. These measurements were performed in the Benthic denitrification was estimated using the 2D nitrate
microtubes as described in Høgslund et al. (2017). A N2 O concentrations obtained with the DET technique. An aver-
microprobe (Andersen et al., 2001) with a 50 µm tip diame- age 1D nitrate profile was obtained by calculating the mean
ter was used to measure the N2 O concentration profile, that of 290 vertical profiles ((5.5 cm width × 1 pixel)/0.019 cm
developed in the chamber after acetylene inhibition of the for 1 pixel size) extracted from the 2D concentration image.
final step in the denitrification process (N2 O → N2 ). Cali- Then, nitrate production and consumption zones were calcu-
bration of the sensor was performed using the standard ad- lated with PROFILE software (Berg et al., 1998). With the
dition method by successive injections of a N2 O-saturated assumption that nitrate consumption was equivalent to deni-
solution in order to have 14 µM steps of final concentra- trification, the benthic denitrification rate was calculated by
tion. The cell-specific N2 O production rate was calculated integrating nitrate consumption over the depth.
from the N2 O flux (estimated from the concentration gra- The denitrification activity of the NIS Nonionella sp. T1
dient and Fick’s first law), the surface area of the micro- population was calculated using the specimen abundances in
tube (0.25 mm2 ) and the number of Nonionella sp. T1 in the the nitrate consumption zones and their cell-specific activity.
tubes (n = 5) as described above. Rates are reported with the The size of the Nonionella sp. T1 specimens sampled during
unit pmol N indiv.−1 d−1 . the two cruises, however, differed markedly (Table 1). The
Since O2 respiration and denitrification rates are linked cell-specific denitrification rate of denitrifying foraminifera
to cytoplasmic volumes or biovolumes (BVs) (Geslin et al., is correlated with their size according to the following model:
2011; Glock et al., 2019), the specimens from the pool of ln(y) = 0.68 ln(x) − 5.57, where y is the denitrification rate
Nonionella sp. T1 were measured (width (a) and length (b), (pmol ind−1 d−1 ) and x is the shell BV (µm3 ) (Geslin et al.,
Fig. 4) using a micrometer mounted on a Leica stereomicro- 2011; Glock et al., 2019; Eq. S1 in the Supplement), and we
scope (MZ 12.5) to estimate the average BV. The volume of therefore used this model to correct the denitrification esti-
each shell was estimated by using the best resembling geo- mates for size-specific variations.
a 2 b
4 A maximum estimate of the contribution of the NIS Non-
metric shape, a spheroid prolate V = 3 π 2 2 . Then,
according to Hannah et al. (1994), 75 % of the measured ionella sp. T1 population to benthic denitrification was ob-
entire volume of the shell was used as the estimated cyto- tained from the ratio of the denitrification activity of Non-
plasmic volume. Five Nonionella sp. T1 specimens sampled ionella sp. T1 population and the benthic denitrification rate
during the 2017 cruise (GF17, study of the fauna) were also estimated from the porewater nitrate concentration profiles.
measured to compare their average size with the size of the This presumes that Nonionella sp. T1 exclusively uses nitrate
dissolved in the sediment porewater as a source for denitri-
Biogeosciences, 18, 327–341, 2021 https://doi.org/10.5194/bg-18-327-2021C. Choquel et al.: Denitrification by benthic foraminifera and their contribution to N loss 333
Table 1. Total shell volume (µm3 ) and the biovolume (BV, µm3 ) corresponding to 75 % of the total shell volume measured on the pool of
five Nonionella sp. T1 from the 2017 and the 2018 cruises in the Gullmar Fjord. Abbreviations: Ind. (individual).
Nonionella sp. T1 First cruise total First cruise BV Second cruise total Second cruise BV
shell volume shell volume
Ind. 1 6.7 × 10+06 5.0 × 10+06 3.1 × 10+06 2.3 × 10+06
Ind. 2 4.5 × 10+06 3.4 × 10+06 2.4 × 10+06 1.8 × 10+06
Ind. 3 5.1 × 10+06 3.8 × 10+06 1.4 × 10+06 1.0 × 10+06
Ind. 4 4.9 × 10+06 3.7 × 10+06 9.2 × 10+05 6.9 × 10+05
Ind. 5 5.8 × 10+06 4.4 × 10+06 6.2 × 10+05 4.7 × 10+05
Average (µm3 ) 5.4 × 10+06 4.0 × 10+06 1.7 × 10+06 1.3 × 10+06
SD (µm3 ) 0.8 × 10+06 0.6 × 10+06 1.0 × 10+06 0.7 × 10+06
fication (calculation approach A). A minimum estimate of concentration was 14.6 ± 2.3 µmol L−1 and nitrate concen-
the contribution of Nonionella sp. T1 population to benthic tration decreased with depth in the sediment (Fig. 5c
denitrification was obtained from the ratio between the den- and d). Nitrate concentrations ranged from 13.1 ± 3.2 to
itrification activity of Nonionella sp. T1 population and the 11.7 ± 3.4 µmol L−1 , from the SWI to the OPD. Nitrate
benthic denitrification rate estimated from porewater nitrate concentrations decreased strongly under the OPD from
concentration profiles plus the denitrification activity of Non- 11.7 ± 3.4 to 2.8 ± 0.9 µmol L−1 at 4.0 cm depth. From 4.0
ionella sp. T1 population. This presumes that Nonionella sp. to 5.0 cm depth, NO− 3 concentration was very low with an
T1 exclusively uses intracellular nitrate as a source for deni- average value of 2.7 ± 0.9 µmol L−1 (Fig. 5c and d). The
trification (calculation approach B). PROFILE parameters (Berg et al., 1998) used on laterally
averaged nitrate porewater vertical distribution of both sta-
tions are available in Table S1 in the Supplement. Thus, the
3 Results PROFILE modeling of the averaged nitrate porewater profile
revealed one nitrification zone from 0 to 1.2 cm depth and
3.1 The NIS Nonionella sp. T1 oxygen and nitrate two denitrifying zones (red line, Fig. 5d). The first denitri-
respiration rates in the Gullmar Fjord fication zone occurred between 1.2 and 3.5 cm depth with a
nitrate consumption of 3.92 × 10−05 nmol cm−3 s−1 , and the
The O2 respiration rate measured from the pool of Non- second smaller consumption zone was from 3.5 to 5 cm depth
ionella sp. T1 specimens collected during the 2018 cruise (1.53 × 10−06 nmol cm−3 s−1 ). The total denitrification rate
(GF18) was 169 ± 11 pmol O2 indiv.−1 d−1 with an average from 1.2 to 5 cm depth was 4.07 × 10−05 nmol cm−3 s−1
BV of 1.3 ± 0.7 × 10+06 µm3 (BV details, Table 1). The den- (Fig. 5d).
itrification rate measured from the same pool of specimens The total densities of living foraminifera were similar
was 21 ± 9 pmol N indiv.−1 d−1 . between cores GF17-3A and GF17-3C (∅ 8.2 cm, 5 cm
The Nonionella sp. T1 average BV of the speci- depth) with 1256 individuals and 1428 individuals, respec-
mens collected during the 2017 cruise (GF17-3) was tively (Fig. 5a and b; Table S2 in the Supplement, GF17-
4.0 ± 0.6 × 10+06 µm3 , i.e., more than 3 times the 3A and GF17-3C). Nonionella sp. T1 was the main denitri-
Nonionella sp. T1 average BV of the 2018 samples fying species, accounting for 34 % of the total living fauna
(1.3 ± 0.7 × 10+06 µm3 ). As denitrification rates and in core GF17-3A and 74 % in GF17-3C (Fig. 5a and b; Ta-
foraminiferal BVs are related (see “Material and methods” ble S3 in the Supplement). One other candidate for denitri-
section), the measured denitrification rate was corrected fication, Stainforthia fusiformis, was in minority: 1 % of the
using the BV of Nonionella sp. T1 from the 2017 cruise. total fauna in both cores (Fig. 5a and b; Table S3, GF17-
Hence, the Nonionella sp. T1 corrected denitrification rate 3A and GF17-3C). The other known denitrifying species
was 38 ± 8 pmol N indiv.−1 d−1 (Eq. S1). previously reported in the Gullmar Fjord, Globobulimina
turgida (Risgaard-Petersen et al., 2006) and Globobulimina
3.2 The NIS Nonionella sp. T1 and foraminiferal fauna
auriculata (Whoele et al., 2018), were absent. Three non-
regarding porewater nitrate micro-distribution
denitrifying species (Piña-Ochoa et al., 2010; Xu et al., 2017;
Glock et al., 2019) were dominant in cores GF17-3A and
The bottom water at GF17-3 station was oxic (Fig. S1,
GF17-3C: Bulimina marginata (37 % and 5 %, respectively),
[O2 ] = 234 µmol L−1 ), and the measured oxygen penetra-
Cassidulina laevigata (9 % and 5 %, respectively) and Lep-
tion depth (OPD) in the sediment was 4.7 ± 0.2 mm (n =
tohalysis scotti (11 % and 9 %, respectively).
3). No nitrite was revealed on the gel (< 1.7 µmol L−1 );
only nitrate was detected. Bottom-water average NO− 3
https://doi.org/10.5194/bg-18-327-2021 Biogeosciences, 18, 327–341, 2021334 C. Choquel et al.: Denitrification by benthic foraminifera and their contribution to N loss Figure 5. Micro-distributions of living-foraminifera densities in GF17-3 oxic station (a, b) and in GF17-1 hypoxic station (e, f). Nonionella sp. T1 specimens are in black, the sum of the non-denitrifying species is in grey and the small dots (e, f) show the other denitrifying species (known and potential candidates). The maps of porewater nitrate 2D gels are presented for stations GF17-3 (c) and GF17-1 (g). The SWI is represented by a black line at 0 cm depth (c, g), and the OPD (oxygen penetration depth) is represented by the dashed line in bold at 4.7 ± 0.2 mm depth (c). Nitrate 1D profiles (d and h, black dots) are calculated using the average value of each pixel line of the nitrate distribution image (290 pixels wide); the SD is represented by two fine, dotted lines. The corresponding best-fitting concentration profiles (red dots, d and h) and the production zones (red line) are modeled with PROFILE software. The 1D profile corresponding to x = 1 mm (white line, g) is represented with a blue square profile (h), and the deep nitrate spot is indicated by a black arrow. The grey hatching zone (h) represents the detection limit of the nitrate 2D gel (< 1.7 µmol L−1 ). The density and the micro-distribution of Nonionella sp. the first denitrifying zone (1.2–3.5 cm depth), B. marginata T1 differed between the two cores (Fig. 5a and b; Table S2, accounted for 34 % and 2 %, C. laevigata for 7 % and 2 %, GF17-3A and 3C). Nonionella sp. T1 relative abundance ac- and L. scotti for 25 % and 13 % (GF17-3A and GF17-3C, re- counted for 18 % and 50 % of the fauna in the nitrification spectively). In the second denitrifying zone (3.5–5 cm depth), zone (from the SWI to 1.2 cm depth) for cores GF17-3A B. marginata accounted for 34 % and 0 %, C. laevigata was and GF17-3C, respectively (Table S3). In the main denitri- absent, and L. scotti 5 % and 1 % (GF17-3A and GF17-3C, fying zone (from 1.2 to 3.5 cm), the Nonionella sp. T1 rela- respectively). tive abundance represented 27 % of the fauna for core GF17- Due to severe hypoxia at the GF17-1 station, oxygen was 3A and 78 % for core GF17-3C. In the second denitrifying assumed to be below detection limit within the sediment. zone, the Nonionella sp. T1 relative abundance increased No nitrite was detected at this station (< 1.7 µmol L−1 ). from 3.5 to 5 cm depth and dominated the fauna with relative Average NO− 3 concentration in the bottom water reached abundances of 60 % and 98 % (GF17-3A and GF17-3C, re- 5.7 ± 1.0 µmol L−1 (Fig. 5g and h). Nitrate concentrations spectively). The relative abundance of the denitrifying candi- decreased from the SWI (4.2 ± 1.0 µmol L−1 ) to 1.6 cm depth date, Stainforthia fusiformis, was a minor component in each (1.8 ± 0.6 µmol L−1 ), and then average nitrate concentration zones of both cores and did not exceed 2 % (Table S3, GF17- remained below the detection limit (1.7 µmol L−1 ). However, 3A and GF17-3C). The three non-denitrifying species (e.g., a microenvironment with higher nitrate concentration was B. marginata, C. laevigata and L. scotti) also dominated the visible on the left part of the gel between 2.0 and 3.0 cm fauna of both cores (Tables S2 and S4 in the Supplement). depth. A 1D vertical profile passing through this microen- From the SWI to 1.2 cm depth, B. marginata accounted for vironment (white line, Fig. 5g) was extracted from the 2D 42 % and 12 %, C. laevigata 16 % and 13 %, and L. scotti 6 % image, and the maximal nitrate concentration of this patch and 11 % for cores GF17-3A and GF17-3C, respectively. In was above the detection limit with a value of 6.5 µmol L−1 Biogeosciences, 18, 327–341, 2021 https://doi.org/10.5194/bg-18-327-2021
C. Choquel et al.: Denitrification by benthic foraminifera and their contribution to N loss                                       335

at 2.3 cm depth (blue square profile, Fig. 5h). The PROFILE        earliest SEM (scanning electron microscopy) observations
modeling (Table S1) of the laterally averaged nitrate verti-       of specimens resembling the Nonionella sp. T1 morpho-
cal distribution revealed at the sampling time one denitrify-      type in the deepest part of the fjord date back to summer
ing zone from the SWI to 1.6 cm depth with a nitrate con-          1993 (identified as Nonionella turgida; Gustafsson and Nord-
sumption of 2.71 × 10−05 nmol cm−3 s−1 (red line, Fig. 5h).        berg, 2001). The invasive characteristics of Nonionella stella
No PROFILE modeling was done under 1.6 cm depth, be-               were firstly revealed by Polovodova Asteman and Schönfeld
cause nitrate concentration was below the detection limit          (2015). Then, Nonionella stella was identified as the Non-
(grey hatching zone, Fig. 5h).                                     ionella sp. T1 morphotype also described as a NIS and po-
   Living foraminifera showed a large difference in both           tentially invasive species in the Oslofjord by Deldicq et al.
species distribution and total densities between the two cores     (2019). The estimated introduction date of Nonionella sp. T1
GF17-1A and GF17-1C (Fig. 5e and f; Table S2) with 1457            into the deepest part of the Gullmar Fjord is 1985 accord-
individuals and 786 individuals, respectively (∅ 8.2, 5 cm         ing to Polovodova Asteman and Schönfeld (2015). The rela-
depth). Nonionella sp. T1 represented a low relative abun-         tive abundance of Nonionella sp. T1 in the deepest fjord sta-
dance of the total fauna with 5 % for core GF17-1A and             tion was less than 5 % between 1985 and 2007 (Polovodova
was almost absent (1 %) for core GF17-1 C (Table S3).              Asteman and Schönfeld, 2015, and references within). At the
The known denitrifying species G. auriculata was minor in          GF17-1 hypoxic station, the Nonionella sp. T1 relative abun-
the fauna with relative abundances of 1 % and 2 % (GF17-           dance was between 1 %–5 % (Table S3, GF17-1A and GF17-
1A and GF17-1C, respectively). The denitrifying candidate          1C). Thus, the Nonionella sp. T1 relative abundance in the
S. fusiformis was also found in both cores, reaching only 3 %      deepest part of the fjord seems to have remained stable. In
of the total fauna (Fig. 5e and f; Table S3). The other denitri-   contrast to GF17-1 station, the GF17-3 oxic station was sam-
fying candidate, B. pseudopunctata, was almost absent in the       pled for the first time in this study. In this station closer to the
total fauna with relative abundances of 0 % and 2 % for cores      mouth of the fjord than GF17-1, the relative abundance of
GF17-1A and GF17-1C, respectively (Table S3). The same             Nonionella sp. T1 varied between 34 % and 74 % (Table S3,
three non-denitrifying species observed in the oxic station        GF17-3A and 3C). Previous studies showed an increase in
were also dominant for both cores GF17-1A and GF17-1C:             the relative abundance of the Nonionella sp. T1 morphotype
B. marginata (64 % and 30 %), C. laevigata (16 % and 15 %)         in the Skagerrak–Kattegat region (near the entrance of the
and L. scotti (4 % and 36 %).                                      Gullmar Fjord). The Nonionella sp. T1 represented 10 % of
   In the denitrifying zone (0–1.6 cm), Nonionella sp. T1 rel-     the fauna in June 2013 (Polovodova Asteman and Schönfeld,
ative abundance was rare (2 %) for core GF17-1A and almost         2015). The Öresund strait linking north Skagerrak, the Katte-
absent from the fauna for core GF17-1C. For core GF17-             gat and the Baltic Sea showed an increase in Nonionella sp.
1A, Nonionella sp. T1 relative abundance reached 26 % of           T1 relative abundance from 1 % to 14 % observed between
the fauna between 1.6 and 2.5 cm depth (Fig. 5e, GF17-1A),         1998 and 2009 (Charrieau et al., 2019). The foraminiferal
whereas it was almost absent from the rest of core GF17-1A         fauna in the Gullmar Fjord changed over the last decades, and
and it was absent from core GF17-1C (Table S3). For cores          Nonionella sp. T1 seems to have become an invasive species
GF17-1A and GF17-1C, S. fusiformis reached, respectively,          in the Gullmar Fjord oxic shallow water area.
2 % and 3 % in the denitrifying zone (0–1.6 cm). Under                The foraminiferal fauna found at the GF17-1 station in
the denitrifying zone (1.6–5 cm), S. fusiformis represented        the deepest part of the fjord differed from previous stud-
4 % and 1 % of the fauna (GF17-1A and GF17-1C, respec-             ies (Nordberg et al., 2000; Filipsson and Nordberg, 2004;
tively). The three other non-denitrifying species dominated        Risgaard-Petersen et al., 2006; Polovodova Asteman and
both cores in the denitrifying zone (0–1.6 cm): B. marginata       Nordberg, 2013; Polovodova Asteman and Schönfeld, 2015).
accounted for 66 % and 35 %, C. laevigata 19 % and 19 %,           Indeed, until the early 1980s, the foraminiferal fauna in
and L. scotti 4 % and 24 % for cores GF17-1A and GF17-1C,          the deepest part of the fjord was dominated by a typical
respectively. From 1.6 to 5 cm depth, B. marginata accounted       Skagerrak–Kattegat fauna (Bulimina marginata, Cassidulina
for 61 % and 11 %, C. laevigatafor 5 % and 2 % and L. scotti       laevigata, Hyalinea balthica, Liebusella goesi, Nonionellina
for 6 % and 75 % (GF17-1A and GF17-1C, respectively).              labradorica and Textularia earlandi) (Nordberg et al., 2000).
                                                                   However, the fauna changed. S. fusiformis and B. pseudop-
                                                                   unctata became the major species (Nordberg et al., 2000; Fil-
4     Discussion                                                   ipsson and Nordberg, 2004). Further studies by Polovodova
                                                                   Asteman and Nordberg (2013) demonstrated that at least un-
4.1    The NIS Nonionella sp. T1 density in comparison             til 2011 S. fusiformis, B. pseudopunctata and T. earlandi
       with other species from the Gullmar Fjord                   dominated the fauna. Foraminiferal fauna described in the
                                                                   present study differs. In November 2017 S. fusiformis did not
The presence and relative abundance of the NIS Nonionella          exceed 3 % of the fauna (Table S3, GF17-1A and GF17-1C),
sp. T1 in the Gullmar Fjord and in the Skagerrak–Kattegat          B. pseudopunctata reached only 2 % in core GF17-1C (Ta-
strait have been documented during the last decades. The           ble S3, GF17-1C) and T. earlandi was a minor species < 1 %.

https://doi.org/10.5194/bg-18-327-2021                                                        Biogeosciences, 18, 327–341, 2021
336 C. Choquel et al.: Denitrification by benthic foraminifera and their contribution to N loss
Then, in November 2017, B. marginata, C. laevigata and 3.5 to 5 cm depth). When the intracellular nitrate reserve runs
Leptohalysis scotti were the dominant species in the fjord. out, Nonionella sp. T1 would be able to migrate to an upper
The Elphidium clavatum-selseyensis species complex (fol- zone where nitrate is still present in the sediment to regener-
lowing the definition from Charrieau et al., 2018), H. baltica, ate its intracellular nitrate reserve (Fig. 5a and b; from 1.2 to
N. labradorica, and T. earlandi were present with a low 3.5 cm depth).
relative abundance (< 5 %, Table S3). Namely, G. turgida Hypoxia occurred approximately at least 1 month be-
reached 37 % of the foraminiferal fauna in August 2005 at fore the sampling cruise in the deepest part of the fjord
the deepest station (Risgaard-Petersen et al., 2006), whereas (Fig. 3). When hypoxia is extended to the water column, ni-
in November 2017 this species relative abundance decreased trification both in the water column and the sediment is re-
to become a minor species of the assemblage. However, such duced or even stopped, as oxygen is almost absent (Fig. 1b;
a trend for S. fusiformis and B. pseudopunctata must be inter- Childs et al., 2002; Kemp et al., 2005; Conley et al., 2007;
preted with caution since our study used the > 100 µm frac- Jäntti and Hietanen, 2012). Under this condition, the cou-
tion, whereas some of the previous studies used the > 63 µm pled nitrification–denitrification processes are strongly re-
fraction. We also wet picked the specimens and used Cell- duced (Kemp et al., 1990). At the GF17-1 station, no nitri-
Tracker Green to identify living foraminifera, which might fication in superficial sediment was shown by our data, and
affect the results compared to Rose Bengal studies of dry nitrate was low but still detectable in the bottom water. Ni-
sediment residuals. trate can diffuse from the water column into the sediment
The relative abundance of the potentially invasive Non- and thereby generate the denitrification zone as modeled by
ionella sp. T1 in 2017 increased compared to the study PROFILE between the SWI and 1.6 cm depth (Fig. 5h).
of Polovodova Asteman and Schönfeld (2015) in the oxic The rare presence of the NIS Nonionella sp. T1 and
part of the fjord. It is also noteworthy that the two non- other denitrifying species such as Globobulimina auricu-
denitrifying species B. marginata and C. laevigata described lata, Bolivina pseudopunctata and Stainforthia fusiformis in
as typical species of the Skagerrak–Kattegat fauna (Filips- the hypoxic station indicates that sediment chemical condi-
son and Nordberg, 2004) increased markedly in the fjord as tions turned unfavorable towards denitrification during pro-
well. It is evident that the foraminiferal fauna in the Gullmar longed hypoxia. Instead, the non-denitrifying species Bu-
Fjord is presently very dynamic with considerable species limina marginata, Cassidulina laevigata, and Leptohalysis
composition shifts probably following seasonal water body scotti dominated in this hypoxic environment. Their survival
stratification and consecutive oxygen depletion occurring in could be due to seasonal dormancy (Ross and Hallock, 2016;
the fjord (Fig. 3). LeKieffre et al., 2017) and their ability to release propagules,
which can disperse and grow when environmental conditions
4.2 Foraminifera ecology considering porewater turn favorable again (Alve and Goldstein, 2003). The sus-
nitrate micro-distribution pected deep nitrification zone (blue square profile, Fig. 5h)
could indicate the presence of nitrate micro-niches deeper
For the first time, a core sampled in the Gullmar Fjord shows in the sediment and might explain the patchy distribution
Nonionella sp. T1 as a dominant species. This observation of Nonionella sp. T1 also at the hypoxic site (see Fig. 5e;
was made under oxic conditions at GF17-3 station (50 m Table S2, GF17-1A). Therefore, deep nitrate production in
depth) during November 2017 (Fig. 5a and b; Tables S2 these microenvironments could favor the presence of Non-
and S4). The Nonionella sp. T1 density increased with sed- ionella sp. T1, which can be attracted by this nitrate source
iment depth below the sedimentary oxic zone (Fig. 5a–d; of electron acceptor to respire (Nomaki et al., 2015; Koho
Table S2), which could be explained by its preference to et al., 2011). This deep nitrification zone could be the result
respire nitrate rather than oxygen. This would be in agree- of macrofaunal activity (burrowing activity) that introduces
ment with the hypothesis of using nitrate as the preferred some oxygen deeper into anoxic sediment (Aller, 1982; Karl-
electron acceptor as suggested by Glock et al. (2019). Non- son et al., 2007; Nizzoli et al., 2007; Stief, 2013; Maire et al.,
ionella sp. T1 distribution could be explained by its ca- 2016). This nitrification zone could also be due to an anaer-
pacity to store nitrate intracellularly before porewater ni- obic process. The Gullmar Fjord is Mn rich (Goldberg et al.,
trate is denitrified by other organisms such as bacteria. In 2012), and metal-rich particles can be bio-transported into
detail, in the upper part of the sediment, within the oxic the anoxic sediment, thus allowing ammonium oxidation into
zone, Nonionella sp. T1 would respire oxygen at the rate NO− 3 by Mn and Fe oxides in the absence of oxygen deeper
of 169 ± 11 pmol O2 indiv.−1 d−1 (Fig. 5c and d). Below the in the sediment (Aller, 1994; Luther et al., 1997).
oxygen penetration depth (from 4.7 ± 0.2 mm to 3.5 cm),
Nonionella sp. T1 could store and respire the ambient ni-
trate at the rate of 38 ± 8 pmol N indiv.−1 d−1 . Further down,
where the nitrate porewater is depleted (Fig. 5c and d; from
3.5 to 5 cm depth), Nonionella sp. T1 would respire on its
intracellular nitrate reserves to survive (Fig. 5a and b; from
Biogeosciences, 18, 327–341, 2021 https://doi.org/10.5194/bg-18-327-2021C. Choquel et al.: Denitrification by benthic foraminifera and their contribution to N loss 337
Table 2. Summary of the NIS Nonionella sp. T1 contributions to benthic denitrification in the Gullmar Fjord. The porewater denitrification
zones come from PROFILE modeling (Fig. 5d and h). To estimate the contributions of Nonionella sp. T1, the number of counted specimens
per zone was used. Two different approaches were used to estimate the contribution of Nonionella sp. T1: (A) Nonionella sp. T1 denitrification
rate divided by nitrate porewater denitrification rate and (B) Nonionella sp. T1 denitrification rate divided by nitrate porewater denitrification
rate plus Nonionella sp. T1 denitrification rate. The calculations are detailed in Eq. (S2) in the Supplement.
Stations Sediment depth Nonionella sp. T1 Nitrate porewater Nonionella sp. T1 Nonionella sp. T1 Nonionella sp. T1
interval of (counted specimens denitrification rates denitrification rates contribution (%), contribution (%),
denitrification (cm) per zone) (nmol cm−3 s−1 ) (nmol cm−3 s−1 ) approach A approach B
GF17-3A 1.2 to 5 841 4.07 × 10−07 1.90 × 10−05 47 32
GF17-3C 1.2 to 5 1807 4.07 × 10−07 4.06 × 10−05 100 50
GF17-1A 0 to 1.6 3 2.71 × 10−05 6.72 × 10−08 0 0
GF17-1C 0 to 1.6 12 2.71 × 10−05 2.69 × 10−07 1 0
4.3 Contributions and potential impacts of the NIS deep-water exchange (Fig. 3c). Therefore, the GF17-3 oxic
Nonionella sp. T1 to benthic denitrification in the station could be considered representative of the Gullmar
Gullmar Fjord Fjord benthic ecosystem. Nonionella sp. T1 is not the most
efficient denitrifying species compared to Globobulimina
turgida (42 pmol N ind−1 d−1 , with BV = 1.3 × 10+06 µm3 )
Considering that Nonionella sp. T1 is denitrifying the nitrate
and also less efficient than Nonionella cf. stella from Peru.
from sediment porewater (approach A, Table 2; see method
However, the high density of Nonionella sp. T1 could accel-
2.5), its contribution to benthic denitrification in the oxic sta-
erate sediment denitrification and participate to increase the
tion would be 47 % in core GF17-3A and would reach 100 %
contrast between the two hydrographic conditions. Indeed,
in core GF17-3C. If we consider that Nonionella sp. T1 uses
the increasing discrepancy of bottom-water oxygenation be-
its intracellular nitrate pool for denitrification (approach B),
tween stations induces a gap in the availability of nitrate for
its contribution to benthic denitrification would be 32 % in
anaerobic facultative metabolisms in the sediment. In the
core GF17-3A and would reach 50 % in core GF17-3C (Ta-
oxygenated part of the fjord, high contribution to benthic
ble 2). These two calculation approaches highlight the diffi-
denitrification (estimated between 50 % and 100 %) by Non-
culties and the importance of knowing the concentration of
ionella sp. T1 could take part to a potential de-eutrophication
environmental nitrate and foraminiferal intracellular nitrate
of the system by increasing the nitrogen loss. Primary pro-
at the same time to estimate the contributions of foraminifera
duction (PP) in the Gullmar Fjord is dominated by diatom
to benthic denitrification. Moreover, in this study there is
blooms in spring and autumn (Lindahl and Hernroth, 1983).
no data on the anammox process which contributes also to
Since the 1990s, Lindahl et al. (2003) observed an increase
the total denitrification (Brandes et al., 2007). The results re-
in PP in the Gullmar Fjord, potentially changing its trophic
ported in previous studies such as Engström et al. (2005) do
status towards eutrophic. This increase in PP also shown in
not allow us to extrapolate their data at our oxic station, lo-
the adjacent Kattegat could be related to the nitrogen in-
cated at the entrance of the fjord. Thus, we assume that our
put loading from the land and atmosphere (Carstensen et al.,
estimate of denitrification is conservative since the possible
2003). Lindahl et al. (2003) argued that the PP in the Gullmar
contribution of anammox is not included in the calculation.
Fjord was due to climatic forces resulting from a strong posi-
However, despite these uncertainties , the Nonionella sp. T1
tive North Atlantic Oscillation (NAO) index, which increased
contribution to benthic denitrification supports the hypothe-
the availability of deep-water nutrients (Kattegat nitrate rich)
sis that this non-indigenous denitrifying foraminifer plays a
through changes in the thermocline. The benthic denitrifica-
major role in the benthic nitrogen cycle.
tion of the Gullmar Fjord produces nitrogen unassimilable
At the hypoxic station, the opposite was shown where
by primary producers. Moreover, foraminiferal nitrate uptake
the estimated contribution of Nonionella sp. T1 to benthic
and intracellular storage act as an additional sink through
denitrification was below 1 % whatever the calculation ap-
bio-transportation and permanent sequestration in sediments
proach. The estimated contributions of the other denitrify-
(Glock et al., 2013; Prokopenko et al., 2011). Thus, denitri-
ing foraminifera found in this station were low. Foraminifera
fying foraminifera including Nonionella sp. T1 could help
contributed to almost 5 % of benthic denitrification. Com-
counterbalance a potential eutrophication of the system via
pared to the oxic station, the NIS Nonionella sp. T1 and the
nitrogen loss (Seitzinger, 1988).
other denitrifying species contributions to benthic denitrifica-
Contrastingly, in the hypoxic part of the fjord, nitrate and
tion were weak in a prolonged hypoxic station of the Gullmar
nitrite (rapidly exhausted) become scarce, resulting in a de-
Fjord.
crease in benthic denitrification including foraminiferal con-
Overall, the Gullmar Fjord is well oxygenated except for
tribution. As a consequence of oxygen and nitrate scarcity,
the deepest basin where oxygen goes down when there is no
https://doi.org/10.5194/bg-18-327-2021 Biogeosciences, 18, 327–341, 2021338 C. Choquel et al.: Denitrification by benthic foraminifera and their contribution to N loss
nitrification, denitrification and anammox processes are less cle rewriting. HLF managed with AM the sampling cruise and con-
intense, resulting in a decrease in nitrogen mitigation and tributed to foraminiferal taxonomy, scientific discussions and arti-
accumulation of ammonium in the deeper part of the fjord cle rewriting. NRP managed the oxygen and nitrate respiration mea-
subjected to prolonged severe hypoxia (Fig. 1). Moreover, surements and contributed to the scientific discussions. PL managed
the low availability of nitrate in the sediment would possi- hyperspectral treatments for 2D gels and contributed to the scien-
tific discussion. MG participated in the 2D gel lab experiments and
bly increase the benthic transfer towards the water column
hyperspectral treatments. TJ participated in the sampling cruise and
of reduced compounds such as manganese and iron pro- contributed to 2D gel experiments, scientific discussions and article
duced deeper in the sedimentary column by other anaerobic rewriting. BJ contributed to scientific discussion and article rewrit-
metabolisms (Hulth et al., 1999). These new results demon- ing. AM managed the sampling cruise and 2D gel experiments and
strate that the role of denitrifying foraminifera is underesti- contributed to hyperspectral camera treatments, scientific discus-
mated in the nitrogen cycle and that overlooking this part of sions and article rewriting.
the meiofauna may lead to a misunderstanding of environ-
ments subject to hydrographic changes.
Competing interests. The authors declare that they have no conflict
of interest.
5 Conclusions
This study revealed a drastic change in living foraminifera Acknowledgements. The authors gratefully acknowledge the crews
fauna due to several hypoxic events that occurred in the last of the R/V Skagerak and R/V Oscar von Sydow and the Kristineberg
Marine Research Station; the hydrographic data used in the project
decades in the Gullmar Fjord. For the first time, the non-
are from SMHI’s database – SHARK. The collection of data for
indigenous species (NIS) Nonionella sp. T1 dominated up
SHARK is organized by the Swedish environmental monitoring
to 74 % the foraminiferal fauna at a station with oxygenated program and funded by the Swedish Agency for Marine and Wa-
bottom waters and high nitrate content in sediment porewa- ter Management (SWAM). Thanks to Charlotte LeKieffre, who
ter. This NIS can denitrify up to 50 %–100 % of the nitrate helped during the sampling cruise, and the SCIAM (Service Com-
porewater sediment under oxic conditions in the fjord. How- mun d’Imagerie et d’Analyses Microscopiques) of Angers Univer-
ever, under prolonged hypoxia, nitrate depletion turns envi- sity for the SEM images. Helena L. Filipsson acknowledges fund-
ronmental conditions unfavorable for foraminiferal denitrifi- ing from the Swedish Research Council VR (grant number 2017-
cation, resulting in a low density of Nonionella sp. T1 and 04190). This project was funded by the French National Program
other denitrifying species. The foraminiferal contribution to MANGA-2D (CNRS-INSU) and by the FRESCO project supported
benthic denitrification was negligible (∼ 5 %) during pro- by the Region Pays de la Loire and by University of Angers.
longed seasonal hypoxia in the fjord. Moreover, the poten-
tially invasive denitrifying Nonionella sp. T1 could impact
Financial support. This research has been supported by the Au-
the nitrogen cycle under oxic conditions by increasing the
rélia Mouret (grant no. MANGA-2D (CNRS-INSU)) and the Em-
sediment denitrification and could counterbalance potential manuelle Geslin (grant no. FRESCO project supported by the Re-
eutrophication of the Gullmar Fjord. Our study demonstrated gion Pays de la Loire and by University of Angers), and the Swedish
that the role of denitrifying foraminifera is underestimated in Research Council VR (grant number 2017-04190).
the nitrogen cycle, especially in oxic environments.
Review statement. This paper was edited by Tina Treude and re-
Data availability. All of the data are published within this paper viewed by two anonymous referees.
and in the Supplement. The raw data used to make the figures are
available on request.
Supplement. The supplement related to this article is available on- References
line at: https://doi.org/10.5194/bg-18-327-2021-supplement.
Aller, R. C.: The Effects of Macrobenthos on Chemical Properties
of Marine Sediment and Overlying Water, in: Animal-Sediment
Author contributions. CC participated in the sampling cruise, did Relations, edited by: McCall, P. L. and Tevesz, M. J. S., Springer
the foraminiferal taxonomy, and contributed to 2D gel experiments US, 53–102, 1982.
and analyses by the hyperspectral camera. CC did the nitrate and Aller, R. C.: The sedimentary Mn cycle in Long Island Sound: Its
oxygen respiration measurements and wrote the present article. EG role as intermediate oxidant and the influence of bioturbation,
participated in the sampling cruise and contributed to foraminiferal O2 , and Corg flux on diagenetic reaction balances, J. Mar. Res.,
analysis and scientific discussions. EM participated in the sampling 52, 259–29, 1994.
cruise; managed with AM the 2D gel experiments; and contributed Aller, R. C., Hall, P. O. J., Rude, P. D., and Aller, J. Y.: Biogeo-
to hyperspectral camera treatments, scientific discussions, and arti- chemical heterogeneity and suboxic diagenesis in hemipelagic
Biogeosciences, 18, 327–341, 2021 https://doi.org/10.5194/bg-18-327-2021You can also read