Flood Risk Assessment in an Underground Railway System under the Impact of Climate Change-A Case Study of the Barcelona Metro - MDPI
←
→
Page content transcription
If your browser does not render page correctly, please read the page content below
sustainability

Article
Flood Risk Assessment in an Underground Railway
System under the Impact of Climate Change—A Case
Study of the Barcelona Metro
Edwar Forero-Ortiz 1,2, * , Eduardo Martínez-Gomariz 1,2 , Manuel Cañas Porcuna 3 ,
Luca Locatelli 4 and Beniamino Russo 4,5
 1    Cetaqua, Water Technology Centre, Carretera d’Esplugues, 75, 08940 Cornellà de Llobregat, Barcelona, Spain;
      eduardo.martinez@cetaqua.com
 2    Flumen Research Institute, Universitat Politècnica de Catalunya, Calle del Gran Capità, 6,
      08034 Barcelona, Spain
 3    TMB (Transports Metropolitans de Barcelona), Carrer 60, núm. 21-23, sector A, Pol. Ind. de la Zona Franca,
      08040 Barcelona, Spain; mcanas@tmb.cat
 4    AQUATEC (SUEZ Advanced Solutions), Paseo de la Zona Franca, 46-48, 08038 Barcelona, Spain;
      luca.locatelli@aquatec.es (L.L.); brusso@aquatec.es (B.R.)
 5    Grupo de Ingeniería Hidráulica y Ambiental (GIHA), Escuela Politécnica de La Almunia (EUPLA),
      Universidad de Zaragoza, Calle Mayor, 5, 50100 La Almunia de Doña Godina, Zaragoza, Spain
 *    Correspondence: eaforero@cetaqua.com or edwar.forero@gmail.com; Tel.: +33-783-53-72-22

 Received: 19 May 2020; Accepted: 28 June 2020; Published: 30 June 2020

 Abstract: Flooding events can produce significant disturbances in underground transport systems
 within urban areas and lead to economic and technical consequences, which can be worsened by
 variations in the occurrence of climate extremes. Within the framework of the European project
 RESCCUE (RESilience to cope with Climate Change in Urban arEas—a multi-sectorial approach
 focusing on water), climate projections for the city of Barcelona manifest meaningful increases in
 maximum rainfall intensities for the 2100 horizon. A better comprehension of these impacts and their
 conditions is consequently needed. A hydrodynamic modelling process was carried out on Barcelona
 Metro Line 3, as it was identified as vulnerable to pluvial flooding events. The Metro line and all
 its components are simulated in the urban drainage models as a system of computational link and
 nodes reproducing the main physical characteristics like slopes and cross-sections when embedded
 in the current 1D/2D hydrodynamic model of Barcelona used in the project RESCCUE. This study
 presents a risk analysis focused on ensuring transport service continuity in flood events. The results
 reveal that two of the 26 stations on Metro Line 3 are exposed to a high risk of flooding in current
 rainfall conditions, and 11 of the 26 stations on Metro Line 3 are exposed to a high risk of flooding in
 future rainfall conditions for a 20-year return period event, which affects Metro service in terms of
 increased risk. This research gives insights for stakeholders and policymakers to enhance urban flood
 risk management, as a reasonable approach to tackle this issue for Metro systems worldwide. This
 study provides a baseline for assessing potential flood outcomes in Metro systems and can be used to
 evaluate adaptation measures’ effectiveness.

 Keywords: flood risk assessment; climate change; 1D/2D hydrodynamic model; Metro system;
 subway; urban mobility

1. Introduction
     Current trends in the analysis of climate-driven events on urban societies, infrastructures, and
services have guided study towards the direct and indirect impacts of these events, resulting in

Sustainability 2020, 12, 5291; doi:10.3390/su12135291                         www.mdpi.com/journal/sustainability
Sustainability 2020, 12, 5291 2 of 26
disruptions within
Sustainability 2019, 11, xthe
FORinterdependent
PEER REVIEW infrastructure systems. These studies draw our awareness 2 of to
26
the importance of analyzing the impacts generated by extreme events, such as heavy rainfall, flooding,
the importance
storm surge, and of otheranalyzing
extremethe impacts
natural generated
phenomena whichby extreme
severely events,
compromise such cityas heavy
services. rainfall,
This
flooding, storm
introduction surge,
presents theand other extreme
importance natural
of assessing Metrophenomena
systems’ which
flooding severely
impacts,compromise
pointing to the city
services.gap
research Thisonintroduction
this topic and presents the importance
supporting the motivations of assessing
leading thisMetro systems’ flooding impacts,
study.
pointing
Climate to the research
change gap ona this
represents severetopic andto
threat supporting the motivations
cities and their leading
resilience, which arethis study.systems
complex
Climate by
characterized change
constant represents
flow andaare severe threat
the result of to cities
a lot and their
of dynamic resilience,
variables which in
that change arespace
complex
and
systems characterized by constant flow and are the result of a lot of dynamic
time [1,2]. As discussed by Wan et al. [3], transportation resilience can be described as the capacity of variables that change in
space and time [1,2]. As discussed by Wan et al. [3], transportation resilience
a transportation system to "absorb disturbances," sustaining its fundamental structure and purpose, can be described as the
capacity
plus of a transportation
recovering to an expected system
servicetolevel
"absorb disturbances,"
following occurringsustaining
disruptions. its As
fundamental structure
an initial action for
and purpose, plus recovering to an expected service level following
a risk/resilience appraisal [4], a potential hazard for urban resilience is the occurrence of floodingoccurring disruptions. As an
initial action
events which for a risk/resilience
might appraisalof
impact the continuity [4], a potential
Metro services.hazard
Metro forsystems,
urban resilience is the occurrence
as one strategic transport
of flooding
service on urbanevents which
areas, might one
represent impact the continuity
key variable of Metro
for assessing services.
resilience Metro
in the systems,
context as one
of physical
strategic transport service on urban areas, represent one key variable for
infrastructure used by citizens. Decreasing the risks that may affect the continuity of the Metro service, assessing resilience in the
context ofwill
therefore, physical
increaseinfrastructure
resilience atused by citizens.level
the municipal Decreasing the risks
[5]. Although thatare
there may affect the
a variety of continuity
words for
underground transport railway systems (e.g., subway, underground, or tube), this paper willthere
of the Metro service, therefore, will increase resilience at the municipal level [5]. Although are
use the
a variety of words for underground
term "Metro systems" when referring to them. transport railway systems (e.g., subway, underground, or tube),
this Metro
paper will use the
systems’ term "Metro
importance systems" when
worldwide referring
for cities’ to them.is evident. According to 2018
operability
Metro systems’ importance worldwide for cities’
figures [6], 178 cities in 56 countries have a Metro transportation system, operability is with
evident. According
an average to 2018
ridership of
figures
168 [6], per
million 178 day,
citiesand in 56 countriesannual
increasing have a useMetro transportation
of 19.5%. Figure 1system,
presents with
the an averagein-service
currently ridership
of 168 million
number of Metro persystems
day, and in increasing annualChina,
Europe. Between use of India,
19.5%.and Figure
Iran,1 Asia
presents the currently
is building 16 newin-service
systems,
shaping the decarbonizing urban transport effort as a response to climate change [6]. 16 new systems,
number of Metro systems in Europe. Between China, India, and Iran, Asia is building
shaping the decarbonizing urban transport effort as a response to climate change [6].
Figure 1. Metro systems in operation in Europe by 2019 [6].
Figure 1. Metro systems in operation in Europe by 2019 [6].
Following the accelerated growth of cities and their Metro systems, and the increasing growth
Following of
and complexity theMetro
accelerated growth
networks, of cities
the ability toand their
study andMetro systems,
improve and the increasing
the vulnerability growth
of systems are
and complexity of Metro networks, the ability to study and improve the vulnerability of systems
more complex, according to the heterogeneity of the different components of a large scale system, are
more complex, according to the heterogeneity of the different components of a large scale
such as a transport network [7]. The probability of disruptions should consider many factors, not system,
such as a transport network [7]. The probability of disruptions should consider many factors, not
only the number of affected Metro stations, but also the distance between them [8], along with several
other factors.
Sustainability 2020, 12, 5291 3 of 26
only the number of affected Metro stations, but also the distance between them [8], along with several
other factors.
Sustainability 2019, 11, x FOR PEER REVIEW 3 of 26
Considering hazards that Metro systems face worldwide, there is a notable lack of research on
Considering
water-related hazards hazards that Metro
[5], including systems
those related face worldwide,
to flooding there
events is atheir
and notable
impactlackonofMetro
research on
systems’
water-related
resilience hazards
[9]. In [5], including
a context of climatethose
change,related to flooding
flooding events events and their
can produce impact on
increasing Metro
significant
systems’ resilience
socioeconomic risks in[9]. In aareas.
urban context
Worseof climate change, flooding
still, urbanization heightens events can produce
the likelihood of waterincreasing
disasters
such as floods because development decreases the amounts of permeable surfaces where water of
significant socioeconomic risks in urban areas. Worse still, urbanization heightens the likelihood can
water disasters such as floods because development decreases the amounts of
soak into the soil, thereby originating runoff that contributes to flooding. This situation poses a criticalpermeable surfaces
where
risk watersystems,
to Metro can soakwhich into the
can soil, thereby
suffer originating
from diverse typesrunoff that contributes
of flooding, to flooding.
such as riverine This
(fluvial) and
situation poses a critical risk to Metro
rain-related (pluvial) flooding, and tidal surges. systems, which can suffer from diverse types of flooding, such
as riverine (fluvial) and rain-related (pluvial) flooding, and tidal surges.
Climate change endangers the Barcelona Metro system when subjected to flooding events. Flood
Climate change endangers the Barcelona Metro system when subjected to flooding events. Flood
events have caused property damage along with service disruptions, by the inundation of underground
events have caused property damage along with service disruptions, by the inundation of
infrastructures (e.g., Metro tunnels and facilities) [10,11]. Therefore, it is essential to evaluate flood
underground infrastructures (e.g., Metro tunnels and facilities) [10,11]. Therefore, it is essential to
risks in Metro systems to plan for flood disasters and set mitigation strategies efficiently. Figure 2
evaluate flood risks in Metro systems to plan for flood disasters and set mitigation strategies
illustrates how Metro flooding events affect both Metro systems’ infrastructure and users, exposing
efficiently. Figure 2 illustrates how Metro flooding events affect both Metro systems’ infrastructure
them to collateral effects such as hard falls due to the loss of stability of passengers crossing through
and users, exposing them to collateral effects such as hard falls due to the loss of stability of
water flow [12,13], material damage, and reduction of service provision due to damage caused to both
passengers crossing through water flow [12,13], material damage, and reduction of service provision
the users and the companies that administer the systems. These events have gradually increased in
due to damage caused to both the users and the companies that administer the systems. These events
recent years due increased
have gradually to cities’ growth
in recentand climate
years due to change
cities’ [14–16].
growth and climate change [14–16].
(a) (b) (c)
(d) (e) (f)
Figure2.2.Flood
Figure Floodevents
eventsininmajor
majorglobal
globalMetro
Metrosystems:
systems:(a)(a)New
New York
York [17];
[17]; (b)(b) Tokyo
Tokyo [18];
[18]; (c) (c) Madrid
Madrid [19];
[19]; (d) Prague [20]; (e) Washington [21]; (f) Brussels
(d) Prague [20]; (e) Washington [21]; (f) Brussels [22]. [22].
Themain
The mainobjective
objectiveofof this
this research
research is
is to
to analyze
analyzeMetro
Metrostations’
stations’vulnerability
vulnerabilityfacing
facingfloods
floodsunder
under
extreme rainfall events, then, exposing the system to climate change flooding influenced
extreme rainfall events, then, exposing the system to climate change flooding influenced events. Other events.
Other research
research approachesapproaches focus ontransport
focus on ensuring ensuringservice
transport service
continuity continuity
using usingtransport
other public other public
modes,
transport modes, responding to Metro system flooding events [23–26]. In order
responding to Metro system flooding events [23–26]. In order to address the cited research gaps,to address the cited
this
research gaps, this study proposes and analyzes interactions connecting pluvial flood events
study proposes and analyzes interactions connecting pluvial flood events and the water level thresholds and the
waterMetro
inside level thresholds insidethat
station tunnels Metro station
might tunnels
result that might
in service result in
disruption, serviceadisruption,
through hydrodynamic through a
model
hydrodynamic
including model
the Metro including
system. the Metro
Barcelona Metrosystem.
Line 3Barcelona
is the lineMetro
mostLine 3 is the line
vulnerable mostevents
to flood vulnerable
due to
to flood events due to extreme rainfall, according to TMB (Transports Metropolitans de Barcelona,
extreme rainfall, according to TMB (Transports Metropolitans de Barcelona, Barcelona Metropolitan
Barcelona Metropolitan Transport—the leading public transport operator in Barcelona) records.
Transport—the leading public transport operator in Barcelona) records. Hence, in this study, the Metro
Hence, in this study, the Metro Line 3 is integrated into the 1D/2D hydrodynamic model developed
for the entire drainage system of the city of Barcelona within the European project RESCCUE
(RESilience to cope with Climate Change in Urban arEas—a multi-sectorial approach focusing on
water) [27].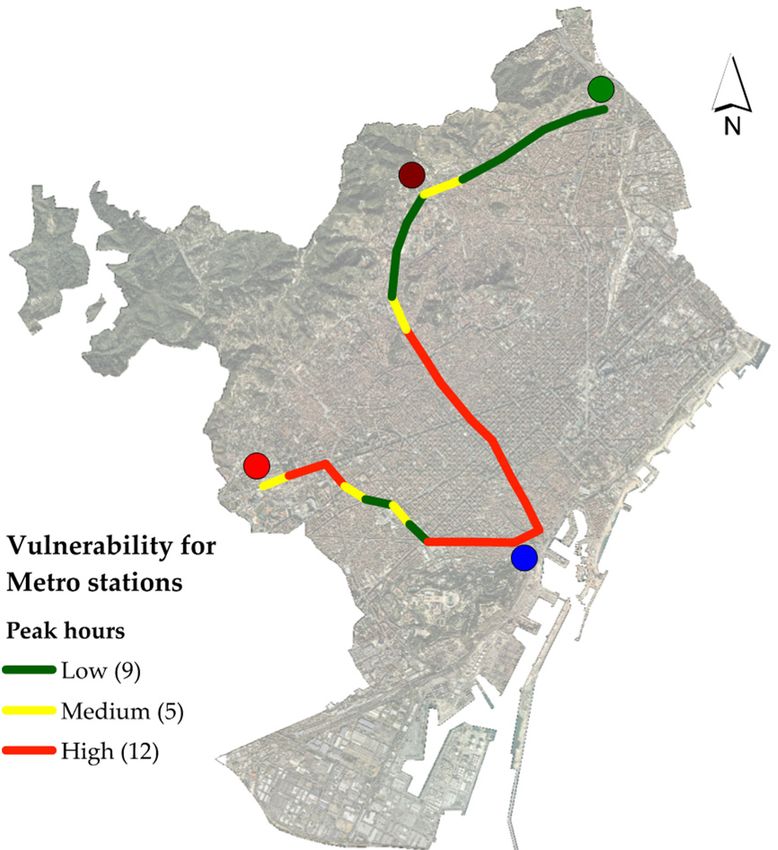
Sustainability 2020, 12, 5291 4 of 26
Line 3 is integrated into the 1D/2D hydrodynamic model developed for the entire drainage system of
Sustainability 2019, 11, x FOR PEER REVIEW 4 of 26
the city of Barcelona within the European project RESCCUE (RESilience to cope with Climate Change
in Urban to
(RESilience arEas—a
cope withmulti-sectorial
Climate Change approach focusing
in Urban on water)
arEas—a [27].
multi-sectorial approach focusing on
This
water) [27]. study proposes a new methodology for a flood risk assessment in an underground
Metro system,
This study based on
proposes a newa surface pluvial flooding
methodology for a flood1D/2D hydrodynamic
risk assessment in an modelling
underground andMetro
the Metro
infrastructure
system, based onreal data. The
a surface new flood
pluvial floodingmodel, derived
1D/2D from the integration
hydrodynamic modellingofand the infrastructure
the Metro of
Line 3 of the Barcelona Metro with the city's current drainage model,
infrastructure real data. The new flood model, derived from the integration of the infrastructure ofwas calibrated based on flood
Lineobserved
3 of the from photos
Barcelona andwith
Metro visual theinspection by TMB
city's current operators.
drainage model,The wasMetro elements
calibrated basedthrough
on floodwhich
floodwater
observed fromenters
photosinto
andthe tunnels
visual (i.e., staircases,
inspection ventilationThe
by TMB operators. grates,
Metro hallways)
elementswere simulated
through whichbased
floodwater enters into the tunnels (i.e., staircases, ventilation grates, hallways) were simulated based and
on their simplification, depicting the Metro entrances as pipelines addressing the Metro tunnels
on stations, as an approach
their simplification, that can
depicting the be applied
Metro to other
entrances case studies.
as pipelines addressing the Metro tunnels and
stations,As as aanvital
approach that can
component ofbe theapplied
flood to other
risk case studies.
assessment, future scenarios using rainfall projections
As a the
under vital component
climate changeofimpact
the flood were risk assessment,
applied. futurecalibration
The model scenarios aimed
using rainfall projections
at reproducing observed
under
waterthelevels
climate in change impact
the studied Metrowere applied.water
stations, The model
levels calibration aimed
in various real at reproducing
events were adequatelyobserved
reflected
water levels
by the in the
model. studied
Also, it was Metro
possiblestations, water the
to identify levels in various
likely effects ofreal events
climate were on
change adequately
underground
reflected
flooding byby theanalyzing
model. Also, it wasofpossible
the effects to identify
future rainfall the likely
conditions. effects
Finally, of climate
a risk assessment change onMetro
of the
underground flooding by analyzing the effects of future rainfall conditions. Finally,
station was performed, adaptation strategies were proposed to reduce floods’ impact and to prevent a risk assessment
of the Metro station
disruptions wasservice,
in Metro performed, adaptation
increasing strategiesofwere
the resilience proposed to reduce
city transportation floods’ impact
services.
and to prevent disruptions in Metro service, increasing the resilience of city transportation services.
2. Materials and Methods
2. Materials and Methods
This study incorporates Barcelona Metro Line 3 real data into the hydrodynamic 1D/2D model of
This study
Barcelona incorporates
considering theBarcelona
connections Metro Linepossible
among 3 real data intoinflows
water the hydrodynamic 1D/2D and
and Metro tunnels modelstations
of and
Barcelona considering the connections among possible water inflows and Metro
considering them as pipelines. To summarize the overall structure of the model, Figure 3 lists the tunnels and
stations and considering
necessary them for
steps performed as pipelines.
the proposed To summarize the overall structure of the model, Figure
flood risk assessment.
3 lists the necessary steps performed for the proposed flood risk assessment.
Input data
Metro service
Ridership flow disruption Risk
Metro System Line
3 information Assessment
Metro physical
infrastructure Integration of the Simulations
metro infrastructure under current Water depth in
Hydrodynamic Representation of in the hydrodynamic and future Metro stations
1D/2D Urban the urban drainage model rainfall
Drainage model of Barcelona conditions
Hydraulic
simulation for Calibration
past extreme and validation
precipitation process
events
Figure 3. The overall model structure for flood risk assessment in Metro systems.
Figure 3. The overall model structure for flood risk assessment in Metro systems.
This chapter presents a list of the precipitation events in Barcelona that have caused disruptions
This chapter presents a list of the precipitation events in Barcelona that have caused disruptions
in the Metro service due to the entry of water into the system, considering both the sources and
in the Metro service due to the entry of water into the system, considering both the sources and
methods of study, with the hydrodynamic model implementation, the Metro Line 3 data acquisition,
methods of study, with the hydrodynamic model implementation, the Metro Line 3 data acquisition,
and components’ introduction processes to the model. Furthermore, this chapter describes the model
and components’ introduction processes to the model. Furthermore, this chapter describes the
calibration and validation process, along with the flood risk assessment under the impact of climate
model calibration and validation process, along with the flood risk assessment under the impact of
change.
climate change.
2.1. Historical Data of Metro Systems’ Flood Events in Barcelona
2.1. Historical Data of Metro Systems’ Flood Events in Barcelona
Table 1 summarizes a two-decade historical data of Metro system flood events. Only those
Table 1 summarizes a two-decade historical data of Metro system flood events. Only those events
events that caused service disruption have been considered. The table was obtained linking Barcelona
that caused service disruption have been considered. The table was obtained linking Barcelona Metro
Metro system records from system administrator TMB, with internet media. Service disruption
information is available for request to TMB, due to its confidential nature.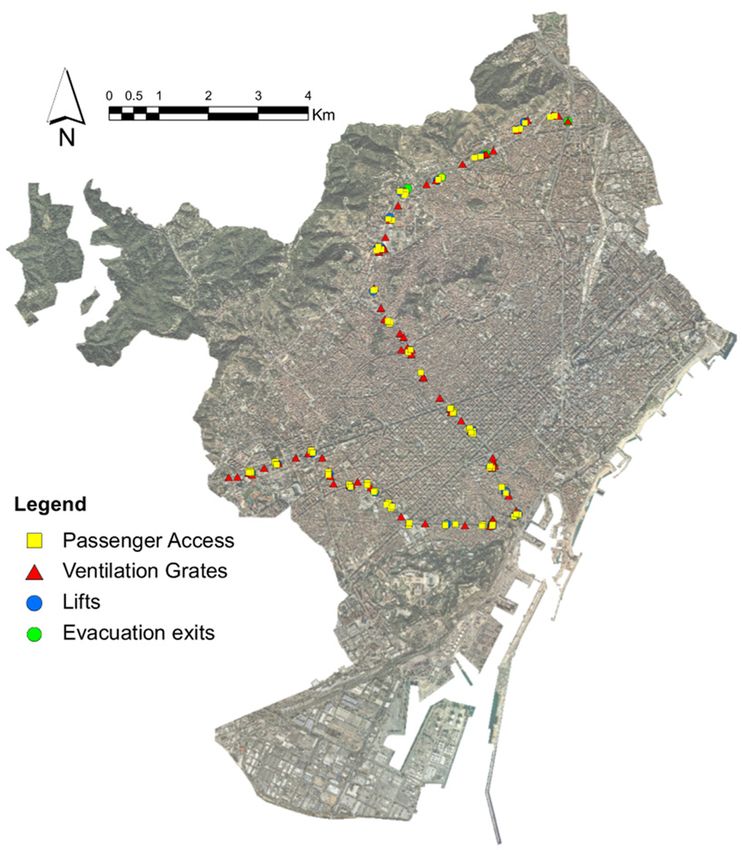
Sustainability 2020, 12, 5291                                                                                   5 of 26

system records from system administrator TMB, with internet media. Service disruption information
is available for request to TMB, due to its confidential nature.

               Table 1. Barcelona Metro service disruptions due to flooding events in the last 20 years.

                         Average duration –        Disruptions in Metro Stations – Line Affected
        Date                                                                                                Source
                        Cumulative Rainfall                      (L, Line Number)
                                                   Via Júlia (L4) – Trinitat Nova (L4) – Rambla Just
     2002-10-10                 1 h – 170 mm                                                                 [28]
                                                          Oliveras (L1) – Maria Cristina (L3)
     2004-09-14                 1 h – 65 mm                       Cornellà Centre (L4)                       [29]
                                                    Sant Antoni (L2) – Paral·lel (L3) – Rambla Just
     2009-10-22                 1 h – 70 mm                                                                  [30]
                                                  Oliveras (L1) – Trinitat Vella (L1) – Verdaguer (L5)
     2011-07-19                 1.5 h – 80 mm                Verdaguer (L4) – Bogatell (L4)                  [31]
     2018-07-16                  1 h – 40 mm                Canyelles (L3) – Valldaura (L3)                  [32]
                                                    Poble Sec (L3) – Paral·lel (L3) – Espanya (L3) –
     2018-09-16                 2 h – 75 mm                                                                  [33]
                                                              Drassanes (L3) – Liceu (L3)
                                                   Espanya (L1) – Santa Eulàlia (L1) – Torrasa (L1) -
     2018-10-09                 1 h – 36 mm                                                                  [34]
                                                               Paral·lel (L3) – Badal (L5)
                                                 Poble Sec (L3) – Paral·lel (L3) – Espanya (L3) – Santa
     2018-11-15                 2 h – 95 mm                                                                  [35]
                                                       Eulàlia (L1) – Liceu (L3) - Vallcarca (L3)
     2019-07-27                 0.5 h – 43 mm    Sagrada Familia (L2) – Espanya (L3) – Verdaguer (L5)       [36,37]
     2019-08-27                  1 h – 50 mm                 Espanya (L3) – Collblanc (L5)                    [38]
     2019-11-14                  1 h – 53 mm               Arc de Triomf (L1) – Paral·lel (L3)                [39]
                                                 Tetuan (L2) – Lesseps (L3) – Joanic (L4) – Urgell (L1) –
     2019-12-04                 5 h – 102 mm     Espanya (L3, L1) – Arc de Triomf (L1) – Sants (L5) –        [40]
                                                                      Sant Roc (L2)

     Table 1 suggests Barcelona Metro flooding events frequency has increased over the last two years,
indicating that these events could maintain or increase their frequency or intensity, due to climate
change influence on rainfall variations [16]. Barcelona rainfall events frequency and intensity increases,
doubling frequency downpours and peak rainfall rates up to 20% higher [41], rainfall intensities rise
due to climate change impacts [42].

2.2. Overview of the Hydrodynamic Model
     A 1D/2D urban drainage model of the whole municipality of Barcelona was developed, calibrated,
and validated using the hydraulic modelling software Innovyze InfoWorks ICM®and local observation
data from different rain events. This model is an update of the model used for the Drainage Master
Plan of Barcelona of 2006.
     A rainfall-runoff model was used to compute the runoff from buildings that were assumed to
directly drain into the 1D hydraulic model representing the drainage network. The 2D model was
used to reproduce overland flow on streets, parks, and further areas located at terrain elevation that
can be flooded. The 1D and the 2D models continuously interact with each other through model nodes
that physically represent surface inlets (like gullies or maintenance holes) to the drainage system.
At these nodes, the exchange of water between the 1D and the 2D model was computed using different
modelling options available in InfoWorks (nodes can be defined as Inlets 2D, 2D, Gullies 2D) that
compute water flows as a function of local water levels and inlet geometries.
     A peculiarity of this 1D/2D model is that part of the rainfall is directly applied to the streets
and parks represented by the 2D overland flow model, and part to the rainfall-runoff model used
for buildings, roofs, and elevated areas. Conventional urban drainage modelling approach generally
applies rainfall directly to rainfall-runoff models that compute runoff diverting it into the 1D hydraulic
model, and flooding can only occur through a maintenance hole surcharge. In Barcelona, it is believed
that urban floods are partly caused by deficient surface drainage capacity due to, for instance, a reduced
number of street gullies.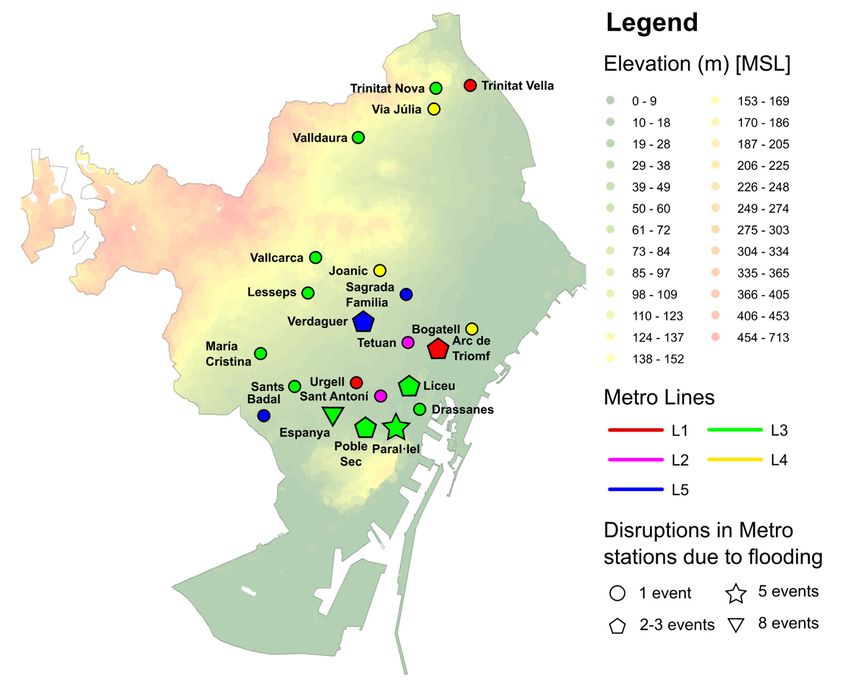
Sustainability 2020, 12, 5291 6 of 26
This model includes approximately 2164 km of pipes, 67,967 pipes, 66,158 nodes, 18 detention
tanks with a total volume of approximately 461,600 m3 , 489 weirs, 22 pumps, 47 sluice gates, and 120
outfalls. The full 1D Saint-Venant equations are used to solve the sewer flow. Rainfall-runoff processes
were simulated using a single non-linear reservoir model with routing coefficients that are a function
Sustainability
of 2019, 11, x FOR
surface roughness, PEER REVIEW
surface area, ground slope, and catchment width. Initial hydrological losses6were of 26
simulated to be approximately 1 mm (a little higher in pervious areas and lower in impervious ones).
Continuous losses
Continuous losses were
were only
only applied
applied to to pervious
pervious areas
areas and
and were
were simulated
simulated usingusing the
the Horton
Horton
model. The 2D model has an unstructured mesh with 662,071 cells created
model. The 2D model has an unstructured mesh with 662,071 cells created from a Digital Terrain from a Digital Terrain
Model (DTM)
Model (DTM) with with aa resolution
resolution ofof 2x2
2x2 m m22 obtained
obtained by
by aa special
special combination
combination of of aa 3-D
3-D scanning
scanning andand
laser scanning (LIDAR) provided by the Cartographic and Geological Institute
laser scanning (LIDAR) provided by the Cartographic and Geological Institute of Catalonia (with an of Catalonia (with an
accuracy of
accuracy of 0.15
0.15 mm forfor altitudes).
altitudes). The
The 2D2D cells
cells have
have areas
areas in
in the
the range
range ofof 5–125
5–125 m m2 in
2 in the
the urban
urban area
area
and 100–10,000 m 22 in the upstream rural areas.
and 100–10,000 m in the upstream rural areas.
The 1D/2D
The 1D/2D model
model was was quantitatively
quantitatively and and qualitatively
qualitatively calibrated
calibrated and
and validated
validated usingusing data
data from
from
four different
four differenthistorical
historicalrainrainevents.
events.InIn Barcelona,
Barcelona, approximately
approximately 25 25 rainfall
rainfall gauges
gauges andand moremore
thanthan
100
100 water level sensors and flood event videos and photos are available. Calibration
water level sensors and flood event videos and photos are available. Calibration and validation details and validation
details
can can beinfound
be found in deliverable
deliverable 2.2EU
2.2 of the of RESCCUE
the EU RESCCUE project [27].
project [27].
2.3. Description
2.3. Description of
of how
how the
the Metro
Metro Service
Service is
is Affected
Affected by
by Flooding
Flooding
Depending on
Depending on the
the type
type ofof tunnel,
tunnel, existing
existing floor,
floor, sleeper
sleeper type,
type, and
and other
other variables
variables unique
unique toto each
each
Metro system in the world, the characteristics of the infrastructure that perform primary
Metro system in the world, the characteristics of the infrastructure that perform primary flood control flood control
in Barcelona
in Barcelona Metro
Metro service
service tunnels
tunnels arearesummarized
summarizedas asfollows.
follows.
The dimensions
The dimensionspresented
presentedininFigure
Figure4 4are
areestimated,
estimated, since
since they
they may
may vary
vary depending
depending ononthethe
sortsort
of
of tunnel, among other factors, and should be taken as a theoretical reference. Therefore,
tunnel, among other factors, and should be taken as a theoretical reference. Therefore, depending on depending
on the
the existing
existing drainage
drainage in each
in each case,case,
it willitbe
will be more
more or lessorrapid
less for
rapid
thefor the to
water water
reachtothe
reach
basethe baserail.
of the of
the rail.
Figure
Figure 4. Approximate scheme
4. Approximate scheme of
of the
the Barcelona
Barcelona Metro's
Metro's railway
railway infrastructure.
infrastructure.
One of the essential parts of the train movement is railway signaling, which always allows safe
One of the essential parts of the train movement is railway signaling, which always allows safe
movement by regulating the speed and location of trains. The basis of the railway signaling is based on
movement by regulating the speed and location of trains. The basis of the railway signaling is based
the track circuits, whose theoretical schematic configuration is shown in Figure 5 (it does not precisely
on the track circuits, whose theoretical schematic configuration is shown in Figure 5 (it does not
represent the reality for the whole Line 3 of the Barcelona Metro), where the track is electrically isolated
precisely represent the reality for the whole Line 3 of the Barcelona Metro), where the track is
in sections of a certain length. In the case of Metro Line 3, the track circuits are about 25 and 35
electrically isolated in sections of a certain length. In the case of Metro Line 3, the track circuits are
meters long.
about 25 and 35 meters long.
The railway signaling equipment is qualified to work under wet conditions; therefore, the circuit
The railway signaling equipment is qualified to work under wet conditions; therefore, the circuit
could work in case of flooding. Depending on the amount of water in the surrounding area and its
could work in case of flooding. Depending on the amount of water in the surrounding area and its
conductivity, it may not complete the circuit, then diverting the electric current between the power
conductivity, it may not complete the circuit, then diverting the electric current between the power
supply and the receptor, producing the receptor is not over-excited by the electric current and the block
supply and the receptor, producing the receptor is not over-excited by the electric current and the
is assumed occupied. It is not conceivable to set only a water level which produces the false occupation
block is assumed occupied. It is not conceivable to set only a water level which produces the false
phenomenon. However, it could be established as an inaccurate reference level when the water level
occupation phenomenon. However, it could be established as an inaccurate reference level when the
reaches half of the railway rail (0.08 m from the rail bed), we could have an occasional false occupation.
water level reaches half of the railway rail (0.08 m from the rail bed), we could have an occasional
false occupation.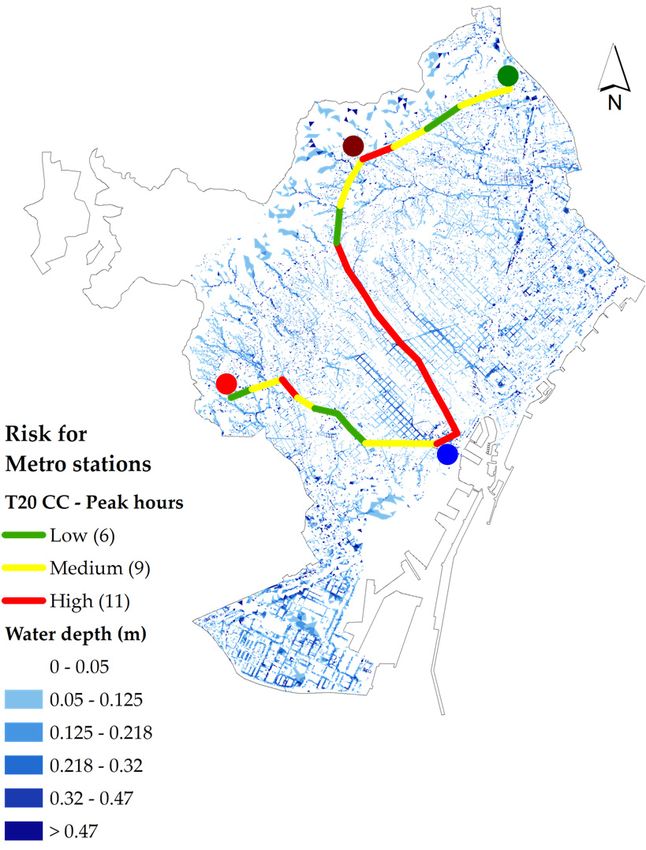
Sustainability 2020, 12, 5291                                                                                                    7 of 26

       Sustainability 2019, 11, x FOR PEER REVIEW                                                                                       7 of 26

                                 5. Occupied
                          FigureFigure       block—track
                                       5. Occupied       circuit circuit
                                                   block—track   scheme.   Modified
                                                                         scheme.    from [43].
                                                                                 Modified from [43].

     In theIn  case
                  theofcase
                         having    a higher
                              of having        water water
                                           a higher       level, level,
                                                                 in many     cases, cases,
                                                                         in many     there would        be false
                                                                                               there would       beoccupation,        and and
                                                                                                                      false occupation,
therefore    no  Metro    service   would     be    provided.     Due   to  these   circumstances,        this
       therefore no Metro service would be provided. Due to these circumstances, this study takes a level of     study    takes   a level
of 0.150.15
          m asman asapproximate
                      an approximate  reference
                                            reference levellevel
                                                             in which,    in any
                                                                   in which,    in road    configuration,
                                                                                    any road       configuration,it is inevitable     that that
                                                                                                                         it is inevitable
because     of a flooding
       because                 event,
                   of a flooding        falsefalse
                                    event,      occupation
                                                      occupationis produced.
                                                                     is produced.  It It
                                                                                       must
                                                                                         mustbebeconsidered
                                                                                                     consideredthat    that even
                                                                                                                             even if    we could
                                                                                                                                    if we
could find
         find aa situation
                 situation where
                              where thethe water
                                            water reaches
                                                       reaches the
                                                                 the height
                                                                      height of of the
                                                                                   the head of the rail, there would be no
                                                                                         head    of the   rail,  there    would    be    no false
false occupation,       due   to there   being     no   short  circuit  of  the  electrical     circuit.  At
       occupation, due to there being no short circuit of the electrical circuit. At this point, it would be  this    point,   it would
be necessary
       necessary  to analyze
                      to analyzewhether
                                     whetherit is itmechanically
                                                     is mechanically viable   for trains
                                                                           viable           to transit,
                                                                                    for trains            givengiven
                                                                                                   to transit,      the possibility      of
                                                                                                                            the possibility    of
slippage    in the  wheel-rail    contact   and     the  impossibility    of  visualizing     the  rail with
       slippage in the wheel-rail contact and the impossibility of visualizing the rail with the danger that    the   danger    that   this
entails.this
           Furthermore,     concerning the
              entails. Furthermore,              ATP (automatic
                                            concerning        the ATP  train  protection)
                                                                          (automatic          system,
                                                                                          train          the closer
                                                                                                   protection)          the water
                                                                                                                    system,           gets the
                                                                                                                                the closer
to the water
        head of    the  rail, the  easier  it is for   the  train's  ATP   antennas     not   to  be able   to  obtain
                gets to the head of the rail, the easier it is for the train's ATP antennas not to be able to obtain       correct  track
circuitcorrect
          information,     causing
                  track circuit       the train to
                                  information,           brake the
                                                     causing    for train
                                                                     lack ofto obtaining
                                                                               brake for lack the ATP      code. When
                                                                                                    of obtaining       the ATPthe code.
                                                                                                                                   waterWhen
coversthe thewater
              wholecovers
                       head theof the rail,  accurate      ATP   interpretation     is not   possible.
                                    whole head of the rail, accurate ATP interpretation is not possible.
2.4. Integration of the Metro Infrastructure in the Hydrodynamic Model
       2.4. Integration of the Metro Infrastructure in the Hydrodynamic Model
      Water presence in the tunnel and the stations of a Metro system affects the continuity of the service.
             Water presence in the tunnel and the stations of a Metro system affects the continuity of the
Thus, this study represents Metro network components into the hydrodynamic model through the
       service. Thus, this study represents Metro network components into the hydrodynamic model
creation of hydraulic geometry elements, comparable to real infrastructure components, evaluating a
       through the creation of hydraulic geometry elements, comparable to real infrastructure components,
conceivable water entry event into the system, through hydrodynamic modelling. Principal floodwater
       evaluating a conceivable water entry event into the system, through hydrodynamic modelling.
access to the Metro system during extreme precipitation events are the ventilation grates and stations’
       Principal floodwater access to the Metro system during extreme precipitation events are the
entrances, according to TMB and visual inspections carried out by TMB personnel during extreme
       ventilation grates and stations’ entrances, according to TMB and visual inspections carried out by
rainfall events.
       TMB personnel during extreme rainfall events.
      The data required to calculate the flow intercepted at the ventilation grates depends on the
             The data required to calculate the flow intercepted at the ventilation grates depends on the
modelled inlet type. InfoWorks ICM®offers various methods to estimate captured flow by inlets, two
       modelled inlet type. InfoWorks ICM® offers various methods to estimate captured flow by inlets,
of them based on the Federal Highway Administration (FHWA) Urban Drainage Design Manual,
       two of them based on the Federal Highway Administration (FHWA) Urban Drainage Design Manual,
Hydraulic Engineering Circular No. 22 (HEC-22) [44]. This study applies another method, an alternative
       Hydraulic Engineering Circular No. 22 (HEC-22) [44]. This study applies another method, an
to the HEC-22 continuous grate inlet based on the equations from work carried out by Gomez et al. [45]
       alternative to the HEC-22 continuous grate inlet based on the equations from work carried out by
at the Technical University of Catalonia (UPC), implemented in the InfoWorks®ICM software package.
       Gomez et al. [45] at the Technical University of Catalonia (UPC), implemented in the InfoWorks®
      Three-dimensional numerical modelling experimental campaigns [46,47] executed at UPC
       ICM software package.
characterizes Barcelona drainage grates’ hydrodynamic behavior [45,48,49], including physical
             Three-dimensional numerical modelling experimental campaigns [46,47] executed at UPC
obstruction conditions determining hydrodynamic efficiency decrease on partially clogged grated
       characterizes Barcelona drainage grates’ hydrodynamic behavior [45,48,49], including physical
inlets [50]. The ventilation grates as a water inlet use this previous research outcome since the
       obstruction conditions determining hydrodynamic efficiency decrease on partially clogged grated
model integrates hydrodynamic equations representing urban drainage grates, comparable to
       inlets [50]. The ventilation grates as a water inlet use this previous research outcome since the model
ventilation grates.
       integrates hydrodynamic equations representing urban drainage grates, comparable to ventilation
       grates.
             Metro tunnels’ representation in the hydrodynamic model introduces pipes with identical
       dimensions and geometry to the real infrastructure, considering tunnels’ cross-section and elevation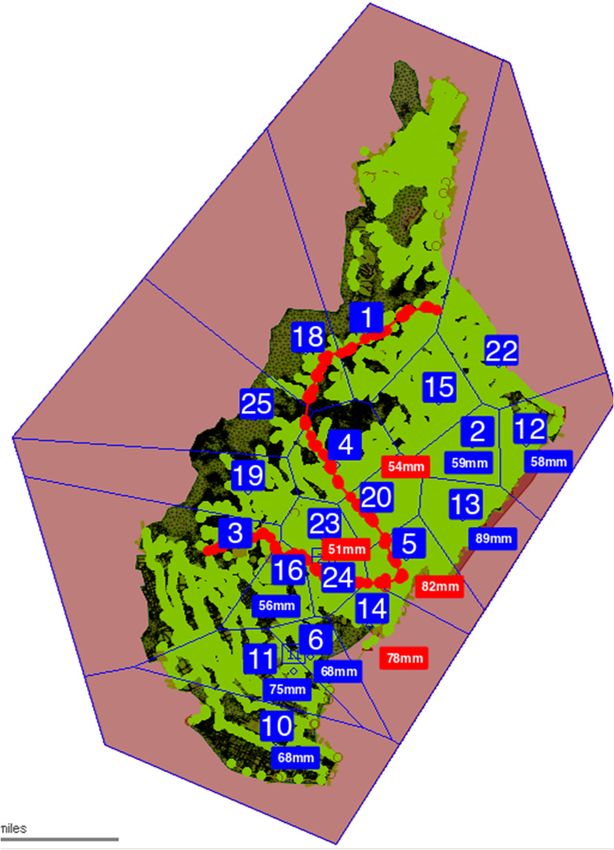
Sustainability 2020, 12, 5291                                                                                  8 of 26

     Metro tunnels’ representation in the hydrodynamic model introduces pipes with identical
dimensions and geometry to the real infrastructure, considering tunnels’ cross-section and elevation
data as Figure 6 shows. Metro network elements’ depiction in the hydrodynamic model process
disregards entrance to service tunnel variability, which simplifies the flood impact analysis on the
      continuous
stations' platform curb-opening
                   and tunnels. inlet typology provides a better representation of Metro station
entrances’ hydrodynamic behavior.

                                (a)                                                  (b)

      Figure 6. (a) Image (up) and essential features (down) of a typical surface grate for ventilation purposes
       Figure 6. (a) Image (up) and essential features (down) of a typical surface grate for ventilation
      in the Barcelona Metro system; (b) Catalunya Metro station cross-section drawing (up); tunnel depiction
       purposes in the Barcelona Metro system; (b) Catalunya Metro station cross-section drawing (up);
      shape in ICM®software (down).
       tunnel depiction shape in ICM® software (down).
     Reaching a proper representation of Metro entrances requires gathering information such as
longitude, altitude, stairs slope, and the elevation difference with the tunnel service, to set the pipe
connecting them. An evaluation and calibration process for different inlet types concludes, in this
case, that the continuous curb-opening inlet typology provides a better representation of Metro station
entrances’ hydrodynamic behavior.

2.5. Calibration and Validation Process
     The calibration process consists of adapting model parameters to achieve correspondence among
simulated flood behavior and recorded or observed flooding. The calibration parameters are listed in
Table 2. This process trains the model concerning selected hydraulic conditions that are compared
with the observed data. Specifically, the computed water levels in both the surroundings of the Metro
stations’ access and the tunnels were validated in this study.
     TMB selects the pluvial flooding event dated 2018-09-06 as a flood event suitable for calibration
purposes in two stations of Line 3 (Paral·lel and Drassanes). Throughout this precipitation, the water
depth in the Metro tunnels of these two stations induced a service disruption, the presence of water
already generates the false occupation phenomenon. Metro operators can remark on how risky it is
to have a station open to possible water flows. However, it is the false occupation that disrupts the
service. With a variable water depth in the tunnel service, although the train can pass through the
station it cannot stop to pick up or drop off passengers, as it is technically incapable of stopping.

                                (a)                                                 (b)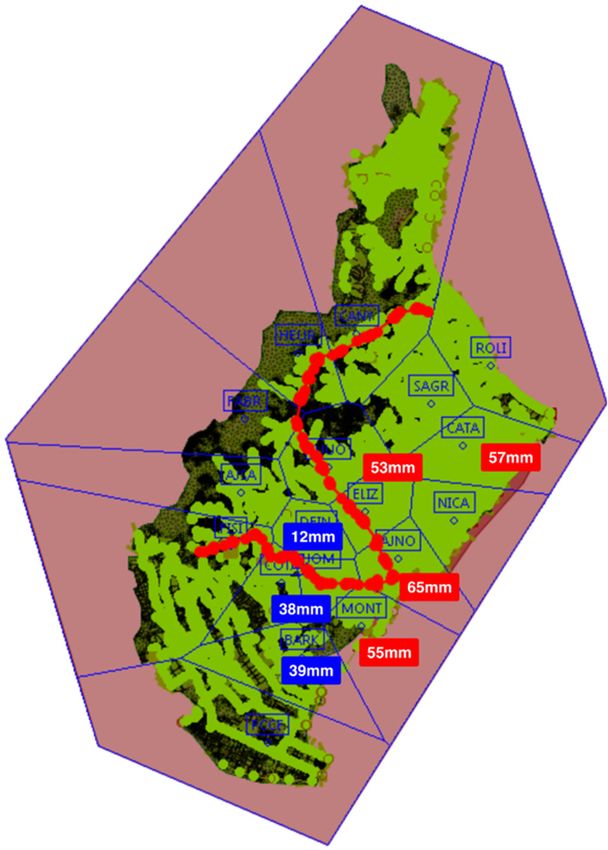
Sustainability 2020, 12, 5291                                                                              9 of 26

        Table 2. Selected calibration parameters of the hydrodynamic model, including calibrated values.

        Model Element            Calibration Parameter           Range (min–max)          Calibrated Value
                                 Pipe roughness—Metro
      Pipes—mains are            accesses and ventilation       0.01–0.2 (Manning's              0.01
    connecting from water                 grates               roughness coefficient
      entries to tunnels,                                              s/m1/3 )
                                 Pipe roughness—Metro
    tunnels representation.                                                                      0.02
                                         tunnels
      Mesh for the 1D/2D         Maximum triangle area             100–10,000 m2              10,000 m2
       coupled model
                                 Minimum element area                5–125 m2                  125 m2

     A calibration method employing a large data sample is not feasible in this model, due to the
water level measurements shortage inside tunnels, hence this study tests to check its performance
in real-world applications after calibration and before practice utilization, as the validation phase.
Validation process applies another recorded surface flood event to ensure that the model acceptably
reproduces recorded results, in this case, the pluvial flooding event dated 2018-08-17. This surface
flooding event affected potential water entry points to the Metro system, but regular Metro service
continued. The water level was not enough for the TMB operators to set the service interruption,
nor was the water accumulated in the tunnels ample for the Metro system's self-protection system to
produce a disruption in service.

2.6. Flood Risk Assessment under the Impact of Climate Change
      One of the most used approaches in assessing the vulnerability of underground mass transport
systems is the identification of the effects of service disruptions [9], giving a primary role to the
ridership flow at Metro stations. Some authors have mainly been interested in questions concerning
risk assessment for Metro stations [51,52] in a holistic manner. Metro system flooding events can lead
to risk conditions involving both ridership and infrastructure, for instance, its impact on passengers'
stability and safety [12,53]. Other authors focus their research on the optimization of evacuation
processes during flood events in underground infrastructure [54–58]. However, this study defines
risk according to the interruption of the Metro service, as a result of rainwater flooding on the urban
transport system.
      The concept of risk used in this research encompasses the combination of hazard and vulnerability.
Hazard is characterized by flooding water depths (as the intensity of the hazard) along the Metro tunnel
related to design storms of different return periods (probability of flooding events). Vulnerability
criterion focuses on the ridership number affected by service interruptions. Therefore, the flood
risk assessment process for Metro stations involves a hazard assessment, following the vulnerability
assessment, and the procedure to obtain the risk data and maps for Barcelona Metro Line 3, as Figure 7
illustrates. For the hazard assessment, one, five, 10, and 20 years return period design storms are
employed as inputs for Barcelona hydrodynamic 1D/2D coupled model for this study.
      These design storms were selected following the recommendations of the municipal operator of the
city drainage system (Barcelona Cicle de l'Aigua, SA—BCASA). The principal criteria for establishing
this hazard estimation is to ensure continuity of Metro services, as the primary concern of the Metro
administrator. One of the operational thresholds which defines Metro service operation is the water
depth within the Metro tunnels. Considering a flood event, after the water depth reaches 0.15 m inside
Metro station tunnels, Depending on the state of the railway road track in front of the train, if there
is false occupation due to water, the train would not reach that circuit because it would stop before
arriving, impacting the entire line service. Through operational experience and based on technical
assumptions with support from TMB, the hazard ranges are defined as follows: water depths between
0 and 0.15 m are defined as low, between 0.15 and 0.30 m as medium, and depths greater than 0.30 m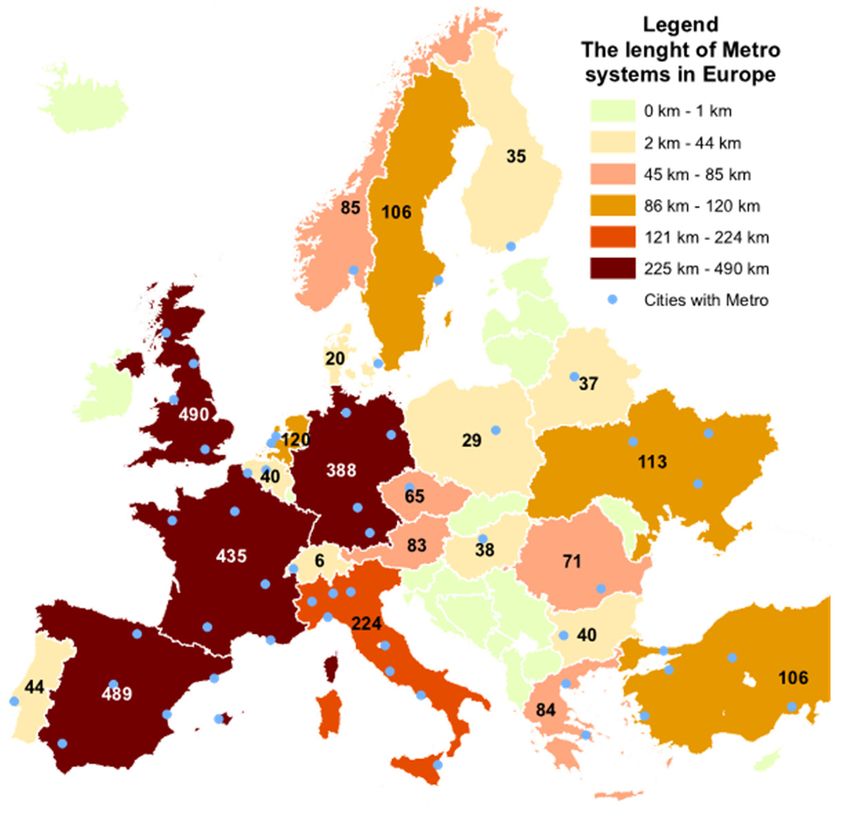
transport system.
      The concept of risk used in this research encompasses the combination of hazard and
vulnerability. Hazard is characterized by flooding water depths (as the intensity of the hazard) along
the Metro tunnel related to design storms of different return periods (probability of flooding events).
Vulnerability criterion focuses on the ridership number affected by service interruptions. Therefore,
Sustainability 2020, 12, 5291                                                                             10 of 26
the flood risk assessment process for Metro stations involves a hazard assessment, following the
vulnerability assessment, and the procedure to obtain the risk data and maps for Barcelona Metro
Linehigh.
are    3, asThese
               Figure    7 illustrates.
                      values            For in
                               are variable thea hazard  assessment,
                                                 real operation      one,
                                                                scheme andfive, 10, and
                                                                            depend       20 track
                                                                                     on the yearscircuit,
                                                                                                  return so
                                                                                                          period
                                                                                                            they
design
are onlystorms
            taken as area employed
                          reference. as inputs for Barcelona hydrodynamic 1D/2D coupled model for this
study.

                       Figure 7. Risk concept definition and datasets required in each stage.
                       Figure 7. Risk concept definition and datasets required in each stage.

     For the vulnerability assessment, registered Line 3 station user entrance data, for every hour in
     These design storms were selected following the recommendations of the municipal operator of
the months November and December 2019, reflect the ridership flow, defining peak hours (18:00–19:00)
the city drainage system (Barcelona Cicle de l'Aigua, SA—BCASA). The principal criteria for
and off-peak hours (12:00–13:00). Vulnerability assessment development uses ridership flows as inputs.
It applies the Jenks natural breaks algorithm as a standard method for dividing a dataset into three
homogenous classes; low, medium, or high. The hazard and vulnerability limits proposal and matrices
are summarized in Table 3. Methods for risk assessment can be qualitative or quantitative, both having
limitations [59]. To defining risk as to the probability or threat to a hazard occurring in a vulnerable
area, flood risk was assessed through a risk map related to a determined scenario and return period
by combining hazard and vulnerability maps. Metro stations and ridership are affected by floods in
Barcelona, and their assessment defines hazard, vulnerability, and risk levels by significance levels
such as "high," "medium," and "low," evaluating the resultant risk level against qualitative criteria.

           Table 3. Hazard and vulnerability criteria for Metro stations service exposed to flooding.

                          Hazard, Depending On            Vulnerability for
                                                                                   Vulnerability for Peak
       Index / Score       Flood Return Periods            Off-Peak Hours
                                                                                   Hours (Ridership Flow)
                              (Water Depth)               (Ridership Flow)
           1 (low)               0–0.15 m                  116–578 users/h              96–591 users/h
        2 (medium)             0.15–0.30 m                 578–1075 users/h            591–1244 users/h
          3 (high)               > 0.30 m                 1075–1516 users/h           1244–2701 users/h

     Hazard range assignment relates to Metro trains’ capacity to operate under tunnel flooding
conditions, considering the maximum water levels for the inundation events and the consequent
service disruption. For the low hazard level defined by floodwater levels between 0 m and 0.15 m,
service continuity disruption starts, and the Metro operation is subject to substantial supervision until
the water level reaches 0.1 m when the service might be disrupted. At the medium hazard level, service
disruption is likely because trains can no longer stop, affecting service availability on affected stations.
High hazard level corresponds to floodwater level exceeding 0.3 m, under this water depth condition,
the rail is likely covered by water, thus services are disrupted and trains cannot ride.
     The creation of risk and vulnerability maps implies multiplying the vulnerability index (1, 2, or 3,
corresponding to the low, medium, and high vulnerability) by the risk index (1, 2, or 3, corresponding
Sustainability 2020, 12, 5291 11 of 26
to the low, medium and high). The total risk ranges from 1 to 9, where higher levels indicate a higher
risk. This approach is compiled in the risk matrix shown in Table 4.
Table 4. The risk matrix for Metro stations and ridership.
Hazard
Vulnerability Low Medium High
Low Low Low Medium
Medium Low Medium High
High Medium High High
The entry of water into the subway system due to surface flooding is since the flood levels are
higher than the elevation of the Metro infrastructure, which allows access to water, e.g., ground
ventilation grates and user entrances to the system. This study identifies these water entry accesses
according to different rainfall conditions. It suggests some non-structural and structural measures [5],
combining both as a successful strategy facing the increased risk of flooding, according to Barcelona
Metro system-specific factors.
3. A Case Study for the Barcelona Metro System
The purpose of this chapter is to present the physical characteristics of the study area, including
a comprehensive summary of the Metro system, the hydrological conditions over the study area,
a comprehensive summary of the rainfall data, and the boundary conditions applied in the integrated
hydrodynamic 1D/2D model.
3.1. Characteristics of the Study Area
Barcelona has a Mediterranean climate, with gentle winters and mild summers. Barcelona soil
cover experienced massive urbanization through the last century. Nowadays, the city land-use is
about 80% of impervious areas and 20% of pervious areas. This morphology causes a brief time
of concentration in catchment areas. As a result, medium and heavy storm events produce quick
stormwater storage in flatland areas, provoking urban flash floods.
3.2. Underground Infrastructure Network: Metro System
Based on TMB confidentiality policies, this research does not offer Metro system details such as
ventilation grates, accesses, tunnel dimensions, incoming water volumes, and ridership flows. The
system runs by one operator (TMB) whose fare integrates into the unified six-zone system created by
the Metropolitan Transport Authority. This research has TMB support, manager of the Metro system as
a benchmark public mobility company in Europe and the world. With 13 lines, consisting of ten Metro
lines, a cable car, a tram and a funicular, with a length of 121.4 km for the entire network, and 160
stations, the Metro network is the second largest conventional Metro network in Spain after Madrid,
and since December 2009, the first with automated lines.
In 2019, 411.95 million passengers used the Barcelona Metro network managed by TMB. Barcelona
Metro Line 3 links Zona Universitària and Trinitat Nova stations along a 17.8-kilometre double-track
stretch with 26 stations underground. Line 3 at the peak hour averages 26 trains with 95 million
passengers being second in terms of ridership volume, reaches a commercial speed of 26.5 km/h, and
uses a rigid catenary system for the power supply and standard track width [60]. Figure 8 reveals
flooding events’ marked concentration on one specific area of Metro stations, which coincides with
the most frequent surface pluvial floods area; during rainfall events, stormwater flow exceeds sewer
pipe capacity.Sustainability 2020, 12, 5291 12 of 26
Sustainability 2019, 11, x FOR PEER REVIEW 12 of 26
(a)
(b)
Figure
Figure 8. 8.
(a)(a) Locationofofthe
Location thestations
stationsononLine
Line33ofofthe
theBarcelona
Barcelona Metro
Metro system;
system; (b)
(b) Barcelona
Barcelona Metro
Metro
stations
stations affected
affected bybyflooding
floodingininthe
thelast
last2020years,
years,the
thelines
linestotowhich
which they
they belong,
belong, and
and the
the number
numberof of
service interruptions due to flooding at stations. The size of the nodes for every affected
service interruptions due to flooding at stations. The size of the nodes for every affected Metro stationMetro station
is proportional
is proportional toto the
the numberofofdisruptions
number disruptionsand andrelated
relatedtotothe
thegeometric
geometricelement.
element.Sustainability 2020, 12, 5291 13 of 26
3.3. Data Acquisition
(a) (b)
As part of the research, a precise record of Barcelona Metro Line 3’s possible water accesses was
obtained based on TMB provided data. Historical flood events confirm surface runoff reaches the
Figure 6. (a) Image (up) and essential features (down) of a typical surface grate for ventilation
Metro purposes
system by inspecific accesses
the Barcelona andsystem;
Metro ventilation grates, set
(b) Catalunya by visual
Metro stationreports authored
cross-section by newspapers,
drawing (up);
also registered and validated by TMB staff. Metro
tunnel depiction shape in ICM® software (down).Line 3 elements’ representation as part of the coupled
1D/2D Barcelona drainage network model considers water flow through Metro station entrances, lifts,
and ventilation grates, as Figure 8 shows. This inclusion allows improving model outcomes, as flow
dynamics description between surface flow and urban drainage improves [61]. Figure 9 indicates the
spatial location of the possible water entry points to Line 3 of the Metro system.
(a) (b)
Figure 9. (a) Integrated Metro elements into the hydrodynamic model, such as possible water entry
points for Barcelona Metro Line 3; (b) schematic representation
1 of the Metro station accesses analyzed
in the study.
3.4. Rainfall Data and Boundary Conditions
The 1D/2D hydrodynamic model boundary conditions consisted of the result of the rainfall-runoff
model (storm water management model based on the non-linear reservoir was chosen among the
options provided by InfoWorks ICM®) applying the rain gauge data and the observed water depth in
the Metro tunnels downstream. The upstream boundary conditions applied in the calibration and
validation phase are two historical rainfall events with surface flooding over Barcelona.
3.4.1. General Rainfall Conditions in Barcelona
The annual average rainfall is 460 mm. The Mediterranean rainfall pattern shows short-duration
high-intensity events and spatial high-variability; 50% of the annual precipitation happens throughout
variable rainfall events [62]. These events, in combination with city morphological characteristics and
impervious areas, produce high flows in the sewer system. All these factors increase urban flood risk in
city flatland areas. Barcelona has rainfall data since 1927 from Fabra Observatory; this long-time data
series allowed the creation of the intensity duration frequency (IDF) curves for the city. Figure 10 shows
new IDF curves based on 81 years data series (1927–1992 and 1995–2009) for some return periods [42].
Intensity values from these IDF curves are currently employed in local sewer network studies.Sustainability 2020, 12, 5291 14 of 26
Sustainability 2019, 11, x FOR PEER REVIEW 14 of 26
Sustainability 2019, 11, x FOR PEER REVIEW 14 of 26
300
Rainfall intensity (mm/h) 250 300
Rainfall intensity (mm/h)
200 250
150 200
100 150
50 100
0 50
00 10 20 30 40 50 60 70 80 90 100 110 120
0 10 20 30 40 50 60 70 80 90 100 110 120
Rainfall duration (min)
T=50 years Rainfall duration (min)
T=10 years T=5 years
T=50 years T=10 years T=5 years
T=1 years 2018-08-17 2018-09-06
T=1 years 2018-08-17 2018-09-06
Figure Intensity duration
10. Intensity duration frequency
frequency (IDF) curves relating return periods (in years) with durations
Figure 10. Intensity duration frequency (IDF) curves relating return periods (in years) with durations
(in minutes) for Barcelona [63].
(in minutes) for Barcelona [63]. Points
Points
Pointswith information
withinformation oftwo
of
information of tworeal
two precipitation
realprecipitation
precipitation events
events
events (2018-09-06,
(2018-09-06,
(2018-09-06,
2018-08-17), to compare them with the IDF curves.
2018-08-17), to compare them with the IDF curves.
3.4.2. Calibration and Validation Data
3.4.2.3.4.2. Calibration
Calibration andand Validation
Validation Data
Data
Two Two
recent rainfall
recent events
rainfall induced
events inducedsurface flooding
surface floodingininBarcelona. One
One ofofthese
theseevents
events(2018-09-
(2018-09-06)
Two recent rainfall events induced surface flooding inBarcelona.
Barcelona. One of these events (2018-09-
caused Metro service disruptions in five stations. Ergo, this study uses this flooding
06) caused Metro service disruptions in five stations. Ergo, this study uses this flooding event event to calibrate
to
06) caused Metro service disruptions in five stations. Ergo, this study uses this flooding event to
the hydrodynamic model considering
calibrate the hydrodynamic a water level
model considering of 0.15
a water m,offor
level which
0.15 m, forservice availability
which service is likely to
availability
calibrate the hydrodynamic model considering a water level of 0.15 m, for which service availability
be affected bytoflooding
is likely in Metro
be affected serviceintunnels.
by flooding Figure tunnels.
Metro service 11 shows calibration,
Figure 11 shows andcalibration,
validationand rainfall
is likely to be rainfall
validation
affectedevents’
by flooding in Metro
hydrological
service
features,
tunnels.
including rain
Figure
gauges’
11 showsarea,
covered
calibration,
Thiessen
and
events’ hydrological features, including rain gauges’ covered area, Thiessen polygon distribution, and
validation rainfall
polygonrainfall events’
distribution, hydrological features,
and cumulative rainfall depth. including rain gauges’ covered area, Thiessen
cumulative depth.
polygon distribution, and cumulative rainfall depth.
(a) (b)
Figure 11. Study area map indicating rain gauges used for rainfall data acquisition process, and the
Figure 11. Study area map indicating rain gauges used for rainfall data acquisition process, and the
cumulative rainfall (mm) for every flooding event. Red dots reveal possible water entry points to
cumulative rainfall (mm) for every flooding event. Red dots reveal possible water entry points to Metro
(a)the Thiessen polygon division for each gauge region (b)
Line 3. Blue lines show (25). (a) Flooding event
for calibration 2018-09-06; (b) flooding event for validation 2018-09-06.
Figure 11. Study area map indicating rain gauges used for rainfall data acquisition process, and the
cumulative rainfall (mm) for every flooding event. Red dots reveal possible water entry points toYou can also read